Cover Page. The handle holds various files of this Leiden University dissertation
|
|
|
- Gwendolyn Pearson
- 5 years ago
- Views:
Transcription

1 Cover Page The handle holds various files of this Leiden University dissertation Author: Wang, Jinxian Title: Trends in social assistance, minimum income benefits and income polarization in an international perspective Issue Date:
2 2 Social assistance and minimum income benefits Benefit levels, replacement rates and policies across 26 OECD countries, ABSTRACT Until recently, social assistance and minimum income benefits have received relatively little attention in the comparative welfare state literature. Relying on two new indicators, this paper examines the developments of minimum income benefits across 26 EU and other OECD countries. The real benefit level, the first indicator, is relatively easy to interpret, but international comparisons require adjustments for exchange rates and purchasing power, which can introduce variation that is not related to underlying policy changes. In the second indicator, the net minimum income replacement rate, this disadvantage is cancelled out by construction. Our analysis shows that real benefit levels increased in most countries, whilst replacement rates declined on average. A subsequent qualitative analysis of the changes of the benefit levels confirms that the increased benefit levels reflect policy changes and that the declined replacement rates do not reflect benefit cuts but relatively larger wage increases. Such a widening gap between benefit levels and wages is in line with a policy agenda of making work pay. Finally, by analyzing to what extent changes in quantitative indicators reflect actual policy changes, this paper seeks to make a methodological contribution to the ongoing debate on the dependent variable problem in the welfare state literature. This chapter is co-authored with Olaf van Vliet and is published as: Wang, J., and Van Vliet, O. (2016). Social assistance and minimum income benefits: Benefit levels, replacement rates and policies across 26 OECD countries, European Journal of Social Security, 3, forthcoming. An extended version appeared as: Wang, J., and Van Vliet, O. (2014). Social assistance and minimum income benefits: Benefit levels, replacement rates and policies across 33 countries, Department of Economics Research Memorandum Leiden University. Earlier versions of this paper were presented at the 21 th International Research Seminar of the Foundation for International Studies on Social Security (2014), the 7 th Pan- European Conference on the European Union (2014), and the InGRID Summer School (2014). We thank all participants and Jonathan Bradshaw, Koen Caminada, Anja Eleveld, Kees Goudswaard, Vytautas Kuokštis, Kenneth Nelson, Peter Saunders, Kea Tijdens, Sarah Marchal, and Chen Wang for useful suggestions and comments.
3 12 Chapter INTRODUCTION For many people, social assistance and minimum income benefit schemes are important welfare state programs. Minimum income benefits function as a last-resort safety net, or as the principal instrument for delivering social protection (Immervoll, 2009). Furthermore, minimum income benefits are closely connected to other welfare state programs, as the exhaustion of eligibility for other transfers, such as unemployment benefits, may lead to the beginning of eligibility for minimum income benefits (Hölsch and Kraus, 2006). Especially with the return of mass unemployment in Europe and other OECD countries and with the cutbacks in first-tire social insurance programs, minimum income protection has become more important as a safeguard against low income and poverty (Marx and Nelson, 2013). Since the welfare state literature pays little attention to social assistance and minimum income benefits compared to other welfare state programs such as labor market policies and pension schemes, relatively little is known about the actual developments in minimum income benefits. A first comprehensive international comparison of social assistance and minimum income benefits was employed by Eardley et al. (1996). These authors provide an extensive qualitative and quantitative analysis of the benefit developments across 22 OECD countries between 1980 and During the heydays of the comparative welfare state literature, the second half of the 1990s and the early 2000s, not much attention was paid to social assistance and minimum income benefits. One explanation for this lack of attention might be that data on other welfare state programs, most notably social expenditure data provided by the OECD, were relatively easily available, whereas data on social assistance and minimum income benefits were not. This period came to an end in 2006, when Nelson published the first version of the Social Assistance and Minimum Income Protection Dataset. More recently, Van Mechelen et al. (2011) published the CSB-Minimum Income Protection Indicators Dataset. In this paper, we first provide new empirical insights into the developments of minimum income benefit levels across 14 Western European countries, 5 Central and Eastern European countries and 7 non-eu OECD countries between 1990 and Relying on data from the Social Assistance and Minimum Income Protection Dataset (Nelson, 2013), we construct two indicators, namely real minimum income benefit levels and minimum income replacement rates. These data have been analyzed in earlier studies (Nelson, 2008, 2010), but not 1 In total, the study includes 19 EU countries (Austria, Belgium, Czech Republic, Denmark, Estonia, Finland, France, Germany, Hungary, Ireland, Italy, Luxembourg, Netherlands, Poland, Portugal, Spain, Sweden, Slovakia, the United Kingdom) and 7 other OECD countries (Australia, Canada, Japan, New Zealand, Norway, Switzerland, and the United States). Greece is not included because it does not have a nation-wide safety net (Nelson, 2013; OECD, 2009).
4 Social assistance and minimum income benefits 13 with these two indicators. Hence, the first contribution of this paper is that we construct and examine two new indicators of minimum income benefits. We focus on the minimum income benefit package, which contains mainly social assistance benefits but also other allowances, such as child supplements and tax credits. The advantage of using the real benefit level is that it is relatively easy to interpret, as it is just the annual amount of cash benefits. However, comparing benefit levels across countries necessitates making adjustments for exchange rates and purchasing power. These adjustments can introduce variation in the benefit levels over time that is not related to any underlying policy changes. In the second indicator that we use, the minimum income replacement rate, this disadvantage is cancelled out by construction. In addition, the advantage of the replacement rate is that it is a state-of-the-art welfare state indicator. Hence, with replacement rates, minimum income benefits can be compared with other welfare state programs such as unemployment benefits. With respect to Van Mechelen and Marchal s (2013) study, based on the CSB-Minimum Income Protection Indicators Dataset, we extend the analysis to 26 countries and to annual data for the period More generally, the validity of social policy indicators is part of a broader debate in the comparative welfare state literature on how to theoretically conceptualize, operationalize and measure welfare state programs, which is known as the dependent variable problem (Clasen and Siegel, 2007; Green- Pedersen, 2004; Kvist et al., 2013; Van Oorschot, 2013). Relying on a qualitative decomposition approach, we examine to what extent changes in internationally comparable minimum income benefits are determined by changes in social assistance policies, child benefit policies and other factors. As such, this paper contributes to the dependent variable problem debate by analyzing to what extent changes in quantitative indicators actually reflect changes in social policies. 2.2 DEVELOPMENTS IN MINIMUM INCOME BENEFITS Drivers of the benefit developments Changes in minimum income benefit schemes are triggered by and subject to country and time-specific socio-economic challenges, political developments and institutions. As some of these challenges and developments are comparable across countries, minimum income benefits may follow comparable reform trajectories. Most recently, it has been argued by several welfare state scholars that the increased focus on activation and social investment policies has put pressure on the adequacy of minimum income protection in many European countries (Cantillon, 2011; Paetzold and Van Vliet, 2014; Vandenbroucke and Vleminckx, 2011). Stricter eligibility conditions would make minimum income benefits less accessible. Moreover, the increased focus on activation could lead
5 14 Chapter 2 to crowding-out effects, as higher expenditures on activation programs would put pressure on the budgets for minimum income benefits and other redistributive welfare state programs. Crowding-out effects might also be caused by ageing populations, as increased spending on pensions and healthcare might result in smaller budgets for other welfare state programs, such as minimum income benefits. Furthermore, the generosity of minimum income benefits might be affected by the pressure stemming from globalization. Increased international trade and capital mobility trigger competition between governments on tax rates and social contributions, leading to smaller budgets for welfare state programs (Swank, 2002). In addition to the factors that put pressure on minimum income benefit levels, there is also a factor that could have a positive impact on benefit levels. Since the beginning of the 2000s, the attention for poverty reduction has been increased across European countries (Nelson, 2012). Most notably, in 2000 the European Council adopted the Lisbon Strategy. An important objective of this strategy is to reduce poverty and to enhance social inclusion. Since social assistance benefits form a primary tool for poverty reduction, it might be expected that the Lisbon Strategy has had a positive impact on the social assistance and minimum income benefit levels across European countries. Since EU and other OECD countries are exposed to comparable challenges and developments an increased focus on activation and social investment, ageing populations, globalization, EU policy agendas converging patterns of minimum income might be expected. In the welfare state literature, considerable attention has been paid to convergence analyses of a broad range of welfare state programs (Starke et al., 2008). Caminada et al. (2010) show that social assistance benefit replacement rates diverged across European countries between 1992 and Nelson (2010) shows a divergent trend of social assistance benefit levels between 1990 and Yet, it is as an empirical question how social assistance and minimum income benefits have evolved after To date, it seems as if the socio-economic developments described above have not led to major retrenchments, reforms or benefit cuts regarding minimum income benefit schemes across OECD countries. In this respect, Van Mechelen and Marchal (2013) argue that the evolution of minimum income benefits can be characterized as politics of non-intervention. In this type of politics, governments neither reduce nor increase nominal benefit levels. As a result of not (fully) indexing benefit levels, the value of minimum income benefits relative to prices or wages deteriorates. Such a widening gap between 2 The study is focused on the period as this is the period for which most data are available. In addition, the developments and policy reforms during the financial crisis would require a separate analysis, which is beyond the scope of this paper.
6 Social assistance and minimum income benefits 15 benefit levels and wages is in line with a policy agenda of making work pay, aimed at increasing employment levels Indexation of the benefit levels The benefit level is usually a function of the household composition and these levels vary considerably across countries, as will be shown in the next sections. For the developments of the benefit levels over time, it is important whether, and if so, when and how indexation is applied (Viet-Wilson, 1998). As shown in Table 2.1, in most countries a form of indexation is applied to social assistance benefits. However, in countries like Estonia and Slovakia, no automatic indexation exists and benefits are adjusted by discrete government decision. In the countries where benefits are adjusted automatically, benefit levels are mainly linked to consumer prices. In other countries, benefit levels are linked to the developments in pension benefits or wages. Table 2.1 Indexation of social assistance benefits Indexation of social assistance benefits Regular adjustment mainly based on price levels Regular adjustment mainly based on pensions Regular adjustment mainly based on wage No regular or automatic adjustment Others Source: European Commission (2009) and Van Mechelen and Marchal (2013). Country Australia, Belgium, Czech Republic, France, Luxembourg, New Zealand, Norway, Poland, Switzerland, the United Kingdom. Austria, Finland, Germany, Hungary, Italy, Portugal. Denmark, the Netherlands. Estonia, Ireland, Slovakia. Spain, Sweden. 2.3 THE DEPENDENT VARIABLE PROBLEM A key question in the comparative welfare state literature is how to theoretically conceptualize, operationalize, and measure welfare states and welfare state changes (Clasen and Siegel, 2007; Esping-Andersen, 1990; Green-Pedersen, 2004; Van Oorschot, 2013). This so-called dependent variable problem has both a theoretical and a methodological component. In this paper, we zoom in at a part of the methodological component, proposing and analyzing indicators for the comparison of minimum income benefit levels across a large number of countries and years. Many empirical studies have relied on social expenditure data, but these are not available for minimum income benefits. Moreover, a limitation of this type of indicators is that changes in social expenditures do not only reflect policy changes, but also changes in the number of beneficiaries (Jensen, 2011). Subsequently, comparative studies of welfare state programs have increasingly turned to the use of social right indicators, such as income replacement rates. These studies are mainly focused on inter-
7 16 Chapter 2 national comparative analyses of unemployment benefits, sick pay benefits and pension benefits (e.g. Allan and Scruggs, 2004; Hicks and Freeman, 2009; Korpi and Palme, 2003; Scruggs et al., 2014; Van Vliet and Caminada, 2012). Much less attention has been paid to the international comparative analysis of minimum income benefits (Marchal et al., 2011; Nelson, 2008). As a first contribution to the debate on the dependent variable problem, we propose and analyze two types of quantitative indicators of minimum income benefits, namely the level of minimum income benefits and the net minimum income replacement rates. The benefit level is a relatively straightforward measure of (one dimension of) the generosity of minimum income benefits (Olaskoaga et al., 2013). The minimum income replacement rate, on the other hand, gives an impression of the benefit generosity relative to labor income. 3 As a second contribution, we provide insight into the question to what extent the benefit level indicator, which is constructed for international comparisons, reflects policy changes. 2.4 DATA AND METHOD Real net minimum income benefit levels To construct the indicator of real minimum income benefits, our study relies on data from the Social Assistance and Minimum Income Protection Dataset (Nelson, 2013). This dataset contains annual data on benefit levels for a fairly large number of industrialized countries. The institutional information in the dataset is based on national sources and legislation. The dataset contains disaggregated data on several income components. Following Nelson (2013), we define net minimum income benefits as the net income from a benefit package consisting of basic social assistance, child supplements, refundable tax credits, and other benefits. One-time social assistance payments to cover unexpected and urgent needs or regular supplements to cover exceptional needs are not included in this benefit package. 4 In order to compare benefit levels across countries and over time, we transfer all benefit levels into U.S. dollars, adjusted for purchasing power (PPP) and inflation (CPI 2005 = 100). Data on PPP are taken from the Penn World Table (Heston et al., 2012) and for the CPI we rely on data from the World Bank 3 Clearly, the benefit level is only one dimension of generosity. Other relevant aspects are for instance the benefit coverage and conditionality. Avram (2009) has constructed five extensiveness indicators to measure the generosity of social assistance benefits across 26 countries for the year Data for a longer period are not available. 4 Ideally, we would include other social programs as well, because the links between social assistance benefit schemes and other social programs are highly relevant for calculating minimum income benefit levels. However, our possibilities are bounded by the data availability.
8 Social assistance and minimum income benefits 17 (2012). 5 For the Eurozone countries, the real benefit levels are calculated as follows: real minimum income benefit = ((minimum income benefit/exchange rate from euro to national currency)/ppp)*(100/cpi) For the non-eurozone countries, the real benefit level = (minimum income benefit/ppp)*(100/cpi). Another component that could be included in the calculation of the net minimum income benefit package is housing benefits. In many countries, housing benefits depend on actual housing costs. As the actual housing costs vary strongly across regions within countries, the inclusion of housing benefits in the calculated benefit package requires demanding assumptions on the housing costs. 6 Consequently, the assumptions regarding the housing costs strongly determine the calculated housing benefits and so the calculated net minimum income benefit levels (Eardley et al., 1996; Kuivalainen, 2003). 7 Since we are primarily interested in the evolution of social assistance benefits in this study, we do not include housing benefits in the benefit package. The consequence of this choice is that our indicators underestimate the minimum income, but the advantage is that our indicators give a clearer indication of the developments of social assistance benefits. An additional advantage of not including housing benefits in the minimum income benefit package is that this benefit package is comparable to the benefit package used in studies on unemployment benefits. Hence, our minimum income benefit replacement rates, discussed below, are comparable to unemployment benefit replacement rates (Scruggs et al., 2014; Van Vliet and Caminada, 2012). 8 5 An additional step is required for the Eurozone countries, as the PPPs in the years before the introduction of the euro are also expressed in euros, whereas the benefit levels are expressed in the national currencies. To convert the national currencies into euros, the study relies on exchange rate data from the European Commission (2014). 6 Regarding these housing costs, three approaches can be found in the literature (Van Mechelen et al., 2011). 7 For instance, in the CBS-MIPI dataset it is assumed that the rental costs for social assistance recipients amount two thirds of the median rental costs paid by households in the respective country. For Belgium, this results in a rent of 237 euro (PPP) for In contrast, in OECDdata housing costs are assumed to amount 20 percent of the average wage, resulting in a rent of 596 euro (PPP) for Belgium in 2008 (Van Mechelen et al., 2011). 8 To examine the sensitivity of the developments in minimum income benefit package for the inclusion of housing benefits, we analyzed net minimum income benefit levels including housing benefits (Appendix 2B). These benefit levels are higher than the benefit levels without housing benefits, but for all countries but Sweden, the developments between 1990 and 2009 are comparable for both types of indicators.
9 18 Chapter Net minimum income replacement rates Adjustments of the benefit levels for exchange rates and purchasing power are needed in order to get a meaningful indicator for comparing benefit levels across countries. However, a disadvantage of these adjustments is that changes in exchange rates and purchasing power over time can introduce substantively less interesting variation over time in the benefit levels. This disadvantage does not apply to our second indicator, the net minimum income replacement rate, which is defined as the ratio of net minimum income benefits to the net average production wage. For the replacement rate, we neither adjust the nominator nor the denominator for exchange rates, purchasing power, or inflation, as these adjustments would be cancelled out in the ratio. The net average production worker wage refers to the in-work wage after deducting taxes. Data on minimum income benefits are taken from the Social Assistance and Minimum Income Protection Dataset (Nelson, 2013). For the average production worker wage, we use data from the OECD and Van Vliet and Caminada (2012). Due to data availability, we construct the indicators of real minimum income benefits and minimum income replacement rates annually across 26 countries for the period It should be noted that in most cases, minimum income replacement rates do not indicate the fraction of the income from work that is actually replaced by income transfer programs, as is for instance the case for unemployment benefit replacement rates. The reason for this difference is that unemployed workers often receive unemployment benefits first before they are entitled to minimum income benefits. Hence, minimum income benefit replacement rates and unemployment benefit replacement rates are the same type of ratios as they share the same denominator, but the meaning of the term replacement rate is slightly different. Although benefit levels and replacement rates can be seen as useful measures to compare social rights across countries and over time, they have a number of limitations too, as has been discussed in the welfare state literature (Danforth and Stephens, 2013; Ferrarini et al., 2013; Whiteford, 1995). Interestingly, some of these limitations do not seem to apply to minimum income benefit indicators as much as they apply to other social security programs. A first limitation is that it is often difficult to capture the duration of benefit programs. Arguably, this issue is less relevant for minimum income benefits than for unemployment benefits, as there is often no maximum duration for minimum income benefits, whereas in many countries the duration of unemployment benefits is maximized. Similarly, minimum income benefit levels are in absence of policy reforms usually constant over time, whereas for instance unemployment benefit levels can vary over the unemployment spell of an individual. Furthermore, minimum income benefit levels are usually not related to previously earned income, whereas unemployment benefits are. An important limitation of benefit levels and replacement rates, that applies
10 Social assistance and minimum income benefits 19 as much to minimum income benefits as to other welfare state programs, is that they do not account for variation in institutional characteristics, such as eligibility conditions, work requirements and benefit sanctions (Eleveld, 2014; Lødemel and Trickey, 2001; Moreira and Lødemel, 2014; Vonk, 2014). 2.5 DEVELOPMENT OF MINIMUM INCOME BENEFITS AND MINIMUM INCOME REPLACEMENT RATES Minimum income benefits Table 2.2 presents the developments of the levels of the annual net minimum income benefits over the period The data presented are averages of the benefit levels for the three household types: single persons, lone parents with two children and two parents with two children. All benefit levels are expressed in U.S. dollars, adjusted for inflation (CPI 2005=100) and PPP. In Table 2.2, the OECD countries are classified into welfare state regimes. Since Esping-Adersen s (1990) seminal work, there has been a lively debate in the welfare state literature on how to classify welfare states (see Arts and Gelissen (2006) for an excellent overview of this literature). In recent contributions, scholars have found some common ground (Draxler and Van Vliet, 2010; Fenger, 2007; Sapir, 2006). Based on these contributions, we distinguish five types of welfare regimes, namely the Anglo-Saxon, the Continental European, the Nordic European, the Southern European and the Central and Eastern European countries. The daa show that real minimum income benefit levels vary substantially across countries. In 2009, the highest benefit levels can be observed in Luxembourg, Japan and Denmark. Estonia, Slovakia and Czech Republic, on the other hand, are the countries with the lowest benefit levels in On average, the Continental European countries and Southern European countries had much higher benefit levels than the Central and Eastern European countries. For instance, in 2009, the Continental European countries had an average benefit level of 14,651 U.S. dollars. In contrast, the Central and Eastern European countries had a benefit level of only 4,005 U.S. dollars on average. Furthermore, the data show that there is considerable variation over time. In most countries, real benefit levels have been increased between 1990 and That implies that the benefit levels increased more than the consumer prices, which is the basis for indexation in most countries, as shown in Table 2.1. The countries with the largest increases are Luxembourg and Japan. In contrast, there are also several countries which reduced their benefit levels between 1990 and In particular, Central and Eastern European countries had relatively high benefit levels during the 1990s and they reduced the benefit levels thereafter. The sharpest decrease took place in Hungary between 1990 and 2000, although the benefit levels started to increase in the new millennium
11 20 Chapter 2 again. Such a U-turn can be observed in more countries, such as Italy and Sweden. On average, the Continental European countries observed the largest increases in the real minimum income benefit levels over Only the Central and Eastern European countries saw decreases but the decreases occurred mainly before In fact, all countries in the Continental European country group have increased their benefit levels while the benefit levels decreased in all Central and Eastern European countries. These divergent trends suggest that the developments in minimum income benefit schemes are driven by different degrees of prevalence of and exposure to socio-economic drivers, such as globalization, ageing populations and political attention for activation and social investment. Furthermore, the data show that the developments in minimum income benefits are not welfare-regime specific, as the development also vary considerably within country groups. The standard deviation and the coefficient of variation give an indication of the dispersion of the benefit levels across countries. Interestingly, we do not observe a trend of convergence of the benefit levels across countries and over time, not even within country groups. These statistical yardsticks indicate that the dispersion of the benefit levels increased in all country groups except for the group of Central and Eastern European countries between 1990 and For the broader 26 OECD countries, the standard deviation and the coefficient of variation increased over time. Overall, this suggests that minimum income benefit levels are diverged rather than converged over time.
12 Social assistance and minimum income benefits 21 Table 2.2 Real annual minimum income benefit levels change Anglo-Saxon countries Australia 12,231 13,524 13,870 16,163 16,874 4,643 Canada 16,311 16,323 13,072 12,851 13,924-2,387 Ireland 11,434 10,889 10,680 12,986 17,680 6,246 New Zealand 10,096 9,709 9,736 10,854 11,417 1,321 United States 9,623 8,920 7,956 7,805 7,497-2,126 United Kingdom 9,006 9,032 10,341 11,413 13,001 3,994 Mean 11,450 11,400 10,943 12,012 13,399 1,948 Standard deviation 2,660 2,954 2,187 2,767 3,731 1,071 Coefficient of variation Continental European countries Austria 10,545 11,484 11,311 11,601 12,398 1,853 Belgium 12,452 13,696 12,811 13,261 14,861 2,408 France 7,195 7,796 8,474 8,721 9,090 1,895 Germany 9,239 9,767 9,640 11,724 11,998 2,760 Luxembourg 13,877 20,275 19,422 21,977 27,923 14,047 Switzerland 11,145 11,219 12,654 11,497 11, Mean 10,742 12,373 12,385 13,130 14,651 3,909 Standard deviation 2,358 4,337 3,841 4,576 6,758 4,400 Coefficient of variation NordicEuropean countries Denmark 10,806 15,777 16,594 17,955 18,247 7,441 Finland 13,158 10,698 9,548 10,192 10,263-2,895 Netherlands 14,723 16,572 14,998 14,841 17,179 2,456 Norway 9,250 11,821 13,938 13,507 12,819 3,570 Sweden 11,081 10,068 8,756 9,468 9,775-1,306 Mean 11,804 12,987 12,767 13,193 13,657 1,853 Standard deviation 2,145 2,990 3,444 3,478 3,898 1,753 Coefficient of variation Southern European countries Italy 19,735 11,223 13,096 14,882 17,092-2,643 Portugal. 5,226 5,542 6,071 6,787. Spain 16,153 8,870 7,643 7,786 8,134-8,019 Mean. 8,440 8,760 9,580 10,671. Standard deviation. 3,021 3,899 4,671 5,601. Coefficient of variation Central and Eastern European countries Czech Republic 9,160 8,120 6,310 6,967 4,234-4,925 Estonia. 3,160 2,145 2,555 2,604. Hungary 15,898 9,188 3,220 2,889 4,399-11,499 Poland. 7,650 4,976 4,875 4,818. Slovakia 7,917 5,250 4,285 2,742 3,971-3,947 Mean. 6,673 4,187 4,006 4,005. Standard deviation. 2,436 1,600 1, Coefficient of variation Others Japan 11,174 12,403 13,671 16,659 18,643 7,469 Mean - all. 10,718 10,180 10,856 11,818. Standard deviation - all. 3,798 4,241 4,854 5,865. Coefficient of variation - all Note: Net benefits per year in US dollars, corrected for inflation (2005=100) and PPP; simple average of minimum income benefits of three household types: single person, lone parents with two children and two parents with two children. Data years are around 1990 (Germany, 1991; Hungary, 1992; Czech Republic, Slovakia, 1993), and around 1995 (Portugal, 1996).
13 22 Chapter Minimum income replacement rates Table 2.3 presents the developments of the net minimum income replacement rates (averages for the three household types) between 1990 and As is the case for benefit levels, there is considerable variation in replacement rates across countries. The countries with the highest replacement rates are Luxembourg, Italy and Denmark in The lowest replacement rates can be found in the United States and Estonia in This picture is largely in line with the picture of the benefit levels. However, the ranking of the replacement rates does not completely correspond to the ranking of the benefit levels. For instance, Australia, Canada, the United Kingdom and Germany had aboveaverage benefit levels of the 26 OECD countries, whist they had below-average replacement rates in On contrary, Portugal and Hungary had benefit levels lower than the average of the 26 OECD countries but their replacement rates were above the average in On average, in 2009 the Southern European countries had the highest replacement rates of 50 percent while the Central and Eastern European countries had the lowest replacement rates of less than 40 percent. Between 1990 and 2009, replacement rates decreased in 15 out of the 26 OECD countries over the observed period. The countries with the largest decreases are Czech Republic, Slovakia and Sweden. Compared to these decreases, the magnitude of the increases in the countries where the replacement rates increased are small. Only the replacement rate of Luxembourg shows a relatively large increase. Moreover, in each country group, we can find both increases and decreases of the replacement rates and no consistent trends can be found across countries. For a number of countries, the real benefit levels and the replacement rates show parallel developments. For example, in Canada, Finland and Spain, both indicators declined and in Denmark, Germany and the United Kingdom both indicators increased. In other countries indicators show opposite developments. In Australia, France and the Netherlands for instance, real benefit levels increased, whereas replacement rates decreased. Interestingly, this is also the case for the average trends of the Anglo-Saxon, Nordic and the whole 26 OECD countries. Between 1990 and 2009, the real benefit levels increased on average, whilst the replacement rates decreased on average. Taken together, these trends indicate that even when the minimum income benefit levels increased in real terms, replacement rates could decrease when wages increased even more. Indeed, Table 2.1 shows that benefit levels are indexed to wage developments in only a few countries. In addition, Table 2.1 shows that in Denmark and the Netherlands, the benefit levels are adjusted mainly based on wage developments. However, Table 2.3 indicates that while the minimum income replacement rate increased in Denmark between 1990 and 2009, it decreased in Netherlands. Finally, the standard deviation increased in all country groups except in the Anglo-Saxon and Central and Eastern European countries. The coefficient
14 Social assistance and minimum income benefits 23 of variation increased in all country groups. In line with the trends of the benefit levels, these trends indicate that the dispersion of minimum income replacement rates has not narrowed over time and that the replacement rates are diverging. This finding indicates that the divergence of social assistance benefit replacement rates during the 1990s, as shown by Caminada et al. (2010), has continued during the 2000s.
15 24 Chapter 2
16 Social assistance and minimum income benefits DECOMPOSING THE CHANGES IN REAL MINIMUM INCOME BENEFIT LEVELS To compare minimum income benefits across countries and over time, we constructed real net benefits by applying a number of transformations to national minimum income benefit levels. More specifically, two types of transformations have been applied. First, in addition to social assistance benefits, other income components are included, namely child supplements, refundable tax credits, and a category of other benefits. Second, benefit levels are adjusted for a number of financial factors, being exchange rates, purchasing power parity (PPP) and inflation (CPI). As a result of these transformations, the changes in the real net benefit levels over time do not only reflect policy change, they may also reflect changes in other programs and changes in financial factors. The aim of the following qualitative decomposition analyses is to examine to what extent the changes in the real net benefit levels reflect policy changes in social assistance benefit programs, changes in other programs, or changes in financial factors. The qualitative decomposition analyses proceed as follows. First, the relatively large annual changes in real minimum income benefit levels were selected, that is, changes larger than 5 percent. Then annual changes in the real minimum income benefit levels are decomposed into the different steps that were taken to transform the nominal minimum income benefit level to the final real net minimum income benefit level expressed in U.S. dollars. Here, we can trace the size of these steps, in order to find out whether a change in an income component is larger than the effect of a change in a financial factor. Subsequently, we have studied policy documents to analyze whether changes in the income components of the minimum income benefit indicator can be related to policy changes. Then, we also checked whether we could find policy changes that were not identified by large changes in benefit levels, because leaving out these policy changes would overestimate the link between benefits and policies. 9 After these steps, we are quite confident that we included the bulk of the relevant policy changes. 9 We include a number of cases for which the annual change is slightly smaller than 5 percent, but where the changes are clearly related to policy changes: Australia (1991), Austria (1993, 2006), Denmark (1998), Portugal (2006) and the United Kingdom (2003, 2004). However, not all policy changes that result in changes in real minimum income benefit levels are listed in this paper. Other studies focusing on social assistance and minimum income benefit policy changes include Barcevièius et al. (2014a), Lødemel and Moreira (2014).
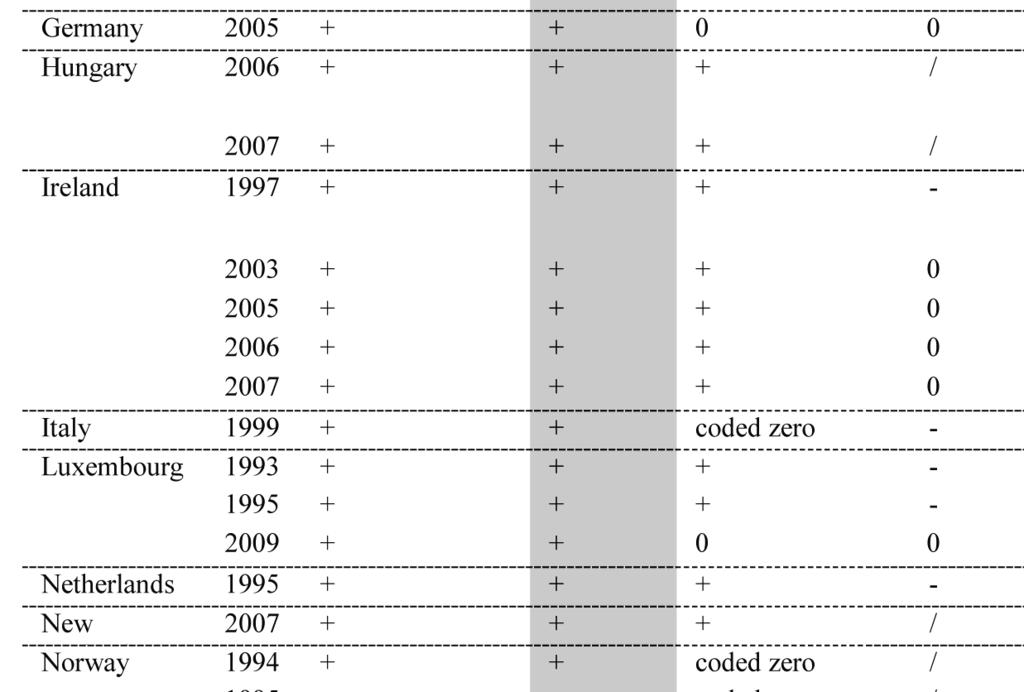
17 26 Chapter Changes in social assistance benefits Table 2.4 presents the decomposition 10 of the changes in the real minimum income benefits, starting with the increases. 11 Each increase in the minimum income benefit level is the result of changes in a number of factors, but the increases presented in this table are mainly the result of increases in the social assistance benefit level. For instance, the increase in the minimum income benefit level in Ireland mainly reflects a substantial increase in the social assistance benefit level. In addition to that, child supplements were also increased and the PPP and CPI changed as well, but these changes are smaller than increase in the social assistance benefit level. As shown in the table, many increases in the net minimum income benefit levels reflect policy changes that increased the social assistance benefit levels and these policy changes take different forms. In Austria for instance, the monthly social assistance benefit rate was simply increased substantially in In Belgium, social assistance benefits were linked to the standards of living since 2009 and in Hungary, social assistance was set at the net level of the minimum wage in 2007, which led to a substantial increase of the benefit level. The lower part of Table 2.4 presents the major decreases in the minimum income benefits stemming from decreases in the social assistance benefits. In Poland for instance, a change in the system in 2001 resulted in lower benefit levels and the Czech Republic introduced lower social assistance benefit levels for long-term inactive citizens in Clearly, the list of benefit reductions is shorter than the list of benefit increases, as the benefit levels increased on average between 1990 and Interestingly, reductions of social assistance benefit levels were usually combined with institutional changes such as more stringent eligibility criteria or more incentives to participate in active labor market programs. For example, in Canada more stringent eligibility criteria and administrative controls like fraud prevention and detection have become the norm from 1996 onwards. In Switzerland, new guidelines to promote better integration into society and the labor market were introduced in In addition, harsher penalties for the abuse of social assistance benefits were recommended. Finally, although social assistance benefits are usually not bound to a maximum duration, there can be a maximum duration of complementary programs. In the United States for instance, the eligibility for Food Stamps was limited to a maximum of three months. 10 A more comprehensive version of this table is included in Appendix 2C. 11 Two components of the benefit package, refundable tax credits and other benefits, are not included in the tables of the decomposition analyses, because they only apply to Canada and the United Kingdom. These components do not explain much of the changes in minimum income benefit schemes for these countries.


18 Social assistance and minimum income benefits 27

.")
19 28 Chapter Changes in child supplements and financial factors From Table 2.4 we can see that in most countries child supplements increased a bit or remained the same in years where we observe large changes in real minimum income benefits, but that the changes in the social assistance benefits are predominantly responsible for the changes in minimum income benefits. 12 However, there are some cases where the changes in child supplements are actually the main driver for changes in the benefit package (see Table 2.5). For example, in 2004, the weekly child benefit rate in the United Kingdom was GBP for the eldest child and GBP for each other child. In 2005, the benefit rate decreased to GBP for the eldest child and to GBP for each other child, resulting in a substantial decrease in minimum income benefits in Finally, Appendix 2E presents the changes in the minimum income benefit levels that are mainly stemming from changes in the financial factors. First, these data suggest that inflation has reduced the real value of social assistance benefits in a number of countries. A second observation is that in a number of cases the adjustments for PPP and exchange rates may introduce variation that is unrelated to policy changes or inflation. However, when we take the information from Table 2.4, Table 2.5 and Appendix 2E together, it appears that this is the case in a relatively small number of cases. In the majority of the cases, changes in benefit levels can be traced back to policy changes. 12 A more comprehensive version of this table is included in Appendix 2D.
20 Social assistance and minimum income benefits CONCLUSIONS This paper explores the developments of social assistance and minimum income benefits across 26 EU and other OECD countries. Analyzing real minimum income benefit levels, a first result of this study is that the data show that the real benefit levels increased in the majority of the countries between 1990 and In most countries benefit levels are indexed to consumer prices, but the data show that the benefit levels increased actually more than the consumer prices. Indeed, a decomposition of the changes in the benefit levels learns that the bulk of the increases reflect deliberate policy changes of either social assistance benefit schemes or complementary policies such as child supplements. A second result of this study is that there is considerable variation in minimum income replacement rates and in the developments of replacement rates across countries and over time. In some countries, net minimum income benefits increased in real terms, but replacement rates decreased between 1990 and 2009, indicating that the increases in benefit levels did not keep up with the wage developments. Indeed, benefit levels are indexed to wages in only a few countries. Furthermore, also deliberate policy changes, as shown in the decomposition analysis, do not keep the developments of the benefit levels in line with the wage developments. Such a widening gap between social assistance benefits and average wages might increase inequality between the lowest and the average income groups. However, no large retrenchments, reforms or benefit cuts with respect to minimum income benefits have taken place across the OECD countries. This is an interesting observation, given the major reforms and retrenchments in other welfare state programs such as unemployment benefits and disability benefits over the past decades. This lack of major reforms might be an explanation for the limited attention for minimum income benefits in the welfare state literature. Instead of major reforms, the decreasing replacement rates in many countries suggest that policy-making in the case of minimum income benefits can be characterized as politics of non-intervention (Van Mechelen and Marchal, 2013). Even though substantial benefit cuts are absent, not keeping the benefits in line with the wage developments is also a policy decision. Such policy decisions would be in line with a making work pay agenda, aimed at increasing employment levels. Third, we analyze to what extent minimum income benefits converged across the countries. For both the real benefit levels and the replacement rates, the data indicate that minimum income benefits did not converge between 1990 and The variation across countries actually increased over time, indicating that minimum income benefit levels diverged instead. This divergent trend is in line with earlier divergent trends in social assistance benefits (Caminada et al., 2010; Nelson, 2010). However, further convergence analyses
21 30 Chapter 2 are needed, as it might be possible that underlying patterns of convergence become visible once conditional factors are taken into account. From a methodological viewpoint, this paper also aims to make a contribution to the debate on the dependent variable problem regarding the selection of indicators for the measurement of welfare state changes in an international comparative setting. That is, we analyze to what extent changes in quantitative indicators reflect actual policy changes. A decomposition of the annual changes in real benefit levels indicates that in the majority of the cases the changes reflect policy changes. More specifically, most of the changes in real benefit levels can be linked directly to policy changes that stipulate changes in social assistance benefit levels or child supplements. In a relatively small number of cases, the annual changes in benefit levels are the result of changes in exchange rates or PPP, indicators that are used to construct internationally comparable indicators. In this respect, it should be noted that by design, these effects are cancelled out in replacements rates. Finally, this analysis has shown the developments of minimum income benefits relative to consumer prices and wages during the 1990s and 2000s. The economic crisis and the policy responses to this crisis have affected benefit levels, consumer prices and wages in most European countries. Therefore, future research should reveal how minimum income protection has evolved during the crisis.

22 Social assistance and minimum income benefits 31 APPENDIX 2A
23 32 Chapter 2 APPENDIX 2B
24 Social assistance and minimum income benefits 33 APPENDIX 2C
25 34 Chapter 2


26 Social assistance and minimum income benefits 35

27 36 Chapter 2 APPENDIX 2D

28 Social assistance and minimum income benefits 37


29 38 Chapter 2 APPENDIX 2E
CONVERGENCE OF SOCIAL PROTECTION REVIEWED. Kees Goudswaard & Koen Caminada * 1. Introduction
 Source: K.P Goudswaard and C.L.J. Caminada (2003), Convergence of Social Protection Reviewed, in: A.R. Ros en H.R.J. (eds.) Ontwikkeling en overheid, Sdu, Den Haag, pp. 97-105. CONVERGENCE OF SOCIAL PROTECTION
Poverty and Poverty Reduction: Relationship between alternative measures of social spending and poverty rates across countries.
 Poverty and Poverty Reduction: Relationship between alternative measures of social spending and poverty rates across countries Koen Caminada Invited Guest Lecture Central University of Finance and Economics,
The intergenerational divide in Europe. Guntram Wolff
 The intergenerational divide in Europe Guntram Wolff Outline An overview of key inequality developments The key drivers of intergenerational inequality Macroeconomic policy Orientation and composition
ANNEX 3. The ins and outs of the Baltic unemployment rates
 ANNEX 3. The ins and outs of the Baltic unemployment rates Introduction 3 The unemployment rate in the Baltic States is volatile. During the last recession the trough-to-peak increase in the unemployment
Statistical annex. Sources and definitions
 Statistical annex Sources and definitions Most of the statistics shown in these tables can be found as well in several other (paper or electronic) publications or references, as follows: the annual edition
Consumer credit market in Europe 2013 overview
 Consumer credit market in Europe 2013 overview Crédit Agricole Consumer Finance published its annual survey of the consumer credit market in 28 European Union countries for seven years running. 9 July
Labour markets, social transfers and child poverty
 Labour markets, social transfers and child poverty Bruce Bradbury, Markus Jäntti and Lena Lindahl b.bradbury@unsw.edu.au, markus.jantti@sofi.su.se and lena.lindahl@sofi.su.se Objectives o Both earnings
Burden of Taxation: International Comparisons
 Burden of Taxation: International Comparisons Standard Note: SN/EP/3235 Last updated: 15 October 2008 Author: Bryn Morgan Economic Policy & Statistics Section This note presents data comparing the national
Poverty and social inclusion indicators
 Poverty and social inclusion indicators The poverty and social inclusion indicators are part of the common indicators of the European Union used to monitor countries progress in combating poverty and social
EU Survey on Income and Living Conditions (EU-SILC)
") 16 November 2006 Percentage of persons at-risk-of-poverty classified by age group, EU SILC 2004 and 2005 0-14 15-64 65+ Age group 32.0 28.0 24.0 20.0 16.0 12.0 8.0 4.0 0.0 EU Survey on Income and Living
16 November 2006 Percentage of persons at-risk-of-poverty classified by age group, EU SILC 2004 and 2005 0-14 15-64 65+ Age group 32.0 28.0 24.0 20.0 16.0 12.0 8.0 4.0 0.0 EU Survey on Income and Living
Investing for our Future Welfare. Peter Whiteford, ANU
 Investing for our Future Welfare Peter Whiteford, ANU Investing for our future welfare Presentation to Jobs Australia National Conference, Canberra, 20 October 2016 Peter Whiteford, Crawford School of
Statistics Brief. Investment in Inland Transport Infrastructure at Record Low. Infrastructure Investment. July
 Statistics Brief Infrastructure Investment July 2015 Investment in Inland Transport Infrastructure at Record Low The latest update of annual transport infrastructure investment and maintenance data collected
Approach to Employment Injury (EI) compensation benefits in the EU and OECD
 compensation benefits in the EU and OECD") Approach to (EI) compensation benefits in the EU and OECD The benefits of protection can be divided in three main groups. The cash benefits include disability pensions, survivor's pensions and other short-
Approach to (EI) compensation benefits in the EU and OECD The benefits of protection can be divided in three main groups. The cash benefits include disability pensions, survivor's pensions and other short-
Social Situation Monitor - Glossary
 Social Situation Monitor - Glossary Active labour market policies Measures aimed at improving recipients prospects of finding gainful employment or increasing their earnings capacity or, in the case of
Social Determinants of Health: employment and working conditions
 Social Determinants of Health: employment and working conditions Michael Marmot UCL Institute of Health Equity 3 rd Nordic Conference in Work Rehabilitation 7 th May 2014 Fairness at the heart of all policies.
Trust and Fertility Dynamics. Arnstein Aassve, Università Bocconi Francesco C. Billari, University of Oxford Léa Pessin, Universitat Pompeu Fabra
 Trust and Fertility Dynamics Arnstein Aassve, Università Bocconi Francesco C. Billari, University of Oxford Léa Pessin, Universitat Pompeu Fabra 1 Background Fertility rates across OECD countries differ
Patterns of welfare state indicators in the EU: Is there convergence?
 MPRA Munich Personal RePEc Archive Patterns of welfare state indicators in the EU: Is there convergence? Caminada, Koen; Goudswaard, Kees and Van Vliet, Olaf Department of Economics, Leiden University
Inequality and Poverty in EU- SILC countries, according to OECD methodology RESEARCH NOTE
 Inequality and Poverty in EU- SILC countries, according to OECD methodology RESEARCH NOTE Budapest, October 2007 Authors: MÁRTON MEDGYESI AND PÉTER HEGEDÜS (TÁRKI) Expert Advisors: MICHAEL FÖRSTER AND
THE EVOLUTION OF SOCIAL INDICATORS DEVELOPED AT THE LEVEL OF THE EUROPEAN UNION AND THE NEED TO STIMULATE THE ACTIVITY OF SOCIAL ENTERPRISES
 Scientific Bulletin Economic Sciences, Volume 13/ Issue2 THE EVOLUTION OF SOCIAL INDICATORS DEVELOPED AT THE LEVEL OF THE EUROPEAN UNION AND THE NEED TO STIMULATE THE ACTIVITY OF SOCIAL ENTERPRISES Daniela
Is the Western Welfare State Still Sustainable?
 Is the Western Welfare State Still Sustainable? James Heckman University of Chicago and University College Dublin ILO Institute March 23, 2007 1 / 36 Half a century ago, the free-market economist Friedrich
Conditional convergence: how long is the long-run? Paul Ormerod. Volterra Consulting. April Abstract
 Conditional convergence: how long is the long-run? Paul Ormerod Volterra Consulting April 2003 pormerod@volterra.co.uk Abstract Mainstream theories of economic growth predict that countries across the
Copies can be obtained from the:
 Published by the Stationery Office, Dublin, Ireland. Copies can be obtained from the: Central Statistics Office, Information Section, Skehard Road, Cork, Government Publications Sales Office, Sun Alliance
T5-Europe The Jus Semper Global Alliance 01/09/16 1 6
 Table-T5 Living-Wage-Gap and Equalisation analysis (vis-à-vis the U.S.) for all employed in the manufacturing sector in PPP for private consumption terms 1996-2015 (Europe) Beginning with the 2012 living-wage
Sustainability and Adequacy of Social Security in the Next Quarter Century:
 Sustainability and Adequacy of Social Security in the Next Quarter Century: Balancing future pensions adequacy and sustainability while facing demographic change Krzysztof Hagemejer (Author) John Woodall
3 Labour Costs. Cost of Employing Labour Across Advanced EU Economies (EU15) Indicator 3.1a
 Indicator 3.1a") 3 Labour Costs Indicator 3.1a Indicator 3.1b Indicator 3.1c Indicator 3.2a Indicator 3.2b Indicator 3.3 Indicator 3.4 Cost of Employing Labour Across Advanced EU Economies (EU15) Cost of Employing Labour
3 Labour Costs Indicator 3.1a Indicator 3.1b Indicator 3.1c Indicator 3.2a Indicator 3.2b Indicator 3.3 Indicator 3.4 Cost of Employing Labour Across Advanced EU Economies (EU15) Cost of Employing Labour
Assessing Developments and Prospects in the Australian Welfare State
 Assessing Developments and Prospects in the Australian Welfare State Presentation to OECD,16 November, 2016 Peter Whiteford, Crawford School of Public Policy https://socialpolicy.crawford.anu.edu.au/ peter.whiteford@anu.edu.au
STATISTICS. Taxing Wages DIS P O NIB LE E N SPECIAL FEATURE: PART-TIME WORK AND TAXING WAGES
 AVAILABLE ON LINE DIS P O NIB LE LIG NE www.sourceoecd.org E N STATISTICS Taxing Wages «SPECIAL FEATURE: PART-TIME WORK AND TAXING WAGES 2004-2005 2005 Taxing Wages SPECIAL FEATURE: PART-TIME WORK AND
ERODING MINIMUM INCOME PROTECTION IN THE NORDIC COUNTRIES?
 ERODING MINIMUM INCOME PROTECTION IN THE NORDIC COUNTRIES? REASSESSING THE TYPICAL CHARACTER OF NORDIC SOCIAL ASSISTANCE Forthcoming in Fritzell, J., Hvinden B., Kangas, O., Kvist, J (eds.) Changing Equality:
2014 September. Trends in donor spending on gender in development. Introduction.
 Trends in donor spending on gender in development Briefing 214 September www.devinit.org Development Initiatives exists to end absolute poverty by 23 Top findings There is a widening gap in reporting on
Statistical Annex ANNEX
 ISBN 92-64-02384-4 OECD Employment Outlook Boosting Jobs and Incomes OECD 2006 ANNEX Statistical Annex Sources and definitions Most of the statistics shown in these tables can be found as well in three
THE GROSS AND NET RATES OF REVENUES REPLACEMENT WITHIN THE RETIRING PENSIONS
 THE GROSS AND NET RATES OF REVENUES REPLACEMENT WITHIN THE RETIRING PENSIONS Tudor Colomeischi Department of Computer Science, Stefan cel Mare University of Suceava, ROMANIA. tudorcolomeischi@yahoo.ro
Corrigendum. OECD Pensions Outlook 2012 DOI: ISBN (print) ISBN (PDF) OECD 2012
 ISBN (PDF) OECD 2012") OECD Pensions Outlook 2012 DOI: http://dx.doi.org/9789264169401-en ISBN 978-92-64-16939-5 (print) ISBN 978-92-64-16940-1 (PDF) OECD 2012 Corrigendum Page 21: Figure 1.1. Average annual real net investment
OECD Pensions Outlook 2012 DOI: http://dx.doi.org/9789264169401-en ISBN 978-92-64-16939-5 (print) ISBN 978-92-64-16940-1 (PDF) OECD 2012 Corrigendum Page 21: Figure 1.1. Average annual real net investment
European Union Statistics on Income and Living Conditions (EU-SILC)
") European Union Statistics on Income and Living Conditions (EU-SILC) European Union Statistics on Income and Living Conditions (EU-SILC) is a household survey that was launched in 23 on the basis of a gentlemen's
European Union Statistics on Income and Living Conditions (EU-SILC) European Union Statistics on Income and Living Conditions (EU-SILC) is a household survey that was launched in 23 on the basis of a gentlemen's
4 Distribution of Income, Earnings and Wealth
 NERI Quarterly Economic Facts Autumn 2014 4 Distribution of Income, Earnings and Wealth Indicator 4.1 Indicator 4.2a Indicator 4.2b Indicator 4.3a Indicator 4.3b Indicator 4.4 Indicator 4.5a Indicator
Statistical Annex. Sources and definitions
 Statistical Annex Sources and definitions Most of the statistics shown in these tables can also be found in two other (paper or electronic) publication and data repository, as follows: The annual edition
Low employment among the 50+ population in Hungary
 Low employment among the + population in Hungary The role of incentives, health and cognitive capacities Janos Divenyi (Central European University) and Gabor Kezdi (Central European University and IE-CRSHAS)
Statistics Brief. OECD Countries Spend 1% of GDP on Road and Rail Infrastructure on Average. Infrastructure Investment. June
 Statistics Brief Infrastructure Investment June 212 OECD Countries Spend 1% of GDP on Road and Rail Infrastructure on Average The latest update of annual transport infrastructure investment and maintenance
Quality of Life of Public Servants in European Comparison
 Quality of Life of Public Servants in European Comparison Franz Rothenbacher, Mannheim 7th ISQOLS Conference, Grahamstown, South Africa, 2006 1. The research question 2. The civil service and welfare production
DG TAXUD. STAT/11/100 1 July 2011
 DG TAXUD STAT/11/100 1 July 2011 Taxation trends in the European Union Recession drove EU27 overall tax revenue down to 38.4% of GDP in 2009 Half of the Member States hiked the standard rate of VAT since
Slovak Competitiveness: Fundamentals, Indicators and Challenges
 Copyright rests with the author Slovak Competitiveness: Fundamentals, Indicators and Challenges Presentation by Mark De Broeck European Department, IMF Seminar Organized by the European Commission November
GREEK ECONOMIC OUTLOOK
 CENTRE OF PLANNING AND ECONOMIC RESEARCH Issue 29, February 2016 GREEK ECONOMIC OUTLOOK Macroeconomic analysis and projections Public finance Human resources and social policies Development policies and
Introduction to Public Finance
 Introduction to Public Finance Lecture 2: Functions and size of the welfare state. Retirement, unemployment protection, health care, etc. Welfare expenditures, aging problem. 1 Outline of the lecture Basic
ILO World of Work Report 2013: EU Snapshot
 Greece Spain Ireland Poland Belgium Portugal Eurozone France Slovenia EU-27 Cyprus Denmark Netherlands Italy Bulgaria Slovakia Romania Lithuania Latvia Czech Republic Estonia Finland United Kingdom Sweden
International comparison of poverty amongst the elderly
 International comparison of poverty amongst the elderly RPRC PensionBriefing 2009-1 ------------------------------------------------------------------------------------------------------- This PensionBriefing
The end of the welfare state: The view of the economist
 The end of the welfare state: The view of the economist Professor Nikos Maniadakis Associate Dean, National School of Public Health, GR End of welfare state: fact, illusion or desire? Prof. Nikos Maniadakis
The Global Financial Crisis and the Return of the Nordic Model?
 The Global Financial Crisis and the Return of the Nordic Model? Lars Calmfors Embassy of Denmark and the Swedish Institute of International Affairs 18 November Topics 1. The global economic crisis 2. Globalisation
Tax Working Group Information Release. Release Document. September taxworkingroup.govt.nz/key-documents
 Tax Working Group Information Release Release Document September 2018 taxworkingroup.govt.nz/key-documents This paper contains advice that has been prepared by the Tax Working Group Secretariat for consideration
Consultation on the European Pillar of Social Rights
 Contribution ID: 05384989-c4b4-45c1-af8b-3faefd6298df Date: 23/12/2016 11:12:47 Consultation on the European Pillar of Social Rights Fields marked with * are mandatory. Welcome to the European Commission's
Incomes Across the Distribution Dataset
 Incomes Across the Distribution Dataset Stefan Thewissen,BrianNolan, and Max Roser April 2016 1Introduction How widely are the benefits of economic growth shared in advanced societies? Are the gains only
The relationship between alternative measures of social spending and poverty rates
 The relationship between alternative measures of social spending and poverty rates Koen Caminada (corresponding author) Economics Department, Leiden University, PO Box 9, 23 RA Leiden, The Netherlands
Long-term unemployment: Council Recommendation frequently asked questions
 EUROPEAN COMMISSION MEMO Brussels, 15 February 2016 Long-term unemployment: Council Recommendation frequently asked questions Why a focus on long-term unemployment? The number of long-term unemployed persons
The Distributional Impact of Public Services in Europe
 1 The Distributional Impact of Public Services in Europe Rolf Aaberge Research Department, Statistics Norway and ESOP, University of Oslo Twelfth Winter School on Inequality and Social Welfare, University
International Statistical Release
 International Statistical Release This release and additional tables of international statistics are available on efama s website (www.efama.org) Worldwide Investment Fund Assets and Flows Trends in the
WHAT ARE THE FINANCIAL INCENTIVES TO INVEST IN EDUCATION?
 INDICATOR WHAT ARE THE FINANCIAL INCENTIVES TO INVEST IN EDUCATION? Not only does education pay off for individuals ly, but the public sector also from having a large proportion of tertiary-educated individuals
The role of an EMU unemployment insurance scheme on income protection in case of unemployment
 EM 11/16 The role of an EMU unemployment insurance scheme on income protection in case of unemployment H. Xavier Jara, Holly Sutherland and Alberto Tumino December 2016 The role of an EMU unemployment
8-Jun-06 Personal Income Top Marginal Tax Rate,
 8-Jun-06 Personal Income Top Marginal Tax Rate, 1975-2005 2005 2000 1999 1998 1997 1996 1995 1994 1993 1992 1991 1990 1989 1988 Australia 47% 47% 47% 47% 47% 47% 47% 47% 47% 47% 47% 48% 49% 49% Austria
March 2005 Euro-zone external trade surplus 4.2 bn euro 6.5 bn euro deficit for EU25
 STAT/05/67 24 May 2005 March 2005 Euro-zone external trade surplus 4.2 6.5 deficit for EU25 The first estimate for euro-zone 1 trade with the rest of the world in March 2005 was a 4.2 billion euro surplus,
NOTE. for the Interparliamentary Meeting of the Committee on Budgets
 NOTE for the Interparliamentary Meeting of the Committee on Budgets THE ROLE OF THE EU BUDGET TO SUPPORT MEMBER STATES IN ACHIEVING THEIR ECONOMIC OBJECTIVES AS AGREED WITHIN THE FRAMEWORK OF THE EUROPEAN
Consumer Credit. Introduction. June, the 6th (2013)
") Consumer Credit in Europe at end-2012 Introduction Crédit Agricole Consumer Finance has published its annual survey of the consumer credit market in 27 European Union countries (EU-27) for the sixth year
Consumer Credit in Europe at end-2012 Introduction Crédit Agricole Consumer Finance has published its annual survey of the consumer credit market in 27 European Union countries (EU-27) for the sixth year
Welfare states and health inequalities
 Welfare states and health inequalities Olle Lundberg, Professor and Director CHESS Montreal, CIQSS International Conference 2014-05-05 Inequalities in health and mortality Inequalities exist in all countries
Households capital available for renovation
 Households capital available for Methodical note Copenhagen Economics, 22 February 207 The task at hand has been twofold: firstly, we were to calculate an estimate of households average capital available
Ways to increase employment
 Ways to increase employment Iceland Luxembourg Spain Canada Italy Norway Denmark Germany Portugal Ireland Japan Belgium Switzerland Austria Slovenia United States New Zealand Finland France Netherlands
Payroll Taxes in Canada from 1997 to 2007
 Payroll Taxes in Canada from 1997 to 2007 This paper describes the changes in the structure of payroll taxes in Canada and the provinces during the period 1997-2007. We report the average payroll tax per
Sources of Government Revenue in the OECD, 2016
 FISCAL FACT No. 517 July, 2016 Sources of Government Revenue in the OECD, 2016 By Kyle Pomerleau Director of Federal Projects Kevin Adams Research Assistant Key Findings OECD countries rely heavily on
August 2005 Euro-zone external trade deficit 2.6 bn euro 14.2 bn euro deficit for EU25
 STAT/05/132 20 October 2005 August 2005 Euro-zone external trade deficit 2.6 14.2 deficit for EU25 The first estimate for euro-zone 1 trade with the rest of the world in August 2005 was a 2.6 billion euro
Statistics Brief. Inland transport infrastructure investment on the rise. Infrastructure Investment. August
 Statistics Brief Infrastructure Investment August 2017 Inland transport infrastructure investment on the rise After nearly five years of a downward trend in inland transport infrastructure spending, 2015
A NOTE ON PUBLIC SPENDING EFFICIENCY
 A NOTE ON PUBLIC SPENDING EFFICIENCY try to implement better institutions and should reassign many non-core public sector activities to the private sector. ANTÓNIO AFONSO * Public sector performance Introduction
Social Protection and Social Inclusion in Europe Key facts and figures
 MEMO/08/625 Brussels, 16 October 2008 Social Protection and Social Inclusion in Europe Key facts and figures What is the report and what are the main highlights? The European Commission today published
Private pensions. A growing role. Who has a private pension?
 Private pensions A growing role Private pensions play an important and growing role in providing for old age in OECD countries. In 11 of them Australia, Denmark, Hungary, Iceland, Mexico, Norway, Poland,
How Tight Are the Screws?
 How Tight Are the Screws? Conditions and Sanctions for the Unemployed in the OECD, 1980-2012 Carlo Knotz in collaboration with Moira Nelson Lund University September 18, 2015 International Conference on
Economic Performance. Lessons from the past and a guide for the future Björn Rúnar Guðmundson, Director
 Economic Performance Lessons from the past and a guide for the future Björn Rúnar Guðmundson, Director Analysis of economic performance Capital and labour: The raw ingredients in economic development However,
Inequality in the Western Balkans and former Yugoslavia. Will Bartlett Visiting Fellow, LSEE & International Inequalities Institute
 Inequality in the Western Balkans and former Yugoslavia Will Bartlett Visiting Fellow, LSEE & International Inequalities Institute International Inequalities Institute project: Specific research questions
COMPARISON OF RIA SYSTEMS IN OECD COUNTRIES
 COMPARISON OF RIA SYSTEMS IN OECD COUNTRIES Nick Malyshev, OECD Conference on the Further Development of Impact Assessment in the European Union Brussels, RIA SYSTEMS IN OECD COUNTRIES Regulatory Impact
Workforce participation of mature aged women
 Workforce participation of mature aged women Geoff Gilfillan Senior Research Economist Productivity Commission Productivity Commission Topics Trends in labour force participation Potential labour supply
Is There a Relationship between Company Profitability and Salary Level? A Pan-European Empirical Study
 2011 International Conference on Innovation, Management and Service IPEDR vol.14(2011) (2011) IACSIT Press, Singapore Is There a Relationship between Company Profitability and Salary Level? A Pan-European
COMMISSION STAFF WORKING DOCUMENT Accompanying the document
 EUROPEAN COMMISSION Brussels, 30.11.2016 SWD(2016) 420 final PART 4/13 COMMISSION STAFF WORKING DOCUMENT Accompanying the document REPORT FROM THE COMMISSION TO THE EUROPEAN PARLIAMENT, THE COUNCIL, THE
January 2005 Euro-zone external trade deficit 2.2 bn euro 14.0 bn euro deficit for EU25
 42/2005-23 March 2005 January 2005 Euro-zone external trade deficit 2.2 14.0 deficit for EU25 The first estimate for euro-zone 1 trade with the rest of the world in January 2005 was a 2.2 billion euro
American healthcare: How do we measure up?
 American healthcare: How do we measure up? December 2009 September 2009 Lauren Damme Economic Growth Program Next Social Contract Initiative The U.S. is one of the only industrialized nations in the world
Trends in Retirement and in Working at Older Ages
 Pensions at a Glance 211 Retirement-income Systems in OECD and G2 Countries OECD 211 I PART I Chapter 2 Trends in Retirement and in Working at Older Ages This chapter examines labour-market behaviour of
How to complete a payment application form (NI)
") How to complete a payment application form (NI) This form should be used for making a payment from a Northern Ireland Ulster Bank account. 1. Applicant Details If you are a signal number indemnity holder,
How to complete a payment application form (NI) This form should be used for making a payment from a Northern Ireland Ulster Bank account. 1. Applicant Details If you are a signal number indemnity holder,
THE UNEQUAL IMPACT OF THE CRISIS BY AGE: AN ANALYSIS BASED ON NATIONAL TRANSFER ACCOUNTS
 Global NTA, México D.F. 23-7/7/2018 THE UNEQUAL IMPACT OF THE CRISIS BY AGE: AN ANALYSIS BASED ON NATIONAL TRANSFER ACCOUNTS Meritxell Solé (UB), Giorgos Papadomichelakis (UB), Guadalupe Souto (UAB), Elisenda
The OECD s Society at a Glance Simon Chapple OECD ELS/SPD Villa Vigoni, Italy, 9-11 th March 2011
 The OECD s Society at a Glance 2 Simon Chapple OECD ELS/SPD Villa Vigoni, Italy, 9- th March 2 Reconceptualisation for 2: Internal reasons OECD growth from 3 to 34 countries Other major economies (e.g.
SELECTED MAJOR SOCIAL SECURITY PENSION REFORMS IN EUROPE, Source: ISSA Databases
 SELECTED MAJOR SOCIAL SECURITY PENSION REFORMS IN EUROPE, 1995-2014 Source: ISSA Databases COUNTRY AREA YR SUMMARY OBJECTIVE POSSIBLE EVALUATION CRITERIA* United Kingdom Pensions 2014 Replacing public
American healthcare: How do we measure up?
 American healthcare: How do we measure up? December 2009 September 2009 Lauren Damme Economic Growth Program Next Social Contract Initiative The U.S. is one of the only industrialized nations in the world
WikiLeaks Document Release
 WikiLeaks Document Release February 2, 2009 Congressional Research Service Report RL34073 Productivity and National Standards of Living Brian W. Cashell, Government and Finance Division July 5, 2007 Abstract.
From universalism to selectivity: Old wine in new bottles for child benefits in Europe and other countries
 Draft, November 8, 211 Please do not quote without permission from authors To be presented at the Gini Workshop WP6 14-1 November 211, University of Antwerp From universalism to selectivity: Old wine in
Basic information. Tax-to-GDP ratio Date: 29 November 2010
 Federal Department of Finance FDF Federal Finance Administration FFA Basic information Date: 29 November 2010 Tax-to-GDP ratio 2010 The tax-to-gdp ratio is the sum of all taxes and public levies in relation
Ageing and employment policies: Ireland
 Ageing and employment policies: Ireland John Martin 1 Director for Employment, Labour and Social Affairs, OECD FÁS Annual Labour Market Conference, Dublin, 5 December 2005 OECD has carried out a major
The Swedish approach to capital requirements in CRD IV
 The Swedish approach to capital requirements in CRD IV State Secretary Johanna Lybeck Lilja The aim of capital requirements Enhancing growth creating potential of a integrated, stable financial system
Recommendation of the Council on Tax Avoidance and Evasion
 Recommendation of the Council on Tax Avoidance and Evasion OECD Legal Instruments This document is published under the responsibility of the Secretary-General of the OECD. It reproduces an OECD Legal Instrument
(III) Debating the Minimum Wage. Bocconi University,
 Debating the Minimum Wage. Bocconi University,") (III) Debating the Minimum Wage Bocconi University, 2017-18 Outline Definition and cross-country comparisons Theory Competitive labor market Dual labor market Noncompetitive labor market Empirical evidence
(III) Debating the Minimum Wage Bocconi University, 2017-18 Outline Definition and cross-country comparisons Theory Competitive labor market Dual labor market Noncompetitive labor market Empirical evidence
POVERTY AND INCOMES OF OLDER PEOPLE IN OECD COUNTRIES. Asghar Zaidi
 POVERTY AND INCOMES OF OLDER PEOPLE IN OECD COUNTRIES by Asghar Zaidi Paper prepared for the 31st General Conference, St-Gallen, Switzerland, 22-28 August, 2010 * Asghar Zaidi is Director Research at the
Income and Wealth Inequality in OECD Countries
 DOI: 1.17/s1273-16-1946-8 Verteilung -Vergleich Horacio Levy and Inequality in Countries The has longstanding experience in research on income inequality, with studies dating back to the 197s. Since 8
Long Term Reform Agenda International Perspective
 Long Term Reform Agenda International Perspective Asta Zviniene Sr. Social Protection Specialist Human Development Department Europe and Central Asia Region World Bank October 28 th, 2010 We will look
EMPLOYMENT RATE Employed/Working age population (15 64 years)
") EMPLOYMENT RATE 198 26 Employed/Working age population (15 64 years 8 % Finland 75 EU 15 EU 25 7 65 6 55 5 8 82 84 86 88 9 92 94 96 98 2 4** 6** 14.4.25/SAK /TL Source: European Commission 1 UNEMPLOYMENT
EMPLOYMENT RATE 198 26 Employed/Working age population (15 64 years 8 % Finland 75 EU 15 EU 25 7 65 6 55 5 8 82 84 86 88 9 92 94 96 98 2 4** 6** 14.4.25/SAK /TL Source: European Commission 1 UNEMPLOYMENT
Double-Taxing Capital Income: How Bad Is the Problem?
 November 15, 2006 Double-Taxing Capital Income: How Bad Is the Problem? by Patrick Fleenor Fiscal Fact No. 71 Introduction Double taxation is a common and often misused expression in tax policy discussions.
education (captured by the school leaving age), household income (measured on a ten-point
, household income (measured on a ten-point") A Web-Appendix A.1 Information on data sources Individual level responses on benefit morale, tax morale, age, sex, marital status, children, education (captured by the school leaving age), household income
A Web-Appendix A.1 Information on data sources Individual level responses on benefit morale, tax morale, age, sex, marital status, children, education (captured by the school leaving age), household income
The Case for Fundamental Tax Reform: Overview of the Current Tax System
 The Case for Fundamental Tax Reform: Overview of the Current Tax System Sources of Federal Receipts Projected for 2016 Excise Taxes 2.9% Estate & Gift Taxes 0.6% Corporate Income Taxes 9.8% Other Taxes
REVIEW PRACTICE GUIDANCE
 REVIEW PRACTICE GUIDANCE 2017 Update of the Analysis of the Assessment of Completeness and Transparency of Information Reported in Biennial Reports Background paper for the 4 th Lead Reviewers Meeting,