COMMISSION STAFF WORKING DOCUMENT Accompanying the document
|
|
|
- Chrystal Corey Payne
- 5 years ago
- Views:
Transcription
 420 final PART 4/13 COMMISSION STAFF WORKING DOCUMENT Accompanying the document REPORT FROM THE COMMISSION TO THE EUROPEAN PARLIAMENT, THE COUNCIL, THE")
1 EUROPEAN COMMISSION Brussels, SWD(2016) 420 final PART 4/13 COMMISSION STAFF WORKING DOCUMENT Accompanying the document REPORT FROM THE COMMISSION TO THE EUROPEAN PARLIAMENT, THE COUNCIL, THE EUROPEAN ECONOMIC AND SOCIAL COMMITTEE AND THE COMMITTEE OF THE REGIONS Energy prices and costs in Europe {COM(2016) 769 final} EN EN
2 Contents 5 HOUSEHOLD ENERGY EXPENDITURE ENERGY PRODUCTS IN HOUSEHOLD BUDGETS Energy expenditure in households with low income Energy expenditure in households with middle income Energy expenditures in household consumption and disposable income Change in energy expenditures in the Member States ( ) SHARE OF ENERGY IN THE HOUSEHOLD EXPENDITURE BY INCOME AND REGION DECOMPOSITION OF CHANGES IN THE ENERGY EXPENDITURE (PRICES, CONSUMPTION AND INCOME EFFECTS) Impact of cost components and energy policy measures REACTION OF HOUSEHOLDS ON INCREASING ENERGY COSTS Household energy use for different purposes ENERGY RELATED EXPENDITURES IN THE TRANSPORT SECTOR
3 Figure Shares of consumer goods groups in household expenditure in Member States, Figure 147 Households energy expenditures in Member States across income quintiles, Figure Energy products share in the total households consumption by income quintile (2014) 158 Figure 149 Households in the lowest quintile - EU average energy expenditure ( ) and share of total household expenditure over time Figure Households with the lowest income - Energy expenditures ( ) and share of energy in total consumption, by EU Member State (2014) Figure 151 Households with lowest income Map with Energy expenditures and the share of energy in total consumption in EU Member States in Figure Households with the lowest income - Energy expenditures and the share of energy in total consumption in EU Member States (actually paid PPS EUR, 2014) Figure 153- Households in the middle income quintile - EU average energy related expenditure in euros and in the percentage of total expenditure Figure Households with middle income - Energy expenditures and the share of energy in total consumption in EU Member States (actually paid EUR, 2014) Figure Households with middle income Map with Energy expenditures and the share of energy in total consumption in EU Member States in Figure Households with middle income - Energy expenditures and the share of energy in total consumption in EU Member States (PPS EUR, 2014) Figure Households in the lowest income - Share of energy expenditures in the total consumption and disposable income of, Figure Households with the middle income - Share of energy expenditures in the total consumption and disposable income in Figure 159 Households with lowest income (1 st quintile) vs Households with middle income (3 rd quintile) - Share of energy in household expenditure over the last decade Figure Households with lowest income (1 st quintile) vs Households with middle income (3 rd quintile) - Expenditure on energy in over the last decade Figure Germany, France, Belgium, Netherlands and Luxembourg - Share of energy in final household consumption expenditure per income quintiles Figure 162 South European countries (Spain, Portugal, Italy, Greece, Malta and Cyprus) - Share of energy in final household consumption expenditure in different income quintiles Figure Poland, Czech Republic, Slovakia and Hungary - Share of energy in final household consumption expenditure in different income quintiles Figure United Kingdom and Ireland - Share of energy in final household consumption expenditure in different income quintiles Figure Nordic and Baltic countries: Sweden, Finland, Denmark, Estonia, Latvia, Lithuania - Share of energy in final household consumption expenditure in different income quintiles Figure South East Europe: Croatia, Slovenia, Romania and Bulgaria - Share of energy in final household consumption expenditure in different income quintiles Figure 167 Decomposition of household expenditures on electricity changes between 2008 and Figure Decomposition of household expenditures on natural gas changes between 2008 and Figure 169 Decomposition of changes in the share of expenditures on electricity in household income, Figure Decomposition of changes in the share of expenditures on natural gas in household income, Figure 171 Impact of energy supply cost, network charges and energy policy elements on household expenditure on electricity (in Euro per household, 2015) Figure Factors behind changes in energy consumption in some EU Member States ( ) Figure 173 Household electricity consumption Shares of uses in some EU Member States, Figure Household gas consumption Share of uses in some EU Member States,
4 Figure Percentage of households below 60% of the median national income being unable to keep their home adequately warm Figure 176 Estimated household expenditures on energy products in transport of income quintiles, Figure 177 Share of energy expenditure on transport in household expenditure by income quintiles,
5 5 Household energy expenditure Energy costs in this report are basically defined as the amount of energy consumed, expressed in energy units (e.g. per kwh), multiplied by the actually paid energy unit price (e.g.: cent/kwh). In this chapter of the report we are going to focus on the household energy expenditure excluding transport (expenditure in motor fuels) and the impact of such energy costs on the budget of the households, otherwise saying we look at the affordability aspect of energy costs 1 in the case of households. Energy consumption and energy costs in households depend on several factors. Energy prices fundamentally impact energy expenditures and may also give incentives to the households in order to find solutions to reduce their energy bills, for example by improving energy efficiency via refurbishment of the building they live in or by purchasing more energy efficient household appliances. Improving energy efficiency has also beneficial repercussion on household energy expenditures. However, decreasing energy consumption over time does not necessarily mean improving energy efficiency; the decrease in energy use in the households often indicates financial constraints and inability to pay for sufficient energy consumption, enabling comfortable living conditions. Energy consumption, especially heating and cooling related consumption can largely depend on the climate conditions of a given country that varies across the EU Member States. Of course, the aforementioned energy efficiency factor, regarding the building stock, the fuel type and the household appliances used for heating and cooking, can largely mitigate the impact of the climate and can largely influence household energy expenditures. The income of households also appears to be an important factor in determining how much burden it does imply on households to pay their energy bills, or otherwise saying, how affordable it is for the households to sufficiently consume energy products to ensure comfortable living conditions. In this chapter an analysis is provided on how household energy expenditures evolved over the last decade (between 2004 and 2014) and how different Member States energy related household expenditures compare to each other and to the EU average. There are twenty-eight Member states in the EU, facing different retail energy prices, climate conditions, energy intensity of their homes and different income levels. As a novelty of the current report, the analysis on energy expenditure has been enhanced with differentiation between households in different income quintiles (low income, middle income, etc.) in most of the EU Member States. Energy related expenditures are compared to both the disposable income and the total consumption expenditure of households in order to provide information on how different income levels may influence energy affordability. There are five different energy products taken into account for analysing energy related expenditure of households 2 : electricity, gas, liquid fuels (mainly heating oil), solid fuels and 1 In this chapter energy costs are defined as domestic energy services such as heating, cooling, lighting, water heating, cooking and electrical appliances. Unless otherwise stated, energy costs exclude energy consumption in transport, however, in a subchapter estimation is also made on transport related household energy expenditures. 2 Following the logic of the Classification of Individual Consumption According to Purpose - COICOP nomenclature, used in household budget statistics (HBS) 152
6 heat energy (primarily meaning district heating). The primary data source for the analysis is an ad-hoc data collection 3 from the National Statistical Institutes of the Member States, based on standard questionnaires and classification used by Eurostat for the Household Budget Survey (HBS). HBS data have also been complemented by the preliminary results of a new data collection on the final household energy consumption data, showing the use of energy by purposes (e.g.: lighting, heating, cooking, etc.) and by the aforementioned five energy products. Further data on households' energy consumption and efficiency have been taken from the ODYSSEE- MURE database 4. On case study basis data on energy consumption is also included from the report 5 done by the external contractor, providing input for the current chapter. Besides presenting the evolution of household expenditures on energy, it is also important to provide information on how the underlying factors, for example, energy prices, household income and the quantity of energy consumed change over time; an estimation method developed by the contractor provides information in each Member State for different energy products. The impact of energy policy measures (e.g.: renewable surcharges, energy efficiency subsidies, other policy measures, etc.) on the expenditure of households has also been analysed in details, given that energy expenditure of households has been increasingly impacted by these policy measures over the last few years in many EU member States. A short analysis has been provided on estimated energy related transport expenditures (mainly fuels and lubricants for personal transport vehicles). Finally, as an Annex to this chapter, there is a chart for each Member States, showing the share of energy products (excluding transport fuels) in total household expenditures in the five different income quintiles for the most recent period with available data and for periods of five and ten years earlier. Main findings In 2014 households spent almost 6% of their total expenditure on energy products in the EU on average, ranging from 3% in Malta to 14.5% in Slovakia. The share of energy expenditure within housing costs was generally higher in Member States with lower overall purchasing power. Housing costs is an important part of the total household expenditure in almost all Member States, besides services and food products. Although households with higher income tend to spend more on energy products, if we look at the share of energy in total household expenditures in different income quintiles we see an inversely proportional relation between the share of energy expenditure and income level; implying that households with low income spend proportionally more on energy products than the average. This gives a good reason to focus our attention on low and middle income households while analysing expenditures on energy from affordability aspect. The importance of energy products measurably increased in the total consumption expenditure of households in the EU: on average, the share of energy rose from 5.7% to 3 Directorate General for Energy and Eurostat have implemented together this data collection and validation, at the beginning of Energy prices and costs in the EU, (report prepared by Ecofys for the European Commission) 153
7 8.6% in the total household expenditure in the lowest income quintile between 2004 and 2014, resulting in a nearly 3 percentage point increase within a decade. In 2014 the share of energy in total household expenditure in the lowest income quintile (8.6%) was significantly higher 6 than the share of energy for the entirety of households on EU average (5.8%). In 2004 this difference was smaller (5.7% for households with low income vs. 4.1% for households as a whole). Most of this increase was due to electricity and gas. On EU average, in 2014 households in the lowest income quintile spent 160 more on electricity and 140 more on natural gas than in The overall EU average expenditure on energy products per household rose from 625 to 960 during the same period, implying a 24% increase in real terms after correcting by the inflation 7. In 2014 there was an almost eightfold difference across the EU Member States in average annual household expenditure on energy products in the lowest income quintile: while in Romania households with low income spent 294 on energy, in Denmark energy related spending s amounted to 2,320. In Sweden and Finland households spent less than 4% of their total expenditure on energy, while in Slovakia this share was more than 21%. After purchasing power correction, eliminating the differences in household incomes across the EU, the difference in energy expenditures was still more than threefold in 2014 in the lowest income quintile. Households spent the largest part of their energy bills on electricity, followed by natural gas. In some Member States district heating 8 or heating oil 9 (liquid fuels) had of particular importance. Households with middle income have not been as strongly impacted by the increase in energy costs as households with low income. On EU average the total energy costs went up between 2004 and 2014 from 885 to 1,295, implying an 18% increase after correcting by the inflation. Expressed as percentage of total consumption expenditure, the share of energy rose from 4.3% to 6.2% in the same period. Increasing electricity costs added 150 to the energy bill of households with middle income while in the case of gas the additional expenditure was 190, implying that energy costs other than electricity and gas practically remained the same in this period. Comparing energy expenditures to disposable income besides the total consumption expenditure reveals important differences both across Member States and different income quintiles. In the lowest income quintile the share of energy expenditures in disposable income went up from 7.8% to 12% between 2004 and 2014, while in the same time the share of energy in households with middle disposable income went up from 4.3% to 6.2%. The share of energy expenditure in the disposable income shows a higher dispersion both across income quintiles and Member States than the share of energy within the total household expenditure. It seems that in the lowest income quintile disposable income is 6 Energy expenditure shares for households in the lowest income quintile might be underestimated if we take into account that many of these households does not have sufficient financial means to heat their homes to an adequately warm level 7 The overall EU inflation rate (measured by the Harmonised Index of Consumer Prices HICP) was 23.6% between 2004 and For example: Denmark, Slovakia, Estonia, Latvia and Lithuania 9 For example: Belgium, Luxembourg, Slovenia, Greece, Ireland 154
8 underestimated by household budget statistics, as some elements, such as social transfers, debt, etc. are not included in disposable income. In the case of households with middle and higher income these elements have less important role. It seems that in some Member States households reacted on increasing energy prices and costs by reducing their energy consumption. In many cases reduction in energy consumption was the result of improving residential energy efficiency. On the other hand, in some countries purchasing power constraints might rather be suspected behind dramatic decreases in energy consumption. Contrarily to household energy use in basic housing activities, (e.g.: heating, cooking, lighting, etc.) energy expenditures related to transport activities (e.g.: purchase of fuels for personal vehicles) are proportionally higher in the case of households with high income than for households with lower purchasing power. Consequently, energy expenditures related to transport activities are normally not taken into account for energy affordability considerations. 5.1 Energy products in household budgets In order to assess the importance of energy products in household expenditures in different EU Member States, it is useful to look at how the share of energy compares to expenditures related to the consumption of other goods and services, such as food, services, housing, transport (which includes expenditure in transport fuels), etc. Figure 146 shows the decomposition of consumption expenditure of households in 2014in the EU Member States, ranking them in descending order according to the share of energy in their total expenditures. Looking at energy expenditures in each country, households in Slovakia spent proportionally the most on energy products (14.5% of their total expenditures), while households in Malta spent only 3% of their total budget. On EU average, households spent almost 6% of their total expenditure on energy products in The share of energy related expenditures were higher in Member States with lower GDP per capita (mainly Central and Eastern European countries), while housing related expenditures 10 were generally higher and energy expenditures were lower than the EU average in Member States having higher GDP per capita. Services, and food and non-alcoholic beverages had the two biggest shares in household's expenditures in almost all Member States in 2014 (food products had higher shares in countries with lower purchasing power per capita, while in the case of services it was the other way around). Transport related energy expenditures (mainly motor fuels) were also significant in most of the Member States; ranging between 6% measured in Romania and 17% in France, if expressed as the share of total consumption expenditure. 10 It is important to recall that HBS data are not fully harmonised at EU level, implying that numbers are not always fully comparable across countries, even if the same nomenclature (COICOP) used for the data collection. For example, the distinction between housing and energy products is not the same across different countries, making sometimes the comparison on related expenditures difficult. 155

9 Figure Shares of consumer goods groups in household expenditure in Member States, 2014 Source: Directorate General for Energy and Eurostat common data collection from National Statistical Institutes and own computations. After looking the overall picture on consumption of goods and services in the household sector, from this point the analysis will concentrate on household expenditures on energy products. Given that all of the twenty-eight EU Member States have submitted detailed data on the final household consumption expenditures in the five different income quintiles for the last ten years, we have detailed data on how much households spent on energy and on other products as well. Each income quintile represents 20% of the population regarding the income of households; hereinafter the lowest income quintile is called Quintile 1, while the highest is Quintile 5. Households in different quintiles, representing different purchasing power, normally spend different shares of their financial resources on energy products, as Figure 147 shows. As it is presented on this chart, there were significant differences across EU Member States in spending on energy products in 2014 in all income quintiles (showing five-to-eightfold differences between Bulgaria and Romania on the low end of the scale and Luxembourg, Denmark on the high end). Spending on energy products tends to increase with income, implying that households in higher income quintiles spend more on energy products. 156
10 157

11 Figure 147 Households energy expenditures in Member States across income quintiles, 2014 Source: Directorate General for Energy and Eurostat common data collection from National Statistical Institutes and own computations Note: Expenditure data on the chart must be read in cumulative way; e.g.: expenditure in the third quintile is the sum of the first three bars from the bottom in each country. Total stands for the average of all households. However, if we look at the share of energy products within the total household expenditure, also showing significant differences in all income quintiles across EU Member States, we can see that the share of total expenditure on energy products is inversely proportional with income, implying that poorer and middle-income households spend proportionally more on energy products than households with high income, as Figure 148 shows. This fact has important social implications, as sudden increase in energy costs may impact more intensively households having low income. Subsequently, in the remaining part of this chapter the analysis on energy expenditures will mainly focus on households with low and middle income. Figure Energy products share in the total households consumption by income quintile (2014) Source: Directorate General for Energy and Eurostat common data collection from National Statistical Institutes and own computations 158
12 Note: Total stands for the average of all households Energy expenditure in households with low income As Figure 149 shows, the importance of energy products (their share in the total household consumption expenditure) increased measurably in the case of households being in the lowest income quintile between 2004 and 2014: the share of energy went up from 5.7% to 8.6% in the EU 11 over this ten year period. This increase was predominantly due to the rising share of electricity and natural gas, while the other three components remained more or less stable. If consumption expenditures are expressed as the share of disposable income 12, the share of energy rose from 7.8% to 12% between 2004 and Over the ten year period represented on Figure 148 the average EU household expenditure on energy products rose from 625 to 960, representing a bigger increase than the overall inflation in the EU-28 (23.6%, as measured by the Harmonised Index of Consumer Prices HICP) in the same period. While in household expenditure on electricity was 300 in the lowest income quintile on EU average, in 2014 it reached 460. The same data for expenditure on natural gas: 200 in 2004 and 340 in Expenditures related to the other three energy products presented on the charts altogether did not show significant changes over this ten year period. Figure 149 Households in the lowest quintile - EU average energy expenditure ( ) and share of total household expenditure over time 11 It is important to note that there are missing countries in each year from the EU sample, as Household Budget Survey data collection are not harmonised across Member States and hence the EU average represents an average of the actually available data. Therefore changes in the EU average from one year to another might also represent changes in composition of countries. 12 It must be noted that there is a risk that Household Budget Statistics underestimates disposable income of households, especially in the lowest income quintile. See more on the caveats of HBS in subchapter ' Comparing energy expenditures to total household consumption vs. disposable income' 13 Comparing average expenditures over consecutive years might be biased by the composition effect mentioned in the previous footnote at the computation of the EU average 159

13 Source: Directorate General for Energy and Eurostat common data collection from National Statistical Institutes and own computations Besides analysing the evolution of energy related expenditures over time, it is also important to provide a cross-country analysis, revealing the differences in the structure of energy related expenditures across EU Member States. Figure 150 shows the average amount spent on electricity, gas, liquid fuels, solid fuels and heat energy in each EU Member State in 2014 in the lowest income quintile of households. Diamonds in the chart show the share of energy in the total household consumption expenditure in each country (on the right hand scale). Figure Households with the lowest income - Energy expenditures ( ) and share of energy in total consumption, by EU Member State (2014) Source: Directorate General for Energy and Eurostat common data collection from National Statistical Institutes and own computations. No quintile data for Croatia. On EU average, households being in the lowest income quintile spent 960 on energy products in 2014, however, this average masks significant differences across Member States: 160
14 While in Romania the average energy expenditure was below 300, in Denmark it exceeded 2,300, providing for a more than eightfold difference in energy related spending across the EU. However, while in Romania this amount of 300 represented 15% of the total household expenditure in 2014 in the lowest income quintile, the amount paid in Denmark (2,320 ) represented only 5.6%. Energy expenditures expressed in euros were normally lower than the EU average in the Central and Eastern European countries 14 (with the exception of Slovakia, the Czech Republic, and Slovenia), as well as in Finland, Sweden, Greece and Spain, while in the other Member States households spent more on energy than the EU average. Looking at the share of energy expenditures in the total consumption expenditure, households in the Central Eastern European countries, the UK and Denmark spent proportionally more on energy than the EU average in 2014 (8.6%), while German households spent nearly the same share of household's expenditure on energy as the EU average. In the EU households spent the lowest share of their consumption expenditure on energy in Malta, Finland and Sweden (below 4%), while in Slovakia this share was the highest (almost 22%). In the overall majority of the EU Member States electricity had the highest share in energy expenditures in 2014, followed by natural gas. In the Netherlands however, the most important energy product in household expenditure was natural gas. In this country there is a specific item (reimbursement of energy taxes, amounting to 386 in recent years), having a decreasing impact on the overall energy bills for all households. Liquid fuels (mainly heating oil) has significant share in some countries (Luxembourg, Belgium, Slovenia and Greece). In Bulgaria, Estonia, Hungary, Latvia, Poland, and Romania solid fuels (mainly coal and wood) also has a measurable share. In these countries the share of solid fuels has been significantly higher in households with low income than in households with middle and higher income, which may point to the lack of infrastructure to connect some of these households to the electricity and gas grids or to the cost advantages of solid fuels to other alternatives (e.g.: heating oil). Heat energy is especially important in Denmark, where significant investments in the heating sector have made heat as primary source within energy-related expenditures of households, outnumbering even electricity. Heat energy (mainly in the form of district heating in practice) also has an important share in the Baltic States 15, Slovakia, Germany, Czech Republic, Austria and Finland. The next map shows the numbers of Figure 150 on energy expenditure and share of energy in total consumption expenditure in 2014, for households with the lowest income. 14 Poland, Czech Republic, Slovakia, Hungary, Slovenia, Croatia, Romania, Bulgaria, Estonia, Latvia, Lithuania 15 Estonia, Latvia and Lithuania 161
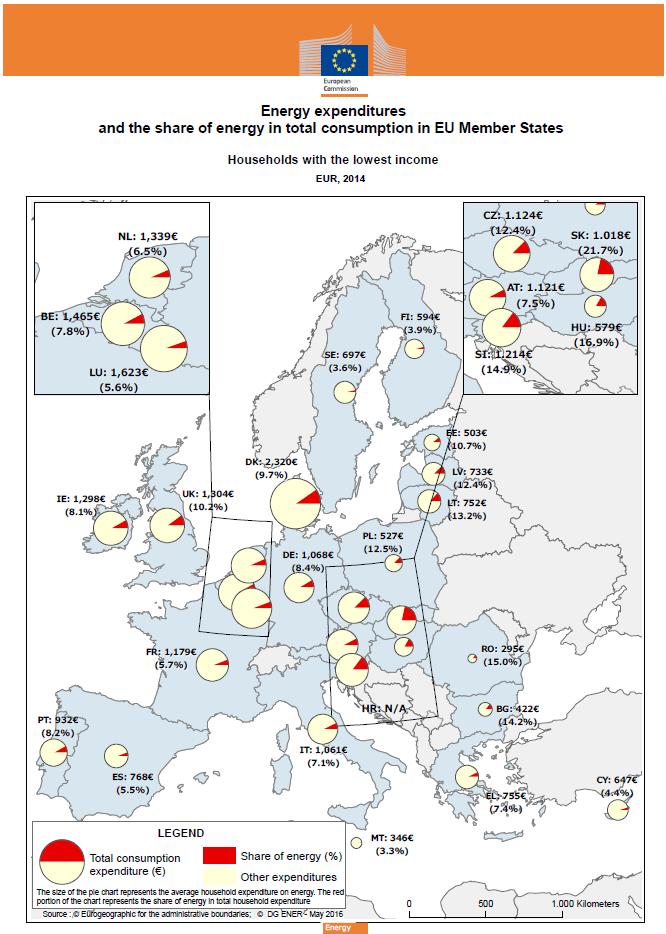
15 Figure 151 Households with lowest income Map with Energy expenditures and the share of energy in total consumption in EU Member States in
16 163

17 As Figure 152 shows, purchasing power parity correction significantly changes the country ranking order of expenditures on energy, providing for a better picture on how household incomes in different countries impact the share of energy within the total household expenditure. The dispersion of average energy expenditure across the EU was lower than before purchasing power correction (in 2014 households in the Czech Republic spent three and a half times more on energy than in Sweden calculated on purchasing power parity, as opposed to the aforementioned eightfold difference between Denmark and Romania before purchasing power parity correction). Figure Households with the lowest income - Energy expenditures and the share of energy in total consumption in EU Member States (actually paid PPS EUR, 2014) Source: Directorate General for Energy and Eurostat common data collection from National Statistical Institutes and own computations. No quintile data for Croatia. 164
.")
18 5.1.2 Energy expenditure in households with middle income After analysing energy expenditures of households having the lowest income, the next step is to take a look at households with middle income, which practically means the third income quintile (40% of the total population has lower income and 40% of the total population has higher income than households in the middle income quintile). As Figure 153 shows, the evolution of both household energy expenditure and its share in total consumption expenditure on EU average basically followed the same pattern in the case of households with middle income as it was presented before for households with low income. However, the rise in energy expenditure was less steep: between 2004 and 2014 the average household expenditure rose from 885 to 1,295, or, expressed as a share of total expenditure, from 4.3% to 6.2%. This can be interpreted as increasing energy costs had weaker impact on households with middle income than on households with low income. Expressed in real terms (after correcting by inflation) energy costs went up by 18% for households with middle income during this ten year period. Increasing electricity costs added 150 to the energy bill of households with middle income while in the case of gas this additional amount was 190, implying that energy costs other than electricity and gas slightly decreased in this period. Figure 153- Households in the middle income quintile - EU average energy related expenditure in euros and in the percentage of total expenditure. Source: Directorate General for Energy and Eurostat common data collection from National Statistical Institutes and own computations A significant, fivefold difference in energy expenditures exists across the EU Member States in the case of households with middle income. As Figure 154 shows, in 2014 the EU average household energy expenditure was 1,295, representing 6.2% of the total consumption expenditure. In Bulgaria the annual expenditure amounted to 530 (13.2% of the total consumption expenditure) while in Denmark it was 3,360 (though this amounted only to 7.9% of the total consumption expenditure). Households in Malta, Sweden and Cyprus spent less than 4% of their total expenditure on energy, while in Hungary and Slovakia this share was around 15%. Similarly to the households with lowest income, middle-income households also spent the biggest part of their energy bills on electricity in most of the EU Member States. Households with middle income however, spent more on natural gas in Italy and the UK, on liquid fuels in 165
 Source: Directorate General for Energy and")
19 Slovenia and Greece and on heat energy in Denmark than households with low income in these countries in Figure Households with middle income - Energy expenditures and the share of energy in total consumption in EU Member States (actually paid EUR, 2014) Source: Directorate General for Energy and Eurostat common data collection from National Statistical Institutes and own computations. In the lack of quintile data, number for Croatia represents the national average of households as a whole The same numbers in map format (see next figure) 166

20 Figure Households with middle income Map with Energy expenditures and the share of energy in total consumption in EU Member States in
 Source: Directorate General for Energy and Eurostat")
21 Purchasing power correction, as it is shown on Figure 156 reduces the difference in household energy expenditures across the EU to a factor of 3. Figure Households with middle income - Energy expenditures and the share of energy in total consumption in EU Member States (PPS EUR, 2014) Source: Directorate General for Energy and Eurostat common data collection from National Statistical Institutes and own computations. In the lack of quintile data, number for Croatia represents the national average of households as a whole Energy expenditures in household consumption and disposable income If household energy expenditure is also compared to disposable income besides the total consumption expenditure, important differences can be discovered in some Member States regarding how incomes and expenditures relate to each other and how does this difference might impact energy affordability. As Figure 157 shows, in the case of households in the lowest income quintile the share of energy expenditure in the disposable income is higher in most of the Member States than its share in total consumption expenditure. While the share of energy in total expenditure was 8.6% on EU average in 2014, comparing to the disposable income it was higher, 12%. In Spain, Greece, Estonia and Slovenia the difference between the two shares was more than 5 percentage points in recent years, revealing that in these countries the disposable income might be underestimated in the Household Budget Statistics 16 and there are some factors that might confirm the divergence with total household expenditure, namely: 16 Household Budget Statistics primarily concentrate on the structure of household expenditures and statistics on disposable income is not the key focus of the data collection, it is only an auxiliary indicator in HBS. 168
22 The lowest income group might also include households with negative income (e.g. self-employed people) in some Member States. The lowest income group might also consist of households whose consumption is mainly financed by wealth components (savings), for example pensioners. Consumption can be financed by loans (not included in disposable income) Consumption can be also financed by income from undeclared work. Finally, in some countries, the share of the so-called owner occupied dwellings (share of households being owner of apartments and flats they live in) is substantial and the underlying imputed rental (a non-monetary item estimating the amount of rent that would be paid if the given household were not the owner of the residence) can be a significant item in the total household expenditure. Consequently, the share of energy is underestimated in the total monetary consumption expenditure, implying that from affordability aspect the energy share within the disposable income might be closer to the reality. The difference between disposable income and total expenditure also reveals the role of social transfers in the lowest income quintile, implying that any reduction in social transfers (for example in order to help to restore the balance of national budgets) might have significantly impact the energy affordability of households with low income. In the case of households with middle income (third quintile) the difference between the share of energy expenditures in the total consumption expenditure and in the disposable income seems to be less important, as Figure 158 shows. In contrast to low income households, the share of energy is lower in the disposable income, showing that middle income households can still manage saving a part of their incomes and need less social transfers to cover their indispensable consumption expenditures, such as energy. Figure Households in the lowest income - Share of energy expenditures in the total consumption and disposable income of, 2014 Source: Directorate General for Energy and Eurostat common data collection from National Statistical Institutes and own computations. No quintile data for Croatia. Figure Households with the middle income - Share of energy expenditures in the total consumption and disposable income in
23 Source: Directorate General for Energy and Eurostat common data collection from National Statistical Institutes and own computations. In the lack of quintile data, number for Croatia represents the national average of households as a whole Change in energy expenditures in the Member States ( ) The next chart (Figure 159) shows how the share of energy in the final household consumption expenditure changed between 2004 and The red bars represent the share of energy in the first income quintile (households with the lowest income 1 st, on the left), while the green bars represents households with middle income (third quintile 3 rd, on the right) in each Member State. In most of the Member States the relative share of energy in the final household expenditure grew measurably; significant decreases in both observed quintiles could only be observed in Slovakia 18, where the share of energy in household expenditure still represented the highest across the EU in In most of the presented countries the share of energy in the total expenditure grew faster in the first income quintile than in the third quintile, implying that increasing energy costs impacted poorer households more significantly than those with middle income. 17 Due to unavailability of data in few Member States in 2014, the year used for comparison might change across countries (e.g.: 2012, 2013, etc.), however, in most cases the timespan used for depicting the evolution of the share of energy is ten years. 18 In Slovakia, due to the improving purchasing power, total household consumption expenditure grew much faster than expenditure on energy products, resulting in a decreasing share of energy within total consumption expenditure between 2004 and
24 Figure 159 Households with lowest income (1 st quintile) vs Households with middle income (3 rd quintile) - Share of energy in household expenditure over the last decade Source: Directorate General for Energy and Eurostat common data collection from National Statistical Institutes and own computations On Figure 160 changes in energy expenditures can be followed, measured in euros between 2004 and Expenditures for households being in the lowest income quintile increased by the most in the United Kingdom, Slovenia, Portugal and Denmark, by more than 500 in each case. On the other hand, energy expenditures for the poorest households increased by less than 100 in Slovakia, Hungary and Luxembourg between 2004 and As it was mentioned before, the share of energy in the total household expenditure increased faster for households in the lowest income quintile than for households with middle income. Looking at the absolute expenditures, this was the other way around, nevertheless, bigger increases in energy expenditures in households with middle income was overcompensated by increasing purchasing power and total consumption expenditure, leading to proportionally lower increase in energy expenditures than in the case of the poorest households. 19 Looking at the increase in expenditures between two time periods (see the previous footnote as well) it has to be borne in mind that changes expressed in euros might be significantly impacted by changes in currency conversion rates for countries outside the-eurozone. 171

25 Figure Households with lowest income (1 st quintile) vs Households with middle income (3 rd quintile) - Expenditure on energy in over the last decade Source: Directorate General for Energy and Eurostat common data collection from National Statistical Institutes and own computations 5.2 Share of energy in the household expenditure by income and region The following charts show the share of energy in final household consumption expenditure in the five different income quintiles in most of the EU Member States. In order to be able to present all available information, a regional approach has been followed, also enabling comparisons for the Member States with their neighbouring peers 20. As the next chart (Figure 161) shows 21, these six North Western European countries spent slightly less than the EU average on energy products in the most recent years. In the lowest income quintile households spent 5-8% of their total expenditure on energy, while in the highest income quintile this share varied between 3% and 5%. In these countries households have high household expenditures in EU comparison and this must be a principal reason why the share of energy is less than the EU average. 20 In Annex I a comparison of the timely evolution of share of energy in total consumption in each the five quintiles can be found for each EU Member States 21 In this chapter figures always show the most recent available data for each country. As the reporting periods for Household Budget Surveys are not harmonised across the EU countries, data might stem from different years. 172
26 Figure Germany, France, Belgium, Netherlands and Luxembourg - Share of energy in final household consumption expenditure per income quintiles Source: Directorate General for Energy and Eurostat common data collection from National Statistical Institutes and own computations In the South European countries presented on Figure 162 the share of energy within total household expenditures was also lower than the EU average during the last few years, though the dispersion in shares of energy within the total expenditure in different countries was quite significant 22. Given the favourable climate conditions, heating needs are lower in these countries compared to other regions of Europe; this might also contribute to lower than EU average shares on energy within the total household expenditure. Figure 162 South European countries (Spain, Portugal, Italy, Greece, Malta and Cyprus) - Share of energy in final household consumption expenditure in different income quintiles Source: Directorate General for Energy and Eurostat common data collection from National Statistical Institutes and own computations 22 It is worth noting here that the curves for different countries represent substantially different time periods, pending on the last available data, which makes cross country comparisons less reliable. 173
27 Although retail energy prices in the four Central and Eastern European countries presented on the next chart (Figure 163) were comparable or were even below the EU average in 2014, the share of energy in total household expenditures were higher than the EU average, ranging from 12% to 21% in the lowest income quintile, while in the highest income quintile it varied between 10% and 13%. Higher-than-EU average share of energy in the total household expenditure reflects the relatively low purchasing power and total consumption expenditure in these countries and might hint on the potential of improvements in energy efficiency of residential buildings. Figure Poland, Czech Republic, Slovakia and Hungary - Share of energy in final household consumption expenditure in different income quintiles Source: Directorate General for Energy and Eurostat common data collection from National Statistical Institutes and own computations In the United Kingdom the share of energy in total household expenditures in the lowest income quintile was above 10% in 2014, while in Ireland this share was 8%. In the highest income quintile the share of energy in total expenditures was around 4% in both countries. It must be noted that energy products (especially electricity) are relatively expensive in these two countries in EU comparison; this might contribute to significant shares of energy within total household expenditures, especially in the case of households with low income. 174
28 Figure United Kingdom and Ireland - Share of energy in final household consumption expenditure in different income quintiles Source: Directorate General for Energy and Eurostat common data collection from National Statistical Institutes and own computations In Sweden and Finland, though climate conditions imply significant heating needs in EU comparison, the share of energy in total household expenditures are among the lowest in the EU, reflecting high purchasing power and consumption expenditures of households in the two countries and high energy efficiency standards of residential buildings. Low retail electricity prices in EU comparison also contribute to low energy expenditures in these two countries as electricity makes up the bulk of energy expenditures. In contrast, the share of energy expenditures in the three Baltic States, where purchasing power is low in EU comparison, is significantly higher than in Sweden and Finland, in spite of the similar climate conditions and low retail electricity and gas prices in EU comparison. In Denmark, primarily owing to high domestic energy prices, the importance of energy in total household expenditures is higher than in Sweden and Finland. Figure Nordic and Baltic countries: Sweden, Finland, Denmark, Estonia, Latvia, Lithuania - Share of energy in final household consumption expenditure in different income quintiles 175
29 Source: Directorate General for Energy and Eurostat common data collection from National Statistical Institutes and own computations In Bulgaria, Croatia, Romania, and Slovenia the share of energy expenditures was higher than the EU average during the last few years, primarily owing to low purchasing power and consumption expenditure of households and low energy efficiency of residential buildings, in spite of having low retail energy prices in these four countries in EU comparison. In the case of Croatia we only have data on the share of energy in the total expenditure of households as a whole, without having information on different income quintiles. Figure South East Europe: Croatia, Slovenia, Romania and Bulgaria - Share of energy in final household consumption expenditure in different income quintiles Source: Directorate General for Energy and Eurostat common data collection from National Statistical Institutes and own computations The charts presented above reflect different climate conditions, energy prices, incomes and purchasing power and different energy efficiency of residential buildings across the EU Member States. As climate conditions are given and energy prices are in many cases depend on external factors in most of the EU Member States (though the implementation of the internal energy market should lead to more competition and better infrastructure, having beneficial impacts on energy prices), the key factors for enhancing energy affordability are to improve energy efficiency of buildings and household appliances and to increase the income and purchasing power of households on the longer run. 5.3 Decomposition of changes in the energy expenditure (prices, consumption and income effects) It is possible to analyse in each country the impact of changes in energy prices, the amount of energy consumed and household incomes for a given period in order to identify the main driving factors behind the evolution of household expenditures on energy products. In the aforementioned report on Energy prices and costs in the EU method is applied that enables a pure decomposition of both the change in energy expenditures expressed in euros and the change in energy expenditures as a share of household income. The estimation has been provided for the period for the household sector as a whole (without details on 176
30 income quintiles) for electricity, gas, heating oil, coal and wood products. As in most EU Member States the bulk of household energy expenditures are related to electricity and gas, in the following the results on these two energy products are analysed in details 23. Figure 167 shows the decomposition of the changes in expenditures for electricity between 2008 and 2013 for the EU Member States. For example, an increase in the price of electricity (holding electricity consumption constant) increases the electricity expenditure share as reflected by a positive bar in Figure 167. Figure 167 Decomposition of household expenditures on electricity changes between 2008 and 2013 Source: Ecofys report on energy prices and costs in the EU, 2016 The net effect on total energy expenditures is the sum of both bars. For example, if a positive price effect exceeds a negative quantity effect, total expenditures increase. The key insights from the decomposition are: Price effect: for almost all countries the electricity price increased between 2008 and 2013, thus leading to an increase in the electricity expenditures, but the magnitude of the price effects differs across countries, and was particularly strong (in absolute terms) in Cyprus, Germany, Spain, Finland, France, Greece and Sweden. Only minor price effects could be observed for Belgium, Bulgaria or Poland, for example. Demand effect: the direction of effect is more heterogeneous than for the price effect; for most countries this effect is somewhat smaller in magnitude than the price effect; in most countries the demand effect is negative, i.e. electricity consumption has decreased after The largest decreases, in absolute terms, are observed in Cyprus, Ireland and Croatia. The net effect in most countries is positive, i.e. total expenditures increased over time. The numbers can be interpreted as real average changes in the household expenditures on electricity. Exceptions, in which expenditures decreased, in absolute terms, substantially are Cyprus, where the negative demand effect was stronger than the positive price effect, and Hungary, where price and quantity effects were negative. 23 For the other mentioned fuels see the results in the Ecofys report: Energy prices and costs in the EU,
31 Figure 168 shows the decomposition of the changes in expenditures for natural gas for 2013 compared to 2008 for those EU Member States where data were available. The key insights are: Price effect: in all countries with the exception of Germany and Hungary, the gas price increased between 2008 and 2013, thus leading to an increase in the expenditures for gas consumption, but the magnitude of the price effects differs across countries, and was strongest (in absolute values) in the United Kingdom, Italy, and the Netherlands, reflecting the relatively large share of natural gas in total household energy consumption in these countries. Relatively small price effects could be observed for Belgium, Bulgaria, Slovenia, or Denmark. Demand effect: the direction of the demand effect is more heterogeneous than for the price effect; a few countries including Austria, Belgium, or Poland - exhibit small positive effects, i.e. increases in gas consumption; but most countries saw gas consumption decline, with the strongest negative effects occurring in Lithuania, Hungary, and the United Kingdom. Since the positive price effect tends to dominate in countries where the quantity effect was negative, expenditures for gas increased in most countries. In Lithuania, the negative quantity effect dominated the positive price effect, leading to lower gas expenditures. Conversely, in Germany, the negative price effect dominated the positive demand effect, thus leading to lower gas expenditures in 2013 compared to the base year. Figure Decomposition of household expenditures on natural gas changes between 2008 and 2013 Source: Ecofys report on energy prices and costs in the EU, 2016 As the share of energy expenditure in the income of households can be considered as an indicator for energy affordability, analysing the effects of changes in the individual factors on this share provides insights into what is actually driving observed changes in the share of energy expenditures within the income. For example, energy prices and energy consumption may have increased over time, but if income has increased even more, the income share of energy expenditures will have declined, suggesting an increase in affordability. The bars in Figure 169 show the relative impact for each of the factors (price, consumption, income) on electricity expenditure share. For example, an increase in income lowers the 178
32 electricity expenditure share, leading to a negative bar in Figure 169 ( S(Income)<0). The net effect is depicted by the change in total ( S(Total)). The value of this bar corresponds to the real change in the expenditure share. Price effect: for most countries, electricity price increased, thus leading to an increase in the electricity income share, but the magnitude of effects differs across countries. In most countries, the increase in electricity price is the dominating effect (but not for Bulgaria or in the Czech Republic), leading to an increase in the income share of electricity expenditures; Demand effect: the direction of effect is more heterogeneous than for the price effect; for most countries the output effect is smaller in magnitude than the price effect or the income effects; Income effect: for most countries, an increase in income led to a decrease in the electricity income expenditure share (but not the United Kingdom for example, which experiences a decline in real GDP over that time frame); for several countries, in particular new Member States like Bulgaria, the Czech Republic and Slovakia, the income effect is dominating the other effects, thus leading to a substantial decrease in the electricity income share. Figure 169 Decomposition of changes in the share of expenditures on electricity in household income, Source: Ecofys report on energy prices and costs in the EU, 2016 After doing the same for decomposing of natural gas expenditure income share, we observe the following: Price effect: for most countries, the natural gas price increased from 2008 to This leads to an increase in the income share of gas expenditures, but the magnitude of effects differs substantially across countries and is particularly high for the Czech Republic, for Slovakia and for United Kingdom. The increase in the gas price is the dominating effect in many countries, including Austria, Italy, Croatia and Lithuania, leading to an increase in the income share of gas expenditures; 179
33 Demand effect: similar to the electricity price the direction of the output effect for gas is more heterogeneous than for the price effect; for most countries the output effect is smaller in magnitude than the price effect or the income effects; Income effect: for most countries (but not United Kingdom and Ireland), an increase in income led to a decrease in the income share of gas expenditures; for a few countries, in particular the Czech Republic and Slovakia, the income effect is dominating the other effects, thus leading to a substantial decrease in the gas expenditure share of income. Figure Decomposition of changes in the share of expenditures on natural gas in household income, Source: Ecofys report on energy prices and costs in the EU, Impact of cost components and energy policy measures As it has already been demonstrated in the retail price chapter of this report, energy prices might often be driven by non-market elements, such as network charges and taxes and levies, being not closely related to the evolution of the energy and supply component of the retail price. As we saw in the previous part, retail energy price is an important factor in the evolution of energy expenditures for households. As in most Member States expenditures on electricity has the highest importance among energy products and most of energy policy measures are related to electricity, in the following we are going to demonstrate how expenditures on different final retail price components impact the final electricity bill households pay. 180
34 Figure 171 Impact of energy supply cost, network charges and energy policy elements on household expenditure on electricity (in Euro per household, 2015) Source: Ecofys report on energy prices and costs in the EU, 2016 In most of the Member States energy supply costs make a significant part of the final household electricity bill, as Figure 171 shows. Looking at expenditure terms in euros, the electricity supply costs were the highest in Cyprus, Ireland, Malta and Sweden in Expenditures on the network charge component were the highest in Czech Republic, Belgium and Sweden. It is apparent that among taxes and levies VAT is the most prominent element of the household expenditures; its absolute amount was the highest in Sweden in Excise taxes were particularly high in Sweden and Denmark. Renewable support schemes had significant impact on household's electricity expenditures in Germany and Italy, however, in Spain, Austria, Belgium, Denmark and the Czech Republic they also had a measurable impact on energy bills. Other policy support elements (energy efficiency support, market and system operation, CHP support, nuclear support and social tariffs) had apparently less impact in 2013 on energy bills in the EU Member States. 5.4 Reaction of households on increasing energy costs In many Member States energy prices paid by households, as it has already been mentioned, have undergone a significant increase over the last ten years, and this resulted in decrease in household energy consumption 24. However, decreasing energy consumption can only be interpreted favourably if most of the decrease is related to improvement in energy efficiency in the household sector. If the buildings and household appliances consume less energy, it 24 As in previous sections the analysis excludes transport fuels 181

35 might favourably impact energy affordability. However, in many cases households do not have other choice than reducing their energy consumption, and this does not result from improving energy efficiency. As Figure 172 shows, energy consumption in the residential sector as a whole decreased between 2004 and 2013 in many EU Member States, and in many cases this was largely due to improvements in energy efficiency. However, in some countries (e.g.: Greece, Spain) the role of energy efficiency improvements was limited, and households had to change their consumption habits, which in many cases practically meant a financial constraint relating to energy expenditures. Figure Factors behind changes in energy consumption in some EU Member States ( ) Source: ODYSSEE database Note: The analysis does not cover consumption on transport fuels Household energy use for different purposes Besides looking at how much electricity, gas and other energy products households consume in a given period, and how consumption and monetary expenditures on energy products change over a given period of time in households with different income levels, it is also meaningful to analyse the purposes of energy consumption in the residential sector. Eurostat, the Statistical Office of the European Union has started to publish the first results of a new data survey on final energy consumption of households. The objective of the new data collection is to provide information on what kind of consumption purposes household use 182

36 different energy products and carriers for. There were nine EU Member States who voluntarily submitted their 2013 data 25 to Eurostat, and from this dataset some conclusions can be drawn on a case study basis. Figure 173 shows the distribution of household electricity consumption in percentages in the nine Member States where data are already available. In most of the countries the biggest share of electricity consumption is related to lighting and electric appliances, while water heating (e.g.: in Bulgaria and Slovenia) and cooking (e.g.: in Portugal) also have important shares. Space heating also has a significant share in France and the UK. Figure 173 Household electricity consumption Shares of uses in some EU Member States, 2013 Source: Eurostat voluntary data collection on final energy consumption in households from National Statistical Institutes 25 Commission Regulation (EU) No 431/2014, as regards the implementation of annual statistics on energy consumption in households, serves as a legal basis for the data provision 183

37 As Figure 174 shows, with the exception of Portugal, where gas is principally used for water heating and cooking purposes, natural gas is mostly used for space heating in the Member States with available data. Besides Portugal cooking has an important share in Latvia and Romania, while water heating has more or less equal share within the total gas consumption in the remaining countries. Figure Household gas consumption Share of uses in some EU Member States, 2013 Source: Eurostat voluntary data collection on final energy consumption in households from National Statistical Institutes From affordability perspective space and water heating and lighting purposes are of particular importance, as increasing electricity and gas expenditures fundamentally influence the satisfaction of these basic needs and the quality of living of households. Other energy sources, such as district heating might play important role in some Member States, basically in space and water heating purposes. As keeping homes adequately warm is essential for proper living conditions, it is meaningful to see in each Member State the share of households that cannot afford to cover this elementary need. EU Member States show a great diversity regarding the share of those low income households (being below 60% of the median of the national income) that cannot afford to keep their homes adequately warm, as Figure 175 shows. In 2014 the share of such households was 23% on EU average, ranging from 2% in Luxembourg and 66% in Bulgaria. However, over the last ten years there were significant changes in many Member States in the share of such households. There were six Member States (Belgium, Bulgaria, Latvia, Lithuania, Poland and Portugal), where the share of low income households being unable to keep their homes adequately warm fell by more than ten percentage points between 2005 and On the other hand, in Greece, Italy and Malta the ratio of such households increased by more than ten percentage points, and in Slovenia and the United Kingdom the increase amounted to nine percentage points over the same period. 184
European Advertising Business Climate Index Q4 2016/Q #AdIndex2017
 European Advertising Business Climate Index Q4 216/Q1 217 ABOUT Quarterly survey of European advertising and market research companies Provides information about: managers assessment of their business
The European economy since the start of the millennium
 The European economy since the start of the millennium A STATISTICAL PORTRAIT 2018 edition 1 Since the start of the millennium, the European economy has evolved and statistics can help to better perceive
EU BUDGET AND NATIONAL BUDGETS
 DIRECTORATE GENERAL FOR INTERNAL POLICIES POLICY DEPARTMENT ON BUDGETARY AFFAIRS EU BUDGET AND NATIONAL BUDGETS 1999-2009 October 2010 INDEX Foreward 3 Table 1. EU and National budgets 1999-2009; EU-27
DG TAXUD. STAT/11/100 1 July 2011
 DG TAXUD STAT/11/100 1 July 2011 Taxation trends in the European Union Recession drove EU27 overall tax revenue down to 38.4% of GDP in 2009 Half of the Member States hiked the standard rate of VAT since
EU-28 RECOVERED PAPER STATISTICS. Mr. Giampiero MAGNAGHI On behalf of EuRIC
 EU-28 RECOVERED PAPER STATISTICS Mr. Giampiero MAGNAGHI On behalf of EuRIC CONTENTS EU-28 Paper and Board: Consumption and Production EU-28 Recovered Paper: Effective Consumption and Collection EU-28 -
REPORT FROM THE COMMISSION TO THE EUROPEAN PARLIAMENT, THE COUNCIL, THE EUROPEAN ECONOMIC AND SOCIAL COMMITTEE AND THE COMMITTEE OF THE REGIONS
 EUROPEAN COMMISSION Brussels,.4.29 COM(28) 86 final/ 2 ANNEXES to 3 ANNEX to the REPORT FROM THE COMMISSION TO THE EUROPEAN PARLIAMENT, THE COUNCIL, THE EUROPEAN ECONOMIC AND SOCIAL COMMITTEE AND THE COMMITTEE
EUROPA - Press Releases - Taxation trends in the European Union EU27 tax...of GDP in 2008 Steady decline in top corporate income tax rate since 2000
 DG TAXUD STAT/10/95 28 June 2010 Taxation trends in the European Union EU27 tax ratio fell to 39.3% of GDP in 2008 Steady decline in top corporate income tax rate since 2000 The overall tax-to-gdp ratio1
STAT/12/ October Household saving rate fell in the euro area and remained stable in the EU27. Household saving rate (seasonally adjusted)
") STAT/12/152 30 October 2012 Quarterly Sector Accounts: second quarter of 2012 Household saving rate down to 12.9% in the euro area and stable at 11. in the EU27 Household real income per capita fell by
STAT/12/152 30 October 2012 Quarterly Sector Accounts: second quarter of 2012 Household saving rate down to 12.9% in the euro area and stable at 11. in the EU27 Household real income per capita fell by
Taxation trends in the European Union Further increase in VAT rates in 2012 Corporate and top personal income tax rates inch up after long decline
 STAT/12/77 21 May 2012 Taxation trends in the European Union Further increase in VAT rates in 2012 Corporate and top personal income tax rates inch up after long decline The average standard VAT rate 1
PUBLIC PROCUREMENT INDICATORS 2011, Brussels, 5 December 2012
 PUBLIC PROCUREMENT INDICATORS 2011, Brussels, 5 December 2012 1. INTRODUCTION This document provides estimates of three indicators of performance in public procurement within the EU. The indicators are
Fiscal rules in Lithuania
 Fiscal rules in Lithuania Algimantas Rimkūnas Vice Minister, Ministry of Finance of Lithuania 3 June, 2016 Evolution of National and EU Fiscal Regulations Stability and Growth Pact (SGP) Maastricht Treaty
COMMUNICATION FROM THE COMMISSION
 EUROPEAN COMMISSION Brussels, 20.2.2019 C(2019) 1396 final COMMUNICATION FROM THE COMMISSION Modification of the calculation method for lump sum payments and daily penalty payments proposed by the Commission
Lowest implicit tax rates on labour in Malta, on consumption in Spain and on capital in Lithuania
 STAT/13/68 29 April 2013 Taxation trends in the European Union The overall tax-to-gdp ratio in the EU27 up to 38.8% of GDP in 2011 Labour taxes remain major source of tax revenue The overall tax-to-gdp
Environmental taxes in Country Specific Recommendations for Denmark
 European Semester 2015 Environmental taxes in Country Specific Recommendations for Denmark During the last years, environmental taxes have not been the focus in EU Commission s country specific recommendations
Households capital available for renovation
 Households capital available for Methodical note Copenhagen Economics, 22 February 207 The task at hand has been twofold: firstly, we were to calculate an estimate of households average capital available
STATISTICAL REFLECTIONS
 STATISTICAL REFLECTIONS 29 January 2016 Contents Introduction...1 Changes in property transactions...1 Annual price indices...1 Quarterly pure price index...2 Factors of overall price in the market of
NOTE. for the Interparliamentary Meeting of the Committee on Budgets
 NOTE for the Interparliamentary Meeting of the Committee on Budgets THE ROLE OF THE EU BUDGET TO SUPPORT MEMBER STATES IN ACHIEVING THEIR ECONOMIC OBJECTIVES AS AGREED WITHIN THE FRAMEWORK OF THE EUROPEAN
The Tax Burden of Typical Workers in the EU
 The Tax Burden of Typical Workers in the EU 28 2018 James Rogers Cécile Philippe Institut Économique Molinari, Paris Bruxelles TABLE OF CONTENTS Abstract... 3 Background... 3 Main Results... 4 On average,
4 Distribution of Income, Earnings and Wealth
 NERI Quarterly Economic Facts Autumn 2014 4 Distribution of Income, Earnings and Wealth Indicator 4.1 Indicator 4.2a Indicator 4.2b Indicator 4.3a Indicator 4.3b Indicator 4.4 Indicator 4.5a Indicator
Courthouse News Service
 14/2009-30 January 2009 Sector Accounts: Third quarter of 2008 Household saving rate at 14.4% in the euro area and 10.7% in the EU27 Business investment rate at 23.5% in the euro area and 23.6% in the
STATISTICAL REFLECTIONS
 STATISTICAL REFLECTIONS 7 November 2016 Housing prices, housing price index, Quarter 2 2016* Contents Introduction...1 Changes in property transactions...1 Annual price indices...2 Quarterly pure price
Consumer credit market in Europe 2013 overview
 Consumer credit market in Europe 2013 overview Crédit Agricole Consumer Finance published its annual survey of the consumer credit market in 28 European Union countries for seven years running. 9 July
2017 Figures summary 1
 Annual Press Conference on January 18 th 2018 EIB Group Results 2017 2017 Figures summary 1 European Investment Bank (EIB) financing EUR 69.88 billion signed European Investment Fund (EIF) financing EUR
Quarterly Financial Accounts Household net worth reaches new peak in Q Irish Household Net Worth
 Quarterly Financial Accounts Q4 2017 4 May 2018 Quarterly Financial Accounts Household net worth reaches new peak in Q4 2017 Household net worth rose by 2.1 per cent in Q4 2017. It now exceeds its pre-crisis
Council conclusions on "First Annual Report to the European Council on EU Development Aid Targets"
 COUNCIL OF THE EUROPEAN UNION Council conclusions on "First Annual Report to the European Council on EU Development Aid Targets" 3091st FOREIGN AFFAIRS Council meeting Brussels, 23 May 2011 The Council
Burden of Taxation: International Comparisons
 Burden of Taxation: International Comparisons Standard Note: SN/EP/3235 Last updated: 15 October 2008 Author: Bryn Morgan Economic Policy & Statistics Section This note presents data comparing the national
Non-financial corporations - statistics on profits and investment
 Non-financial corporations - statistics on profits and investment Statistics Explained Data extracted in May 2018. Planned article update: May 2019. This article focuses on investment and the distribution
3 Labour Costs. Cost of Employing Labour Across Advanced EU Economies (EU15) Indicator 3.1a
 Indicator 3.1a") 3 Labour Costs Indicator 3.1a Indicator 3.1b Indicator 3.1c Indicator 3.2a Indicator 3.2b Indicator 3.3 Indicator 3.4 Cost of Employing Labour Across Advanced EU Economies (EU15) Cost of Employing Labour
3 Labour Costs Indicator 3.1a Indicator 3.1b Indicator 3.1c Indicator 3.2a Indicator 3.2b Indicator 3.3 Indicator 3.4 Cost of Employing Labour Across Advanced EU Economies (EU15) Cost of Employing Labour
Live Long and Prosper? Demographic Change and Europe s Pensions Crisis. Dr. Jochen Pimpertz Brussels, 10 November 2015
 Live Long and Prosper? Demographic Change and Europe s Pensions Crisis Dr. Jochen Pimpertz Brussels, 10 November 2015 Old-age-dependency ratio, EU28 45,9 49,4 50,2 39,0 27,5 31,8 2013 2020 2030 2040 2050
Poverty and social inclusion indicators
 Poverty and social inclusion indicators The poverty and social inclusion indicators are part of the common indicators of the European Union used to monitor countries progress in combating poverty and social
THE ECONOMY AND THE BANKING SECTOR IN BULGARIA
 THE ECONOMY AND THE BANKING SECTOR IN BULGARIA SECOND QUARTER OF 2017 Sofia HIGHLIGHTS The Bulgarian economy recorded growth of 3,9% on an annual basis in Q1 2017, driven by the domestic demand; The inflation
Quarterly Gross Domestic Product of Montenegro 3 rd quarter 2017
 MONTENEGRO STATISTICAL OFFICE R E L E A S E No: 224 Podgorica, 22 December 2017 When using the data, please name the source Quarterly Gross Domestic Product of Montenegro 3 rd quarter 2017 The release
WP4: 2030 (RES) targets & effort sharing
 targets & effort sharing") WP4: 2030 (RES) targets & effort sharing Authors: Anne Held, Mario Ragwitz, Simone Steinhilber, Tobias Boßmann Fraunhofer ISI Contact: Email: anne.held@isi.fraunhofer.de Towards2030-dialogue mid-term conference
WP4: 2030 (RES) targets & effort sharing Authors: Anne Held, Mario Ragwitz, Simone Steinhilber, Tobias Boßmann Fraunhofer ISI Contact: Email: anne.held@isi.fraunhofer.de Towards2030-dialogue mid-term conference
The Architectural Profession in Europe 2012
 The Architectural Profession in Europe 2012 - A Sector Study Commissioned by the Architects Council of Europe Chapter 2: Architecture the Market December 2012 2 Architecture - the Market The Construction
Social Situation Monitor - Glossary
 Social Situation Monitor - Glossary Active labour market policies Measures aimed at improving recipients prospects of finding gainful employment or increasing their earnings capacity or, in the case of
Social Protection and Social Inclusion in Europe Key facts and figures
 MEMO/08/625 Brussels, 16 October 2008 Social Protection and Social Inclusion in Europe Key facts and figures What is the report and what are the main highlights? The European Commission today published
HOUSEHOLD FINANCE AND CONSUMPTION SURVEY: A COMPARISON OF THE MAIN RESULTS FOR MALTA WITH THE EURO AREA AND OTHER PARTICIPATING COUNTRIES
 HOUSEHOLD FINANCE AND CONSUMPTION SURVEY: A COMPARISON OF THE MAIN RESULTS FOR MALTA WITH THE EURO AREA AND OTHER PARTICIPATING COUNTRIES Article published in the Quarterly Review 217:2, pp. 27-33 BOX
Taxation trends in the European Union EU27 tax ratio at 39.8% of GDP in 2007 Steady decline in top personal and corporate income tax rates since 2000
 DG TAXUD STAT/09/92 22 June 2009 Taxation trends in the European Union EU27 tax ratio at 39.8% of GDP in 2007 Steady decline in top personal and corporate income tax rates since 2000 The overall tax-to-gdp
CANADA EUROPEAN UNION
 THE EUROPEAN UNION S PROFILE Economic Indicators Gross domestic product (GDP) at purchasing power parity (PPP): US$20.3 trillion (2016) GDP per capita at PPP: US$39,600 (2016) Population: 511.5 million
Borderline cases for salary, social contribution and tax
 Version Abstract 1 (5) 2015-04-21 Veronica Andersson Salary and labour cost statistics Borderline cases for salary, social contribution and tax (Workshop on Labour Cost Survey, Rome, Italy 5-6 May 2015)
EMPLOYMENT RATE IN EU-COUNTRIES 2000 Employed/Working age population (15-64 years)
") EMPLOYMENT RATE IN EU-COUNTRIES 2 Employed/Working age population (15-64 years EU-15 Denmark Netherlands Great Britain Sweden Portugal Finland Austria Germany Ireland Luxembourg France Belgium Greece Spain
EMPLOYMENT RATE IN EU-COUNTRIES 2 Employed/Working age population (15-64 years EU-15 Denmark Netherlands Great Britain Sweden Portugal Finland Austria Germany Ireland Luxembourg France Belgium Greece Spain
THE ECONOMY AND THE BANKING SECTOR IN BULGARIA
 THE ECONOMY AND THE BANKING SECTOR IN BULGARIA THIRD QUARTER OF 2018 SOFIA HIGHLIGHTS The Bulgarian economy recorded growth of 3,2% on an annual basis in Q2 2018, driven by the private consumption and
Key Trends of Energy Transition in the EU-28 Region
 Key Trends of Energy Transition in the EU-28 Region Jarmo Vehmas, Jyrki Luukkanen & Jari Kaivo-oja Session 13, Innovation in Future Technology June 2017, Turku Finland Futures Research Centre, Turku School
Quarterly Gross Domestic Product of Montenegro 2st quarter 2016
 Government of Montenegro Statistical Office of Montenegro Quarterly Gross Domestic Product of Montenegro 2st quarter 2016 The release presents the preliminary data for quarterly gross domestic product
Electricity & Gas Prices in Ireland. Annex Business Electricity Prices per kwh 2 nd Semester (July December) 2016
 2016") Electricity & Gas Prices in Ireland Annex Business Electricity Prices per kwh 2 nd Semester (July December) 2016 ENERGY POLICY STATISTICAL SUPPORT UNIT 1 Electricity & Gas Prices in Ireland Annex Business
Electricity & Gas Prices in Ireland Annex Business Electricity Prices per kwh 2 nd Semester (July December) 2016 ENERGY POLICY STATISTICAL SUPPORT UNIT 1 Electricity & Gas Prices in Ireland Annex Business
Technical report on macroeconomic Member State results of the EUCO policy scenarios
 Technical report on macroeconomic Member State results of the EUCO policy scenarios By E3MLab, December 2016 Contents Introduction... 1 Modelling the macro-economic impacts of the policy scenarios with
The regional analyses
 The regional analyses EU & EFTA On average, in the EU & EFTA region, the case study company has a Total Tax Rate of 41.1%, made 13.1 tax payments and took 179 hours to comply with its tax obligations in
Single Market Scoreboard
 Single Market Scoreboard Performance per Member State Romania (Reporting period: 2017) Transposition of law In 2016, the Member States had to transpose 66 new directives, which represents a large increase
IZMIR UNIVERSITY of ECONOMICS
 IZMIR UNIVERSITY of ECONOMICS Department of International Relations and the European Union TURKEY EU RELATIONS ( EU308) FOREIGN DIRECT INVESTMENT IN THE EUROPEAN UNION AND TURKEY Prepared By: Büke OŞAFOĞLU
May 2012 Euro area international trade in goods surplus of 6.9 bn euro 3.8 bn euro deficit for EU27
 108/2012-16 July 2012 May 2012 Euro area international trade in goods surplus of 6.9 3.8 deficit for EU27 The first estimate for the euro area 1 (EA17) trade in goods balance with the rest of the world
Consumer Credit. Introduction. June, the 6th (2013)
") Consumer Credit in Europe at end-2012 Introduction Crédit Agricole Consumer Finance has published its annual survey of the consumer credit market in 27 European Union countries (EU-27) for the sixth year
Consumer Credit in Europe at end-2012 Introduction Crédit Agricole Consumer Finance has published its annual survey of the consumer credit market in 27 European Union countries (EU-27) for the sixth year
THE IMPACT OF THE PUBLIC DEBT STRUCTURE IN THE EUROPEAN UNION MEMBER COUNTRIES ON THE POSSIBILITY OF DEBT OVERHANG
 THE IMPACT OF THE PUBLIC DEBT STRUCTURE IN THE EUROPEAN UNION MEMBER COUNTRIES ON THE POSSIBILITY OF DEBT OVERHANG Robert Huterski, PhD Nicolaus Copernicus University in Toruń Faculty of Economic Sciences
Comparing pay trends in the public services and private sector. Labour Research Department 7 June 2018 Brussels
 Comparing pay trends in the public services and private sector Labour Research Department 7 June 2018 Brussels Issued to be covered The trends examined The varying patterns over 14 years and the impact
June 2012 Euro area international trade in goods surplus of 14.9 bn euro 0.4 bn euro surplus for EU27
 121/2012-17 August 2012 June 2012 Euro area international trade in goods surplus of 14.9 0.4 surplus for EU27 The first estimate for the euro area 1 (EA17) trade in goods balance with the rest of the world
January 2014 Euro area international trade in goods surplus 0.9 bn euro 13.0 bn euro deficit for EU28
 STAT/14/41 18 March 2014 January 2014 Euro area international trade in goods surplus 0.9 13.0 deficit for EU28 The first estimate for the euro area 1 (EA18) trade in goods balance with the rest of the
August 2012 Euro area international trade in goods surplus of 6.6 bn euro 12.6 bn euro deficit for EU27
 146/2012-16 October 2012 August 2012 Euro area international trade in goods surplus of 6.6 12.6 deficit for EU27 The first estimate for the euro area 1 (EA17) trade in goods balance with the rest of the
August 2005 Euro-zone external trade deficit 2.6 bn euro 14.2 bn euro deficit for EU25
 STAT/05/132 20 October 2005 August 2005 Euro-zone external trade deficit 2.6 14.2 deficit for EU25 The first estimate for euro-zone 1 trade with the rest of the world in August 2005 was a 2.6 billion euro
Themes Income and wages in Europe Wages, productivity and the wage share Working poverty and minimum wage The gender pay gap
 5. W A G E D E V E L O P M E N T S At the ETUC Congress in Seville in 27, wage developments in Europe were among the most debated issues. One of the key problems highlighted in this respect was the need
74 ECB THE 2012 MACROECONOMIC IMBALANCE PROCEDURE
 Box 7 THE 2012 MACROECONOMIC IMBALANCE PROCEDURE This year s European Semester (i.e. the framework for EU policy coordination introduced in 2011) includes, for the first time, the implementation of the
ANNUAL REVIEW BY THE COMMISSION. of Member States' Annual Activity Reports on Export Credits in the sense of Regulation (EU) No 1233/2011
 No 1233/2011") EUROPEAN COMMISSION Brussels, 7.2.2017 COM(2017) 67 final ANNUAL REVIEW BY THE COMMISSION of Member States' Annual Activity Reports on Export Credits in the sense of Regulation (EU) No 1233/2011 EN EN
EUROPEAN COMMISSION Brussels, 7.2.2017 COM(2017) 67 final ANNUAL REVIEW BY THE COMMISSION of Member States' Annual Activity Reports on Export Credits in the sense of Regulation (EU) No 1233/2011 EN EN
EU KLEMS Growth and Productivity Accounts March 2011 Update of the November 2009 release
 EU KLEMS Growth and Productivity Accounts March 2011 Update of the November 2009 release Description of methodology and country notes Prepared by Reitze Gouma, Klaas de Vries and Astrid van der Veen-Mooij
Delegations will find in the Annex to this note the above Council Conclusions, which were adopted by the Council on 23 May 2011.
 COUNCIL OF THE EUROPEAN UNION Brussels, 23 May 2011 10593/11 DEVGEN 162 FIN 350 ACP 131 PTOM 28 COLAT 17 COASI 92 NOTE From: General Secretariat No. prev. doc.: 10187/11 Subject: Council Conclusions: First
3 Labour Costs. Cost of Employing Labour Across Advanced EU Economies (EU15) Indicator 3.1a
 Indicator 3.1a") 3 Labour Costs Indicator 3.1a Indicator 3.1b Indicator 3.1c Indicator 3.2a Indicator 3.2b Indicator 3.3 Indicator 3.4 Cost of Employing Labour Across Advanced EU Economies (EU15) Cost of Employing Labour
3 Labour Costs Indicator 3.1a Indicator 3.1b Indicator 3.1c Indicator 3.2a Indicator 3.2b Indicator 3.3 Indicator 3.4 Cost of Employing Labour Across Advanced EU Economies (EU15) Cost of Employing Labour
Study on the Contribution of Sport to Economic Growth and Employment in the EU
 Study on the Contribution of Sport to Economic Growth and Employment in the EU Study commissioned by the European Commission, Directorate-General Education and Culture Executive Summary August 2012 SportsEconAustria
June 2014 Euro area international trade in goods surplus 16.8 bn 2.9 bn surplus for EU28
 127/2014-18 August 2014 June 2014 Euro area international trade in goods surplus 16.8 bn 2.9 bn surplus for EU28 The first estimate for the euro area 1 (EA18) trade in goods balance with the rest of the
Special Eurobarometer 418 SOCIAL CLIMATE REPORT
 Special Eurobarometer 418 SOCIAL CLIMATE REPORT Fieldwork: June 2014 Publication: November 2014 This survey has been requested by the European Commission, Directorate-General for Employment, Social Affairs
European Commission Directorate-General "Employment, Social Affairs and Equal Opportunities" Unit E1 - Social and Demographic Analysis
 Research note no. 1 Housing and Social Inclusion By Erhan Őzdemir and Terry Ward ABSTRACT Housing costs account for a large part of household expenditure across the EU.Since everyone needs a house, the
Measuring financial protection: an approach for the WHO European Region
 Division of Health Systems and Public Health WHO Regional Office for Europe Measuring financial protection: an approach for the WHO European Region Jon Cylus WHO Barcelona Office for Health Systems Strengthening
January 2005 Euro-zone external trade deficit 2.2 bn euro 14.0 bn euro deficit for EU25
 42/2005-23 March 2005 January 2005 Euro-zone external trade deficit 2.2 14.0 deficit for EU25 The first estimate for euro-zone 1 trade with the rest of the world in January 2005 was a 2.2 billion euro
The intergenerational divide in Europe. Guntram Wolff
 The intergenerational divide in Europe Guntram Wolff Outline An overview of key inequality developments The key drivers of intergenerational inequality Macroeconomic policy Orientation and composition
DYNAMICS OF BUDGETARY REVENUE IN THE CONDITIONS OF ROMANIAN INTEGRATION IN THE EUROPEAN UNION - A CONSEQUENTLY OF THE TAX AND HARMONIZATION POLICY
 260 Finance Challenges of the Future DYNAMICS OF BUDGETARY REVENUE IN THE CONDITIONS OF ROMANIAN INTEGRATION IN THE EUROPEAN UNION - A CONSEQUENTLY OF THE TAX AND HARMONIZATION POLICY Mădălin CINCĂ, PhD
Investment in France and the EU
 Investment in and the EU Natacha Valla March 2017 22/02/2017 1 Change relative to 2008Q1 % of GDP Slow recovery of investment, and with strong heterogeneity Overall Europe s recovery in investment is slow,
First estimate for 2011 Euro area external trade deficit 7.7 bn euro bn euro deficit for EU27
 27/2012-15 February 2012 First estimate for 2011 Euro area external trade deficit 7.7 152.8 deficit for EU27 The first estimate for the euro area 1 (EA17) trade in goods balance with the rest of the world
Investment in Germany and the EU
 Investment in Germany and the EU Pedro de Lima Head of the Economics Studies Division Economics Department Berlin 19/12/2016 11/01/2017 1 Slow recovery of investment, with strong heterogeneity Overall
A BRIEF OVERVIEW OF THE ACTIVITY EFFICIENCY OF THE BANKING SYSTEM IN ROMANIA WITHIN A EUROPEAN CONTEXT
 A BRIEF OVERVIEW OF THE ACTIVITY EFFICIENCY OF THE BANKING SYSTEM IN ROMANIA WITHIN A EUROPEAN CONTEXT Silvia GHIȚĂ-MITRESCU Ovidius University of Constanta Faculty of Economic Sciences Constanța, Romania
ILO World of Work Report 2013: EU Snapshot
 Greece Spain Ireland Poland Belgium Portugal Eurozone France Slovenia EU-27 Cyprus Denmark Netherlands Italy Bulgaria Slovakia Romania Lithuania Latvia Czech Republic Estonia Finland United Kingdom Sweden
March 2005 Euro-zone external trade surplus 4.2 bn euro 6.5 bn euro deficit for EU25
 STAT/05/67 24 May 2005 March 2005 Euro-zone external trade surplus 4.2 6.5 deficit for EU25 The first estimate for euro-zone 1 trade with the rest of the world in March 2005 was a 4.2 billion euro surplus,
Lithuania: in a wind of change. Robertas Dargis President of the Lithuanian Confederation of Industrialists
 Lithuania: in a wind of change Robertas Dargis President of the Lithuanian Confederation of Industrialists 2017 06 15 Lithuanian Confederation of Industrialists - the largest business organisation in Lithuania
Statistics Brief. Investment in Inland Transport Infrastructure at Record Low. Infrastructure Investment. July
 Statistics Brief Infrastructure Investment July 2015 Investment in Inland Transport Infrastructure at Record Low The latest update of annual transport infrastructure investment and maintenance data collected
Macroprudential indicators of the financial sector
 Macroprudential indicators of the financial sector June 6 Macroeconomic risk indicators... Manufacturing Purchasing Managers Index (PMI) in selected economies... Services Purchasing Managers Index (PMI)
Current health expenditure increased 3.0% in 2017
 Health Satellite Account 15 17Pe June 18 Current health expenditure increased 3. in 17 Current health expenditure continued to increase in 17 (+ 3.), at a slower pace than GDP (+ 4.1), decelerating compared
Quarterly Gross Domestic Product of Montenegro 4 th quarter 2018 (p)
") MONTENEGRO STATISTICAL OFFICE R E L E A S E No: 46 Podgorica, 22 March 2019 When using the data, please name the source Quarterly Gross Domestic Product of Montenegro 4 th quarter 2018 (p) The release
MONTENEGRO STATISTICAL OFFICE R E L E A S E No: 46 Podgorica, 22 March 2019 When using the data, please name the source Quarterly Gross Domestic Product of Montenegro 4 th quarter 2018 (p) The release
REGIONAL PROGRESS OF THE LISBON STRATEGY OBJECTIVES IN THE EUROPEAN REGION EGRI, ZOLTÁN TÁNCZOS, TAMÁS
 REGIONAL PROGRESS OF THE LISBON STRATEGY OBJECTIVES IN THE EUROPEAN REGION EGRI, ZOLTÁN TÁNCZOS, TAMÁS Key words: Lisbon strategy, mobility factor, education-employment factor, human resourches. CONCLUSIONS
PREZENTĀCIJAS NOSAUKUMS
 Which Structural Reforms Matter for economic growth: PREZENTĀCIJAS NOSAUKUMS Evidence from Bayesian Model Averaging Olegs Krasnopjorovs (Latvijas Banka) 2 nd Lisbon Conference on Structural Reforms 06.07.2017
Statistics Brief. Inland transport infrastructure investment on the rise. Infrastructure Investment. August
 Statistics Brief Infrastructure Investment August 2017 Inland transport infrastructure investment on the rise After nearly five years of a downward trend in inland transport infrastructure spending, 2015
EMPLOYMENT RATE Employed/Working age population (15-64 years)
") 1 EMPLOYMENT RATE 1980-2003 Employed/Working age population (15-64 years 80 % Finland (Com 75 70 65 60 EU-15 Finland (Stat. Fin. 55 50 80 82 84 86 88 90 92 94 96 98 00 02 9.9.2002/SAK /TL Source: European
1 EMPLOYMENT RATE 1980-2003 Employed/Working age population (15-64 years 80 % Finland (Com 75 70 65 60 EU-15 Finland (Stat. Fin. 55 50 80 82 84 86 88 90 92 94 96 98 00 02 9.9.2002/SAK /TL Source: European
REPORT FROM THE COMMISSION TO THE EUROPEAN PARLIAMENT AND THE COUNCIL. on the quality of fiscal data reported by Member States in 2017
 EUROPEAN COMMISSION Brussels, 8.3.2018 COM(2018) 112 final REPORT FROM THE COMMISSION TO THE EUROPEAN PARLIAMENT AND THE COUNCIL on the quality of fiscal data reported by Member States in 2017 EN EN REPORT
In 2008 gross expenditure on social protection in EU-27 accounted for 26.4 % of GDP
 Population and social conditions Author: Antonella PUGLIA Statistics in focus 17/2011 In 2008 gross expenditure on social protection in EU-27 accounted for 26.4 % of GDP Social protection benefits are
Trends in the European Investment Fund Industry. in the Third Quarter of 2016
 Quarterly Statistical Release December 2016, N 67 This release and other statistical releases are available on Efama s website (www.efama.org) Trends in the European Investment Fund Industry in the Third
Understanding Electricity & Gas Prices in Ireland 1 ST SEMESTER (JANUARY JUNE) 2009
 2009") Understanding Electricity & Gas Prices in Ireland 1 ST SEMESTER (JANUARY JUNE) 2009 Understanding Electricity & Gas Prices in Ireland 1 st Semester (January June) 2009 Report prepared by Martin Howley,
Understanding Electricity & Gas Prices in Ireland 1 ST SEMESTER (JANUARY JUNE) 2009 Understanding Electricity & Gas Prices in Ireland 1 st Semester (January June) 2009 Report prepared by Martin Howley,
EIOPA Statistics - Accompanying note
 EIOPA Statistics - Accompanying note Publication references: Published statistics: [Balance sheet], [Premiums, claims and expenses], [Own funds and SCR] Disclaimer: Data is drawn from the published statistics
Quarterly Gross Domestic Product of Montenegro for period 1 st quarter rd quarter 2016
 Government of Montenegro Statistical Office of Montenegro Quarterly Gross Domestic Product of Montenegro for period 1 st quarter 015 - rd quarter 016 The release presents the final results of quarterly
Trends in the European Investment Fund Industry. in the Third Quarter of 2018
 Quarterly Statistical Release December 2018 N 75 This release and other statistical releases are available on Efama s website (www.efama.org) Trends in the European Investment Fund Industry in the Third
EIOPA Statistics - Accompanying note
 EIOPA Statistics - Accompanying note Publication references: and Published statistics: [Balance sheet], [Premiums, claims and expenses], [Own funds and SCR] Disclaimer: Data is drawn from the published
Preliminary results of International Trade in 2014: in nominal terms exports increased by 1.8% and imports increased by 3.
 International Trade Statistics 7 July, 215 Preliminary results of International Trade in : in nominal terms exports increased by 1.8% and imports increased by 3.2% vis-à-vis 213 In, exports of goods increased
December 2010 Euro area annual inflation up to 2.2% EU up to 2.6%
 STAT/11/9 14 January 2011 December 2010 Euro area annual inflation up to 2.2% EU up to 2.6% Euro area 1 annual inflation was 2.2% in December 2010 2, up from 1.9% in November. A year earlier the rate was
HOUSING AFFORDABILITY IN THE EU Current situation and recent trends
 HOUSING AFFORDABILITY IN THE EU Current situation and recent trends Alice Pittini CECODHAS Housing Europe s Observatory RESEARCH BRIEFING Year 5 / Number 1, January 2012 http://www.housingeurope.eu/publication/research-briefings
EIOPA Statistics - Accompanying note
 EIOPA Statistics - Accompanying note Publication reference: Published statistics: [Balance sheet], [Premiums, claims and expenses], [Own funds and SCR] Disclaimer: Data is drawn from the published statistics
THE ECONOMY AND THE BANKING SECTOR IN BULGARIA IN 2018
 THE ECONOMY AND THE BANKING SECTOR IN BULGARIA IN 2018 SOFIA HIGHLIGHTS In 2018 the Bulgarian economy recorded growth of 3,1% on an annual basis, driven by the private consumption and investments; The
THE EVOLUTION OF SOCIAL INDICATORS DEVELOPED AT THE LEVEL OF THE EUROPEAN UNION AND THE NEED TO STIMULATE THE ACTIVITY OF SOCIAL ENTERPRISES
 Scientific Bulletin Economic Sciences, Volume 13/ Issue2 THE EVOLUTION OF SOCIAL INDICATORS DEVELOPED AT THE LEVEL OF THE EUROPEAN UNION AND THE NEED TO STIMULATE THE ACTIVITY OF SOCIAL ENTERPRISES Daniela