Quality of Life of Public Servants in European Comparison
|
|
|
- Caitlin O’Connor’
- 5 years ago
- Views:
Transcription
1 Quality of Life of Public Servants in European Comparison Franz Rothenbacher, Mannheim 7th ISQOLS Conference, Grahamstown, South Africa, 2006
2 1. The research question 2. The civil service and welfare production 3. The challenges 3.1 The demographic challenge 3.2 The economic challenge 3.3 The organizational challenge 4. The responses: adaptation to these developments 4.1 Devolution of public service employment 4.2 Adapting working conditions 4.3 Adapting income 4.4 Adapting the pension systems 5. The actors 6. Effects on the quality of life Conclusions
3 1. The research question Adapting the welfare state of the public service employees to the demographic, economic and organizational challenges What are the consequences for... Employment Working conditions Income and pensions How are pension systems adapted to the changing environment? What is the role of different actors in this policy field? What are the effects on the quality of life?
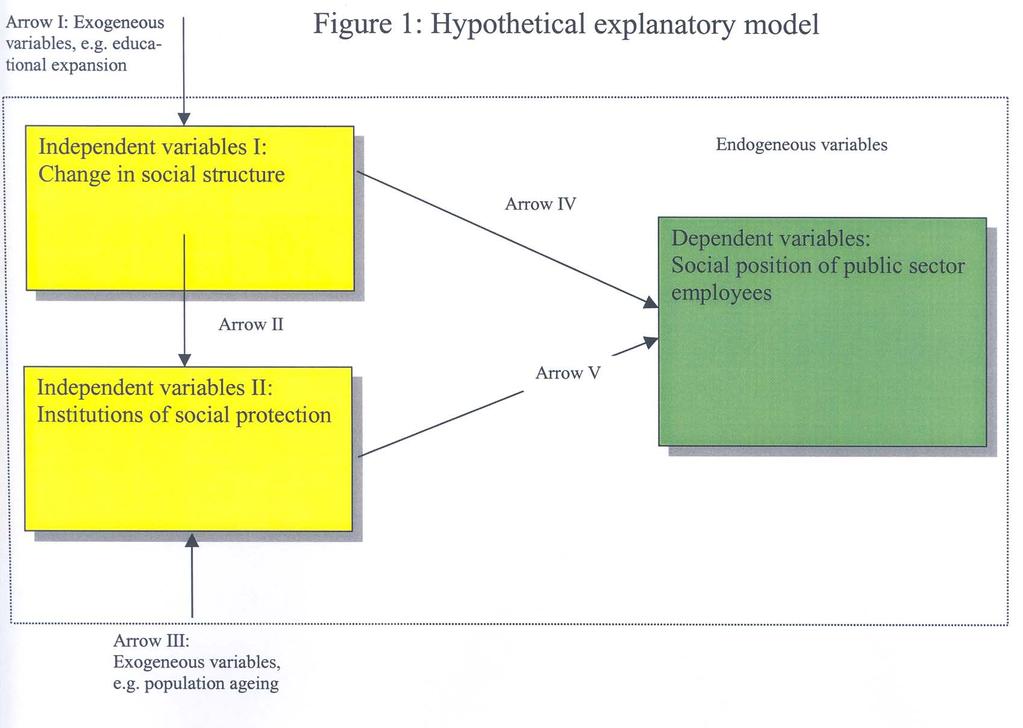
4 2. The civil service and welfare production The following model proposes that the social situation of public sector employees is determined by two sets of variables: Variables describing the changing social structure of public employees Variables describing the changing social security institutions for public employees Both sets of independent variables interact The model proposes a view that emphasizes the welfare produced for public sector employees either by socio-structural arrangements and by the institutions of social protection
5
6 2. The civil service and welfare production (contd.) Table 1 shows the operationalization of the three dimensions proposed in the hypothetical model. There are measurement dimensions for each of the sets of variables Indicators are proposed for the measurement of each of these dimensions
7
8 3. The challenges Three main challenges: 1. The demographic challenge 2. The economic challenge 3. The organizational challenge
9 3.1 The demographic challenge Overall: ageing of the population, caused by Long-term fertility decline 2. Long-term rise in life expectancy 3. The age-structure is becoming increasingly unfavourable with a growing share of the elderly related to the segment of the people of working age.
10 Figure 2: Total Fertility Rate (TFR) in European Countries, ,00 4,50 4,00 3,50 T F R 3,00 2,50 2,00 1,50 1,00 0,50 0, Austria Belgium Czechoslovakia Czech Republic Denmark Finland France Germany FRG GDR Greece Hungary Iceland Ireland Italy Luxembourg The Netherlands Norway Poland Portugal Slovak Republic Spain Sweden Switzerland UK
11 Figure 3A: Further life expectancy of men in Europe at age 60, 1850/ (years) Figure 3B: Further life expectancy of women in Europe at age 60, 1850/ (years) 25,00 25,00 23,00 23,00 21,00 21,00 19,00 19,00 17,00 17,00 Years 15,00 Years 15,00 13,00 13,00 11,00 11,00 9,00 9,00 7,00 7,00 5, , Austria Belgium Czechoslovakia Czech Republic Slovak Republic Denmark Finland France Germany West Germany East Germany Greece Hungary Iceland Ireland Italy Luxembourg The Netherlands Norway Poland Portugal Spain Sweden Switzerland United Kingdom England and Wales Scotland Northern Ireland Austria Belgium Czechoslovakia Czech Republic Slovak Republic Denmark Finland France Germany West Germany East Germany Greece Hungary Iceland Ireland Italy Luxembourg The Netherlands Norway Poland Portugal Spain Sweden Switzerland United Kingdom England and Wales Scotland Northern Ireland
12 Figure 3C: Surplus mortality of men in Europe at age 60, 1850/ (years) 6,00 5,00 4,00 3,00 Years 2,00 1,00 0,00-1, ,00 Austria Belgium Czechoslovakia Czech Republic Slovak Republic Denmark Finland France Germany West Germany East Germany Greece Hungary Iceland Ireland Italy Luxembourg The Netherlands Norway Poland Portugal Spain Sweden Switzerland United Kingdom England and Wales Scotland Northern Ireland
13 Figure 4: Old-age dependency ratio in Europe, (persons aged 65+/persons aged 15-64) 0,30 0,25 0,20 Ratio 0,15 0,10 0,05 0, Austria Belgium Czech Republic Slovak Republic Denmark Finland France Germany West Germany East Germany Greece Hungary Iceland Ireland Italy Luxembourg The Netherlands Norway Poland Portugal Spain Sweden Switzerland United Kingdom England and Wales Scotland Northern Ireland
14 3.2 The economic challenge Five main economic challenges: 1. The fiscal crisis of the state 2. Expansion of public service employment 3. The politics of early retirement and postponement of work entry 4. Rising public service pay and pension costs 5. Upgrading of positions due to educational expansion
15 Figure 5: Total Outlays of Government as % of GDP, % 80,0 70,0 60,0 50,0 40,0 30,0 20,0 10,0 0, Denmark Finland Iceland Norway Sweden Australia Canada New Zealand United Kingdom United States Belgium France Ireland Italy Luxembourg Portugal Spain Austria Germany Netherlands Switzerland
16 Figure 6: Persons Employed in the Public Sector or Service in European Countries, (% of all women and men in employment) Belgium France Germany (West) Germany (East) Sweden United Kingdom UK Sweden % France Belgium Germany- West D-East
17 Figure 7A: Labour Force Participation Rates, Men Aged 15-24, Figure 7B: Labour Force Participation Rates, Women Aged 15-24, ,0 Denmark 90,0 80,0 70,0 60,0 % 50,0 40,0 30,0 20, Finland France Germany Greece Iceland Italy Netherlands Norway Portugal Spain Sweden United Kingdom United States Japan 80,0 70,0 60,0 % 50,0 40,0 30,0 20, Denmark Finland France Germany Greece Iceland Italy Netherlands Norway Portugal Spain Sweden United Kingdom United States Japan
18 Figure 8A: Labour Force Participation Rates, Men Aged 65+, Figure 8B: Labour Force Participation Rates, Women Aged 65+, ,0 45,0 40,0 35,0 30,0 25,0 % 20,0 15,0 10,0 5,0 Denmark Finland France Germany Greece Iceland Italy Netherlands Norway Portugal Spain Sweden United Kingdom United States Japan 40,0 35,0 30,0 25,0 % 20,0 15,0 10,0 5,0 Denmark Finland France Germany Greece Iceland Italy Netherlands Norway Portugal Spain Sweden United Kingdom United States Japan 0, ,
19 Figure 9A: Labour Force Participation Rates, Men Aged 55-64, Figure 9B: Labour Force Participation Rates, Women Aged 55-64, ,0 100,0 % 90,0 80,0 70,0 60,0 50,0 40,0 30,0 20,0 10,0 Denmark Finland France Germany Greece Iceland Italy Netherlands Norway Portugal Spain Sweden United Kingdom United States Japan % 90,0 80,0 70,0 60,0 50,0 40,0 30,0 20,0 10,0 Denmark Finland France Germany Greece Iceland Italy Netherlands Norway Portugal Spain Sweden United Kingdom United States Japan 0, ,
20 Figure 10A: Compensation Costs of General Government Employees, (% of GDP) % Austria Belgium Denmark Finland France Germany Greece Iceland Ireland Italy Luxembourg Netherlands Norway Poland Portugal Spain Sweden Switzerland United Kingdom Australia Canada Japan New Zealand United States
21 Figure 10B: Compensation Costs of General Government Employees, (% of General Government Consumption Expenditure) % Austria Czech Republic Denmark Finland France Germany Hungary Ireland Italy Netherlands Poland Portugal Spain Sweden Switzerland United Kingdom Australia Canada New Zealand United States
22 3.3 The organizational challenge Six organizational challenges: 1. The trend towards shifting public service organization from a career to a position model. 2. Putting emphasis on a philosophy of private sector managerialism in the public sector, with elements like accounting and evaluation, in general on increased efficiency and effectiveness. 3. The introduction of performance-related and higher pay in the upper echelons of the job structure, i.e. for managers and higher administrators in the public services. 4. The trend towards performance management and performance measurement in the public sector. 5. The trend towards a general alignment of working conditions with the private sector. 6. The trend towards the integration of public service pension schemes with national pension schemes.
23 4. The responses: adaptation to these developments Four main responses: 1. Devolution of public sector employment 1. Devolution absolute and relative 2. Feminization 3. Part-time employment, precariousness 2. Adapting the working conditions 1. Rising working hours 2. Rising life work duration (pensionable age) 3. Adapting incomes 1. Decreasing salaries and fringe benefits 4. Adapting the pension systems
24 4.1 Devolution of public service employment Public sector employment in most countries has reached its upper threshold and is declining or at least stagnating (see slide 16 above) This is one of the main strategies to come along with public sector personnel and pension costs A shift from money to pensions
25 Figure 11: Share of Public Employment over the Labour Force, OECDcountries (%) % 25,0 20,0 15,0 10,0 5,0 0, Australia Austria Canada Czech Republic Denmark Finland France Germany Greece Hungary Ireland Italy Luxembourg Netherlands New Zealand Norway Poland Spain Turkey United States
26 4.1 Devolution of public service employment (contd.) Feminization... is the consequence of overall public sector employment decline, due to the strong sexual segmentation The personnel-intensive public service branches like teaching and nursing are female dominated Productivity increases in theses branches are low due to the type of work, not allowing for strong rationalization ( Baumols cost disease )
27 Figure 12A: Women Employed in Public Sector/Service, (% of all women in employment) Figure 12B: Men Employed in Public Sector/Service, (% of all men in employment) 60,00 50,00 Germany (West) France Sweden United Kingdom Belgium ,00 20 % 30,00 % 15 20,00 10, Belgium Germany (West) France Sweden United Kingdom 0,
28 Figure 12C: Female Share in Public Sector/Service Employment, (women in % of total public sector/service employment) 80,0 Figure 12D: Female Employment in the Total Public Sector (%) 80,00 Canada 70,00 70,0 Finland France 60,00 60,0 Germany Greece 50,00 Hungary % 40,00 30,00 20,00 10,00 Germany (West) France Sweden United Kingdom Belgium % 50,0 40,0 30,0 Italy Luxemb ourg Netherla nds New Zealand Norway United States 0, ,
29 4.1 Devolution of public service employment (contd.) Part-time employment, precariousness A by-process of feminization is the rise if part-time employment, being strongly female dominated
30 Figure 13A: Part-time Employment in Public Sector/Service, (part-time employed in % of all employed in public sector/service) Figure 13C: Part-time Working Men in Public Sector/Service, (% of all working men in public sector/service) 14,00 35,00 30,00 25,00 Germany (West) France Sweden United Kingdom 12,00 10,00 Germany (West) Sweden United Kingdom % 20,00 15,00 % 8,00 6,00 10,00 4,00 5,00 2,00 0, ,
31 4.2 Adapting working conditions Working conditions are changing in several dimensions: flexibility, type of work, working time. Some important changes shall be highlighted here: Working time As a consequence of the reduction in public service manpower and the low productivity increases in the public services, there is a tendency in some countries to reincrease weekly working time.
32
33 4.2 Adapting working conditions (contd.) Extending retirement ages An extension of retirement ages is nothing else than an extension of life working time. Such an extension has become necessary due to the negative effects of the early retirement programmes. Extension of retirement ages intends to correct factual pension behaviour, being much lower than the legal pensionable age. A side effect is a lowering of the pension received because factual retirement age will probably be always lower than the legal one.
34
35 Income structures 4.3 Adapting incomes It is still an open question, if public sector employment decline and the so-called welfare state retrenchment has the effect of declining public sector incomes and pensions. Earnings differentials between the public and private sector Traditionally, the earnings differential between the public and the private sectors is positive, i.e. on average earnings (e.g. median annual earnings) in the public sector are higher than in the private sector. This earnings differential is much more stronger for women than for men, i.e. women employed in the public sector on average have a much higher annual income than women in the private sector. This earnings differial is not due to higher remuneration in comparable jobs, but is mainly explained by the higher educational attainment of men and especially women in the public sector than in the private sector. Earnings differentials for both sexes are lowest in social democratic welfare states (Sweden), middle in the conservative welfare states (Belgium, Germany, Netherlands), and highest in the liberal welfare states (Canada, United Kingdom, United States). The underlying mechanism is the following: first, the larger the public sector, the lower the earnings differential between the public and the private sectors; and second, the larger the public sector, the lower are the differences in the public sector/private sector earnings differential between men and women.
36 4.3 Adapting incomes (contd.) Dispersion of earnings by sector Is there more equality in the earnings structure in the public sector than in the private sector? In general, the earnings dispersion, measured by the dispersion of the 90th percentile to the 10th percentile is smaller in the public sector than in the private sector. This is true for all countries of the different welfare states types. The main reasons for this phenomenon are the relatively (compared to the private sector) higher earnings for the lower public sector positions and the strongly lower earnings for the public sector top positions (again compared to the private sector). The variation between regimes types in public sector earnings dispersion is not as clear-cut as hypothesized. In Sweden and Canada, dispersion is on a similar level, while dispersion in the conservative countries is lower than in Sweden and the liberal countries. In the United States dispersion the highest of this country sample, even much higher than in the other liberal countries. Private sector earnings dispersion is high in the liberal countries, but between Sweden and the conservative countries there is no systematic difference, with the exception of Germany. When earnings dispersions in the public and private sectors are related, it is shown that earnings inequality in the private sector is much larger in the liberal countries, both compared to the social-democratic and both to the conservative countries (Figures 14A and 14B).
37 Figure 14A: Dispersion of Earnings in the Public Sector, Figure 14B: Dispersion of Earnings in the Central Administration, ,00 5,00 4,50 4,50 Decile 9/1 4,00 3,50 3,00 2,50 2,00 1,50 1,00 0,50 0,00 Hungary Luxembourg Netherlands Poland Decile 9/1 4,00 3,50 3,00 2,50 2,00 1,50 1,00 0,50 0,00 Finland France Hungary Luxembourg Netherlands Poland Sweden
38 4.3 Adapting incomes (contd.) Income changes and public sector employment decline Does public sector employment decline which is happening in many European countries since the 1990s therefore will lead to a deterioration of the income position of public servants? With a declining public sector labour force, the income position of public servants could be enhanced, like in the liberal welfare states. A declining public sector labour force even could favour women above average, again like in the liberal welfare states, where female public sector income is much higher than female private sector income. Furthermore, the ongoing feminization of the public sector in the period of public sector employment decline, not only favours women in lower positions, but in line with proceeding educational female expansion and public policies of positive privileges, will bring more women in senior public sector positions as well. A contracting public sector labour force in the long run probably will enable governments to spend again more on salaries (in relative terms) as was the case before public sector expansion.
39 4.4 Adapting the pension systems Many different instruments in adapting pensions The present situation is given by Table 5 The basic principles of public sector pensions are: Pension calculation according to last salary Defined benefits instead of defined contributions Accrual rates and contribution years are calculated in a way to receive approximately 75% of last gross income
40
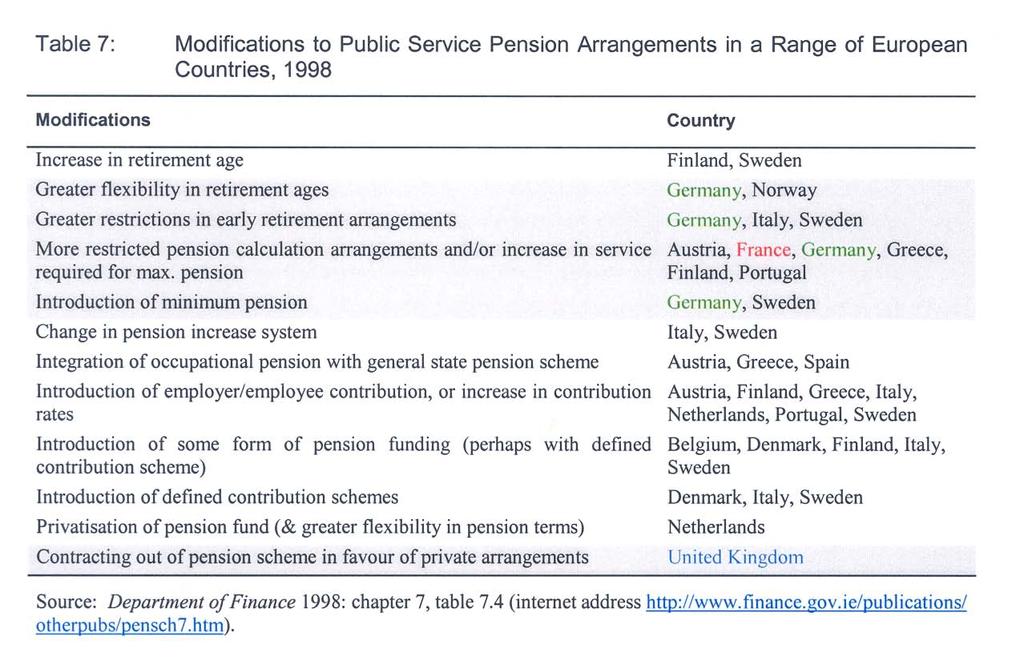
41 4.4 Adapting the pension systems (contd.) The main measures to adapt the pension schemes are (Table 7): Extension of the maximum years reckoned to get the full pension: e.g. in Germany from 35 to 40 years in the early 1990s e.g. in France from 37.5 to 40 years in the late 1990s Changing the pension formula: Lowering the accrual rate, e.g. in Germany for the first 10 work years Linearization of the pension scale Extending the pensionable age: e.g. in Germany step-by-step from 65 to 67 years from 2008 Introduction of contributions: e.g. in Germany for the public servants occupational pension Introduction of penalties for early retirement pensions: e.g. in Germany during the 1990s Integrating the public sector pensions with the national pension scheme: e.g. in Finland during the 1990s, in Italy in 1995 and in Ireland in 1995
42
43 4.4 Adapting the pension systems (contd.) Method of indexation: current status (Table 6): Indexation to salaries better than indexation to living costs Changing the basis of indexation Move from indexation to salaries to living costs Temporary non-increase of pensions to living costs
44

45 5 The actors Three kinds of actors: The state: a multitude of actors The public servants and their interest organizations The invisible hand : socio-structural constraints
46 5 The actors (contd.) The state: a multitude of actors (Table 8): Policy of being a good employer Two important factors ensure that the public services continue to play an eminent role in state organization. These are: the strong position of the civil servants both in legislature and in the executive. It is well-known that civil servants are strongly overrepresented in national parliaments: in the 13th German Federal Assembly (Deutscher Bundestag), just to give an example, 35% of all members of parliament were civil servants, but they only amounted to 7.3% of all persons employed (1998). In the French Assemblé Nationale during the Session % of all deputees were fonctionnaires and 20.56% teachers. In summary, both groups accounted for 37.63% of all members of parliament. In the United Kingdom in 1997 at least 31.5% of all Members of Parliament stemmed from different branches of the public service sector.
47
48 5 The actors (contd.) The public servants and their interest organizations Right to strike is restricted in the public sector totally or for some occupational groups. The position of the trade unions in the public sector seems to be structurally weaker than in the private sector. But this weaker position in balanced by the strong position in the parliaments and the executive. The invisible hand : socio-structural constraints The main perspective is to look at the unintended consequences or side effects of these (institutional, socio-structural, demographic) changes, causing pressure to re-adapt to (or reform) changed structures. One first element might be employment growth in the public sector. A second set of factors are demographic changes with a growing proportion of the elderly well-known as population ageing (in relative as well as absolute terms) due to low fertility and a continuously rising life expectancy.
49 6 Effects on the quality of life Effects on the quality of life are discussed for objective outcomes and subjective outcomes: Objective outcomes Income-replacement rates Old-age income Life expectancy Subjective outcomes Life satisfaction by... sex educational level income regression of different independent variables on the life satisfaction
50 6 Effects on the quality of life (contd.) Objective outcomes: income-replacement rates France (Table 9): Income-replacement rates are generally higher in the public sector Large variation in income replacement rates within the public sector Very high in the public facilities Income replacement rates are the lower the lower the educational status
51
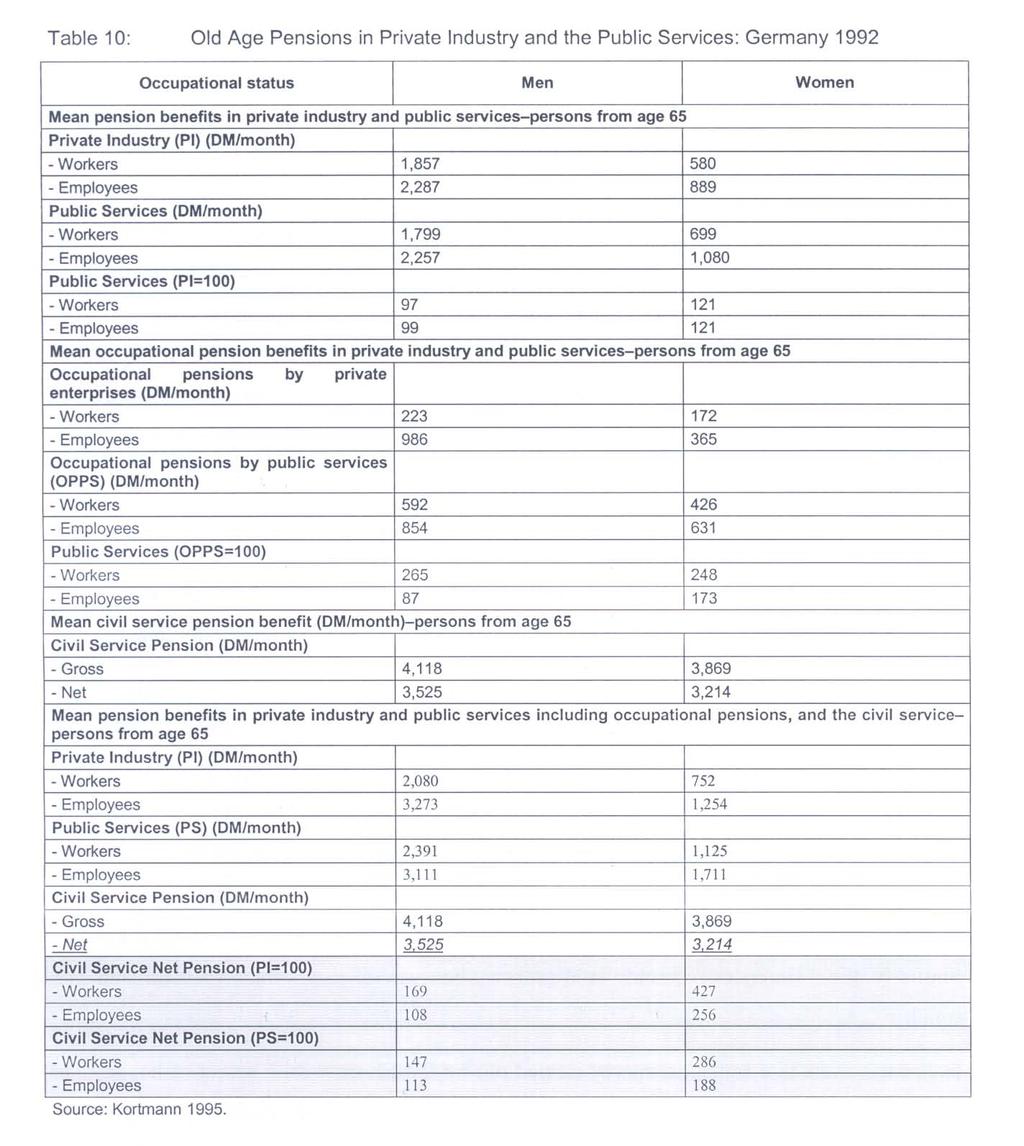
52 6 Effects on the quality of life (contd.) Objective outcomes: old-age pension incomes Germany (Table 10): For both sexes civil service net pensions are higher than pensions of private industry employees and workers For both sexes the income advantage of civil servants compared to workers in private industry is quite high, but smaller when compared to industrial employees For both sexes pensions of civil servants are higher than pensions of public employees and public workers For both sexes public employees pensions are larger than pensions of public workers For females all these relationships are true as well, but the pension income advantage for female civil servants is much higher than for male civil servants. This is not due to better pension conditions in the public services but lower incomes and strong horizontal and vertical job segregation of females in the private industry
53
54 6 Effects on the quality of life (contd.) Objective outcomes: life expectancy France and Germany (Table 11): In general, life expectancy of public sector employees is higher than in the total population In France: the difference is the higher the higher the status in the public sector In France: male public sector advantage in life expctancy is larger than female advantage in life expectancy, when compared with men resp. women in the total population at age 35 In Germany: female life expectancy of civil servants is larger than male civil servant life expectancy, when compared with females resp. males in the total population at age 60 Interpretation is conditioned by... civil servants have higher educational attainment and such persons do have a higher life expectancy
55
56 6 Effects on the quality of life (contd.) Subjective outcomes: life satisfaction (Table 12) First, in all countries examined, general life satisfaction is higher in the public sector than in the private sector. Thus, in the egalitarian welfare states of Northern Europe and the Netherlands, the differences of this index are very small. Differences become very large in continental countries with long-established civil-service privileges and the European developing countries of Southern Europe. Thus, in Portugal, Spain, and especially Greece civil servants do have clearly a privileged position concerning the right to a state pension, the pension level, general working conditions, and job security, when compared to employees in the private sector.
57 6 Effects on the quality of life (contd.) Subjective outcomes: life satisfaction by sector and sex (Table 12) Second, when looking at the gender dimension, there is no difference in satisfaction between men and women in the private sector, but in the public sector women are much more satisfied than men. The general level of satisfaction is very much higher in the public sector compared to the private sector both for men and for women. Furthermore, women are very much more satisfied in the public sector than men in the public sector, when compared to women and men in the private sector. This is probably a reflection of the relative good objective earnings and working conditions for women in the public sector in contrast to the private sector. We do know from objective indicators that earnings of women are on average higher in the public sector than in the private sector, the main driving force for the feminization of the public sector. Third, when comparing the absolute level of satisfaction of women in the public sector between countries, it is shown that in the advanced welfare states of Northern Europe, the absolute level of satisfaction of women is higher than in the continental countries with long-standing traditions in the public sector. The lowest level exists for the four Southern European countries.
58
59 6 Effects on the quality of life (contd.) Subjective outcomes: life satisfaction by sector and education (Table 13) Satisfaction both in the private and public sectors is the higher the higher the educational status. That means, that persons with tertiary educational attainment are more satisfied with their life than persons with secondary or basic educational status. But there are countries where the differences in the public sector in satisfaction due to the educational status are small; and on the other hand there are countries where these differences are large. First, in Denmark, Finland, Austria, the Netherlands and the UK differences are quite small. In the UK and mainly in Finland people with basic education are even more satisfied than those with tertiary education. Second, on the other hand, there exists a group of countries where differences between educational status are high: Belgium, France, Ireland, Italy (strong), Greece (strong), Spain, and Portugal (strong). Thus, in several Southern European countries there seems to exist a high privilegded position of people in the public sector with high educational status. Social differentiation according to educational status seems to be higher in these countries, while in the countries of Northern Europe the small differences in satisfaction seem to reflect the smaller differences in the social position, like e.g. smaller income inequality in the public sector.
60
61 6 Effects on the quality of life (contd.) Subjective outcomes: life satisfaction by sector and income (Table 14) Table 14 shows the influence of income and sector on the general life satisfaction. The income position is measured by the disposible income (DPI) in purchasing power parities (ppp), and was grouped into low, medium and high. Life satisfaction is generally the higher the higher the income position. There do exist interesting differences between countries concerning the satisfaction by income position in the public sector. The differences are smaller in Denmark, the Netherlands, France, Ireland, Spain, Portugal and Finland. Large differences do exist in Belgium, Italy and Austria. A very large difference exists in Greece. The UK is a complete exception to this, because in this country there do not exist any differences concerning life satisfaction by income status.
62
63 6 Effects on the quality of life (contd.) Subjective outcomes: regression on life satisfaction (Table 15) Table 15 presents the results of an OLS regression on general life satisfaction in EU member countries. There are several interesting results. The level of the general life satisfaction is influenced most, if the type of work contract is permanent (0.27), and if people are working in the public sector (0.22). Furthermore, general life satisfaction is strongly influenced by the financial situation of respondents (0.21).
64
65 Conclusions The following conclusions can be drawn from the empirical result with respect to the three main challenges to the public services The main stragegy to come along with rising pension costs in the public service sector is to reduce public employment, i.e. a shift from income for actively employed to pensioners. This strategy has consequences for the social structure of the public services: A growing feminization, i.e. the decline of overall public employment concerns women less than men, resulting in a growing proportion of women of all public service employees. A growing tendency to create part-time jobs and precarious work contracts. A declining public service workforce puts pressure on the working conditions, i.e. mainly a reincrease of working time, because productivity increases in the public services (teaching, nursing) are not big enough to compensate for the loss in the work force. A decling public service workforce puts pressure to increase productivity of public service employees. Strategies are to emphasize efficiency and effectiveness in the public services, an alignment with private sector organizational models, to introduce performance related pay for senior officials, a shift from a the career model to a position model, among others.
66 Conclusions (contd.) These main strategies are complemented by a reincrease of the volume of work not by creating new jobs, but by extending life work duration for those who are in public service jobs, in order to enlarge the contributory basis for pensions and social benefits. Specific instruments are to create conditions for earlier work entry and the abolition of early retirement programmes, i.e. postponing of factual retirement age. Incremental reforms of the public service pension schemes are intended to support the instruments mentioned before. Such measures involve postponing retirement age, increasing maximum service reckoned, to introduce penalties for early retirement, to adapt the pension scale (lowering the accrual rate, linearization of the pension scale, etc.). Only few countries introduced a fundamental change of the pension scheme like the integration of public service pension schemes with the national pension scheme. Lowering work incomes of actively employed is another strategy, but changes in this place has been modest thus far, and always have to be seen in relation to privat sector incomes. The public/private sector earnings ratio was not changed essentially. In the long run therefore due to the employment reduction public service incomes can be stabilized or even improved -, thus safeguarding the earnings benefit of public service employees, especially of females.
67 Conclusions (contd.) Life satisfaction of public sector workers is generally higher than of private sector workers, especially of females. The main predictors are job security and income level. It can be hypothesized, given the fact that job security and the relative income position will not deteriorate fundamentally, that there will be no fundamentally decline in life satisfaction. But this has to be proofed by further analyses.
68 Thank you for your attention
69
70
71
Statistical annex. Sources and definitions
 Statistical annex Sources and definitions Most of the statistics shown in these tables can be found as well in several other (paper or electronic) publications or references, as follows: the annual edition
Statistical Annex ANNEX
 ISBN 92-64-02384-4 OECD Employment Outlook Boosting Jobs and Incomes OECD 2006 ANNEX Statistical Annex Sources and definitions Most of the statistics shown in these tables can be found as well in three
Statistical Annex. Sources and definitions
 Statistical Annex Sources and definitions Most of the statistics shown in these tables can also be found in two other (paper or electronic) publication and data repository, as follows: The annual edition
Approach to Employment Injury (EI) compensation benefits in the EU and OECD
 compensation benefits in the EU and OECD") Approach to (EI) compensation benefits in the EU and OECD The benefits of protection can be divided in three main groups. The cash benefits include disability pensions, survivor's pensions and other short-
Approach to (EI) compensation benefits in the EU and OECD The benefits of protection can be divided in three main groups. The cash benefits include disability pensions, survivor's pensions and other short-
Trust and Fertility Dynamics. Arnstein Aassve, Università Bocconi Francesco C. Billari, University of Oxford Léa Pessin, Universitat Pompeu Fabra
 Trust and Fertility Dynamics Arnstein Aassve, Università Bocconi Francesco C. Billari, University of Oxford Léa Pessin, Universitat Pompeu Fabra 1 Background Fertility rates across OECD countries differ
Corrigendum. OECD Pensions Outlook 2012 DOI: ISBN (print) ISBN (PDF) OECD 2012
 ISBN (PDF) OECD 2012") OECD Pensions Outlook 2012 DOI: http://dx.doi.org/9789264169401-en ISBN 978-92-64-16939-5 (print) ISBN 978-92-64-16940-1 (PDF) OECD 2012 Corrigendum Page 21: Figure 1.1. Average annual real net investment
OECD Pensions Outlook 2012 DOI: http://dx.doi.org/9789264169401-en ISBN 978-92-64-16939-5 (print) ISBN 978-92-64-16940-1 (PDF) OECD 2012 Corrigendum Page 21: Figure 1.1. Average annual real net investment
Performance Budgeting (PB) in OECD Countries
 in OECD Countries") Performance Budgeting (PB) in OECD Countries Teresa Curristine, Budgeting and Public Expenditures Division, Public Governance Directorate, OECD 6 th Annual Meeting of Latin American Senior Budget Officials
Performance Budgeting (PB) in OECD Countries Teresa Curristine, Budgeting and Public Expenditures Division, Public Governance Directorate, OECD 6 th Annual Meeting of Latin American Senior Budget Officials
8-Jun-06 Personal Income Top Marginal Tax Rate,
 8-Jun-06 Personal Income Top Marginal Tax Rate, 1975-2005 2005 2000 1999 1998 1997 1996 1995 1994 1993 1992 1991 1990 1989 1988 Australia 47% 47% 47% 47% 47% 47% 47% 47% 47% 47% 47% 48% 49% 49% Austria
Low employment among the 50+ population in Hungary
 Low employment among the + population in Hungary The role of incentives, health and cognitive capacities Janos Divenyi (Central European University) and Gabor Kezdi (Central European University and IE-CRSHAS)
Investing for our Future Welfare. Peter Whiteford, ANU
 Investing for our Future Welfare Peter Whiteford, ANU Investing for our future welfare Presentation to Jobs Australia National Conference, Canberra, 20 October 2016 Peter Whiteford, Crawford School of
Long Term Reform Agenda International Perspective
 Long Term Reform Agenda International Perspective Asta Zviniene Sr. Social Protection Specialist Human Development Department Europe and Central Asia Region World Bank October 28 th, 2010 We will look
Social Determinants of Health: employment and working conditions
 Social Determinants of Health: employment and working conditions Michael Marmot UCL Institute of Health Equity 3 rd Nordic Conference in Work Rehabilitation 7 th May 2014 Fairness at the heart of all policies.
Workforce participation of mature aged women
 Workforce participation of mature aged women Geoff Gilfillan Senior Research Economist Productivity Commission Productivity Commission Topics Trends in labour force participation Potential labour supply
WHAT ARE THE FINANCIAL INCENTIVES TO INVEST IN EDUCATION?
 INDICATOR WHAT ARE THE FINANCIAL INCENTIVES TO INVEST IN EDUCATION? Not only does education pay off for individuals ly, but the public sector also from having a large proportion of tertiary-educated individuals
The Global Financial Crisis and the Return of the Nordic Model?
 The Global Financial Crisis and the Return of the Nordic Model? Lars Calmfors Embassy of Denmark and the Swedish Institute of International Affairs 18 November Topics 1. The global economic crisis 2. Globalisation
axia Axia Economics Civil-service pension schemes Edward Whitehouse Civil-Service World Bank core course Washington DC, April 2016
 Public Disclosure Authorized Civil-Service Civil-service pension schemes Public Disclosure Authorized Edward Whitehouse Public Disclosure Authorized World Bank core course Washington DC, April 2016 axia
10% 10% 15% 15% Caseload: WE. 15% Caseload: SS 10% 10% 15%
 Percentchangeincaseload 15% 10% 5% 0% 5% 10% 15% Caseload: AO 0 1 2 3 4 5 Percentchangein caseload 15% 10% 5% 0% 5% 10% 15% Caseload: NC 0 1 2 3 4 5 Years Years Percentchangein caseload 15% 10% 5% 0% 5%
The OECD s Society at a Glance Simon Chapple OECD ELS/SPD Villa Vigoni, Italy, 9-11 th March 2011
 The OECD s Society at a Glance 2 Simon Chapple OECD ELS/SPD Villa Vigoni, Italy, 9- th March 2 Reconceptualisation for 2: Internal reasons OECD growth from 3 to 34 countries Other major economies (e.g.
PENSIONS IN OECD COUNTRIES: INDICATORS AND DEVELOPMENTS
 PENSIONS IN OECD COUNTRIES: INDICATORS AND DEVELOPMENTS Marius Lüske Directorate for Employment, Labour and Social Affairs, OECD Lisbon, 28.09.2018 Marius.LUSKE@oecd.org www.oecd.org/els OUTLINE Talk based
OECD HEALTH SYSTEM CHARACTERISTICS SURVEY 2012
 OECD HEALTH SYSTEM CHARACTERISTICS SURVEY 2012 Emily Hewlett OECD Health Data National Correspondents and Health Accounts Experts Meeting, 17 th October 2013 Health System Characteristics Survey 2012 HSC
Burden of Taxation: International Comparisons
 Burden of Taxation: International Comparisons Standard Note: SN/EP/3235 Last updated: 15 October 2008 Author: Bryn Morgan Economic Policy & Statistics Section This note presents data comparing the national
V. MAKING WORK PAY. The economic situation of persons with low skills
 V. MAKING WORK PAY There has recently been increased interest in policies that subsidise work at low pay in order to make work pay. 1 Such policies operate either by reducing employers cost of employing
Ways to increase employment
 Ways to increase employment Iceland Luxembourg Spain Canada Italy Norway Denmark Germany Portugal Ireland Japan Belgium Switzerland Austria Slovenia United States New Zealand Finland France Netherlands
Ageing and employment policies: Ireland
 Ageing and employment policies: Ireland John Martin 1 Director for Employment, Labour and Social Affairs, OECD FÁS Annual Labour Market Conference, Dublin, 5 December 2005 OECD has carried out a major
Major Trends in Pension Reforms. Ambrogio Rinaldi Director, COVIP, Italy Chair, OECD Working Party on Private Pensions
 Major Trends in Pension Reforms Ambrogio Rinaldi Director, COVIP, Italy Chair, OECD Working Party on Private Pensions 6th Global Pension & Savings Conference the World Bank - Washington, DC April 2-3,
EU BUDGET AND NATIONAL BUDGETS
 DIRECTORATE GENERAL FOR INTERNAL POLICIES POLICY DEPARTMENT ON BUDGETARY AFFAIRS EU BUDGET AND NATIONAL BUDGETS 1999-2009 October 2010 INDEX Foreward 3 Table 1. EU and National budgets 1999-2009; EU-27
COMPARISON OF RIA SYSTEMS IN OECD COUNTRIES
 COMPARISON OF RIA SYSTEMS IN OECD COUNTRIES Nick Malyshev, OECD Conference on the Further Development of Impact Assessment in the European Union Brussels, RIA SYSTEMS IN OECD COUNTRIES Regulatory Impact
Household Financial Wealth By Selected Country
 Household Financial Wealth By Selected Country US$ Trillions 60 50-37% Indicates Projected Shortfall 40 30 20 Extrapolation of Historical Growth 2003-24 Projection (Based on Demographic Trends) -47% -34%
Pension Reforms Revisited Asta Zviniene Sr. Social Protection Specialist Human Development Department Europe and Central Asia Region World Bank
 Pension Reforms Revisited Asta Zviniene Sr. Social Protection Specialist Human Development Department Europe and Central Asia Region World Bank All Countries in the Europe and Central Asia Region Have
LONG-TERM PROJECTIONS OF PUBLIC PENSION EXPENDITURE
 7. FINANCES OF RETIREMENT-INCOME SYSTEMS LONG-TERM PROJECTIONS OF PUBLIC PENSION EXPENDITURE Key results Public spending on pensions has been on the rise in most OECD countries for the past decades, as
InterTrade Ireland Economic Forum 25 November 2011 The jobs crisis: stylised facts and policy challenges
 InterTrade Ireland Economic Forum 25 November 2011 The jobs crisis: stylised facts and policy challenges John P. Martin Director for Employment, Labour and Social Affairs, OECD The jobs crisis An unprecedented
Indicator B3 How much public and private investment in education is there?
 Education at a Glance 2014 OECD indicators 2014 Education at a Glance 2014: OECD Indicators For more information on Education at a Glance 2014 and to access the full set of Indicators, visit www.oecd.org/edu/eag.htm.
Sources of Government Revenue in the OECD, 2016
 FISCAL FACT No. 517 July, 2016 Sources of Government Revenue in the OECD, 2016 By Kyle Pomerleau Director of Federal Projects Kevin Adams Research Assistant Key Findings OECD countries rely heavily on
Programme for Government Joe Reynolds Director Programme for Government and Delivering Social Change
 Programme for Government 2016-21 Joe Reynolds Director Programme for Government and Delivering Social Change Context the rationale for change Current PfG is a list of 82 Commitments Executive record on
Live Long and Prosper? Demographic Change and Europe s Pensions Crisis. Dr. Jochen Pimpertz Brussels, 10 November 2015
 Live Long and Prosper? Demographic Change and Europe s Pensions Crisis Dr. Jochen Pimpertz Brussels, 10 November 2015 Old-age-dependency ratio, EU28 45,9 49,4 50,2 39,0 27,5 31,8 2013 2020 2030 2040 2050
C W S S u m m i t. Dambisa Moyo 16 May 2012 London
 2 0 1 2 C W S S u m m i t Dambisa Moyo 16 May 2012 London Table of Contents I Global Labour Market Picture II Six Labour Market Drivers III The Challenges Ahead 2 Global unemployment (millions) Unemployment
SKEMA BUSINESS SCHOOL Global risk and the mounting wealth gap Michel Henry Bouchet
 SKEMA BUSINESS SCHOOL Global risk and the mounting wealth gap Michel Henry Bouchet MYTH = GLOBALIZATION GENERATES GROWING ECONOMIC WEALTH AND WELL-BEING FOR ALL Fact: Economic growth boils down to rising
International comparison of poverty amongst the elderly
 International comparison of poverty amongst the elderly RPRC PensionBriefing 2009-1 ------------------------------------------------------------------------------------------------------- This PensionBriefing
OECD Report Shows Tax Burdens Falling in Many OECD Countries
 OECD Centres Germany Berlin (49-30) 288 8353 Japan Tokyo (81-3) 5532-0021 Mexico Mexico (52-55) 5281 3810 United States Washington (1-202) 785 6323 AUSTRALIA AUSTRIA BELGIUM CANADA CZECH REPUBLIC DENMARK
The Case for Fundamental Tax Reform: Overview of the Current Tax System
 The Case for Fundamental Tax Reform: Overview of the Current Tax System Sources of Federal Receipts Projected for 2016 Excise Taxes 2.9% Estate & Gift Taxes 0.6% Corporate Income Taxes 9.8% Other Taxes
REFORMING PENSION SYSTEMS: THE OECD EXPERIENCE
 REFORMING PENSION SYSTEMS: THE OECD EXPERIENCE IX Forum Nacional de Seguro de Vida e Previdencia Privada 12 June 2018, São Paulo Jessica Mosher, Policy Analyst, Private Pensions Unit of the Financial Affairs
DEVELOPMENT AID AT A GLANCE
 DEVELOPMENT AID AT A GLANCE STATISTICS BY REGION 5. EUROPE 6 edition 5.. ODA TO EUROPE - SUMMARY 5... Top ODA receipts by recipient USD million, net disbursements in 5... Trends in ODA Turkey % Ukraine
2018 UX Salary Survey
 2018 UX Salary Survey August 2018 Research Methodology STUDY DESIGN Online survey (15 minutes) SAMPLE SIZE 1,326 UX Professionals Initial respondents were recruited through postings on professional networks
Switzerland and Germany top the PwC Young Workers Index in developing younger people
 Press release Date 9 November 2015 Contact Mihnea Anastasiu Pages 5 Media Relations Manager Tel: +40 21 225 3546 Email: mihnea.anastasiu@ro.pwc.com Switzerland and Germany top the PwC Young Workers Index
25/11/2014. Health inequality: causes and responses: action on the social determinants of health. Why we need to tackle health inequalities
 Health inequality: causes and responses: action on the social determinants of health Professor Sir Michael Marmot http://www.instituteofhealthequity.org November 214 Why we need to tackle health inequalities
EU Survey on Income and Living Conditions (EU-SILC)
") 16 November 2006 Percentage of persons at-risk-of-poverty classified by age group, EU SILC 2004 and 2005 0-14 15-64 65+ Age group 32.0 28.0 24.0 20.0 16.0 12.0 8.0 4.0 0.0 EU Survey on Income and Living
16 November 2006 Percentage of persons at-risk-of-poverty classified by age group, EU SILC 2004 and 2005 0-14 15-64 65+ Age group 32.0 28.0 24.0 20.0 16.0 12.0 8.0 4.0 0.0 EU Survey on Income and Living
Socioeconomic inequalities in mortality and longevity
 Socioeconomic inequalities in mortality and longevity Peter Goldblatt Taking action on the Social Determinants of Health 12 March 2013 Thanks to Ruth Bell www.instituteofhealthequity.org 1 Review of Social
17 January 2019 Japan Laurence Boone OECD Chief Economist
 Fiscal challenges and inclusive growth in ageing societies 17 January 219 Japan Laurence Boone OECD Chief Economist G2 populations are ageing rapidly Expected life expectancy at age 65 198 215 26 Japan
DG TAXUD. STAT/11/100 1 July 2011
 DG TAXUD STAT/11/100 1 July 2011 Taxation trends in the European Union Recession drove EU27 overall tax revenue down to 38.4% of GDP in 2009 Half of the Member States hiked the standard rate of VAT since
Trade and Development Board Sixty-first session. Geneva, September 2014
 UNITED NATIONS CONFERENCE ON TRADE AND DEVELOPMENT Trade and Development Board Sixty-first session Geneva, 15 26 September 2014 Item 3: High-level segment Tackling inequality through trade and development:
Statistics Brief. Investment in Inland Transport Infrastructure at Record Low. Infrastructure Investment. July
 Statistics Brief Infrastructure Investment July 2015 Investment in Inland Transport Infrastructure at Record Low The latest update of annual transport infrastructure investment and maintenance data collected
EXECUTIVE SUMMARY PRIVATE PENSIONS OUTLOOK 2008 ISBN
 EXECUTIVE SUMMARY PRIVATE PENSIONS OUTLOOK 2008 ISBN 978-92-64-04438-8 In 1998, the OECD published Maintaining Prosperity in an Ageing Society in which it warned governments that the main demographic changes
Assessing Developments and Prospects in the Australian Welfare State
 Assessing Developments and Prospects in the Australian Welfare State Presentation to OECD,16 November, 2016 Peter Whiteford, Crawford School of Public Policy https://socialpolicy.crawford.anu.edu.au/ peter.whiteford@anu.edu.au
Social Expenditure in Japan: Trends and Backgrounds
 Social Expenditure in Japan: Trends and Backgrounds Junko Takezawa The 9th Social Experts Meeting the Center Mark Hotel in Seoul (28 29 October 2014) Presentation Outline 1. Trends in Social Expenditure
Developments for age management by companies in the EU
 Developments for age management by companies in the EU Erika Mezger, Deputy Director EUROFOUND, Dublin Workshop on Active Ageing and coping with demographic change Prague, 6 September 2012 12/09/2012 1
Aging with Growth: Implications for Productivity and the Labor Force Emily Sinnott
 Aging with Growth: Implications for Productivity and the Labor Force Emily Sinnott Emily Sinnott, Senior Economist, The World Bank Tallinn, June 18, 2015 Presentation structure 1. Growth, productivity
Recommendation of the Council on Tax Avoidance and Evasion
 Recommendation of the Council on Tax Avoidance and Evasion OECD Legal Instruments This document is published under the responsibility of the Secretary-General of the OECD. It reproduces an OECD Legal Instrument
Sources of Government Revenue in the OECD, 2017
 FISCAL FACT No. 558 Aug. 2017 Sources of Government Revenue in the OECD, 2017 Amir El-Sibaie Analyst Key Findings: OECD countries rely heavily on consumption taxes, such as the value-added tax, and social
FCCC/SBI/2010/10/Add.1
 United Nations Framework Convention on Climate Change Distr.: General 25 August 2010 Original: English Subsidiary Body for Implementation Contents Report of the Subsidiary Body for Implementation on its
Sources of Government Revenue in the OECD, 2018
 FISCAL FACT No. 581 Mar. 2018 Sources of Government Revenue in the OECD, 2018 Amir El-Sibaie Analyst Key Findings In 2015, OECD countries relied heavily on consumption taxes, such as the value-added tax,
Is Government the Problem or the Solution to U.S. Labor Market Challenges?
 Is Government the Problem or the Solution to U.S. Labor Market Challenges? Jason Furman Harvard Kennedy School & Peterson Institute for International Economics Federal Reserve Bank of Minneapolis Minneapolis,
POVERTY AND INCOMES OF OLDER PEOPLE IN OECD COUNTRIES. Asghar Zaidi
 POVERTY AND INCOMES OF OLDER PEOPLE IN OECD COUNTRIES by Asghar Zaidi Paper prepared for the 31st General Conference, St-Gallen, Switzerland, 22-28 August, 2010 * Asghar Zaidi is Director Research at the
DEMOGRAPHICS AND MACROECONOMICS
 1 UNITED KINGDOM DEMOGRAPHICS AND MACROECONOMICS Nominal GDP (EUR bn) 1 442 GDP per capita (USD) 43. 237 Population (000s) 61 412 Labour force (000s) 31 118 Employment rate 94.7 Population over 65 (%)
HEALTH LABOUR MARKET TRENDS IN OECD COUNTRIES
 HEALTH LABOUR MARKET TRENDS IN OECD COUNTRIES Michael Schoenstein, OECD Health Division 3 rd Global Health Workforce Alliance Forum Recife, 11 November 2013 Main health labour market issues in OECD countries
Annuities: a private solution to longevity risk
 Annuities: a private solution to longevity risk Product & Knowledge Fair 2007 Rüschlikon 30 March 2007 Thomas Hess Head of Economic Research & Consulting Veronica Scotti Client Solutions Need for private
OECD Health Policy Unit. 10 June, 2001
 The State of Implementation of the OECD Manual: A System of Health Accounts (SHA) in OECD Member Countries, 2001 OECD Health Policy Unit 10 June, 2001 TABLE OF CONTENTS Summary...3 Introduction...4 Background
Competition Policy in a Small Economy: the Case of Iceland
 Competition Policy in a Small Economy: the Case of Iceland Friðrik M. Baldursson Department of Economics University of Iceland April 7, 2006 1 Goals of competition policy Competition is not an end in itself,
A NOTE ON PUBLIC SPENDING EFFICIENCY
 A NOTE ON PUBLIC SPENDING EFFICIENCY try to implement better institutions and should reassign many non-core public sector activities to the private sector. ANTÓNIO AFONSO * Public sector performance Introduction
The macroeconomic effects of a carbon tax in the Netherlands Íde Kearney, 13 th September 2018.
 The macroeconomic effects of a carbon tax in the Netherlands Íde Kearney, th September 08. This note reports estimates of the economic impact of introducing a carbon tax of 50 per ton of CO in the Netherlands.
Recommendation of the Council on the Implementation of the Polluter-Pays Principle
 Recommendation of the Council on the Implementation of the Polluter-Pays Principle OECD Legal Instruments This document is published under the responsibility of the Secretary-General of the OECD. It reproduces
Payroll Taxes in Canada from 1997 to 2007
 Payroll Taxes in Canada from 1997 to 2007 This paper describes the changes in the structure of payroll taxes in Canada and the provinces during the period 1997-2007. We report the average payroll tax per
Fiscal Policy in Japan
 Fiscal Policy in Japan - Issues and Future Directions- June 10th, 2015 Ministry of Finance General Government Gross Debt and Financial Balances (International Comparison) (%) 240 210 General Government
TAXATION OF TRUSTS IN ISRAEL. An Opportunity For Foreign Residents. Dr. Avi Nov
 TAXATION OF TRUSTS IN ISRAEL An Opportunity For Foreign Residents Dr. Avi Nov Short Bio Dr. Avi Nov is an Israeli lawyer who represents taxpayers, individuals and entities. Areas of Practice: Tax Law,
Gender pension gap economic perspective
 Gender pension gap economic perspective Agnieszka Chłoń-Domińczak Institute of Statistics and Demography SGH Part of this research was supported by European Commission 7th Framework Programme project "Employment
Invalidity: Qualifying Conditions a), 2005
, 2005") Austria All employees in paid employment, trainees. Family members working in the enterprises of self-employed persons. Persons who do not have a formal employment contract but essentially work like an
Austria All employees in paid employment, trainees. Family members working in the enterprises of self-employed persons. Persons who do not have a formal employment contract but essentially work like an
T5-Europe The Jus Semper Global Alliance 01/09/16 1 6
 Table-T5 Living-Wage-Gap and Equalisation analysis (vis-à-vis the U.S.) for all employed in the manufacturing sector in PPP for private consumption terms 1996-2015 (Europe) Beginning with the 2012 living-wage
Finally arriving? Pension Reforms in Europe
 Finally arriving? Pension Reforms in Europe Chris de Neubourg Tokyo 2010 Finally arriving? Pension Reforms in Europe Chris de Neubourg Innocenti Research Centre, Unicef, Florence October 2010 Drivers
Sustainability and Adequacy of Social Security in the Next Quarter Century:
 Sustainability and Adequacy of Social Security in the Next Quarter Century: Balancing future pensions adequacy and sustainability while facing demographic change Krzysztof Hagemejer (Author) John Woodall
Introduction to Public Finance
 Introduction to Public Finance Lecture 2: Functions and size of the welfare state. Retirement, unemployment protection, health care, etc. Welfare expenditures, aging problem. 1 Outline of the lecture Basic
Pan-European opinion poll on occupational safety and health
 REPORT Pan-European opinion poll on occupational safety and health Results across 36 European countries Final report Conducted by Ipsos MORI Social Research Institute at the request of the European Agency
3 Labour Costs. Cost of Employing Labour Across Advanced EU Economies (EU15) Indicator 3.1a
 Indicator 3.1a") 3 Labour Costs Indicator 3.1a Indicator 3.1b Indicator 3.1c Indicator 3.2a Indicator 3.2b Indicator 3.3 Indicator 3.4 Cost of Employing Labour Across Advanced EU Economies (EU15) Cost of Employing Labour
3 Labour Costs Indicator 3.1a Indicator 3.1b Indicator 3.1c Indicator 3.2a Indicator 3.2b Indicator 3.3 Indicator 3.4 Cost of Employing Labour Across Advanced EU Economies (EU15) Cost of Employing Labour
IMPLICATIONS OF LOW PRODUCTIVITY GROWTH FOR DEBT SUSTAINABILITY
 IMPLICATIONS OF LOW PRODUCTIVITY GROWTH FOR DEBT SUSTAINABILITY Neil R. Mehrotra Brown University Peterson Institute for International Economics November 9th, 2017 1 / 13 PUBLIC DEBT AND PRODUCTIVITY GROWTH
3 Labour Costs. Cost of Employing Labour Across Advanced EU Economies (EU15) Indicator 3.1a
 Indicator 3.1a") 3 Labour Costs Indicator 3.1a Indicator 3.1b Indicator 3.1c Indicator 3.2a Indicator 3.2b Indicator 3.3 Indicator 3.4 Cost of Employing Labour Across Advanced EU Economies (EU15) Cost of Employing Labour
3 Labour Costs Indicator 3.1a Indicator 3.1b Indicator 3.1c Indicator 3.2a Indicator 3.2b Indicator 3.3 Indicator 3.4 Cost of Employing Labour Across Advanced EU Economies (EU15) Cost of Employing Labour
Pensions and other age-related expenditures in Europe Is ageing too expensive?
 1 Pensions and other age-related expenditures in Europe Is ageing too expensive? Bo Magnusson bo.magnusson@his.se Bernd-Joachim Schuller bernd-joachim.schuller@his.se University of Skövde Box 408 S-541
Spain France. England Netherlands. Wales Ukraine. Republic of Ireland Czech Republic. Romania Albania. Serbia Israel. FYR Macedonia Latvia
 Germany Belgium Portugal Spain France Switzerland Italy England Netherlands Iceland Poland Croatia Slovakia Russia Austria Wales Ukraine Sweden Bosnia-Herzegovina Republic of Ireland Czech Republic Turkey
This DataWatch provides current information on health spending
 DataWatch Health Spending, Delivery, And Outcomes In OECD Countries by George J. Schieber, Jean-Pierre Poullier, and Leslie M. Greenwald Abstract: Data comparing health expenditures in twenty-four industrialized
Public Pension Spending Trends and Outlook in Emerging Europe. Benedict Clements Fiscal Affairs Department International Monetary Fund March 2013
 Public Pension Spending Trends and Outlook in Emerging Europe Benedict Clements Fiscal Affairs Department International Monetary Fund March 13 Plan of Presentation I. Trends and drivers of public pension
THE SEARCH FOR FISCAL SPACE AND THE NEW CHALLENGES TO BUDGETING. 34 th annual meeting of Senior Budget Officials Paris, 3-4 June, 2013
 THE SEARCH FOR FISCAL SPACE AND THE NEW CHALLENGES TO BUDGETING 34 th annual meeting of Senior Budget Officials Paris, 3-4 June, 2013 The overwhelming pressure of fiscal consolidation RPF 2012: 25 out
Double-Taxing Capital Income: How Bad Is the Problem?
 November 15, 2006 Double-Taxing Capital Income: How Bad Is the Problem? by Patrick Fleenor Fiscal Fact No. 71 Introduction Double taxation is a common and often misused expression in tax policy discussions.
Private pensions. A growing role. Who has a private pension?
 Private pensions A growing role Private pensions play an important and growing role in providing for old age in OECD countries. In 11 of them Australia, Denmark, Hungary, Iceland, Mexico, Norway, Poland,
Growth in OECD Unit Labour Costs slows to 0.4% in the third quarter of 2016
 Growth in OECD Unit Labour Costs slows to.4% in the third quarter of 26 Growth in unit labour costs (ULCs) in the OECD area slowed to.4% in the third quarter of 26 (compared with.6% in the previous quarter)
Poul Erik Petersen World Health Organization
 Tackling Social Inequity through Primary Health Care -WHO Update Poul Erik Petersen World Health Organization Global Oral Health Programme Chronic Disease and Health Promotion Geneva - Switzerland Objectives
EUROPA - Press Releases - Taxation trends in the European Union EU27 tax...of GDP in 2008 Steady decline in top corporate income tax rate since 2000
 DG TAXUD STAT/10/95 28 June 2010 Taxation trends in the European Union EU27 tax ratio fell to 39.3% of GDP in 2008 Steady decline in top corporate income tax rate since 2000 The overall tax-to-gdp ratio1
Australian welfare spending trends: past changes and future drivers Brotherhood of St Laurence lunchtime seminar
 Australian welfare spending trends: past changes and future drivers Brotherhood of St Laurence lunchtime seminar John Daley CEO, Grattan Institute 8 August 213 Overview Stable overall spending conceals
Glossary of Defined Terms
 Glossary of Defined Terms Glossary History Change Date April 2007 July 2007 Description of Changes Initial Launch Amendment of definition of administrator(s) Glossary History July 2007 Page 1 of 1 A Accredited
Themes Income and wages in Europe Wages, productivity and the wage share Working poverty and minimum wage The gender pay gap
 5. W A G E D E V E L O P M E N T S At the ETUC Congress in Seville in 27, wage developments in Europe were among the most debated issues. One of the key problems highlighted in this respect was the need
DANMARKS NATIONALBANK
 DANMARKS NATIONALBANK WEALTH, DEBT AND MACROECONOMIC STABILITY Niels Lynggård Hansen, Head of Economics and Monetary Policy. IARIW, Copenhagen, 21 August 2018 Agenda Descriptive evidence on household debt
ILO World of Work Report 2013: EU Snapshot
 Greece Spain Ireland Poland Belgium Portugal Eurozone France Slovenia EU-27 Cyprus Denmark Netherlands Italy Bulgaria Slovakia Romania Lithuania Latvia Czech Republic Estonia Finland United Kingdom Sweden
TUC Statement on the HM Treasury Spring Statement : Time for action
 TUC Statement on the HM Treasury Spring Statement : Time for action Time for action At the Autumn Budget the Chancellor looked to a future that will be full of change; full of new challenges and above
Income, pensions, spending and wealth
 CHAPTER 18 Income, pensions, spending and wealth After four years of growth, the median after-tax income for Canadian families of two or more people remained virtually stable in 2008 at $63,900. The level