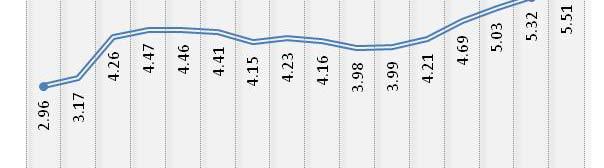
Average per capita income evolution R$ at 2009
|
|
|
- Briana Lawrence
- 5 years ago
- Views:
Transcription


1 Average per capita income evolution R$ at * * , 40,5 7,95 506,70 514,75 518,96 527,24 483,99 506,53 507,72 477,89 492,45 524,75 572,69 585, ,65 630,25 1
2 2 Increase of Average househol Per Capita Income (all sources) 2001 to 2009Aumentodarendafamiliarpercapitaacumulada Menosde10%de10%a20%de20%a30%de20%a30%de30%a40%Maisde40% Average Income PNAD X GDP The magnitude of the resumption of growth in the period depends onthe database used: GDP period depends on the database used: GDP grows 3.78% in per capita per year, slower than the National Survey by Household Sampling (PNAD), 5.26 % per year, also discounting population growth and inflation. According to PNAD 2009 income i th GDP 15% f grows more once gain than GDP: 1.5% of per capita GDP against a positive growth of 2.04% in PNAD.
3 300,00 Welfare evolution R$ Sen s 1976 Measure = Average * (1 Gini) 280,00 260,00 240,00 220,00 200,00 180,00 160,00 203,00 204,93 207,36 210,84 196,67 204,79 208,87 199,29 211,21 226,57 250,68 260, ,81 286,92 140, , , ,41 100, * * Gini s index Evolution 0,62 0,61 0,60 0,59 0,58 0,57 0,56 0,55 0,54 0,53 0,52 0,5832 0,6068 0,5994 0,6019 0,6004 0,6001 0,5937 0,5957 0,5886 0,5830 0,5711 0,5682 0,5623 0,5550 0, , , * *
 Richer 4")
4 Inequality Gini s Index Source: CPS/FGV based on microdata from PNAD and Census / IBGE Accumulated Variation of Average Income by Income Tenths - Brazil (2009/2001) Richer 4
")
 Richer 5")
5 Variation of the Annual Per Capita of Average Income per Income Tenths - Brazil (2009/2008) Richer Variation of the Annual Per Capita of Average Income per Income Tenths - Brazil (2009/2003) Richer 5

6 Variation of the Annual Per Capita of Average Income per Income Tenths(2009/2001) Richer Total Income Participation in Brazil 41,8% 42,8% 15,4% Source: CPS / FGV based on microdata from PNAD / IBGE 6


7 Definition of Economic Classes Total Household Income from All Sources Earnings Brackets Inferior Superior Class E Class D Class C Class B Class A
8 Economic classes evolution Class AB/C Class D/E ,1 59,6 61, , ,9 30 Fonte: CPS/FGV a partir dos microdados da PNAD/IBGE Economic classes evolution Class AB Class C Class D/E , , , , , ,6 0 Fonte: CPS/FGV a partir dos microdados da PNAD/IBGE 8
9 Economic classes evolution Class E % -4.32% Class D % -3.00% Class C 34.32% 2.49% Class B 38.51% 3.49% Class A 40.99% 0.18% Fonte: CPS/FGV a partir dos microdados da PNAD/IBGE Population Difference by Economic Classes Class E -20,481,069-1,022,145 Class D -2,431, ,083 Class C 29,063,545 3,172,653 Class B 3,391, ,181 Class A 3,253, ,487 Fonte: CPS/FGV a partir dos microdados da PNAD/IBGE 9


10 The Population Pyramid divided in Economic Classes Class DE Class C Class AB Population by Economic Classes Total 175,398, ,758, ,001, ,218, ,384, ,440, ,194,383 Class E 49,319,851 45,147,533 41,047,646 35,196,724 33,659,359 29,860,927 28,838,782 Class D 46,884,477 48,286,025 48,713,422 48,006,542 46,298,711 45,399,117 44,453,034 Class C 65,871,283 70,620,183 75,266,800 81,889,806 86,476,548 91,762,175 94,934,828 Class B 6,977,329 7,100,301 7,583,287 8,549,859 9,271,379 9,925,842 10,369,023 Class A 6,345,080 6,604,018 7,390,555 8,575,570 8,678,295 9,492,229 9,598,716 10
11 The Key Role of the New Middle Class. Politics The 94.9 million Brazilians who are in the new middle class represent 50,5% of the population. This means that the new Brazilian middle class not only includes the median voter taken as the one who decides d the second round of an election, but that this class alone could decide an election campaign. The Key Role of the New Middle Class Economics The new middle class is also economically dominating, concentrating more 46.24% of the purchasing power of Brazilians in 2009 (it was 45.66% in 2008) surpassing those classes AB with 44.12% of total purchasing power. The other classes D and E now has 9.65% of the purchasing power (falling from 19.79% just before the release of the Real Plan. 11


12 Class A Evolution Class B Evolution 12


13 Class C Evolution Class D Evolution 13

14 Class E Evolution Economic Classes More Detailled Definition Total Household Income from All Sources Income Brackets limits Inferior Superior Class E Class E Class D Class D Class C Class C Class B Class B Class A Class A
15 14,31% 7,23% 7,28% ,81% 8,78% 8,05% Economic Classes Evolution More Detailed Classification 13,69% 11,28% 10,81% 13,04% 13,07% 12,81% 18,68% 22,69% 22,31%,53% 28,13% 18,88% 26, 2,01% 2,86% 2,94% 1,97% 2,46% 2,57% 1,83% 2,55% 2,50% 1,78% 2,54% 2,60% E2 E1 D2 D1 C2 C1 B2 B1 A2 A Income Mass by Economic Classes More Detailed Classification 29,2 2% 3 1,8% 32,9% 1,4% 0,5% 0,4% 3,1% 1,5% 1,4% 4,8% 3,1% 2,9% 6,6 6% 5,1% 4,9% 14,3% 13,8% 13,4% 5,8 8% 6,4 4% 6,4 4% 7, 6, 7,,1% 9%,0% 9,1% 9,7% 9,3% 18,6% 21,3% 21,4% E2 E1 D2 D1 C2 C1 B2 B1 A2 A1 15
16 16 Annual Rate of Poverty Reduction (Class E) 2003/2009TaxaAnualdeReduçãodaPobreza Até5%de5%a7,5%de7,5%a10%de10%a12,5%de12,5%a15%Maisde15%1993/1995TaxaAnualAté5%de5%a7,5%de7,5%a10%de10%a12,5%de12,5%a15%Maisde15%Source: CPS / FGV based on microdata from PNAD / IBGE Annual rate of growth in class ABC 2003/ /1995TaxaAnualdeCrescimentodasClassesABC Até5%de5%a7,5%de7,5%a10%de10%a12,5%de12,5%a15%Maisde15%Source: CPS / FGV based on microdata from PNAD / IBGE TaxaAnualAté5%de5%a7,5%de7,5%a10%de10%a12,5%de12,5%a15%Maisde15%


17 % Poverty In Minimun Wages Lines , , , , ,87 23,96 19,85 18,71 52,96 less than 1/4 1/4 to 1/2 more than de 1/2 17
18 Classic Indicators of Poverty 2003 % Poverty In Minimun Wages Lines ,0 32,50 30,58 Up to 1/2 Consumers and Producers 18


19 Simulador de Renda Is it Sustainable? The synthetic indicator of potential consumption power increasedby 22.6% between 2003 and 2008, while the index of the generation of income raised 31.2%. Difference of 38% in favor of the production side. During the crisis these indexes raised 2.49% and 3.05% respectively. 19

20 Net Generation of Formal Employment - BRAZIL Yearly (2000 to 2010 July*) * * up to august only Source: CPS/FGV based on microdata from CAGED / M T E. 20


21 Occupation Occupied 1992 to years or more* 21

22 Occupation Occupied years or more* 67,33% 61,29% 49,24% 41,84% class AB class C class D class E Fonte: CPS/FGV a partir dos microdados da PNAD/IBGE Occupation Profile of Economic Classes 2009 Position on the Occupation Category CLASS AB CLASS C CLASS D CLASS E Unemployed 2.14% 3.86% 7.20% 10.11% Inactive 30.53% 34.84% 43.56% 48.05% Agricultural employee 0.29% 2.33% 4.49% 4.68% Domestic employee 0.57% 4.53% 5.95% 4.27% Formal Employee 21.11% 22.96% 11.77% 4.31% Informal Employee 4.85% 6.75% 6.68% 4.47% Self employed 11.89% 11.85% 11.00% 11.05% Employer 9.81% 2.14% 0.55% 0.55% Public Employee 16.84% 7.09% 3.19% 1.61% Unpaid 1.95% 3.65% 5.62% 10.90% 22

23 Pension Contribution Private and/or Public (Social Security) Contributes to Social Security Contributes Soc. Sec. Pub. & Priv Contributes Soc. Sec. Public Contributes Soc. Sec. Priv Unemployed Inactive Digital Assets Computer with internet at Home 1992 to

24 Digital Assets Cellular Phone (at lest one at Home) 1992 to 2009 Digital Assets At Home COMPUTER Have computer with Internet Have computer Doesn t have computer Unknown TELEPHONE Have fixed and Cellphone Have fixed Have Cellphone Doesn t have fixed and Cellphone

 Average Years of Schooling Brazil - 1992-2008 Age 25 years or")
25 Digital Assets at Home 75,82% Computer with internet ,90% class AB class C 9,69% class D 6,73% class E 95,92% 86,23% Cellular Phone ,23% 62,81% class AB class C class D class E Education Evolution (years) Average Years of Schooling Brazil Age 25 years or more 25

 2009 12 10 8 6 4 2 0 12,00 7,18 5,46 4,98 class AB class C class D class E Attends or attended Schools 2009 47,67% 10,47% 2,07% 2,44% class AB")
26 Education Evolution (%) of the population by Educational Level EDUCATION OF THE HEAD Without education or less than 1 year to to to or more EDUCATION OF THE SPOUSE Withouteducation or less than 1 year to to to or more Education Completed Years of Schooling (pop. with 25 years or more) ,00 7,18 5,46 4,98 class AB class C class D class E Attends or attended Schools ,67% 10,47% 2,07% 2,44% class AB class C class D class E 26


27 Public Services Sewage 1992 to 2009 Public Services Garbage collected directly 1992 to


28 Public Services 72,02% Sewage ,78% 40,45% 30,65% class AB class C class D class E Garbage collected directly ,85% 87,46% 76,97% 64,20% class AB class C class D class E Consumer Goods Washing machine 1992 to 2009 Washing machine ,72% 53,22% 24,96% 16,48% class AB class C class D class E 28


29 99,54% 97,62% 96,00% 7/10/2010 Consumer Goods Refrigerator 1992 to 2009 Refrigerator ,69% 97,49% 92,50% 79,82% class AB class C class D class E Consumer Goods Television 1992 to 2009 Television ,16% class AB class C class D class E 29


30 More than 3 bathrooms 1992 to 2009 More than 3 bathrooms ,24% 1,07% 0,23% 0,35% class AB class C class D class E Financed homeowners 1992 to ,74% Financed homeowners ,97% 2,98% 1,69% class AB class C class D class E 30
31 Evolution (%) Population by Housing Condition Own already paid Own still paying Rent below the median Rent above the median Given Other condition ORDER OF ENTRY IN THE MODEL 1 Number of per capita 2 Telephone 3 Spouses education 4 Type of family 5 chefe contribui para previdência head contributes to social security 6 Washing machine 7 # of bedrooms per capita 8 Head s education 9 position on the head s job 10 school attendance of child(7 to 14 years) 11 school attendance of child (0 a 6 anos) 12 position on the head s job 13 Computer 14 Refrigerator 15 school attendance of child (15 a 17 anos) 16 type of home (own, lease and financing) 17 Syndicalized Head 18 Freezer 19 # of bedrooms per capita 20 sewage 21 Radio 22 # of bathrooms 23 number of residents 24 Television 25 Garbage colected 26 age that the head started to work 27 number of rooms 28 share of labor income 29 # of bedrooms 31


32 Pre Crisis (Dec 2002 a 2009 x Crisis (Dec 2008 a 2009) Class ABC Class AB Class C Class D Class E Income Gini THEIL 0,4% 2,4% 8,2% 1,5% 0,4% 1,6% 4,2% 1,8% 0,1% 3,8% 4,2% 2,0% 3,7% 1,4% 3,8% 0,0% dec02 to dec08 dec08 to dec09 Source: CPS/FGV based on microdata from PME/IBGE Variation in Economic Classes in Post-Crisis Class ABC Class AB Class C Class D Class E 0,8% 1,0% 0,8% 5,3% 0,7% 1,2% 0,8% 3,0% 0,6% 6, 7% 2,3% 0,6% 2,7% 2,2% 0,2% 2,5% 2,5% 1,2% 4,1% 1,1% set08 to dec08 dec08 to jan09 jan09 to set09 out09 to dec09 Source: CPS/FGV based on microdata from PME/IBGE 32


33 Class ABC Class AB Class C Class D Class E 0,4% % 13,0% 2,4% 1,5% 3,8% 0,1% 3,9% 5,5% 4,2% 2,0% 7,8 3,7% 2,9% 3,4% 1,4% dec02 to dec08 dec08 to dec09 janjun09 to janjun10 jul09 to jul10 7,7 7% 12,4% 8,2 % 8,6% % 11,3% Source: CPS/FGV based on microdata from PME/IBGE 3,8% Class ABC Class AB Class C Class D Class E 12, 0,4% 2,4% 3,2% 3,4% 3,7% 4,8% 4,2% 4,4% 5,5% 4,2% 2,0% 5,5% 7,2 2% 5,3% 9,2% 10,3% 9,7% 13,0% 3,7% 4,6% 4,9% 8,4% 9,3% 8,8% 10,0%,4% 8,2% 0,1% 7,9% 8,7% 7,2% 10,0% 8,8% 9,0% 1,3% 1,4% 1,5% 2,5% 2,4% 3,3% 3,6% 2,5% 3,0% 3,4% 1 dec02 to dec08 dec08 to dec09 jan09 to jan10 feb09 to feb10 mar09 to mar10 apr09 to apr10 may09 to may10 jun09 to jun10 jul09 to jul10 Source: CPS/FGV based on microdata from PME/IBGE 33


34 income Gini THEIL 0,4% 1,6% 1,9% 1,4% 4,2% 1,8% 5,1% 2,7% 0,0% 3,8% 3,6% 7,7 7% dec02 to dec08 dec08 to dec09 janjun09 to janjun10 jul09 to jul10 Source: CPS/FGV based on microdata from PME/IBGE income Gini THEIL 0,4% 1,6% 1,8% 1,5% 1,5% 2,2% 1,9% 2,2% 1,4% 7,2% % 6,2 2% 5, 4,2% 1,8% 3,8%,8% 3,4% 4,3% 2,7% 0,9% 0,0% 3,8 8% 3,9 9% 3,6 6% 5,1% 4,6% 3,7 7% 7,7% dec02 to dec08 dec08 to dec09 jan09 to jan10 feb09 to feb10 mar09 to mar10 apr09 to apr10 Source: CPS/FGV based on microdata from PME/IBGE 34
35 Elections and Expantions" Variation in Median Income and Electoral Cycles* % % % % % % % % % % % % % % % % % % % % % % % Obs:In 1991, 1994 and 2000 PNAD did not go to the field 35
Measures of Polarization and Conceptualization of Middle Class
 * Measures of Polarization and Conceptualization of Middle Class The EGR strategy generates brackets of income classes of the income distribution observed in practice. The brackets chosen were the ones
Rio Social Change : Is There a Pre-Olympic Legacy? Executive Summary
 Rio Social Change 2009-2016: Is There a Pre-Olympic Legacy? www.fgv.br/fgvsocial/rio2016/en Executive Summary The project s prime objective is to measure the evolution of the Rio population s living conditions
Goals. Access the project site
 Goals The main goal of this project is to assess the change in the quality of life of the population in Rio after the olympic venue announcement. We analyzed several areas such as education, labor, housing,
6/8/2017. Looking Through the X. Rio2016 announcement
 **** About the Project The term Olympic legacy refers generally to the projection of the gains to be seized by the city after the realization of the event. But can we already assess significant inflections
Income Inequality and Labor Market Dynamics in Brazil
 Income Inequality and Labor Market Dynamics in Brazil Fernando de Holanda Barbosa Filho IBRE FGV Brazilian Institute of Economics Getulio Vargas Foundation Facts Income inequality declined in Brazil over
Reducing Inequality and The Brazilian Social Protection System. South-South Learning Forum 2014 Rio de Janeiro, March 17
 Reducing Inequality and The Brazilian Social Protection System South-South Learning Forum 2014 Rio de Janeiro, March 17 REAL GDP PER CAPITA* AND GINI INDEX** (*) Values updated by the GDP deflator (2011).
Income inequality and mobility in Australia over the last decade
 Income inequality and mobility in Australia over the last decade Roger Wilkins Meeting of National Economic Research Organisations, OECD Headquarters, 18 June 2012 1993-94 1994-95 1995-96 1996-97 1997-98
Ministry of Finance. Brazilian Economic OUTLOOK
 of Finance Brazilian Economic OUTLOOK Special Edition Year of 2010 Summary Foreword: A balance of the 2000s Economic Activity Mass Consumer Market Inflation Interest Rates and Credit International Overview
Cost Estimation of a Manufacturing Company
 Cost Estimation of a Manufacturing Company Name: Business: Date: Economics of One Unit: Manufacturing Company (Only complete if you are making a product, such as a bracelet or beauty product) Economics
Rate of Access to Insurance by Type Total Population (15 years old and above)
") Rate of Access to Insurance by Type Total Population (15 years old and above) 16,79 12,94 2,95 4,31 0,45 Seguros (total) Plano / Seguro- Saúde Seguro de Veículo Seguro de Vida Previdência Privada Aberta
Rate of Access to Insurance by Type Total Population (15 years old and above) 16,79 12,94 2,95 4,31 0,45 Seguros (total) Plano / Seguro- Saúde Seguro de Veículo Seguro de Vida Previdência Privada Aberta
BRAZILIAN ECONOMIC OUTLOOK
 BRAZILIAN ECONOMIC OUTLOOK BRAZILIAN ECONOMIC OUTLOOK Henrique Meirelles Henrique Meirelles February 8th, 2016 February 08th, 2016 INTRODUCTION 80 s Hyper inflation and volatility. 1994 Monetary stabilization
Banco do Brasil. 2Q10 Conference Call
 Banco do Brasil 2Q10 Conference Call 1 Disclaimer This presentation may include references and statements, planned synergies, increasing estimates, projections of results and future strategy for Banco
Private Equity in Brazil
 Round Table: Cimarron Partners Private Equity in Brazil Henrique Meirelles 28 de Fevereiro de 2013 1 Agenda Introduc7on Macroeconomic and Poli7cal Stability Brazil Private Equity: Challenges and Opportuni7es
Poverty and Inequality Dynamics in Manaus: Legacy of a Free Trade Zone?
 Poverty and Inequality Dynamics in : Legacy of a Free Trade Zone? Marta Menéndez (LEDa DIAL, Université Paris-Dauphine) Marta Reis Castilho (Universidade Federal do Rio de Janeiro, Brazil) Aude Sztulman
Capital Flows to Latin America: Policy Challenges and Responses
 Capital Flows to Latin America: Policy Challenges and Responses Javier Guzmán Calafell Director General Center for Latin American Monetary Studies INTERNATIONAL CAPITAL MOVEMENTS: OLD AND NEW DEBATES Cusco,
POVERTY AND THE NEW RURAL MIDDLE CLASS
 66 67 article POVERTY AND THE NEW RURAL MIDDLE CLASS MARCELO NERI Marcelo Neri ECONOMIST - HEAD OF THE FGV SOCIAL POLICIES CENTER (CPS) AND PROFESSOR AT RIO DE JANEIRO SCHOOL OF ECONOMICS OF FGV FOUNDATION
Otaviano Canuto Vice President & Head of Network Poverty Reduction and Economic Management The World Bank
 Otaviano Canuto Vice President & Head of Network Poverty Reduction and Economic Management The World Bank The 11th International Academic Conference on Economic and Social Development April 6-8, 2010 Moscow
INTERNATIONAL CRISIS AND POLICY RESPONSES IN BRAZIL. Secretariat of Economic Policy January 2010
 INTERNATIONAL CRISIS AND POLICY RESPONSES IN BRAZIL January 2010 1 CONDITIONS TO FACE THE CRISIS 2 CONDITIONS TO FACE THE CRISIS International Reserves and Low External Vulnerability Fiscal Responsibility
QUESTION 2. QUESTION 3 Which one of the following is most indicative of a flexible short-term financial policy?
 QUESTION 1 Compute the cash cycle based on the following information: Average Collection Period = 47 Accounts Payable Period = 40 Average Age of Inventory = 55 QUESTION 2 Jan 41,700 July 39,182 Feb 18,921
Global Economic Prospects and the Developing Countries William Shaw December 1999
 Global Economic Prospects and the Developing Countries 2000 William Shaw December 1999 Prospects for Growth and Poverty Reduction in Developing Countries Recovery from financial crisis uneven International
Macro Research Economic outlook
 Macro Research Economic outlook Macroeconomic Research Itaú Unibanco April 2017 Roadmap Global Economy The global outlook remains favorable Global growth positive momentum continues, with a synchronized
ON MEASURING SOCIAL TENSIONS: with Applications to Brazil
 ABSTRACT ON MEASURING SOCIAL TENSIONS: with Applications to Brazil Marcelo Neri Centro de Políticas Sociais (CPS/FGV) and EPGE/FGV-RJ Nanak Kakwani University of New South Wales, NSW, Sydney, Australia
P R O J E T A THE ECONOMIST
 SCENARIOS OF THE BRAZILIAN ECONOMY Carlos Geraldo Langoni PricewaterhouseCoopers September / 2010 THE ECONOMIST STRUCTURAL CHANGES WORLD LEVEL: MULTIPOLARITY; DOMESTICALLY: MACRO CONSENSUS. MULTIPOLAR
** Bolsa Família and the Economy (A Look on Final Goals)
") Accumulated variation of extreme poverty (p.p.) 12/05/2017 ** Bolsa Família and the Economy (A Look on Final Goals) Marcelo Neri Extreme Poverty Cumulative REDISTRIBUTION Effect Accumulated variation in
Accumulated variation of extreme poverty (p.p.) 12/05/2017 ** Bolsa Família and the Economy (A Look on Final Goals) Marcelo Neri Extreme Poverty Cumulative REDISTRIBUTION Effect Accumulated variation in
Overall Results - CCTs (Brazil)
") *Income Distribution, Distribution of Opportunities and Income Policies in Brazil: A Next Generation of CCTs? Marcelo Neri FGV Social/CPS *1 (Income Policies Block) Ref *2 A Next Generation of CCTs? Outline
*Income Distribution, Distribution of Opportunities and Income Policies in Brazil: A Next Generation of CCTs? Marcelo Neri FGV Social/CPS *1 (Income Policies Block) Ref *2 A Next Generation of CCTs? Outline
Nº 520 ISSN A new incidence analysis of Brazilian social policies using multiple data sources. Marcelo Neri
 Nº 520 ISSN 0104-8910 A new incidence analysis of Brazilian social policies using multiple data sources Marcelo Neri Dezembro de 2003 A New Incidence Analysis of Brazilian Social Policies Using Multiple
Ensaios Econômicos. Brazil s Middle Classes. Dezembro de Escola de. Pós-Graduação. em Economia. da Fundação. Getulio Vargas N 759 ISSN
 Ensaios Econômicos Escola de Pós-Graduação em Economia da Fundação Getulio Vargas N 759 ISSN 0104-8910 Brazil s Middle Classes Marcelo Côrtes Neri Dezembro de 2014 URL: http://hdl.handle.net/10438/12988
INCOME, EXPENDITURE AND CONSUMPTION OF HOUSEHOLDS IN 2016
 INCOME, EXPENDITURE AND CONSUMPTION OF HOUSEHOLDS IN 2016 Household income The annual total income average per capita is 5 167 BGN in 2016 and increases by 4.3 compared to 2015. The total income average
ASSETS, MARKETS AND POVERTY IN BRAZIL*
 Red de Centros de Investigación de la Oficina del Economista Jefe Banco Interamericano de Desarrollo (BID) Documento de Trabajo R-357 ASSETS, MARKETS AND POVERTY IN BRAZIL* por Coordinator: Marcelo Côrtes
ECONOMY. Designing a new future THE BRAZILIAN
 Argentina The rebuilding of Argentina Industry Change to survive Interview Marcelo Neri Director of the Social Policy Center of FGV THE BRAZILIAN ECONOMY A publication of the Getulio Vargas Foundation
The Health of Jefferson County: 2010 Demographic Update
 The Health of : 2010 Demographic Update BACKGROUND How people live the sociodemographic context of their lives influences their health. People who have lower incomes may not have the resources to meet
Development and investment prospects for Brazil. Brazilian American Chamber of Commerce Washington, October 10 th 2014
 1 Development and investment prospects for Brazil Brazilian American Chamber of Commerce Washington, October 10 th 2014 2 Guide Growth prospects: sources of dynamism Investment forecast The role of BNDES
Interim results presentation 2017
 Interim results presentation 2017 Contents Key indicators Operating environment What differentiates us Highlights Bank Save Credit Continued focus Key indicators Key indicators Earnings 4 000 3 500 3 000
Household Budget Survey
 Central Bank of the Islamic Republic of Iran General Directorate of Economic Statistics Household Budget Survey In Urban Areas in Iran 1381 (March 21,2002 March 20,2003) Economic Statistics Bahman 1382
Trends and Transitory Shocks
 EMBARGOED UNTIL WEDNESDAY, SEPTEMBER 27 AT 7:00 P.M.; OR UPON DELIVERY Trends and Transitory Shocks Eric S. Rosengren President & CEO Federal Reserve Bank of Boston September 27, 2017 The Money Marketeers
Poverty Reduction in Brazil: Changes in the Profile and in the Determinants during the Early 2000s
 Texto para Discussão 012 2017 Discussion Paper 012 2017 Poverty Reduction in Brazil: Changes in the Profile and in the Determinants during the Early 2000s Valéria Pero Associate Professor at the Economics
INCOME, EXPENDITURE AND CONSUMPTION OF HOUSEHOLDS IN 2017
 INCOME, EXPENDITURE AND CONSUMPTION OF HOUSEHOLDS IN 2017 Household income The annual total income average per capita is 5 586 BGN in 2017 and increases by 8.1 compared to 2016. The total income average
The Underground Economy. Fernando de Holanda Barbosa Filho IBRE FGV Brazilian Institute of Economics Getulio Vargas Foundation
 The Underground Economy Fernando de Holanda Barbosa Filho IBRE FGV Brazilian Institute of Economics Getulio Vargas Foundation Underground Economy Refers to economic activities not reported to the authorities
Transparency in the U.S. Repo Market
 Transparency in the U.S. Repo Market Antoine Martin Federal Reserve Bank of New York October 11, 2013 The views expressed in this presentation are my own and may not represent the views of the Federal
INCOME DISTRIBUTION AND INEQUALITY MEASURES IN SINGAPORE
 Conference on Chinese Population and Socioeconomic Studies: Utilizing the 2000/2001 round Census Data Hong Kong University of Science and Technology 19-21 June 2002, Hong Kong SAR INCOME DISTRIBUTION AND
A Consistent Data Series to Evaluate Growth and Inequality in the National Accounts
 A Consistent Data Series to Evaluate Growth and Inequality in the National Accounts David Johnson with D. Fixler, A. Craig, K. Furlong, Bureau of Economic Analysis Frontiers of Measuring Household Economic
The Future of Mexican Monetary Policy
 The Future of Mexican Monetary Policy Mr. Javier Guzmán Calafell, Deputy Governor, Banco de México* XP Securities Mexico Summit Mexico City, 2 March 2017 */ The views expressed herein are strictly personal.
Economic Conditions and Outlook and Consumer Credit Conditions
 Economic Conditions and Outlook and Consumer Credit Conditions NACM-CFDD Kansas City Kansas City, MO Kelly D. Edmiston Senior Economist Disclaimer This presentation reflects the views of the speaker and
BNDES: The Financial Support for IT and Innovation Projects. December 2010
 BNDES: The Financial Support for IT and Innovation Projects December 2010 Demand Drivers for IT in Brazil Domestic demandis supporting growth: increasing employment rates and salaries; reducing social
Financial results presentation Full year 2013
 Financial results presentation Full year 2013 1 Contents Presentation of Speakers 2013 Operating Environment & Banking Industry CAL Bank Performance Highlights Income Statement Balance Sheet Share Price
Gini coefficient
 POVERTY AND SOCIAL INCLUSION INDICATORS (Preliminary results for 2010) 1 Poverty and social inclusion indicators are part of the general EU indicators for tracing the progress in the field of poverty and
BRICs: actual growth and cooperation perspectives. International Advisory Council 3 rd Metting August 15, Luciano Coutinho President
 BRICs: actual growth and cooperation perspectives International Advisory Council 3 rd Metting August 15, 2011 Luciano Coutinho President Emerging countries remain ahead in worldwide growth Annual Growth
Labour Market Challenges: Turkey
 Labour Market Challenges: Turkey Conference Presentation «Boosting the social dimension in the Western Balkans and Turkey» Hakan Ercan Middle East Technical University, Ankara 31.01.2018 Belgrade 1 Growth
Poland s Economic Prospects
 Poland s Economic Prospects Unicredit Conference Warsaw, June 8, 11 Mark Allen Senior IMF Resident Representative for Central and Eastern Europe Recovery is driven by domestic demand Contributions to Real
ECONOMIC REPORT. Cost reduction and investment are key to resume economic growth. Brazilian economy in the third quarter of 2012
 ECONOMIC REPORT Newsletter of the National Confederation of Industry Year 28 Number 03 July/September 2012 www.cni.org.br Cost reduction and investment are key to resume economic growth Brazilian economy
Global Economic Prospects: Navigating strong currents
 Global Economic Prospects: Navigating strong currents Andrew Burns World Bank January 18, 2011 http://www.worldbank.org/globaloutlook Main messages Most developing countries have passed with flying colors
Financial stability is seen in the narrow sense of households being able to repay loans, and banks being exposed to the risk of non-performing loans,
 FINANCE AND HOUSING IN CENTRAL AND EASTERN EUROPE: A DEMAND-SIDE APPROACH Liviu Voinea, Deputy Governor, National Bank of Romania Finance and Housing Panel, Bruegel Annual Meetings 217 In 215, ESRB published
THE BRAZILIAN ECONOMY AND THE AGENDA FOR REFORMS
 THE BRAZILIAN ECONOMY AND THE AGENDA FOR REFORMS XX Joint of Japan Brazil Economic Cooperation Committee José Augusto Coelho Fernandes Policy and Strategy Director Curitiba, August 28th, 2017 FROM TOKYO
Prices. Poverty Analysis. Poverty Datum Lines July Price $2.00. Enquiries: Tel /7. Date: 16 August 2016
 Prices Poverty Analysis Main findings Price $2.00 Enquiries: Tel.706681/7 e-mail:prices@zimstat.co.zw Date: 16 August 2016 Poverty Datum Lines July 2016 The Food Poverty Line (FPL) for one person in July
A welfare union? Conference, BEI Luxembourg Kirchberg 10 December Tito Boeri, Università Bocconi. Tito Boeri Luxembourg Kirchberg Déc.
 A welfare union? Conference, BEI Luxembourg Kirchberg 10 December Tito Boeri, Università Bocconi Tito Boeri Luxembourg Kirchberg Déc. The stress test Great Depression and Great Recession Fonte: Eichengreen
Evaluation of Latvia s Public Works Program (WWS)
") Capacity Building workshop on Impact Evaluation of Employment Programs Evaluation of Latvia s Public Works Program (WWS) Celine Ferre (Mehtabul Azam, Mohamed Ihsan Ajwad), Gdańsk, February 22, 2017 Background
Capacity Building workshop on Impact Evaluation of Employment Programs Evaluation of Latvia s Public Works Program (WWS) Celine Ferre (Mehtabul Azam, Mohamed Ihsan Ajwad), Gdańsk, February 22, 2017 Background
Annual General Meeting Fiscal Year 2013
 Annual General Meeting Fiscal Year 2013 Oberhausen, April 16, 2014 Check against delivery. GEA Group Aktiengesellschaft Performance of GEA Group 2 Annual General Meeting Fiscal Year 2013 Highlights of
Automated labor market diagnostics for low and middle income countries
 Poverty Reduction Group Poverty Reduction and Economic Management (PREM) World Bank ADePT: Labor Version 1.0 Automated labor market diagnostics for low and middle income countries User s Guide: Definitions
Public Disclosure Copy
 Public Disclosure Authorized LATIN AMERICA AND CARIBBEAN Brazil Social Protection & Labor Global Practice IBRD/IDA Investment Project Financing FY 2011 Seq No: 14 ARCHIVED on 21-Dec-2017 ISR30624 Implementing
Too Big to Fail: Discussion of Quantifying Subsidies for SIFIs. Philip E. Strahan, Boston College & NBER. Minneapolis Fed.
 Too Big to Fail: Discussion of Quantifying Subsidies for SIFIs Philip E. Strahan, Boston College & NBER Minneapolis Fed November 13 Distortions for TBTF borrowers Debt is too cheap for TBTF firms and not
Challenges to monetary policy in the EMEs
 Challenges to monetary policy in the EMEs A view into the Brazilian Case Governor of the Banco Central do Brasil Ilan Goldfajn November 18th, 2017 Outline Benign international conditions and Emerging Markets
Current Economic Review April 16, 2014
 Current Economic Review April 16, 2014 Brian Bonnenfant Project Manager Center for Regional Studies University of Nevada, Reno 784-1771 bonnen@unr.edu 230,000 225,000 **Peak = 228,100 Emp **Start of Great
Contents. HSBC Group in the world. HSBC in Brazil. New Economic Scenario / Macroeconomic Forecasts
 HSBC GLOBAL & LOCAL STRATEGY IN A NEW ECONOMIC SCENARIO Conrado Engel CEO & President of HSBC Bank Brasil 26 March 2010 The British Chamber of Commerce and Industry in Brazil - São Paulo 0 Contents HSBC
Appendix E: The Economic Security Scorecard Sources and Definitions
 Appendix E: The Economic Security Scorecard Sources and Definitions Economic Security Element Policy Area (Individual) Policy Data Definition Data Source Minimum Wage State Minimum Wage Minimum Wage State
Report to CenSus Joint Committee
 Report to CenSus Joint Committee 9 th December 2016 By The Head of Revenues and Benefits (CenSus) INFORMATION REPORT CenSus Revenues and Benefits report. Executive Summary This report sets out the 16/17
Beyond market incorporation: challenges ahead
 INOVANDO NO SETOR PÚBLICO BRASILEIRO Desafios Ins*tucionais e Polí*cas Públicas INNOVATION FOR INCLUSIVE GROWTH Columbia University NYC 2015 Beyond market incorporation: challenges ahead Lena LAVINAS Ins$tute
Development of Economy and Financial Markets of Kazakhstan
 Development of Economy and Financial Markets of Kazakhstan National Bank of Kazakhstan Macroeconomic development GDP, real growth, % 116 112 18 14 1 113,5 11,7 216,7223,8226,5 19,8 19,8 19,3 19,619,7 199,
Introduction to the UK Economy
 Introduction to the UK Economy What are the key objectives of macroeconomic policy? Price Stability (CPI Inflation of 2%) Growth of Real GDP (National Output) Falling Unemployment / Raising Employment
Brazil. Results 1H13. July 30 th, 2013
 Brazil Results 1H13 July 30 th, 2013 Important information Banco Santander, S.A. ("Santander") cautions that this presentation contains forward-looking statements within the meaning of the US Private Securities
National Economic Conditions. Cheyenne AIA Meeting February 25th, 2011 Rob Godby
 National Economic Conditions Cheyenne AIA Meeting February 25th, 2011 Rob Godby Percent Change Recovery is Technically Underway 8 Quarter-Quarter Growth in Real GDP 6 4 2 0-2 -4-6 -8 I II III IV I II III
Economic Outlook. Macroeconomic Research Itaú Unibanco
 Economic Outlook Macroeconomic Research Itaú Unibanco March 2015 Overview International Global growth on the rise. U.S. interest rates will soon follow U.S. economic fundamentals remain solid. Rates are
Quarterly Statistical Digest
 Quarterly Statistical Digest August Volume 27, No. 3 The Statistical Digest is a quarterly publication of the Central Bank of The Bahamas, prepared by the Research Department for issue in February, May,
Macroeconomic Impact of the Subprime Crisis
 Franco German Council of Economic Advisors Paris, 5 February 2008 Dr. Stefan Kooths DIW Berlin, Macro Analysis and Forecasting Approach Assuming a strictly macroeconomic point of view - Thinking in aggregates
Gallons per Capita - v2.05
 Gallons per Capita - v2.5 This spreadsheet-based GPCD calculator is designed to help quantify and track water uses associated with water distribution systems. The spreadsheet contains several separate
Brazil. Results January 30 th, 2014
 Brazil Results 2013 January 30 th, 2014 Important information Banco Santander, S.A. ("Santander") cautions that this presentation contains forward-looking statements within the meaning of the US Private
UNIVERSITY OF CALIFORNIA Economics 134 DEPARTMENT OF ECONOMICS Spring 2018 Professor Christina Romer LECTURE 16
 UNIVERSITY OF CALIFORNIA Economics 134 DEPARTMENT OF ECONOMICS Spring 2018 Professor Christina Romer LECTURE 16 FISCAL POLICY IN THE GREAT RECESSION MARCH 19, 2018 I. OVERVIEW II. ECONOMIC STIMULUS ACT
Case No. FINANCIAL AFFIDAVIT
 IN THE DISTRICT COURT OF COUNTY STATE OF OKLAHOMA Plaintiff, Case No. v. Defendant, FINANCIAL AFFIDAVIT This document is filed by father/mother (Circle one) FATHER: ADDRESS: CITY, STATE, ZIP SOC SEC NO:
London Borough of Barnet Pension Fund. Communication Strategy (2018)
") London Borough of Barnet Pension Fund Communication Strategy (2018) Background This document sets out the communication strategy for the London Borough of Barnet Pension Fund. The London Borough of Barnet
London Borough of Barnet Pension Fund Communication Strategy (2018) Background This document sets out the communication strategy for the London Borough of Barnet Pension Fund. The London Borough of Barnet
THE BRAZILIAN ECONOMY AND THE AGENDA FOR REFORMS
 THE BRAZILIAN ECONOMY AND THE AGENDA FOR REFORMS VIII CNI DIPLOMATIC BRIEFING José Augusto Coelho Fernandes Policy and Strategy Director Brasilia, November 21st, 2017 FROM JUNE TO NOVEMBER WHAT CHANGED
EMPLOYMENT AND EARNINGS
 L2- EMPLOYMENT AND EARNINGS U.S. Department of Labor Bureau of Labor Statistics October 997 In this issue: Third quarter 997 averages for household survey data Monthly Household Data Historical A-. Employment
Structural Reforms in the Argentine Economy: Achievements and Pending Reforms
 Structural Reforms in the Argentine Economy: Achievements and Pending Reforms Achievements Elimination of Capital Flows Controls ( cepo ) Agreement with holdouts and resolution of conflicts with other
Employment from the BLS household and payroll surveys: summary of recent trends
 Employment from the BLS household and payroll surveys: summary of recent trends Overview The Bureau of Labor Statistics (BLS) has two monthly surveys that measure employment levels and trends: the Current
Spheria Australian Smaller Companies Fund
 29-Jun-18 $ 2.7686 $ 2.7603 $ 2.7520 28-Jun-18 $ 2.7764 $ 2.7681 $ 2.7598 27-Jun-18 $ 2.7804 $ 2.7721 $ 2.7638 26-Jun-18 $ 2.7857 $ 2.7774 $ 2.7690 25-Jun-18 $ 2.7931 $ 2.7848 $ 2.7764 22-Jun-18 $ 2.7771
International Monetary Fund Washington, D.C.
 2004 International Monetary Fund May 2004 IMF Country Report No. 04/140 January 29, 2001 January 29, 2001 January 29, 2001 January 29, 2001 January 29, 2001 Republic of Belarus: Statistical Appendix This
Economic Overview York County, South Carolina. February 14, 2018
 Economic Overview York County, February 14, 2018 DEMOGRAPHIC PROFILE... 3 EMPLOYMENT TRENDS... 5 UNEMPLOYMENT RATE... 5 WAGE TRENDS... 6 COST OF LIVING INDEX... 6 INDUSTRY SNAPSHOT... 7 OCCUPATION SNAPSHOT...
Investor Presentation JUNE 2018
 Investor Presentation JUNE 2018 Forward Looking Statements & Other Disclosure Matters Forward-Looking Statements - This presentation contains forward-looking statements within the meaning of the federal
Common stock prices 1. New York Stock Exchange indexes (Dec. 31,1965=50)2. Transportation. Utility 3. Finance
2. Transportation. Utility 3. Finance") Digitized for FRASER http://fraser.stlouisfed.org/ Federal Reserve Bank of St. Louis 000 97 98 99 I90 9 9 9 9 9 9 97 98 99 970 97 97 ""..".'..'.."... 97 97 97 97 977 978 979 980 98 98 98 98 98 98 987 988
Digitized for FRASER http://fraser.stlouisfed.org/ Federal Reserve Bank of St. Louis 000 97 98 99 I90 9 9 9 9 9 9 97 98 99 970 97 97 ""..".'..'.."... 97 97 97 97 977 978 979 980 98 98 98 98 98 98 987 988
Forecasting long-term electricity demand in the residential sector
 Available online at www.sciencedirect.com ScienceDirect Procedia Computer Science 55 (2015 ) 529 538 Information Technology and Quantitative Management (ITQM 2015) Forecasting long-term electricity demand
Regional overview Gisborne
 Regional overview Purchasing intentions - additional income-related rent subsidy (IRRS) places Area District 1 2 3 4+ TOTAL 3 35 5 7 total 3 35 5 7 7 8 9 1 11 Purchasing intentions - change within the
Section 6621 of the Internal Revenue Code establishes the interest rates on
 Part 1 Section 6621.--Determination of Rate of Interest 26 CFR 301.6621-1: Interest rate. Rev. Rul. -32 Section 6621 of the Internal Revenue Code establishes the interest rates on overpayments and underpayments
Exotic Tea Prices. Year
 Price, cents per pound UNDERSTANDING HOW TO READ GRAPHS Information is often presented in the form of a graph, a diagram that shows numerical data in a visual form. Graphs enable us to see relationships
Nonfarm Payroll Employment
 PRESIDENT'S REPORT TO THE BOARD OF DIRECTORS, FEDERAL RESERVE BANK OF BOSTON Current Economic Developments - June 10, 2004 Data released since your last Directors' meeting show the economy continues to
Lower GDP growth due to new drop in industry
 Change in investment% Newsletter of the National Confederation of Industry ISSN 1983-621X Year 29 Number 02 April/June 2014 www.cni.org.br Lower GDP growth due to new drop in industry Brazilian economy
Section 6621(c) provides that for purposes of interest payable under 6601 on any large corporate underpayment, the underpayment
 provides that for purposes of interest payable under 6601 on any large corporate underpayment, the underpayment") Section 6621. Determination of Interest Rate 26 CFR 301.6621 1: Interest rate. Interest rates; underpayments and overpayments. The rate of interest determined under section 6621 of the Code for the calendar
Section 6621. Determination of Interest Rate 26 CFR 301.6621 1: Interest rate. Interest rates; underpayments and overpayments. The rate of interest determined under section 6621 of the Code for the calendar
Regional overview Hawke's Bay
 Regional overview Purchasing intentions - additional income-related rent subsidy (IRRS) places Area Hastings Central 1 2 3 4+ TOTAL 5 5 25 125 3 3 1 7 total 8 8 35 195 7 8 9 1 11 Purchasing intentions
SOVEREIGN ISSUES PLURINATIONAL STATE OF BOLIVIA
 SOVEREIGN ISSUES PLURINATIONAL STATE OF BOLIVIA Presented by Roger Edwin Rojas Ulo Vice Minister of the Treasury and Public Credit Ministry of Economy and Public Finance Brussels, 4 April 2014 Bolivia
New Jersey Employer Certification
 New Jersey Employer Certification Oxford Health Insurance, Inc. or Oxford Health Plans (NJ), Inc. ( Oxford ) Mailing Address: Oxford Group Enrollment, P.O. Box 29142, Hot Springs, AR 71903-9142 800-385-9088
1Q of FY ending December 31, (0.2) (1.9) 11.3 (0.2) (0.2) (0.2) (0.2) (1.2) (89.2) 0.1
 (1.9) 11.3 (0.2) (0.2) (0.2) (0.2) (1.2) (89.2) 0.1") August 6, ISEKI & CO., LTD. Supplementary Information to Consolidated Financial Results (April 1, June 30, ) I. Consolidated business results for the three months ended June 30, (Billions of yen, %) Year-on
August 6, ISEKI & CO., LTD. Supplementary Information to Consolidated Financial Results (April 1, June 30, ) I. Consolidated business results for the three months ended June 30, (Billions of yen, %) Year-on
Asia Key Economic and Financial Indicators 20-Oct-16
 Asia Key Economic and Financial Indicators -Oct- ASEAN Brunei (BN) Cambodia (KH) Indonesia () Laos (LA) Malaysia () Myanmar (MM) Philippines () Singapore () Thailand () Vietnam () East Asia China (CN)
The effects of changes to housing benefit in the private rented sector
 The effects of changes to housing benefit in the private rented sector Robert Joyce, Institute for Fiscal Studies Presentation at ESRI, Dublin 5 th March 2015 From joint work with Mike Brewer, James Browne,