UNIVERSITY OF CALIFORNIA Economics 134 DEPARTMENT OF ECONOMICS Spring 2018 Professor Christina Romer LECTURE 16
|
|
|
- Cuthbert Watts
- 6 years ago
- Views:
Transcription
1 UNIVERSITY OF CALIFORNIA Economics 134 DEPARTMENT OF ECONOMICS Spring 2018 Professor Christina Romer LECTURE 16 FISCAL POLICY IN THE GREAT RECESSION MARCH 19, 2018 I. OVERVIEW II. ECONOMIC STIMULUS ACT OF 2008 A. Why passed so quickly? B. Expected effects C. Taylor s Evidence D. Parker, Souleles, Johnson, and McClelland E. Could more aggressive stimulus have prevented the crisis? III. AMERICAN RECOVERY AND REINVESTMENT ACT OF 2009 A. Background B. Practical issues involved in designing a fiscal stimulus C. Cross-country evidence of effects D. Evidence from a natural experiment E. Evaluation of the Recovery Act IV. FISCAL DEVELOPMENTS AFTER 2010 A. What was happening in the economy? B. What was done and why wasn t there another stimulus? C. Fiscal contraction after 2012

2 Economics 134 Spring 2018 Christina Romer David Romer LECTURE 16 Fiscal Policy in the Great Recession March 19, 2018
3 I. OVERVIEW OF FISCAL POLICY IN THE GREAT RECESSION
4 Fiscal Policy in the Great Recession What was done and why? How well did it work? Discuss history, practical considerations, and more empirical evidence on the effects of fiscal policy.
5 Fiscal Policy Actions Economic Stimulus Act of 2008 American Recovery and Reinvestment Act of 2009 Various extensions of certain pieces of the ARRA Contractionary policy after 2012
6 High-Employment Budget Surplus Percent of GDP
7 II. ECONOMIC STIMULUS ACT OF 2008
8 Economic Stimulus Act of 2008 February 2008 $152 billion Tax rebate of up to $1200 per family Business investment tax incentives
9 Case-Shiller House Price Index 250 April Jan-87 Jan-89 Jan-91 Jan-93 Jan-95 Jan-97 Jan-99 Jan-01 Jan-03 Jan-05 Jan-07 Jan-09 Jan-11 Jan-13 Jan-15 Jan-17 Index, January 2000=100
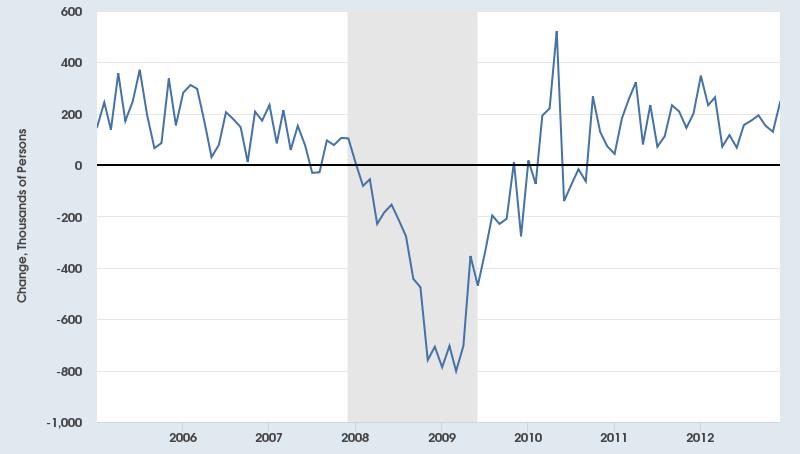
10 Change in Employment
11 Fiscal Policy Multiplier Multiplier shows how much real GDP rises in response to $1 of stimulus. For example, $1 of public investment raises GDP by about $1.50.
12 What would we expect the impact to be?
13 2001 tax rebate was part of the Economic Growth and Tax Relief Reconciliation Act of 2001, passed 6/7/ tax rebate was part of the Economic Stimulus Act of 2008, passed 2/13/08.
14 Taylor s Key Graph
15 Taylor s Regression Evidence
16 Potential Problems with Taylor s Regression Specification Variables included Omitted variable bias Outliers
17 Disposable Income and House Prices Disposable Income House Price Index Disposable Personal Income Jan 2007 Feb 2007 Mar 2007 Apr 2007 May 2007 Jun 2007 Jul 2007 Aug 2007 Sep 2007 Oct 2007 Nov 2007 Dec 2007 Jan 2008 Feb 2008 Mar 2008 Apr 2008 May 2008 Jun 2008 Jul 2008 Aug 2008 Sep 2008 Oct 2008 Nov 2008 Dec 2008 FHFA House Price Index
18 Stock Prices, August 2000 October Dec 1993 Sep 1994 Jun 1995 Mar 1996 Dec 1996 Sep 1997 Jun 1998 Mar 1999 Dec 1999 Sep 2000 Jun 2001 Mar 2002 Dec 2002 Sep 2003 Jun 2004 Mar 2005 Dec 2005 Sep 2006 Jun 2007 Mar 2008 Dec 2008 Sep 2009 Jun 2010
19 Real Personal Consumption Expenditures August Jul 2000-Aug 2000-Sep 2000-Oct 2000-Nov 2000-Dec 2001-Jan 2001-Feb 2001-Mar 2001-Apr 2001-May 2001-Jun 2001-Jul 2001-Aug 2001-Sep 2001-Oct 2001-Nov 2001-Dec 2002-Jan 2002-Feb 2002-Mar 2002-Apr 2002-May 2002-Jun September 11 th is a large outlier that may be obscuring the effect of the rebate.
20 Parker, Souleles, Johnson, and McClelland Empirical Strategy When households received their 2008 tax rebate was random. Why is this important? Question was added to the Consumer Expenditure Survey about whether the household got a stimulus payment that month (and if so, how much). Compare spending of households that did and did not get a stimulus payment to see if the payment affected spending.
21

22 PSJM Regression Specification
23 Contemporaneous Response of Expenditures to ESP Receipt among All Households
24 Evaluation of PSJM Very nicely done; good identification. Not enough explanation of the data and how they use the timing. Some of the material could safely have been put in an online appendix. Only shows the first-round effect of the rebate; it is not the full multiplier.
25 The Longer-Run Response of Expenditures to ESP Receipt
26 The Propensity to Spend across Different Households
27 The Propensity to Spend on Subcategories of Expenditures
28 Broader Implications of PSJM Fiscal stimulus affects behavior in the expected direction. Consumer behavior is not fully explained by the permanent income hypothesis. Consumers respond to temporary changes in income.
29 Could more aggressive fiscal stimulus in early 2008 have prevented the crisis?
30 III. AMERICAN RECOVERY AND REINVESTMENT ACT OF 2009

31 Percent Change in Real GDP
32 Practical Issues in Designing a Fiscal Stimulus How big does it need to be? Needed size is not independent of composition. Timing? What else is the government trying to accomplish with the stimulus?
33 American Recovery and Reinvestment Act of 2009 February 2009 $787 billion (5½ % of GDP) Tax credit of up to $800 per family Business investment tax incentives Aid to state and local governments Aid to unemployed Government spending on infrastructure and other investments
34 Estimates from Cross-Country Evidence CEA, First Quarterly Report, July 2010
35 CEA, First Quarterly Report, July 2010
36 Strengths and Weaknesses of this Approach: Doesn t use history; it uses the cross-section variation. Clever way of controlling for the fact that countries have very different normal rates of growth. May still have omitted variable bias.

37 Estimates from a Natural Experiment CEA, First Quarterly Report, July 2010
38 Estimates from a Natural Experiment CEA, First Quarterly Report, July 2010
39 Employment growth is higher in states getting more formula-based Medicaid funding. Source: Chodorow-Reich, Feiveson, Liscow, and Woolston (Forthcoming)
40 Strengths and Weaknesses of this Approach: Very clever experiment. Focuses on a type of spending we had little evidence on before. Worry about chance correlation. Focuses on effects at the state level, but our interest is in national effects. Are the effects too large to be believable?

41 Estimates from a Natural Experiment Source: Chodorow-Reich, Feiveson, Liscow, and Woolston (2013).
42 What is the bottom line on the design and effectiveness of the Recovery Act?
43 IV. FISCAL DEVELOPMENTS AFTER 2010
44 Change in Employment
45 High-Employment Budget Surplus Percent of GDP
46 Subsequent Stimulus Measures Various measures related to Unemployment Insurance (UI): Continued extended unemployment insurance Payroll tax cut: Reduction in Social Security tax rate of 2 percentage points in 2011 and 2012 Various other measures: Extra state fiscal relief.
47 Why No Large Second (or Third) Stimulus?
48 Moves to Fiscal Contraction after 2012 End of Social Security tax cut Winding down of Recovery Act Tax increases related to the Affordable Care Act Tax increases passed as part of the fiscal cliff agreement at the beginning of 2013 Spending cuts
LECTURE 5 The Effects of Fiscal Changes: Cross-Section Evidence. September 21, 2016
 Economics 210c/236a Fall 2016 Christina Romer David Romer LECTURE 5 The Effects of Fiscal Changes: Cross-Section Evidence September 21, 2016 I. OVERVIEW OF STATE-BASED STUDIES OF THE IMPACT OF FISCAL CHANGES
LECTURE 6 The Effects of Fiscal Changes: Cross-Section Evidence. September 26, 2018
 Economics 210c/236a Fall 2018 Christina Romer David Romer LECTURE 6 The Effects of Fiscal Changes: Cross-Section Evidence September 26, 2018 Office Hours No office hours this Thursday (9/27). Office hours
LECTURE 4 The Effects of Fiscal Changes: Government Spending. September 21, 2011
 Economics 210c/236a Fall 2011 Christina Romer David Romer LECTURE 4 The Effects of Fiscal Changes: Government Spending September 21, 2011 I. INTRODUCTION Theoretical Considerations (I) A traditional Keynesian
Professor Christina Romer. LECTURE 22 FISCAL POLICY April 14, 2016
 Economics 2 Spring 2016 Professor Christina Romer Professor David Romer LECTURE 22 FISCAL POLICY April 14, 2016 I. REVIEW OF THE KEYNESIAN CROSS DIAGRAM A. Determination of output in the short run B. What
Professor Christina Romer. LECTURE 21 FISCAL POLICY April 10, 2018
 Economics 2 Spring 2018 Professor Christina Romer Professor David Romer LECTURE 21 FISCAL POLICY April 10, 2018 I. REVIEW OF THE KEYNESIAN CROSS DIAGRAM A. Determination of output in the short run B. What
Professor Christina Romer. LECTURE 22 FISCAL POLICY April 14, 2016
 Economics 2 Spring 2016 Professor Christina Romer Professor David Romer LECTURE 22 FISCAL POLICY April 14, 2016 I. REVIEW OF THE KEYNESIAN CROSS DIAGRAM A. Determination of output in the short run B. What
XML Publisher Balance Sheet Vision Operations (USA) Feb-02
 Feb-02") Page:1 Apr-01 May-01 Jun-01 Jul-01 ASSETS Current Assets Cash and Short Term Investments 15,862,304 51,998,607 9,198,226 Accounts Receivable - Net of Allowance 2,560,786
Page:1 Apr-01 May-01 Jun-01 Jul-01 ASSETS Current Assets Cash and Short Term Investments 15,862,304 51,998,607 9,198,226 Accounts Receivable - Net of Allowance 2,560,786
Factor Leave Accruals. Accruing Vacation and Sick Leave
 Factor Leave Accruals Accruing Vacation and Sick Leave Factor Leave Accruals As part of the transition of non-exempt employees to biweekly pay, the UC Office of the President also requires standardization
Big Walnut Local School District
 Big Walnut Local School District Monthly Financial Report for the month ended September 30, 2013 Prepared By: Felicia Drummey Treasurer BIG WALNUT LOCAL SCHOOL DISTRICT SUMMARY OF YEAR TO DATE FINANCIAL
2013 San Diego Economic Outlook. Marney Cox Chief Economist San Diego Association of Governments November 15, 2012
 2013 San Diego Economic Outlook Marney Cox Chief Economist San Diego Association of Governments November 15, 2012 The Problem Gross Domestic Product Trillion$ Annual Gap Potential GDP Actual GDP 1990-2012
February Economic Activity Index ( GDB-EAI )
") February 2014 Economic Activity Index ( GDB-EAI ) General Commentary February 2014 In February 2014, the GDB-EAI registered a 2.4% year-over-year (y-o-y) reduction (the lowest since May 2013), after showing
February 2014 Economic Activity Index ( GDB-EAI ) General Commentary February 2014 In February 2014, the GDB-EAI registered a 2.4% year-over-year (y-o-y) reduction (the lowest since May 2013), after showing
Economic Indicators For Manufacturing Executives
 Economic Indicators For Manufacturing Executives Valuable Data for a Complex World Presented by: Cliff Waldman Chief Economist, MAPI Foundation cwaldman@mapi.net Today s Presentation The Value of Economic
Leading Economic Indicator Nebraska
 Nebraska Monthly Economic Indicators: December 20, 2017 Prepared by the UNL College of Business Administration, Bureau of Business Research Author: Dr. Eric Thompson Leading Economic Indicator...1 Coincident
Figure 1: Change in LEI-N August 2018
 Nebraska Monthly Economic Indicators: September 26, 2018 Prepared by the UNL College of Business, Bureau of Business Research Author: Dr. Eric Thompson Leading Economic Indicator...1 Coincident Economic
HIPIOWA - IOWA COMPREHENSIVE HEALTH ASSOCIATION Unaudited Balance Sheet As of July 31
 Unaudited Balance Sheet As of July 31 Total Enrollment: 407 Assets: Cash $ 9,541,661 $ 1,237,950 Invested Cash 781,689 8,630,624 Premiums Receivable 16,445 299,134 Prepaid 32,930 34,403 Assessments Receivable
Spheria Australian Smaller Companies Fund
 29-Jun-18 $ 2.7686 $ 2.7603 $ 2.7520 28-Jun-18 $ 2.7764 $ 2.7681 $ 2.7598 27-Jun-18 $ 2.7804 $ 2.7721 $ 2.7638 26-Jun-18 $ 2.7857 $ 2.7774 $ 2.7690 25-Jun-18 $ 2.7931 $ 2.7848 $ 2.7764 22-Jun-18 $ 2.7771
HIPIOWA - IOWA COMPREHENSIVE HEALTH ASSOCIATION Unaudited Balance Sheet As of January 31
 Unaudited Balance Sheet As of January 31 Total Enrollment: 371 Assets: Cash $ 1,408,868 $ 1,375,117 Invested Cash 4,664,286 4,136,167 Premiums Receivable 94,152 91,261 Prepaid 32,270 33,421 Assessments
June Economic Activity Index ( GDB-EAI )
") June 2014 Economic Activity Index ( GDB-EAI ) General Commentary June 2014 In June 2014, the GDB-EAI registered a 1.0% year-over-year (y-o-y) reduction, after showing a 1.1% y-o-y decrease in June 2014.
June 2014 Economic Activity Index ( GDB-EAI ) General Commentary June 2014 In June 2014, the GDB-EAI registered a 1.0% year-over-year (y-o-y) reduction, after showing a 1.1% y-o-y decrease in June 2014.
Fiscal Year 2018 Project 1 Annual Budget
 Fiscal Year 2018 Project 1 Annual Budget Table of Contents Table Page Summary 3 Summary of Costs Table 1 4 Treasury Related Expenses Table 2 5 Summary of Full Time Equivalent Table 3 6 Positions Cost-to-Cash
Leading Economic Indicator Nebraska
 Nebraska Monthly Economic Indicators: July 24, 2015 Prepared by the UNL College of Business Administration, Department of Economics Authors: Dr. Eric Thompson, Dr. William Walstad Leading Economic Indicator...1
Leading Economic Indicator Nebraska
 Nebraska Monthly Economic Indicators: October 24, 2018 Prepared by the UNL College of Business, Bureau of Business Research Author: Dr. Eric Thompson Leading Economic Indicator...1 Coincident Economic
Leading Economic Indicator Nebraska
 Nebraska Monthly Economic Indicators: July 29, 2016 Prepared by the UNL College of Business Administration, Department of Economics Authors: Dr. Eric Thompson, Dr. William Walstad Leading Economic Indicator...1
ACA Reporting E-File Errors, Penalties & Exchange Notices
 ACA Reporting E-File Errors, Penalties & Exchange Notices Agenda 1). Who is ACA Reporting Service? (quickly) 2). Setting the ACA Reporting Stage 3). The Process Leading up to E-Filing 4). E-Filing through
Leading Economic Indicator Nebraska
 Nebraska Monthly Economic Indicators: June 17, 2016 Prepared by the UNL College of Business Administration, Department of Economics Authors: Dr. Eric Thompson, Dr. William Walstad Leading Economic Indicator...1
TERMS OF REFERENCE FOR THE INVESTMENT COMMITTEE
 I. PURPOSE The purpose of the Investment Committee (the Committee ) is to recommend to the Board the investment policy, including the asset mix policy and the appropriate benchmark for both ICBC and any
Introduction and Economic Landscape. Vance Ginn Spring 2013
 Introduction and Economic Landscape Vance Ginn Spring 2013 Introduction CV (underlined words typically are links or videos) Syllabus We will use Blackboard, which is where you will find the syllabus, important
Economic Activity Index ( GDB-EAI ) For the month of May 2013 G O V E R N M E N T D E V E L O P M E N T B A N K F O R P U E R T O R I C O
 For the month of May 2013 G O V E R N M E N T D E V E L O P M E N T B A N K F O R P U E R T O R I C O") Economic Activity Index ( GDB-EAI ) For the month of May 2013 General Commentary May 2013 GDB-EAI for the month of May registered a 3.4% year-over-year ( YOY ) reduction May 2013 EAI was 126.7, a 3.4%
Economic Activity Index ( GDB-EAI ) For the month of May 2013 General Commentary May 2013 GDB-EAI for the month of May registered a 3.4% year-over-year ( YOY ) reduction May 2013 EAI was 126.7, a 3.4%
National Economic Conditions. Cheyenne AIA Meeting February 25th, 2011 Rob Godby
 National Economic Conditions Cheyenne AIA Meeting February 25th, 2011 Rob Godby Percent Change Recovery is Technically Underway 8 Quarter-Quarter Growth in Real GDP 6 4 2 0-2 -4-6 -8 I II III IV I II III
Review of Registered Charites Compliance Rates with Annual Reporting Requirements 2016
 Review of Registered Charites Compliance Rates with Annual Reporting Requirements 2016 October 2017 The Charities Regulator, in accordance with the provisions of section 14 of the Charities Act 2009, carried
Empirical evaluation of the 2001 and 2003 tax cut policies on personal consumption: Long Run impact
 Georgia State University From the SelectedWorks of Fatoumata Diarrassouba Spring March 29, 2013 Empirical evaluation of the 2001 and 2003 tax cut policies on personal consumption: Long Run impact Fatoumata
Leading Economic Indicator Nebraska
 Nebraska Monthly Economic Indicators: September 20, 2017 Prepared by the UNL College of Business Administration, Bureau of Business Research Author: Dr. Eric Thompson Leading Economic Indicator...1 Coincident
Leading Economic Indicator Nebraska
 Jan 12 Feb 12 Mar 12 Apr 12 May 12 Jun 12 Jul 12 Nebraska Monthly Economic Indicators: February 17, 2012 Prepared by the UNL College of Business Administration, Department of Economics Authors: Dr. Eric
May Economic Activity Index ( FAFAA-EAI )
") May 2016 Economic Activity Index ( FAFAA-EAI ) About the interpretation of the FAFAA-EAI The FAFAA-EAI is an indicator of general economic activity, not a direct measurement of real GNP. The annual growth
May 2016 Economic Activity Index ( FAFAA-EAI ) About the interpretation of the FAFAA-EAI The FAFAA-EAI is an indicator of general economic activity, not a direct measurement of real GNP. The annual growth
Leading Economic Indicator Nebraska
 Nebraska Monthly Economic Indicators: January 17, 2014 Prepared by the UNL College of Business Administration, Department of Economics Authors: Dr. Eric Thompson, Dr. William Walstad Graduate Research
Leading Economic Indicator Nebraska
 Nebraska Monthly Economic Indicators: June 21, 2017 Prepared by the UNL College of Business Administration, Bureau of Business Research Author: Dr. Eric Thompson Leading Economic Indicator...1 Coincident
Leading Economic Indicator Nebraska
 Nebraska Monthly Economic Indicators: August 15, 2014 Prepared by the UNL College of Business Administration, Department of Economics Authors: Dr. Eric Thompson, Dr. William Walstad Graduate Research Assistants:
UNIVERSITY OF CALIFORNIA Economics 134 DEPARTMENT OF ECONOMICS Spring 2018 Professor David Romer LECTURE 9
 UNIVERSITY OF CALIFORNIA Economics 134 DEPARTMENT OF ECONOMICS Spring 2018 Professor David Romer LECTURE 9 THE CONDUCT OF POSTWAR MONETARY POLICY FEBRUARY 14, 2018 I. OVERVIEW A. Where we have been B.
200 Years Of The U.S. Stock Market
 200 Years Of The U.S. Stock Market Professor John McConnell Krannert School of Management Purdue University September 25, 2018 1 200 Years Of The U.S. Stock Market Market Overview The long term The averages
QUESTION 2. QUESTION 3 Which one of the following is most indicative of a flexible short-term financial policy?
 QUESTION 1 Compute the cash cycle based on the following information: Average Collection Period = 47 Accounts Payable Period = 40 Average Age of Inventory = 55 QUESTION 2 Jan 41,700 July 39,182 Feb 18,921
Key IRS Interest Rates After PPA
 Key IRS Rates - After PPA - thru 2011 Page 1 of 10 Key IRS Interest Rates After PPA (updated upon release of figures in IRS Notice usually by the end of the first full business week of the month) Below
February Economic Activity Index ( GDB-EAI )
") February 2015 Economic Activity Index ( GDB-EAI ) General Commentary February 2015 In February 2015, the GDB-EAI registered a 1.6% year-over-year (y-o-y) reduction, and a month-over-month (m-o-m) increase
February 2015 Economic Activity Index ( GDB-EAI ) General Commentary February 2015 In February 2015, the GDB-EAI registered a 1.6% year-over-year (y-o-y) reduction, and a month-over-month (m-o-m) increase
Financial & Business Highlights For the Year Ended June 30, 2017
 Financial & Business Highlights For the Year Ended June, 17 17 16 15 14 13 12 Profit and Loss Account Operating Revenue 858 590 648 415 172 174 Investment gains net 5 162 909 825 322 516 Other 262 146
Perspective on Colorado s Budget and Economy
 Perspective on Colorado s Budget and Economy November 2012 Office of State Planning and Budgeting Henry Sobanet, Director Erick Scheminske, Deputy Director www.colorado.gov/ospb Comparison of Change in
Leading Economic Indicator Nebraska
 Nebraska Monthly Economic Indicators: August 19, 2016 Prepared by the UNL College of Business Administration, Department of Economics Authors: Dr. Eric Thompson, Dr. William Walstad Leading Economic Indicator...1
The Stimulus Didn t Work An Overlooked Fact that Needs Mention September 18, 2009
 Northern Trust Global Economic Research 0 South LaSalle Chicago, Illinois northerntrust.com Asha G. Bangalore agb@ntrs.com The Stimulus Didn t Work An Overlooked Fact that Needs Mention September 18, 9
Choosing a Cell Phone Plan-Verizon Investigating Linear Equations
 Choosing a Cell Phone Plan-Verizon Investigating Linear Equations I n 2008, Verizon offered the following cell phone plans to consumers. (Source: www.verizon.com) Verizon: Nationwide Basic Monthly Anytime
Contract Certainty Subscription Market Progress Update for FSA
 Programme Office Contract Certainty Subscription Market Progress Update for FSA 19th September 2006 Dane Douetil, Chair Market Reform Group The Market is making progress in line with expectations 100%
Double Dip? The Investment World: Yesterday, Today & Tomorrow
 Double Dip? The Investment World: Yesterday, Today & Tomorrow Don Rich Head of Tactical Asset Allocation November 10, 2010 Investment Landscape Has Changed Outsourcing is causal to business cycles, around
Quarterly Statistical Digest
 Quarterly Statistical Digest August Volume 27, No. 3 The Statistical Digest is a quarterly publication of the Central Bank of The Bahamas, prepared by the Research Department for issue in February, May,
Welcome to a Post-FICO World!
 Welcome to a Post-FICO World! Consumer credit modeling relies on data and analytics that haven t changed in decades A smarter prime lender could approve almost twice as many borrowers and yet have fewer
2012 As the Fundamentals Improve Stateside, They Deteriorate Abroad
 N O R T H E R N T R U S T G L O B A L E C O N O M I C R E S E A R C H 212 As the Fundamentals Improve Stateside, They Deteriorate Abroad December 211 Paul L. Kasriel, Chief Economist PH: 312..15 plk1@ntrs.com
December Employment Report: Further Deterioration of Labor Market Conditions January 9, 2009
 Northern Trust Global Economic Research 50 South LaSalle Chicago, Illinois 60603 northerntrust.com Asha G. Bangalore agb3@ntrs.com December Employment Report: Further Deterioration of Labor Market Conditions
WESTWOOD LUTHERAN CHURCH Summary Financial Statement YEAR TO DATE - February 28, Over(Under) Budget WECC Fund Actual Budget
 Budget WECC Fund Actual Budget") WESTWOOD LUTHERAN CHURCH Summary Financial Statement YEAR TO DATE - February 28, 2018 General Fund Actual A B C D E F WECC Fund Actual Revenue Revenue - Faith Giving 1 $ 213 $ 234 $ (22) - Tuition $ 226
WESTWOOD LUTHERAN CHURCH Summary Financial Statement YEAR TO DATE - February 28, 2018 General Fund Actual A B C D E F WECC Fund Actual Revenue Revenue - Faith Giving 1 $ 213 $ 234 $ (22) - Tuition $ 226
UNIVERSITY OF CALIFORNIA Economics 134 DEPARTMENT OF ECONOMICS Spring 2018 Professor David Romer
 UNIVERSITY OF CALIFORNIA Economics 134 DEPARTMENT OF ECONOMICS Spring 2018 Professor David Romer LECTURE 3 POSTWAR FLUCTUATIONS AND THE GREAT RECESSION JANUARY 24, 2018 I. CHANGES IN MACROECONOMIC VOLATILITY
The Impact of the Recession on Employment-Based Health Coverage
 May 2010 No. 342 The Impact of the Recession on Employment-Based Health Coverage By Paul Fronstin, Employee Benefit Research Institute E X E C U T I V E S U M M A R Y HEALTH COVERAGE AND THE RECESSION:
Brief Summary of Some of the Cross-Section and Panel Estimates of Fiscal Multipliers
 Brief Summary of Some of the Cross-Section and Panel Estimates of Fiscal Multipliers 1 Chodorow-Reich, Gabriel, Laura Feiveson, Zachary Liscow, and William Gui Woolston. 2012. "Does State Fiscal Relief
LECTURE 8 Monetary Policy at the Zero Lower Bound. October 19, 2011
 Economics 210c/236a Fall 2011 Christina Romer David Romer LECTURE 8 Monetary Policy at the Zero Lower Bound October 19, 2011 I. PAUL KRUGMAN, IT S BAAACK: JAPAN S SLUMP AND THE RETURN OF THE LIQUIDITY
Big Walnut Local School District
 Big Walnut Local School District Monthly Financial Report for the month ended September 30, 2012 Prepared By: Felicia Drummey Treasurer BIG WALNUT LOCAL SCHOOL DISTRICT SUMMARY OF YEAR-TO-DATE FINANCIAL
Professor Christina Romer. LECTURE 15 MACROECONOMIC VARIABLES AND ISSUES March 9, 2017
 Economics 2 Spring 2017 Professor Christina Romer Professor David Romer LECTURE 15 MACROECONOMIC VARIABLES AND ISSUES March 9, 2017 I. MACROECONOMICS VERSUS MICROECONOMICS II. REAL GDP A. Definition B.
MARKET ANALYSIS REPORT NO 1 OF 2015: ONION
 MARKET ANALYSIS REPORT NO 1 OF 215: ONION 1. INTRODUCTION The purpose of this text is to analyze the onion marketing environment. This analysis will be updated on a quarterly basis. The interval covered
Research & Policy Brief Number 4 December 2009
 Institute for Research on Labor and Employment Research & Policy Brief Number 4 December 2009 California Crisis: A Portrait of Unemployed Workers By Lauren D. Appelbaum, Ph.D. Research Director The United
THE ECONOMIC OUTLOOK RECESSION AND RECOVERY. Paul Darby Executive Director & Deuty Chief Economist Twitter hashtag: #psforum
 THE ECONOMIC OUTLOOK RECESSION AND RECOVERY Paul Darby Executive Director & Deuty Chief Economist Darby@conferenceboard.ca US OUTLOOK US recession is coming to an end Q3 likely to be positive due to inventory
FOR RELEASE: MONDAY, MARCH 21 AT 4 PM
 Interviews with 1,012 adult Americans conducted by telephone by Opinion Research Corporation on March 18-20, 2011. The margin of sampling error for results based on the total sample is plus or minus 3
Four Types of Price Variation: Applications for Marketing and Risk Management
 Four Types of Price Variation: Applications for Marketing and Risk Management Duane Griffith Montana State University - Emeritus Wyoming February 2015 Price Patterns Those caused primarily by fundamental
Arkansas Economic Outlook
 Arkansas Economic Forecast Conference 2011 Arkansas Economic Outlook Dr. Michael Pakko Chief Economist and State Economic Forecaster Institute for Economic Advancement, UALR November 2, 2011 Arkansas Experience
MEDICAID FEDERAL SHARE OF MATCHING FUNDS
 MEDICAID FEDERAL SHARE OF MATCHING FUNDS revised by EDR based on FFIS Estimated for FFY 2019 August 3, 2017 Effective State Budget Year State adopted February 2017 State State FY real Difference in state
Cost Estimation of a Manufacturing Company
 Cost Estimation of a Manufacturing Company Name: Business: Date: Economics of One Unit: Manufacturing Company (Only complete if you are making a product, such as a bracelet or beauty product) Economics
Development of Economy and Financial Markets of Kazakhstan
 Development of Economy and Financial Markets of Kazakhstan National Bank of Kazakhstan Macroeconomic development GDP, real growth, % 116 112 18 14 1 113,5 11,7 216,7223,8226,5 19,8 19,8 19,3 19,619,7 199,
April 2018 Data Release
 April 2018 Data Release The Home Purchase Sentiment Index (HPSI) is a composite index designed to track consumers housing-related attitudes, intentions, and perceptions, using six questions from the National
After the Rate Increase, What Then?
 After the Rate Increase, What Then? Robert Eisenbeis, Ph.D. Vice Chairman & Chief Monetary Economist Bob.Eisenbeis@Cumber.com What the FOMC Did At Dec Meeting The Fed made the first step towards normalization
FINANCIAL MANAGEMENT STRATEGY REPORT ON OUTCOMES FOR THE YEAR ENDED MARCH 31, 2016
 FINANCIAL MANAGEMENT STRATEGY REPORT ON OUTCOMES FOR THE YEAR ENDED MARCH 31, 2016 Manitoba Finance General Inquiries: Room 109, Legislative Building Winnipeg, Manitoba R3C 0V8 Phone: 204-945-5343 Fax:
FOR THE STUDY OF RACE AND ETHNICITY
 March 2010 Race-Recovery Index Is Stimulus Helping Communities in Crisis? KIRWAN INSTITUTE FOR THE STUDY OF RACE AND ETHNICITY THE OHIO STATE UNIVERSITY john a. powell Executive Director Andrew Grant-Thomas
FOR THE STUDY OF RACE AND ETHNICITY
 May 2010 Race-Recovery Index Is Stimulus Helping Communities in Crisis? KIRWAN INSTITUTE FOR THE STUDY OF RACE AND ETHNICITY THE OHIO STATE UNIVERSITY john a. powell Executive Director Andrew Grant-Thomas
THE CONFERENCE BOARD LEADING ECONOMIC INDEX (LEI) FOR FRANCE AND RELATED COMPOSITE ECONOMIC INDEXES FOR JANUARY
 FOR FRANCE AND RELATED COMPOSITE ECONOMIC INDEXES FOR JANUARY") FOR RELEASE: 10:00 A.M. CET, TUESDAY, MARCH 17, 2009 The Conference Board France Business Cycle Indicators SM THE CONFERENCE BOARD LEADING ECONOMIC INDEX (LEI) FOR FRANCE AND RELATED COMPOSITE ECONOMIC
FOR RELEASE: 10:00 A.M. CET, TUESDAY, MARCH 17, 2009 The Conference Board France Business Cycle Indicators SM THE CONFERENCE BOARD LEADING ECONOMIC INDEX (LEI) FOR FRANCE AND RELATED COMPOSITE ECONOMIC
Key IRS Interest Rates After PPA
 Key IRS Interest After PPA (updated upon release of figures in IRS Notice usually by the end of the first full business week of the month) Below are Tables I, II, and III showing official interest rates
Too Big to Fail: Discussion of Quantifying Subsidies for SIFIs. Philip E. Strahan, Boston College & NBER. Minneapolis Fed.
 Too Big to Fail: Discussion of Quantifying Subsidies for SIFIs Philip E. Strahan, Boston College & NBER Minneapolis Fed November 13 Distortions for TBTF borrowers Debt is too cheap for TBTF firms and not
Is the bounce for real? Christopher Thornberg Principal, Beacon Economics
 Is the bounce for real? Christopher Thornberg Principal, Beacon Economics Will the real economy stand up? Where are we now? The good news: The recession is over The bad news: we haven t completely fixed
January 2018 Data Release
 January 2018 Data Release The Home Purchase Sentiment Index (HPSI) is a composite index designed to track consumers housing-related attitudes, intentions, and perceptions, using six questions from the
Professor Christina Romer SUGGESTED ANSWERS TO PROBLEM SET 5
 Economics 2 Spring 2016 Professor Christina Romer Professor David Romer SUGGESTED ANSWERS TO PROBLEM SET 5 1. The left-hand diagram below shows the situation when there is a negotiated real wage,, that
PHOENIX ENERGY MARKETING CONSULTANTS INC. HISTORICAL NATURAL GAS & CRUDE OIL PRICES UPDATED TO July, 2018
 Jan-01 $12.9112 $10.4754 $9.7870 $1.5032 $29.2595 $275.39 $43.78 $159.32 $25.33 Feb-01 $10.4670 $7.8378 $6.9397 $1.5218 $29.6447 $279.78 $44.48 $165.68 $26.34 Mar-01 $7.6303 $7.3271 $5.0903 $1.5585 $27.2714
Outlook for the Texas Economy. Luis Bernardo Torres Ruiz, Ph.D. August 26, 2016
 Outlook for the Texas Economy Luis Bernardo Torres Ruiz, Ph.D. August 26, 2016 Research Economist Texas Society of Architects Contents 1. U.S. Economic Outlook 2. Texas Economic Outlook 3. Challenges and
Board of Directors October 2018 and YTD Financial Report
 Board of Directors October 2018 and YTD Financial Report Consolidated Financial Results Operating Margin October ($30,262) $129,301 ($159,563) Year-to-date $292,283 $931,358 ($639,076) Excess of Revenue
Monthly Mutual Fund Report
 July, Monthly Mutual Fund Report Statistics for May-June Sales and Redemptions Total assets for all funds increased in May by $9. billion, or., to $.7 trillion. Money market funds had a net cash outflow
New Hampshire Medicaid Program Enrollment Forecast SFY Update
 New Hampshire Medicaid Program Enrollment Forecast SFY 2011-2013 Update University of New Hampshire Whittemore School of Business and Economics Ross Gittell, James R Carter Professor Matt Magnusson, M.B.A.
1.2 The purpose of the Finance Committee is to assist the Board in fulfilling its oversight responsibilities related to:
 Category: BOARD PROCESS Title: Terms of Reference for the Finance Committee Reference Number: AB-331 Last Approved: February 22, 2018 Last Reviewed: February 22, 2018 1. PURPOSE 1.1 Primary responsibility
2016 Spring Conference And Training Seminar. Cash Planning and Forecasting
 Cash Planning and Forecasting A different world! Cash forecasting starts with expectations about future flows Uses history to identify beginning balances.and to understand patterns of how things interact
Common stock prices 1. New York Stock Exchange indexes (Dec. 31,1965=50)2. Transportation. Utility 3. Finance
2. Transportation. Utility 3. Finance") Digitized for FRASER http://fraser.stlouisfed.org/ Federal Reserve Bank of St. Louis 000 97 98 99 I90 9 9 9 9 9 9 97 98 99 970 97 97 ""..".'..'.."... 97 97 97 97 977 978 979 980 98 98 98 98 98 98 987 988
Digitized for FRASER http://fraser.stlouisfed.org/ Federal Reserve Bank of St. Louis 000 97 98 99 I90 9 9 9 9 9 9 97 98 99 970 97 97 ""..".'..'.."... 97 97 97 97 977 978 979 980 98 98 98 98 98 98 987 988
October 2018 Data Release
 Mar-11 Apr-11 May-11 Jun-11 Jul-11 Aug-11 Sep-11 Oct-11 Nov-11 Dec-11 Jan-12 Feb-12 Mar-12 Apr-12 May-12 Jun-12 Jul-12 Aug-12 Sep-12 Oct-12 Nov-12 Dec-12 Jan-13 Feb-13 Mar-13 Apr-13 May-13 Jun-13 Jul-13
Economic Outlook. Deficit Reduction: Fiscal Drag or Addition through Subtraction? November 30, 2012
 Economic Outlook November 30, 2012 Deficit Reduction: Fiscal Drag or Addition through Subtraction? BY JASON M. THOMAS Given the attention paid to what could go wrong with fiscal cliff negotiations in Washington,
January 2019 Data Release
 Mar-11 Apr-11 May-11 Jun-11 Jul-11 Aug-11 Sep-11 Oct-11 Nov-11 Dec-11 Jan-12 Feb-12 Mar-12 Apr-12 May-12 Jun-12 Jul-12 Aug-12 Sep-12 Oct-12 Nov-12 Dec-12 Jan-13 Feb-13 Mar-13 Apr-13 May-13 Jun-13 Jul-13
Executive Summary. July 17, 2015
 Executive Summary July 17, 2015 The Revenue Estimating Conference adopted interest rates for use in the state budgeting process. The adopted interest rates take into consideration current benchmark rates
June 2018 Data Release
 Mar-11 Apr-11 May-11 Jun-11 Jul-11 Aug-11 Sep-11 Oct-11 Nov-11 Dec-11 Jan-12 Feb-12 Mar-12 Apr-12 May-12 Jun-12 Jul-12 Aug-12 Sep-12 Oct-12 Nov-12 Dec-12 Jan-13 Feb-13 Mar-13 Apr-13 May-13 Jun-13 Jul-13
Constructing a Cash Flow Forecast
 Constructing a Cash Flow Forecast Method and Worked Example A cash flow forecast shows the estimates of the timing and amounts of cash inflows and outflows over a period of time. The sections of a cash
OTHER DEPOSITS FINANCIAL INSTITUTIONS DEPOSIT BARKAT SAVING ACCOUNT
 WEIGHTAGES JAN FEB MAR APR MAY JUN JUL AUG SEPT OCT NOV DEC ANNOUNCEMENT DATE 19.Dez.14 27.Jän.15 24.Feb.15 26.Mär.15 27.Apr.15 26.Mai.15 25.Jun.15 28.Jul.15 26.Aug.15 23.Sep.15 27.Okt.15 25.Nov.15 MUDARIB
HUD NSP-1 Reporting Apr 2010 Grantee Report - New Mexico State Program
 HUD NSP-1 Reporting Apr 2010 Grantee Report - State Program State Program NSP-1 Grant Amount is $19,600,000 $9,355,381 (47.7%) has been committed $4,010,874 (20.5%) has been expended Grant Number HUD Region
New Mexico Continues to Struggle: Las Cruces doing better
 New Mexico Continues to Struggle: Las Cruces doing better Christopher A. Erickson, Ph.D. Department of Economics and International Business College of Business New Mexico State University Chrerick@nmsu.edu
LECTURE 9 The Effects of Credit Contraction: Credit Market Disruptions. October 19, 2016
 Economics 210c/236a Fall 2016 Christina Romer David Romer LECTURE 9 The Effects of Credit Contraction: Credit Market Disruptions October 19, 2016 I. OVERVIEW AND GENERAL ISSUES Effects of Credit Balance-sheet
Nonfarm Payroll Employment
 PRESIDENT'S REPORT TO THE BOARD OF DIRECTORS, FEDERAL RESERVE BANK OF BOSTON Current Economic Developments - June 10, 2004 Data released since your last Directors' meeting show the economy continues to
Performance Report October 2018
 Structured Investments Indicative Report October 2018 This report illustrates the indicative performance of all Structured Investment Strategies from inception to 31 October 2018 Matured Investment Strategies
Dividend Growth as a Defensive Equity Strategy August 24, 2012
 Dividend Growth as a Defensive Equity Strategy August 24, 2012 Introduction: The Case for Defensive Equity Strategies Most institutional investment committees meet three to four times per year to review