Trade Selection Roadmap
|
|
|
- Jasmine Booth
- 6 years ago
- Views:
Transcription


1 Disclaimer The VectorVest Program ( the System ) which we promote is not intended to provide you with specific or personalized advice. In all circumstances where you are looking to apply the System to your own personal needs you should consider whether you should first seek advice from a suitably qualified investment professional. Figures and information provided refer to the past and past performance and are not a reliable indicator of future results. Where stocks are quoted in foreign currencies, returns may increase or decrease as a result of currency fluctuations. In the event that you, as a recipient of this presentation, have any doubts as to the suitability of the investments or services promoted you should seek advice from a suitably qualified investment professional. You should be aware that the value of shares and other stocks may rise or fall. The rules on tax can change, and these changes may have an influence on the effectiveness of the System in the future. It is for you, as the tax payer, to assess the System s effectiveness throughout the process. Some assets are more readily realizable than others, and you should bear in mind that it may be difficult to deal in or obtain reliable information about their value. You should always take account of dealing charges. In addition to any initial charge quoted there may also be a bid/offer spread or dilution. Investments in options and other forms of derivatives may expose you to a higher degree of risk given market circumstances relative to other forms of quoted investments. The System even if used in its entirety, cannot be guaranteed to provide specific returns in the short, medium or long term and you should bear in mind that individual securities may and can fluctuate considerably in value from day to day. The System has been designed without any reference to the specific interests of a particular investor. We reiterate, when using the System, you must take into account your own specific needs and liabilities. This financial promotion has been approved by European Financial Publishing Ltd trading as VectorVest UK which is authorized and regulated by the Financial Services Authority under Register No European Financial Publishing Limited is a company incorporated in Scotland under Company Number SC with its registered address at Exchange Tower, 19 Canning Street, Edinburgh EH3 8EH. 1
2 Trade Selection Roadmap 2
3 Module 3 Review 5 Key Principles Big Mistake To Avoid Action Items To Take 3

4 Trade Selection Roadmap Place trades at the wrong time 4


5 Can t find trades easily Don t know what to look for 5


6 Key Principles of Selecting Trades 1 6
7 Options Trades in general need to take advantage of longer moves in the market. As a result you need a longer term market timing signal. The Primary Wave is the most aggressive signal and results in many buy & sell signals I prefer using the DEW to trade options. It has fewer signals and keys you in to the longer moves more suitable to options trading. 7
8 The DEW signal consists of the DPO, Envelopes, and 30 period WMA. 8
9 On 11/13 we get a DEW Down Signal. This lets you know to be ready to turn bearish. To verify the signal, wait for follow-through. Look for two bars to have lower lows. 9
10 Only one bar had a lower low. No Bear Calls should have been taken. With a new DEW/Up we would try and initiate a Bullish Campaign as long as there is follow through. 10
11 New Down Signal. 1 st Lower Low 11
12 2nd Lower Low Confirms the signal. 12
13 DEW Up Signal Two higher bars with higher highs. Time to go long. 13

14 2 14
15 15
16 16
17 17

18 3 18

19 DEW Up has been signaled and confirmed. 19

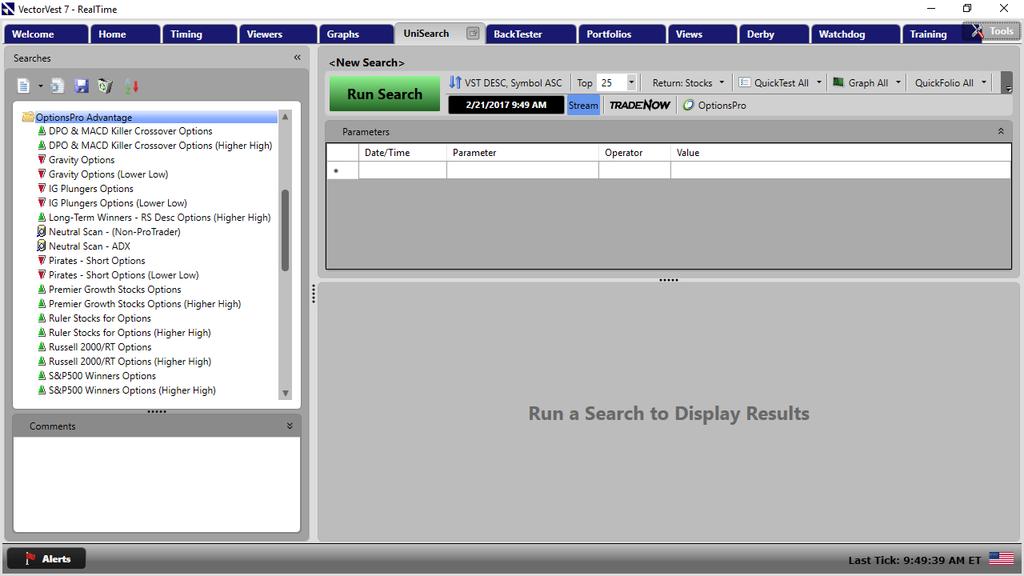
20 From the OptionsPro Advantage folder select Safe and Sound Options The most important aspect is that the stock is rising in price. 20
21 It broke the last level of resistance. Nothing holding it back. Stock is making new Daily Highs 21
22 Stock continued to rise. HSIC is also rising in price 22
23 And has broken resistance But It hasn t hit a higher high than the previous day! 23
24 Your last line of defense in trading is to make sure the stock is moving higher, day over day. HSIC stayed in a range and did not breakout for another month. This ties up your capital. 24
25 HD is moving higher and has broken the previous day s high. But it is right at resistance Better to wait 25

26 On 3/11 it is finally above resistance. Wait for follow-through the next day. Initiate the Long Trades 26

27 Smooth Sailing This was a quick test of the top 20 stocks on March 2. Let s take a closer look at the losers and see if you could have prevented a loss with your graph skills. 27

28 AYI is moving up, but is at resistance. It never got triggered, so no trade = no loss. 28
29 NKE is sideways, and at resistance. Stayed range bound. No trigger / No trade 29
30 RAI is looking good! Higher Highs and great graph. Confirmed Long on 3/3 30
31 Went up for a few days, but ultimately fell back down. This is why you sell Options. A Bull Put trade based on the and Strikes 31

32 Less than 30% Prob ITM Even though the stock went against you, you still made money. 32

33 DEW Down confirmed on 12/9. You can look to trade bearish. 33
34 Vern s Vultures Price adjusted to >100 A Quick Test of the Top 20 from the UniSearch. This is a short scan so the red results mean winning trades. Let s look at some examples of good graphs for selling. 34

35 PXD has topped and is holding the resistance. You just need to wait for the support level to be broken. It broke support with a lower low. 35

36 Off to the races VC cannot rally past resistance level. 36


37 It finally makes a lower low, breaking out of the range. Smooth Sailing as it moves lower. Just be patient and wait for the right trigger. 37

38 Let s focus on the ones that didn t work, and see if you could have prevented a loss. BXP is holding support, you have to wait. 38

39 BXP rallies and you never traded it. No Trade = No Loss AVB looks great, making lower lows and trading off previous resistance. 39

40 Find a Call to Sell with less than 30% Prob ITM. The 185/190 is better as it clears the 185 Resistance 40


")
41 The 190 / 185 Bear Call Spread Max Profit: $550 Max Risk: $4,450 If you would have exited at short strike price you lose $950 (in real-time) not $4,

42 Neutral Trades 42

43 ADX < 20 Overpriced Options Low ATR Target Options with Less than 20 Delta that exceed prior levels of support and resistance. Look for strikes up here. Look for strikes down here. 43

44 Delta of ~10 on both sides of trade. Strikes were chosen above resistance and below support. 44
 Profit Target: Conservative: $272.")
45 Iron Condor is set. Max Profit = $1,090 (10 Contracts) Profit Target: Conservative: $ (25%) Aggressive: $545 (50%) Lets test it. 45

46 Both Profit Targets hit at 5 Trading Days Takeaway s for Bullish Positions 1. DEW Up in Place 2. Graph moving up in price 3. Clear of any resistance level 4. Make sure price is higher than previous day s high. 46
47 Takeaway s for Bearish Positions 1. DEW Down in Place 2. Graph moving lower in price, or coming off major resistance. 3. Clear of any support level 4. Make sure price is lower than previous day s low. Takeaway s for Neutral Positions 1. ADX is below ATR is Low 3. Identify where prior support and resistance are on graph. 4. Target strikes with Delta s < 20 and outside of prior support and resistance levels. 47

48 4 48
49 IBM is moving up in a Bullish Market. Earnings changes the direction of the stock completely. 49

50 Add Earnings to your charts! 50
51 51


52 Nasdaq.Com has a search to find the future and previous dividend dates. Pay attention to the Ex-Dates. Make sure you are clear of short calls. 52
53 As opposed to calls, an approaching ex-dividend date can be a deterrent against early exercise for puts. By exercising the put, the owner will receive cash now. However, this will create a short sale of stock if the put owner wasn t long that stock to begin with. So exercising a put option the day before an ex-dividend date means the put owner will have to pay the dividend. So if you ve sold a put, this means you may have a lower chance of being assigned early, but only until the ex-dividend date has passed. Brian Overby (The OptionsPlaybook) 53

54 5 An ETF, or exchange traded fund, is a marketable security that tracks an index, a commodity, bonds, or a basket of assets like an index fund. Unlike mutual funds, an ETF trades like a common stock on a stock exchange. ETFs experience price changes throughout the day as they are bought and sold. - From Investopedia 54
55 On the major markets such as the S&P 500 you can trade either the ETF (SPY) or Cash Index (SPX). Index Options are based on the same markets just settled in Cash with no stock. 55
56 56

57 Market Index ETF S&P 500 SPX / ^SPX in OptionsPro SPY S&P 100 OEX / ^OEX in OptionsPro OEF Dow Jones DJX / ^DJX in OptionsPro DIA Nasdaq 100 NDX / ^NDX in OptionsPro QQQ Russell 2000 RUT / ^RUT in OptionsPro IWM Index Russell and S&P 57


58 ETF Russell and S&P SPX is 10 times the value of SPY. This is valuable if you trade large sized accounts 58

59 It s Condor Week Every week! You always have a 21 Day Window. The Pinnacle of Income Trading is Weekly Iron Condors on Index s as they provide large premiums and liquid options. If you have a larger sized account this is where you want to focus your attention. 59

60 1. Still use a day expiration 2. Exit before expiration week 3. Ideally, hold time is 7-10 days 60
61 61
Getting Paid System Part 2. Module 2 Review The Market Up, Down & Sideways 5 Key Principles Big Mistake To Avoid Action Items To Take
 Disclaimer The VectorVest Program ( the System ) which we promote is not intended to provide you with specific or personalized advice. In all circumstances where you are looking to apply the System to
Trade Management Game Plan. Module 5 Review 5 Key Principles Trade Management Techniques Big Mistake To Avoid Action Items To Take
 Disclaimer The VectorVest Program ( the System ) which we promote is not intended to provide you with specific or personalized advice. In all circumstances where you are looking to apply the System to
Trade Execution Planner. Module 6 Review 6 Key Principles Walkthroughs of Entering & Exiting Trades Big Mistake To Avoid Action Items To Take
 Disclaimer The VectorVest Program ( the System ) which we promote is not intended to provide you with specific or personalized advice. In all circumstances where you are looking to apply the System to
Trade Set-Up Maximizer. Module 4 Review 4 Key Principles Big Mistake To Avoid Action Items To Take
 Disclaimer The VectorVest Program ( the System ) which we promote is not intended to provide you with specific or personalized advice. In all circumstances where you are looking to apply the System to
How to Implement. Module 6 Importance. Review Module 5. 5 Key Principles. Action Items
 Disclaimer The VectorVest Program ( the System ) which we promote is not intended to provide you with specific or personalized advice. In all circumstances where you are looking to apply the System to
How to Implement. Module 5 Importance. Review Module 4. 5 Key Principles. Action Items
 Disclaimer The VectorVest Program ( the System ) which we promote is not intended to provide you with specific or personalized advice. In all circumstances where you are looking to apply the System to
3-Phase Portfolio Proft System
 Disclaimer The VectorVest Program ( the System ) which we promote is not intended to provide you with specific or personalized advice. In all circumstances where you are looking to apply the System to
Winged and Ratio Spreads
 This class is a production of Safe Option Strategies and the content is protected by copyright. Any reproduction or redistribution of this or any Safe Option Strategies presentation is strictly prohibited
SIMPLE SCAN FOR STOCKS: FINDING BUY AND SELL SIGNALS
 : The Simple Scan is The Wizard s easiest tool for investing in stocks. If you re new to investing or only have a little experience, the Simple Scan is ideal for you. This tutorial will cover how to find
Notes from 2/2/07, San Diego - Doubletree Hotel, South Hotel Circle. Don Kaufman Instructor
 ThinkorSwim Options Training Notes from 2/2/07, San Diego - Doubletree Hotel, South Hotel Circle. Don Kaufman Instructor dkaufman@redoption.com, support@redoption.com Think Or Swim Support 866 839-1100
The Synthetic Futures Position. Goal
 The Synthetic Futures Position Goal To try to profit from a trending market using an option strategy that allows entry at a reduced cost while offering the same potential for unlimited profit (and loss)
No duplication of transmission of the material included within except with express written permission from the author.
 Copyright Option Genius LLC. All Rights Reserved No duplication of transmission of the material included within except with express written permission from the author. Be advised that all information is
Options Mastery Day 2 - Strategies
 Options Mastery Day 2 - Strategies Day 2 Agenda 10:00-10:10 - Overview and Q&A from Day 1 10:10-11:00 - Morning Trade Walk Thru & Trade Plans 11:00 12:00 - Options 101 Review & Long Call/Put Criteria 12:00-12:15
Candlestick Secrets for Profiting in Options Seminar Nison Candlesticks to Guide Your Option Trades. Nison Chart Challenge 7 - Read Steve s Mind
 Nison Chart Challenge 7 - Read Steve s Mind 1) How could we have used NCS after the first hammer to find a good trade set up and decrease time decay? 2) What outright or spread could we have done? 3) When
Trade Setups, Rules & Trading Strategies
 Trade Setups, Rules & Trading Strategies dba of FreeTradingVideos.com, Inc. v.1411 Using Technical Analysis to Enter, Manage and Exit Trades Quote of the Day At Grok Trade, we do not trade Trading Patterns.
Planning for Trading Stocks and Stock Indexes: Considerations for Serious Traders
 Planning for Trading Stocks and Stock Indexes: Considerations for Serious Traders David B. Center, PhD Copyright 2009 (Contact through: www.davidcenter.com) 1 Planning for Trading Stocks and Stock Indexes
Learn To Trade Stock Options
 Learn To Trade Stock Options Written by: Jason Ramus www.daytradingfearless.com Copyright: 2017 Table of contents: WHAT TO EXPECT FROM THIS MANUAL WHAT IS AN OPTION BASICS OF HOW AN OPTION WORKS RECOMMENDED
ebook To Sizzling Weekly Option Trades
 Fearless Investing With Options Copyright 2015 by Joshua Belanger. All rights reserved. Printed in the United States of America. No part of this book may be used or reproduced in any manner whatsoever
11-Hour Options 2.0 The Next Evolution of Success
 presented by Thomas Wood MicroQuant SM Identifying Key Support and Resistance Levels 11-Hour Options 2.0 The Next Evolution of Success Risk Disclaimer Trading or investing carries a high level of risk,
Income Opportunities for Summer with SPY ETF
 Income Opportunities for Summer with SPY ETF June 2016 Gareth Ryan Founder & Managing Director Risk Disclaimer Options are leveraged products that involve risk and are not suitable for all investors. Before
Figure 1. SPX 60 min & NAS 1-min chart.
 BINGO!? Today we reached the ideal SPX2625 target to the T (SPX2625.76) for wave-a. There s now negative divergence again on the hourly RSI5 and the hourly MACD (see Fig 1), while the daily indicators
Investors Observer Workshop. Wednesday, October 18, 4 pm ET
 Investors Observer Workshop Wednesday, October 18, 4 pm ET Debby Clowney MBA, Chicago Booth BA, U. of Pennsylvania 20+ years options experience Worked on Wall Street Consultant for KPMG Workshop Coach:
 We have seen extreme volatility for commodity futures recently. In fact, we could make a case that volatility has been increasing steadily since the original significant moves which began in 2005-06 for
The four year cycle revisited For members and families only, please do not forward as this tutorial will not be posted to the public.
 The four year cycle revisited 07-0421 For members and families only, please do not forward as this tutorial will not be posted to the public. A lot of my energy has been devoted to the gold sector these
Buy Now, Paid Later. Learning LEAP Leverage Strategies. By Markay Latimer
 Buy Now, Paid Later Learning LEAP Leverage Strategies By Markay Latimer Neither Better Trades or any of its personnel are registered broker-dealers or investment advisers. I will mention that I consider
Trading Lessons from the Intraday Frame (study)
") 1 Daily "Idealized Trades" Report Trading Lessons from the Intraday Frame (study) 1 2018 TheoTrade LLC. All rights reserved. 2 Trading Lessons from the Intraday Frame (1-mi) 2 2018 TheoTrade LLC. All rights
1 Daily "Idealized Trades" Report Trading Lessons from the Intraday Frame (study) 1 2018 TheoTrade LLC. All rights reserved. 2 Trading Lessons from the Intraday Frame (1-mi) 2 2018 TheoTrade LLC. All rights
Long-Term trends for each index remains up and nothing of late has changed that!!!
 Long-Term trends for each index remains up and nothing of late has changed that!!! Each index is testing some form of overhead resistance. These are price points where bulls will say No Thank You to selling
Market Line Weekly Newsletter
 Market Line Weekly Newsletter December 17, 2017 Stock Watch: The trend is up and the bulls have the momentum. A close below the 12/1 low in any of the major indices (the Dow, the S&P, the QQQ, IWM, and
c=a Figure 1. SPX 60 min & NAS 1-min chart.
 Today s drop came as expected and the S&P moved as low as SPX2562, but as said yesterday A move below today s low SPX2569 will be a first sign intermediate-b is underway, with confirmation below SPX2545.
Sycamore Market Analysis
 Sycamore Market Analysis September 30, 2015 The third quarter came to an end with big gains for stocks. The rally did not quite reverse the effect of selling on Monday though with the S&P 500 still down
Weekly outlook for April 30 May
 Weekly outlook for April 30 May 4 2018 Summary The S&P500 index is having trouble deciding if it will rally or decline. This indecision makes trading less profitable. Wait for a break-out direction to
Trading Lessons from the Intraday Frame (study)
") 1 Daily "Idealized Trades" Report Trading Lessons from the Intraday Frame (study) 1 2018 TheoTrade LLC. All rights reserved. 2 Trading Lessons from the Intraday Frame (1-mi) Major Companies Reporting Earnings
1 Daily "Idealized Trades" Report Trading Lessons from the Intraday Frame (study) 1 2018 TheoTrade LLC. All rights reserved. 2 Trading Lessons from the Intraday Frame (1-mi) Major Companies Reporting Earnings
Indiana University South Bend. Presenter: Roma Colwell-Steinke
 Indiana University South Bend Presenter: Roma Colwell-Steinke Option Strategies Outline Covered Call Protective Put The Collar Cash Secured Put Vertical Spreads Iron Butterfly Iron Condor ITM, ATM, OTM
Top Down Analysis Success Demands Singleness of Purpose
 Chapter 9 Top Down Analysis Success Demands Singleness of Purpose Armed with a little knowledge about the stock and options market as well as a desire to trade, many new traders are faced with the daunting
Candlestick Signals and Option Trades (Part 3, advanced) Hour One
 Hour One") Candlestick Signals and Option Trades (Part 3, advanced) Hour One 1. Hedges, long and short A hedge is any strategy designed to reduce or eliminate market risk. This applies to equity positions and the
Candlestick Signals and Option Trades (Part 3, advanced) Hour One 1. Hedges, long and short A hedge is any strategy designed to reduce or eliminate market risk. This applies to equity positions and the
Index Options and Credit Spreads
 Interactive Brokers Webcast Index Options and Credit Spreads December 14, 2016 Disclosure Options involve risks and are not suitable for all investors. Prior to buying or selling an option, an investor
Strategic Trade Management. A Comprehensive Trading Plan for Managing Risk in Option Trading
 Strategic Trade Management A Comprehensive Trading Plan for Managing Risk in Option Trading 1 Neither Better Trades or any of its personnel are registered broker-dealers or investment advisers. I will
Weekly outlook for May 7 May 11, 2018
 Weekly outlook for May 7 May 11, 2018 Summary The S&P500 index is expected to declare its breakout direction soon. The triangle pattern is defined by 2725 on the upside and 2575 on the down side. A weekly
Lecture 11. Introduction of Options
 Lecture 11 Introduction of Options Agenda: I. Basics about options ~ Options underlying assets: ~ Expiration dates: ~ Strike prices: ~ Terminology: ~ Dividends: ~ Trading: ~ Taxation: ~ Warrants, Employee
Inter-market Technical Analysis for April 29, Summary Chart TheoTrade LLC. All rights reserved.
 1 Weekly Inter-market Technical Report Summary Chart 1 2018 TheoTrade LLC. All rights reserved. 2 Intraday Intermarket Volatility and even trend is back in our markets! The main movement recently came
Micro-4 SPX2544. Minute-iv SPX2557. You are here. Major-4 SPX P a g e. Executive Summary
 Executive Summary Although 5 waves up off the SPX2557 low can be counted, because of the -what in my book counts best as- 3 wave structures both up and down since that mid-november low, the ending diagonal
1 P a g e. Executive Summary
 Executive Summary Price finally reached our expect SPX2112-2120 and the negative divergences that started to creep in on the daily TIs finally also took their toll over the past 2 days. The weekly charts
Weeklys Options and Short Term Strategies. Russell A. Rhoads, CFA
 SM Weeklys Options and Short Term Strategies Russell A. Rhoads, CFA CBOE Disclaimer Options involve risks and are not suitable for all investors. Prior to buying or selling options, an investor must receive
Strong 1 Strategy. Remember - for examples of current trades using this strategy see Jim s Chart Book as well as our Premium Alert Service Videos.
 Strong 1 Strategy GOAL To find the closest-to-the-money option we can afford on the first day that a particular market s Trend Seeker Trend on US Charts Online s Trend Seeker feature changes to either
Trading Essentials Framework Money Management & Trade Sizing
 Trading Essentials Framework Money Management & Trade Sizing Module 9 Money Management & Trade Sizing By Todd Mitchell Copyright 2014 by Todd Mitchell All Rights Reserved This training program, or parts
Cash Cow Newsletter April
 Cash Cow Newsletter April 16 2014 In this week s Cash Cow newsletter I would like to analyze the current state of the market and review strategies that can help protect us in high volatility environments.
Weekly outlook for April 23, 2018
 Weekly outlook for April 23, 2018 Summary The S&P 500 index is expected to go down further if price stays below the 2700 level. A weekly doji candle formed on the intermediate-term chart, and the short-term
The Neutral Market Strategy
 The Neutral Market Strategy GOAL To make a profit selling options in a sideways-moving market. SUMMARY Experts estimate that markets typically trend roughly 30% of the time. The remaining 70% of the time
Investors Observer Workshop. Wednesday, October 4, noon ET
 Investors Observer Workshop Wednesday, October 4, noon ET Debby Clowney MBA, Chicago Booth BA, U. of Pennsylvania 20+ years options experience Worked on Wall Street Consultant for KPMG Workshop Coach:
27PercentWeekly. By Ryan Jones. Part II in the Series Start Small and Retire Early Trading Weekly Options
 By Ryan Jones Part II in the Series Start Small and Retire Early Trading Weekly Options Important My 27% Option Strategy is one of the best option trading opportunities you will come across. When you see
Leadership Continues To Test Support
 Leadership Continues To Test Support I am going to continue to highlight the pattern of the leader off the 2009 low (Semiconductors) until a breakout of 2000 highs or a breakdown of 2-year rising support
Our primary focus is on the market trend.
 Our primary focus is on the market trend. Through two decades of experience, we ve found this to be the most powerful influence on traders success. We begin by identifying the short-term trend of the market
Market Slipping Right On Schedule?
 Market Slipping Right On Schedule? Reminder- Broad markets typically a little soft in August and September. Good friend @RyanDetrick shared the chart below, which looks at the average monthly perfomance
Real-time Analytics Methodology
 New High/Low New High/Low alerts are generated once daily when a stock hits a new 13 Week, 26 Week or 52 Week High/Low. Each second of the trading day, the stock price is compared to its previous 13 Week,
Introduction to the Gann Analysis Techniques
 Introduction to the Gann Analysis Techniques A Member of the Investment Data Services group of companies Bank House Chambers 44 Stockport Road Romiley Stockport SK6 3AG Telephone: 0161 285 4488 Fax: 0161
1 P a g e. Executive Summary
 Executive Summary In last week s update I set a first target of SPX2428 for the S&P500, which was reached on Thursday. I expected from there a 10-15p correction, but instead the market decided to target
S&P 500 Update: Week ending May 11th 2018
 S&P 500 Update: Week ending May 11th 2018 1. Market Recap: The S&P 500 closed higher by 2.2% for week and broke out of some key resistance areas and a short term downtrend. There are 4 topics now setting
OPTIONS STRATEGY QUICK GUIDE
 OPTIONS STRATEGY QUICK GUIDE OPTIONS STRATEGY QUICK GUIDE Trading options is a way for investors to take advantage of nearly any market condition. The strategies in this guide will let you trade, generate
Copyright by Profits Run, Inc. Published by: Profits Run, Inc Beck Rd Unit F1. Wixom, MI
 DISCLAIMER: Stock, forex, futures, and options trading is not appropriate for everyone. There is a substantial risk of loss associated with trading these markets. Losses can and will occur. No system or
- My 4 Favorite Trades - Essential Trades of a Professional Trader
 presented by Thomas Wood MicroQuant SM Divergence Trading Workshop Day One - My 4 Favorite Trades - Essential Trades of a Professional Trader Risk Disclaimer Trading or investing carries a high level of
Using Acceleration Bands, CCI & Williams %R
 Price Headley s Simple Trading System for Stock, ETF & Option Traders Using Acceleration Bands, CCI & Williams %R How Technical Indicators Can Help You Find the Big Trends For any type of trader, correctly
Figure 1. NAS 1-min and SPX 60 min charts.
 Today s update will be brief as price on most indices has now reached their upside targets for the anticipated intermediate wave-a. The NASDAQ has reached the upper end of its first resistance zone. If
Learn N Trade WORKSHOP STUDY GUIDE
 Learn N Trade WORKSHOP STUDY GUIDE Copyright 2004 thinkorswim Advisors, Inc. All rights reserved. Unauthorized duplication of this book is strictly prohibited. No part of this publication may be reproduced,
Weekly Options Secrets Revealed: A Proven Options Trading Plan
 Weekly Options Secrets Revealed: A Proven Options Trading Plan When talking about stock options there are many common questions that come up. Which strike price should I trade? Should I buy or sell the
TOP 3 INDICATOR BOOT CAMP: PERCENT R
 BIGTRENDS.COM TOP 3 INDICATOR BOOT CAMP: PERCENT R PRICE HEADLEY, CFA, CMT Let s Get Started! Educate Understand the tools you have for trading. Learn what this indicator is and how you can profit from
This would lower the year-end S&P 500 target price from 2,140 to 2,040. The technical picture of the market is also deteriorating.
 January 13, 2016 SPECIAL BULLETIN We are now in the 82 nd month of a Bull Market and U.S. Markets are now getting very close to giving a SELL SIGNAL. As you know, I have been bullish on the market since
Tommy s Revenge 2.0 Module 2 Part 2
 1 Mark Deaton here with your follow-up to Module 2. Going to cover a few things in this video and try to keep it short and sweet. We re going to look at Stock Fetcher and how we can use Stock Fetcher to
HOW TO MAKE YOUR FIRST FUTURES TRADE
 HOW TO MAKE YOUR FIRST FUTURES TRADE By Craig 1.800.800.3840 2 How to Make Your First Futures Trade You have an opinion on the futures market, you want to get involved, but you don t know how or where
In the weekend update I presented 3 different counts for the S&P in order of probability
 In the weekend update I presented 3 different counts for the S&P in order of probability 1) micro-1 ongoing with nano-iv at SPX2578 and nano-v to SPX2595 underway (60%). 2) Micro-2 topped at SPX2590, micro-c
Stan Heller Host - VectorVest Canada. Jamin Heller Moderator
 Stan Heller Host - VectorVest Canada Jamin Heller Moderator Purpose for these monthly Forums: Further your knowledge of the VectorVest System. To share current ideas and strategies for making money and
1 P a g e. Executive Summary
 Executive Summary Last week I was looking for SPX2455-2475 and the S&P500 gave us SPX2454 on Monday and then started to pullback and consolidate causing for many pundits to already start top calling. Close
The sideways churn in the major U.S. Stock indexes since late March continues. We have a lot of new members that have
 May 17, 2016 Dear Members, The sideways churn in the major U.S. Stock indexes since late March continues. We have a lot of new members that have recently joined us in the past couple of months. For you
Divergence and Momentum Trading
 presented by Thomas Wood MicroQuant SM Divergence Trading Workshop Day One Divergence and Momentum Trading Risk Disclaimer Trading or investing carries a high level of risk, and is not suitable for all
Market Observations as of Nov 17, 2017
 Market Observations as of Nov 17, 2017 By Carl Jorgensen - For Objective Traders - For educational purposes only. Not Financial Advice. This week we saw a variety of market moves. The daily charts for
US Dow Jones Index / US30Cash (DAILY CHART) System price target 15,660.00
 System price target 15,660.00") DAILY TECHNICAL US Dow Jones Index / US30Cash (DAILY CHART) System price target 15,660.00 Thursday, January 30, 2014 S1=15,660.00 Support R1=16,564.00 R2=16,048.00 ADX Signal Comment: Short positions for
DAILY TECHNICAL US Dow Jones Index / US30Cash (DAILY CHART) System price target 15,660.00 Thursday, January 30, 2014 S1=15,660.00 Support R1=16,564.00 R2=16,048.00 ADX Signal Comment: Short positions for
b/ii c/iii b/ii b/ii Figure 1. SPX 60-min chart. NAS 1-min chart.
 On Monday I concluded Above SPX2690 opens the door for major-a having completed and major-b to SPX2800s is underway. Yesterday I then found that the recent SPX2631 low is an unusual point for a bottom
Trading Essentials Framework Money Management & Trade Sizing 2.0
 2.0 Money Management: The most critical aspect of your trading plan Money management represents the administrative side of your trading plan. It addresses the question of how best to use the capital available
Intelligent Investing, LLC Major Indices Daily Update 03/06/ 19
 Elliot Wave Updates It is still technically possible for the S&P500 to be in minor-4, as it is becoming possible more complex, but since the RUT is IMHO already in a confirmed major-2/b down wave, see
Adjusting The Bull Call Spread
 Module 6.1 This class is a production of Safe Option Strategies and the content is protected by copyright. Any reproduction or redistribution of this or any Safe Option Strategies presentation is strictly
Market Observations as of Aug 4, 2017
 Market Observations as of Aug 4, 2017 By Carl Jorgensen - For Objective Traders - For educational purposes only. Not Financial Advice. This week The mixed responses to earnings this week has resulted in
Weekly outlook for Nov. 27 Dec
 Weekly outlook for Nov. 27 Dec. 1 2017 Summary For the ES we expect a minor pullback in the early part of the week, followed by a rally into the weekly close. There are four option expirations this week
Presents Mastering the Markets Trading Earnings
 www.mastermindtraders.com Presents Mastering the Markets Trading Earnings 1 DISCLAIMER Neither MasterMind Traders or any of its personnel are registered broker-dealers or investment advisors. We may mention
Option Trading The Option Butterfly Spread
 Option Trading The Option Butterfly Spread By Larry Gaines Butterflies provide a low risk high reward trading opportunity. Markets direction can go through months, and even years of higher than usual uncertainty.
Short Term Trading With Weeklys SM Options
 Interactive Brokers Webcast Short Term Trading With Weeklys SM Options April 16, 2014 Presented by Russell Rhoads, CFA Disclosure Options involve risks and are not suitable for all investors. Prior to
5 Pillars of Active Trend Trading Timing is More Important than Price. ~~ W.D. Gann
 5 Pillars of Active Trend Trading Timing is More Important than Price. ~~ W.D. Gann Dennis W. Wilborn Disclaimer U.S. Government Required Disclaimer Commodity Futures Trading Commission Futures and Options
Trading Lessons from the Intraday Frame (study)
") 1 Daily "Idealized Trades" Report Trading Lessons from the Intraday Frame (study) 1 2018 TheoTrade LLC. All rights reserved. 2 Trading Lessons from the Intraday Frame (1-mi) 2 2018 TheoTrade LLC. All rights
1 Daily "Idealized Trades" Report Trading Lessons from the Intraday Frame (study) 1 2018 TheoTrade LLC. All rights reserved. 2 Trading Lessons from the Intraday Frame (1-mi) 2 2018 TheoTrade LLC. All rights
Market Observations - as of Jul 27, 2018
 Market Observations - as of Jul 27, 2018 By Carl Jorgensen - For Objective Traders - For educational purposes only. Not Financial Advice. This week began with most markets continuing their bullish trends
How to Trade Options Using VantagePoint and Trade Management
 How to Trade Options Using VantagePoint and Trade Management Course 3.2 + 3.3 Copyright 2016 Market Technologies, LLC. 1 Option Basics Part I Agenda Option Basics and Lingo Call and Put Attributes Profit
Finance 527: Lecture 30, Options V2
 Finance 527: Lecture 30, Options V2 [John Nofsinger]: This is the second video for options and so remember from last time a long position is-in the case of the call option-is the right to buy the underlying
Your Action Items. Add ADX & ATR to Graph Model your 1 st Delta Neutral Iron Condor Save trade in OptionsPro Put Condor Week on your calendar
 Your Action Items Add ADX & ATR to Graph Model your st Delta Neutral Iron Condor Save trade in OptionsPro Put Condor Week on your calendar Add ADX & ATR to Graph. Right click on graph. Move mouse over
1 P a g e. Executive Summary
 Executive Summary For three weeks we provided a primary (major b) and alternative count (primary V) up and we keep tracking both until one or the other is disproven. Two weeks ago we projected a major
In addition, a word of advice: when in a Bear market and my Elliot Wave Count suggests either down or a few more subdivisions marginally higher
 WOW, who would have known?! Price went from my upper target zone to my lower (see page 2) in just 11 trading hours: The S&P500 lost ~10p/hour Crazy. Big gap ups one day, followed by a 100p drop the next
Weekly outlook for June 5 June
 Weekly outlook for June 5 June 9 2017 TREND DIRECTION S&P 500 Oil Gold Short Term Intermediate-Term Long Term Weak buy buy neutral neutral sell buy buy buy Summary The S&P500 index is expected to hold
Risk and reward 12/28/2008
 Risk and reward 12/28/2008 Since our major sell signal was confirmed on 1/31 this year, we adopted a cautious stance and that has helped us sidestepping a devastating global equity collapse which likely
Mastering the Markets
 www.mastermindtraders.com Presents Mastering the Markets Your Path to Financial Freedom DISCLAIMER Neither or any of its personnel are registered broker-dealers or investment advisors. We may mention that
Access to this webinar is for educational and informational purposes only. Consult a licensed broker or registered investment advisor before placing
 Access to this webinar is for educational and informational purposes only. Consult a licensed broker or registered investment advisor before placing any trade. All securities and orders discussed are tracked
4.25 ¾ 4.19 FG March 2018 Wheat ¾ Pivotal new Contract Low 4.02 ½ 5 day chart. Down from last week same day Daily chart... Down Weekly
 s 9:50 pm Chicago time 12/11/17 December 12, 2017 March 2018 Corn 3.56 3.52 ¾ FG --------------3.48 ¼ Pivotal new Contract Low 3.43 ¾ 5 day chart. Down from last week same day Daily chart. Down Weekly
Presents. SPY the MARKET. With. Bill Corcoran
 Presents SPY the MARKET With Bill Corcoran I am not a registered broker-dealer or investment adviser. I will mention that I consider certain securities or positions to be good candidates for the types
Strategies for Growing an Account DENNIS W. WILBORN, SR.
 Strategies for Growing an Account WWW.ACTIVETRENDTRADING.COM DENNIS W. WILBORN, SR. DWW@ACTIVETRENDTRADING.COM Clarify, Simplify & Multiply This has been the Motto of Active Trend Trading from the beginning!
Swing TradING CHAPTER 2. OPTIONS TR ADING STR ATEGIES
 Swing TradING CHAPTER 2. OPTIONS TR ADING STR ATEGIES When do we want to use options? There are MANY reasons to learn options trading and MANY scenarios in which you might trade them When we want leverage