Engineering Statistics ECIV 2305
|
|
|
- Damian Dennis
- 5 years ago
- Views:
Transcription
1 Engineering Statistics ECIV 2305 Section 5.3 Approximating Distributions with the Normal Distribution
2 Introduction A very useful property of the normal distribution is that it provides good approximations to the probability values of certain other distributions In these special cases the cdf of a rather complicated distribution can be related to the cdf of a normal distribution that can be easily evaluated. ۲
3 The Normal Approximation to the Binomial Distribution The normal distribution can be used to approximate the binomial distribution (under certain conditions) Why do we need such approximation? It is much easier to use the normal distribution Let s start with X~B(n, p) We know that E(X) = np, and Var(X) = np(1-p) The distribution of X can be approximated by a normal distribution with the same mean and variance. i.e. X~B(n, p) Y~N(np, np(1-p)) ۳
4 Accuracy of this approximation The accuracy of this approximation improves as the parameter n of the binomial distribution increases. For a given n, the accuracy decreases as the success probability p becomes close to zero or one. A general rule: The approximation is reasonable as long as both: np 5 and n(1 p) 5 ٤
5 Illustrative Example: (page 240) Suppose that X ~ B(16, 0.5). a) Draw the pmf of X b) Check whether the distribution of X can be approximated by a normal distribution. c) If the answer to part b is yes, find the mean and variance of the normal distribution. d) Compute P(X 5) using the B(16, 0.5) distribution e) Compute P(X 5) using the normal approximation f) Compute the probability that the binomial distribution takes a value between 8 and 11. ٥
6 illustrative example: (page 240) Comparison of the pmf of a B(16, 0.5) and the pdf of N(8, 4) ٦
7 illustrative example: (page 240) It is interesting to compute some probability values of the B(16, 0.5) and N(8, 4) distributions to see how well they compare. The probability that the binomial distribution takes a value no larger than 5 is ۷
8 ۸
9 illustrative example: (page 240) ۹
10 ۱۰
11 ۱۱
12 In Conclusion: The probability values of a B(n, p) distribution can be approximated by those of a N(np, np(1 p )) distribution using the following: ( ) x np P X x Φ ( ) np 1 p and P ( X x) x 1 Φ 0.5 np np ( 1 p) Again, these approximations work well as long as both np 5 and n(1 p) 5 ۱۲
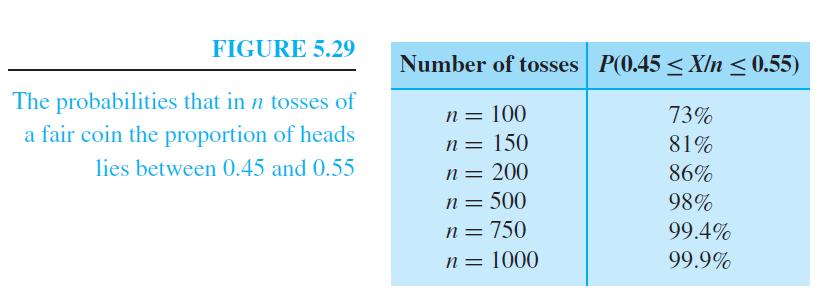
13 Example: (page 242) A fair coin is tossed 100 times. What is the probability of obtaining between 45 and 55 heads? It is obvious that the number of heads obtained is a binomial random variable; X ~ B(100, 0.5). P(45 X 55) = P(X=45) + P(X=46) P(X=55) which is tedious to calculate. A more convenient approach is to use the normal approximation. First we need to check if the normal approximation works well ۱۳
14 example: (page 242) Consequently, in 100 coin tosses there is a probability of about 0.73 that the proportion of heads is between 0.45 and ۱٤
15 ۱٥
16 ۱٦
17 Example: Milk Container Contents (page 247) Recall that there is a probability of that a milk container is underweight. The number of underweight containers X in a box of 20 containers has a B(20, 0.261) a) Can we use the normal approximation? b) Find the probability that a box contains no more than three underweight containers using both the binomial distribution and the normal approximation. c) Suppose that 25 boxes of milk are delivered to a supermarket. What is the probability that at least 150 containers are underweight? ۱۷
18 example: Milk Container Contents (page 247) ۱۸
19 The probability that at least 150 out of the 500 milk containers are underweight can then be calculated to be ۱۹
20 example: Milk Container Contents (page 247) ۲۰
21 Example: Cattle Inoculations (page 248) A particular animal vaccine has a probability of of provoking a serious adverse reaction when given to an animal. Suppose that this vaccine will be administered to 500,000 head of cattle. Assuming that X is a random variable representing the number of animals that will suffer an adverse reaction. a) What is the expectation and variance of X? b) Use the normal approximation to compute an interval of three standard deviations about the mean value? c) Comment on the result obtained in part a. ۲۱
22 example: Cattle Inoculations (page 248) ۲۲
23 The Central Limit Theorem Recall from Section 2.6 that if X 1, X 2,, X n is a sequence of independent random variables each with an expectation μ and a variance of σ 2, then the average X = then X 1 + X 2 E( X ) X n n = µ and Var( X ) = And recall from section 5.2 that if X i ~ N (μ, σ 2 ), then 2 σ X ~ N µ, n The central limit theorem provides an important extension to these results by stating that: σ n 2 ۲۳ X
24 The Central Limit Theorem Regardless of the actual distribution of the individual random variables X i, the distribution of their average X is closely approximated by a N (μ, σ 2 /n) distribution. The accuracy of this approximation improves as n increases and the average is taken over more random variables. A general rule is that the approximation is adequate as long as n σ Also, from section 5.2 notice that if X ~ N µ, 2 n then X + X + + X ~ N nµ nσ 1 2 n, ( ) ۲٤

25 The central limit theorem is a very important theorem since it explains why many naturally occurring phenomena are observed to have distributions similar to the normal distribution, since they may be composed of many smaller random events. ۲٥
26 Example: Glass Sheet Flaws (page 248) Recall that the number of flaws in a glass sheet has a Poisson distribution with a parameter value λ = 0.5. a) What is the distribution of the total number of flaws X in a 100 sheets of glass? b) What is the probability that there are fewer than 40 flaws in a 100 sheets of glass? c) Calculate the probability that the average number of flaws is between 0.45 and ۲٦
27 example: Glass Sheet Flaws (page 248) ۲۷
28 example: Glass Sheet Flaws (page 248) The central limit theorem indicates that the average number of flaws per sheet in 100 sheets of glass, X, has a distribution that can be approximated by a ۲۸
29 Notes on the Glass Sheet Flaws Problem The key point in these probability calculations is that even though the number of flaws in an individual sheet of glass follows a Poisson distribution, the central limit theorem indicates that the probability calculations concerning the total number or average number of flaws in 100 sheets of glass can be found using the normal distribution. ۲۹
30 Example: Pearl Oyster Farming (page 249) Recall that there is a probability of 0.6 that an oyster produces a pearl with a diameter of at least 4mm, which is consequently of a commercial size. a) How many oysters does an oyster farmer need to farm in order to be 99% confident of having at least 1000 pearls of commercial value? b) Assume that pearl has an expected diameter of 5mm and variance of If a farmer collected 1050 pearls, compute the interval over which a farmer can be 99.7% confident of having an average pearl diameter lying within this interval. ۳۰
31 example: Pearl Oyster Farming (page 249) ۳۱
32 example: Pearl Oyster Farming (page 249) ۳۲
Lecture 23. STAT 225 Introduction to Probability Models April 4, Whitney Huang Purdue University. Normal approximation to Binomial
 Lecture 23 STAT 225 Introduction to Probability Models April 4, 2014 approximation Whitney Huang Purdue University 23.1 Agenda 1 approximation 2 approximation 23.2 Characteristics of the random variable:
Version A. Problem 1. Let X be the continuous random variable defined by the following pdf: 1 x/2 when 0 x 2, f(x) = 0 otherwise.
 = 0 otherwise.") Math 224 Q Exam 3A Fall 217 Tues Dec 12 Version A Problem 1. Let X be the continuous random variable defined by the following pdf: { 1 x/2 when x 2, f(x) otherwise. (a) Compute the mean µ E[X]. E[X] x
Math 224 Q Exam 3A Fall 217 Tues Dec 12 Version A Problem 1. Let X be the continuous random variable defined by the following pdf: { 1 x/2 when x 2, f(x) otherwise. (a) Compute the mean µ E[X]. E[X] x
Chapter 3 - Lecture 5 The Binomial Probability Distribution
 Chapter 3 - Lecture 5 The Binomial Probability October 12th, 2009 Experiment Examples Moments and moment generating function of a Binomial Random Variable Outline Experiment Examples A binomial experiment
Elementary Statistics Lecture 5
 Elementary Statistics Lecture 5 Sampling Distributions Chong Ma Department of Statistics University of South Carolina Chong Ma (Statistics, USC) STAT 201 Elementary Statistics 1 / 24 Outline 1 Introduction
Tutorial 11: Limit Theorems. Baoxiang Wang & Yihan Zhang bxwang, April 10, 2017
 Tutorial 11: Limit Theorems Baoxiang Wang & Yihan Zhang bxwang, yhzhang@cse.cuhk.edu.hk April 10, 2017 1 Outline The Central Limit Theorem (CLT) Normal Approximation Based on CLT De Moivre-Laplace Approximation
STA258H5. Al Nosedal and Alison Weir. Winter Al Nosedal and Alison Weir STA258H5 Winter / 41
 STA258H5 Al Nosedal and Alison Weir Winter 2017 Al Nosedal and Alison Weir STA258H5 Winter 2017 1 / 41 NORMAL APPROXIMATION TO THE BINOMIAL DISTRIBUTION. Al Nosedal and Alison Weir STA258H5 Winter 2017
STAT Chapter 7: Central Limit Theorem
 STAT 251 - Chapter 7: Central Limit Theorem In this chapter we will introduce the most important theorem in statistics; the central limit theorem. What have we seen so far? First, we saw that for an i.i.d
Statistics 6 th Edition
 Statistics 6 th Edition Chapter 5 Discrete Probability Distributions Chap 5-1 Definitions Random Variables Random Variables Discrete Random Variable Continuous Random Variable Ch. 5 Ch. 6 Chap 5-2 Discrete
Probability Theory and Simulation Methods. April 9th, Lecture 20: Special distributions
 April 9th, 2018 Lecture 20: Special distributions Week 1 Chapter 1: Axioms of probability Week 2 Chapter 3: Conditional probability and independence Week 4 Chapters 4, 6: Random variables Week 9 Chapter
Normal Distribution. Notes. Normal Distribution. Standard Normal. Sums of Normal Random Variables. Normal. approximation of Binomial.
 Lecture 21,22, 23 Text: A Course in Probability by Weiss 8.5 STAT 225 Introduction to Probability Models March 31, 2014 Standard Sums of Whitney Huang Purdue University 21,22, 23.1 Agenda 1 2 Standard
Binomial Random Variables. Binomial Random Variables
 Bernoulli Trials Definition A Bernoulli trial is a random experiment in which there are only two possible outcomes - success and failure. 1 Tossing a coin and considering heads as success and tails as
Central Limit Theorem (cont d) 7/28/2006
 7/28/2006") Central Limit Theorem (cont d) 7/28/2006 Central Limit Theorem for Binomial Distributions Theorem. For the binomial distribution b(n, p, j) we have lim npq b(n, p, np + x npq ) = φ(x), n where φ(x) is
Central Limit Theorem (cont d) 7/28/2006 Central Limit Theorem for Binomial Distributions Theorem. For the binomial distribution b(n, p, j) we have lim npq b(n, p, np + x npq ) = φ(x), n where φ(x) is
Probability Theory. Mohamed I. Riffi. Islamic University of Gaza
 Probability Theory Mohamed I. Riffi Islamic University of Gaza Table of contents 1. Chapter 2 Discrete Distributions The binomial distribution 1 Chapter 2 Discrete Distributions Bernoulli trials and the
STAT 241/251 - Chapter 7: Central Limit Theorem
 STAT 241/251 - Chapter 7: Central Limit Theorem In this chapter we will introduce the most important theorem in statistics; the central limit theorem. What have we seen so far? First, we saw that for an
Chapter 5. Sampling Distributions
 Lecture notes, Lang Wu, UBC 1 Chapter 5. Sampling Distributions 5.1. Introduction In statistical inference, we attempt to estimate an unknown population characteristic, such as the population mean, µ,
4-2 Probability Distributions and Probability Density Functions. Figure 4-2 Probability determined from the area under f(x).
.") 4-2 Probability Distributions and Probability Density Functions Figure 4-2 Probability determined from the area under f(x). 4-2 Probability Distributions and Probability Density Functions Definition 4-2
4-2 Probability Distributions and Probability Density Functions Figure 4-2 Probability determined from the area under f(x). 4-2 Probability Distributions and Probability Density Functions Definition 4-2
PROBABILITY DISTRIBUTIONS
 CHAPTER 3 PROBABILITY DISTRIBUTIONS Page Contents 3.1 Introduction to Probability Distributions 51 3.2 The Normal Distribution 56 3.3 The Binomial Distribution 60 3.4 The Poisson Distribution 64 Exercise
Statistical Tables Compiled by Alan J. Terry
 Statistical Tables Compiled by Alan J. Terry School of Science and Sport University of the West of Scotland Paisley, Scotland Contents Table 1: Cumulative binomial probabilities Page 1 Table 2: Cumulative
MA : Introductory Probability
 MA 320-001: Introductory Probability David Murrugarra Department of Mathematics, University of Kentucky http://www.math.uky.edu/~dmu228/ma320/ Spring 2017 David Murrugarra (University of Kentucky) MA 320:
4.3 Normal distribution
 43 Normal distribution Prof Tesler Math 186 Winter 216 Prof Tesler 43 Normal distribution Math 186 / Winter 216 1 / 4 Normal distribution aka Bell curve and Gaussian distribution The normal distribution
STAT/MATH 395 PROBABILITY II
 STAT/MATH 395 PROBABILITY II Distribution of Random Samples & Limit Theorems Néhémy Lim University of Washington Winter 2017 Outline Distribution of i.i.d. Samples Convergence of random variables The Laws
Normal distribution Approximating binomial distribution by normal 2.10 Central Limit Theorem
 1.1.2 Normal distribution 1.1.3 Approimating binomial distribution by normal 2.1 Central Limit Theorem Prof. Tesler Math 283 Fall 216 Prof. Tesler 1.1.2-3, 2.1 Normal distribution Math 283 / Fall 216 1
The Binomial Distribution
 MATH 382 The Binomial Distribution Dr. Neal, WKU Suppose there is a fixed probability p of having an occurrence (or success ) on any single attempt, and a sequence of n independent attempts is made. Then
ME3620. Theory of Engineering Experimentation. Spring Chapter III. Random Variables and Probability Distributions.
 ME3620 Theory of Engineering Experimentation Chapter III. Random Variables and Probability Distributions Chapter III 1 3.2 Random Variables In an experiment, a measurement is usually denoted by a variable
Random Variable: Definition
 Random Variables Random Variable: Definition A Random Variable is a numerical description of the outcome of an experiment Experiment Roll a die 10 times Inspect a shipment of 100 parts Open a gas station
IEOR 3106: Introduction to OR: Stochastic Models. Fall 2013, Professor Whitt. Class Lecture Notes: Tuesday, September 10.
 IEOR 3106: Introduction to OR: Stochastic Models Fall 2013, Professor Whitt Class Lecture Notes: Tuesday, September 10. The Central Limit Theorem and Stock Prices 1. The Central Limit Theorem (CLT See
1. Covariance between two variables X and Y is denoted by Cov(X, Y) and defined by. Cov(X, Y ) = E(X E(X))(Y E(Y ))
 and defined by. Cov(X, Y ) = E(X E(X))(Y E(Y ))") Correlation & Estimation - Class 7 January 28, 2014 Debdeep Pati Association between two variables 1. Covariance between two variables X and Y is denoted by Cov(X, Y) and defined by Cov(X, Y ) = E(X E(X))(Y
Correlation & Estimation - Class 7 January 28, 2014 Debdeep Pati Association between two variables 1. Covariance between two variables X and Y is denoted by Cov(X, Y) and defined by Cov(X, Y ) = E(X E(X))(Y
AMS7: WEEK 4. CLASS 3
 AMS7: WEEK 4. CLASS 3 Sampling distributions and estimators. Central Limit Theorem Normal Approximation to the Binomial Distribution Friday April 24th, 2015 Sampling distributions and estimators REMEMBER:
Statistics for Managers Using Microsoft Excel 7 th Edition
 Statistics for Managers Using Microsoft Excel 7 th Edition Chapter 5 Discrete Probability Distributions Statistics for Managers Using Microsoft Excel 7e Copyright 014 Pearson Education, Inc. Chap 5-1 Learning
Mean of a Discrete Random variable. Suppose that X is a discrete random variable whose distribution is : :
 Dr. Kim s Note (December 17 th ) The values taken on by the random variable X are random, but the values follow the pattern given in the random variable table. What is a typical value of a random variable
Discrete Random Variables and Probability Distributions. Stat 4570/5570 Based on Devore s book (Ed 8)
") 3 Discrete Random Variables and Probability Distributions Stat 4570/5570 Based on Devore s book (Ed 8) Random Variables We can associate each single outcome of an experiment with a real number: We refer
3 Discrete Random Variables and Probability Distributions Stat 4570/5570 Based on Devore s book (Ed 8) Random Variables We can associate each single outcome of an experiment with a real number: We refer
The Central Limit Theorem. Sec. 8.2: The Random Variable. it s Distribution. it s Distribution
 The Central Limit Theorem Sec. 8.1: The Random Variable it s Distribution Sec. 8.2: The Random Variable it s Distribution X p and and How Should You Think of a Random Variable? Imagine a bag with numbers
UQ, STAT2201, 2017, Lectures 3 and 4 Unit 3 Probability Distributions.
 UQ, STAT2201, 2017, Lectures 3 and 4 Unit 3 Probability Distributions. Random Variables 2 A random variable X is a numerical (integer, real, complex, vector etc.) summary of the outcome of the random experiment.
CHAPTER 8 PROBABILITY DISTRIBUTIONS AND STATISTICS
 CHAPTER 8 PROBABILITY DISTRIBUTIONS AND STATISTICS 8.1 Distribution of Random Variables Random Variable Probability Distribution of Random Variables 8.2 Expected Value Mean Mean is the average value of
Central Limit Theorem, Joint Distributions Spring 2018
 Central Limit Theorem, Joint Distributions 18.5 Spring 218.5.4.3.2.1-4 -3-2 -1 1 2 3 4 Exam next Wednesday Exam 1 on Wednesday March 7, regular room and time. Designed for 1 hour. You will have the full
AP Statistics Ch 8 The Binomial and Geometric Distributions
 Ch 8.1 The Binomial Distributions The Binomial Setting A situation where these four conditions are satisfied is called a binomial setting. 1. Each observation falls into one of just two categories, which
continuous rv Note for a legitimate pdf, we have f (x) 0 and f (x)dx = 1. For a continuous rv, P(X = c) = c f (x)dx = 0, hence
 0 and f (x)dx = 1. For a continuous rv, P(X = c) = c f (x)dx = 0, hence") continuous rv Let X be a continuous rv. Then a probability distribution or probability density function (pdf) of X is a function f(x) such that for any two numbers a and b with a b, P(a X b) = b a f (x)dx.
continuous rv Let X be a continuous rv. Then a probability distribution or probability density function (pdf) of X is a function f(x) such that for any two numbers a and b with a b, P(a X b) = b a f (x)dx.
4 Random Variables and Distributions
 4 Random Variables and Distributions Random variables A random variable assigns each outcome in a sample space. e.g. called a realization of that variable to Note: We ll usually denote a random variable
5. In fact, any function of a random variable is also a random variable
 Random Variables - Class 11 October 14, 2012 Debdeep Pati 1 Random variables 1.1 Expectation of a function of a random variable 1. Expectation of a function of a random variable 2. We know E(X) = x xp(x)
Sampling Distribution
 MAT 2379 (Spring 2012) Sampling Distribution Definition : Let X 1,..., X n be a collection of random variables. We say that they are identically distributed if they have a common distribution. Definition
Review of the Topics for Midterm I
 Review of the Topics for Midterm I STA 100 Lecture 9 I. Introduction The objective of statistics is to make inferences about a population based on information contained in a sample. A population is the
Normal Cumulative Distribution Function (CDF)
") The Normal Model 2 Solutions COR1-GB.1305 Statistics and Data Analysis Normal Cumulative Distribution Function (CDF 1. Suppose that an automobile muffler is designed so that its lifetime (in months is
The Normal Model 2 Solutions COR1-GB.1305 Statistics and Data Analysis Normal Cumulative Distribution Function (CDF 1. Suppose that an automobile muffler is designed so that its lifetime (in months is
6.5: THE NORMAL APPROXIMATION TO THE BINOMIAL AND
 CD6-12 6.5: THE NORMAL APPROIMATION TO THE BINOMIAL AND POISSON DISTRIBUTIONS In the earlier sections of this chapter the normal probability distribution was discussed. In this section another useful aspect
ECON 214 Elements of Statistics for Economists 2016/2017
 ECON 214 Elements of Statistics for Economists 2016/2017 Topic Probability Distributions: Binomial and Poisson Distributions Lecturer: Dr. Bernardin Senadza, Dept. of Economics bsenadza@ug.edu.gh College
A random variable (r. v.) is a variable whose value is a numerical outcome of a random phenomenon.
 is a variable whose value is a numerical outcome of a random phenomenon.") Chapter 14: random variables p394 A random variable (r. v.) is a variable whose value is a numerical outcome of a random phenomenon. Consider the experiment of tossing a coin. Define a random variable
Chapter 14: random variables p394 A random variable (r. v.) is a variable whose value is a numerical outcome of a random phenomenon. Consider the experiment of tossing a coin. Define a random variable
Bernoulli and Binomial Distributions
 Bernoulli and Binomial Distributions Bernoulli Distribution a flipped coin turns up either heads or tails an item on an assembly line is either defective or not defective a piece of fruit is either damaged
Random Variables Handout. Xavier Vilà
 Random Variables Handout Xavier Vilà Course 2004-2005 1 Discrete Random Variables. 1.1 Introduction 1.1.1 Definition of Random Variable A random variable X is a function that maps each possible outcome
Midterm Exam III Review
 Midterm Exam III Review Dr. Joseph Brennan Math 148, BU Dr. Joseph Brennan (Math 148, BU) Midterm Exam III Review 1 / 25 Permutations and Combinations ORDER In order to count the number of possible ways
Chapter 5. Statistical inference for Parametric Models
 Chapter 5. Statistical inference for Parametric Models Outline Overview Parameter estimation Method of moments How good are method of moments estimates? Interval estimation Statistical Inference for Parametric
Homework Assignments
 Homework Assignments Week 1 (p. 57) #4.1, 4., 4.3 Week (pp 58 6) #4.5, 4.6, 4.8(a), 4.13, 4.0, 4.6(b), 4.8, 4.31, 4.34 Week 3 (pp 15 19) #1.9, 1.1, 1.13, 1.15, 1.18 (pp 9 31) #.,.6,.9 Week 4 (pp 36 37)
Central Limit Thm, Normal Approximations
 Central Limit Thm, Normal Approximations Engineering Statistics Section 5.4 Josh Engwer TTU 23 March 2016 Josh Engwer (TTU) Central Limit Thm, Normal Approximations 23 March 2016 1 / 26 PART I PART I:
5.3 Statistics and Their Distributions
 Chapter 5 Joint Probability Distributions and Random Samples Instructor: Lingsong Zhang 1 Statistics and Their Distributions 5.3 Statistics and Their Distributions Statistics and Their Distributions Consider
Review for Final Exam Spring 2014 Jeremy Orloff and Jonathan Bloom
 Review for Final Exam 18.05 Spring 2014 Jeremy Orloff and Jonathan Bloom THANK YOU!!!! JON!! PETER!! RUTHI!! ERIKA!! ALL OF YOU!!!! Probability Counting Sets Inclusion-exclusion principle Rule of product
Chapter 4: Commonly Used Distributions. Statistics for Engineers and Scientists Fourth Edition William Navidi
 Chapter 4: Commonly Used Distributions Statistics for Engineers and Scientists Fourth Edition William Navidi 2014 by Education. This is proprietary material solely for authorized instructor use. Not authorized
The binomial distribution p314
 The binomial distribution p314 Example: A biased coin (P(H) = p = 0.6) ) is tossed 5 times. Let X be the number of H s. Fine P(X = 2). This X is a binomial r. v. The binomial setting p314 1. There are
Commonly Used Distributions
 Chapter 4: Commonly Used Distributions 1 Introduction Statistical inference involves drawing a sample from a population and analyzing the sample data to learn about the population. We often have some knowledge
STOR Lecture 7. Random Variables - I
 STOR 435.001 Lecture 7 Random Variables - I Shankar Bhamidi UNC Chapel Hill 1 / 31 Example 1a: Suppose that our experiment consists of tossing 3 fair coins. Let Y denote the number of heads that appear.
Chapter 9: Sampling Distributions
 Chapter 9: Sampling Distributions 9. Introduction This chapter connects the material in Chapters 4 through 8 (numerical descriptive statistics, sampling, and probability distributions, in particular) with
Martingales, Part II, with Exercise Due 9/21
 Econ. 487a Fall 1998 C.Sims Martingales, Part II, with Exercise Due 9/21 1. Brownian Motion A process {X t } is a Brownian Motion if and only if i. it is a martingale, ii. t is a continuous time parameter
AP Statistics Test 5
 AP Statistics Test 5 Name: Date: Period: ffl If X is a discrete random variable, the the mean of X and the variance of X are given by μ = E(X) = X xp (X = x); Var(X) = X (x μ) 2 P (X = x): ffl If X is
Chapter 8: The Binomial and Geometric Distributions
 Chapter 8: The Binomial and Geometric Distributions 8.1 Binomial Distributions 8.2 Geometric Distributions 1 Let me begin with an example My best friends from Kent School had three daughters. What is the
Econ 6900: Statistical Problems. Instructor: Yogesh Uppal
 Econ 6900: Statistical Problems Instructor: Yogesh Uppal Email: yuppal@ysu.edu Lecture Slides 4 Random Variables Probability Distributions Discrete Distributions Discrete Uniform Probability Distribution
Lecture 12. Some Useful Continuous Distributions. The most important continuous probability distribution in entire field of statistics.
 ENM 207 Lecture 12 Some Useful Continuous Distributions Normal Distribution The most important continuous probability distribution in entire field of statistics. Its graph, called the normal curve, is
Math489/889 Stochastic Processes and Advanced Mathematical Finance Homework 5
 Math489/889 Stochastic Processes and Advanced Mathematical Finance Homework 5 Steve Dunbar Due Fri, October 9, 7. Calculate the m.g.f. of the random variable with uniform distribution on [, ] and then
Section 7.5 The Normal Distribution. Section 7.6 Application of the Normal Distribution
 Section 7.6 Application of the Normal Distribution A random variable that may take on infinitely many values is called a continuous random variable. A continuous probability distribution is defined by
Chapter 3 Discrete Random Variables and Probability Distributions
 Chapter 3 Discrete Random Variables and Probability Distributions Part 3: Special Discrete Random Variable Distributions Section 3.5 Discrete Uniform Section 3.6 Bernoulli and Binomial Others sections
MTH6154 Financial Mathematics I Stochastic Interest Rates
 MTH6154 Financial Mathematics I Stochastic Interest Rates Contents 4 Stochastic Interest Rates 45 4.1 Fixed Interest Rate Model............................ 45 4.2 Varying Interest Rate Model...........................
The Bernoulli distribution
 This work is licensed under a Creative Commons Attribution-NonCommercial-ShareAlike License. Your use of this material constitutes acceptance of that license and the conditions of use of materials on this
Discrete Random Variables and Probability Distributions
 Chapter 4 Discrete Random Variables and Probability Distributions 4.1 Random Variables A quantity resulting from an experiment that, by chance, can assume different values. A random variable is a variable
The Binomial Probability Distribution
 The Binomial Probability Distribution MATH 130, Elements of Statistics I J. Robert Buchanan Department of Mathematics Fall 2017 Objectives After this lesson we will be able to: determine whether a probability
CS 237: Probability in Computing
 CS 237: Probability in Computing Wayne Snyder Computer Science Department Boston University Lecture 10: o Cumulative Distribution Functions o Standard Deviations Bernoulli Binomial Geometric Cumulative
Discrete Random Variables
 Discrete Random Variables ST 370 A random variable is a numerical value associated with the outcome of an experiment. Discrete random variable When we can enumerate the possible values of the variable
ECON 214 Elements of Statistics for Economists 2016/2017
 ECON 214 Elements of Statistics for Economists 2016/2017 Topic The Normal Distribution Lecturer: Dr. Bernardin Senadza, Dept. of Economics bsenadza@ug.edu.gh College of Education School of Continuing and
ECE 340 Probabilistic Methods in Engineering M/W 3-4:15. Lecture 10: Continuous RV Families. Prof. Vince Calhoun
 ECE 340 Probabilistic Methods in Engineering M/W 3-4:15 Lecture 10: Continuous RV Families Prof. Vince Calhoun 1 Reading This class: Section 4.4-4.5 Next class: Section 4.6-4.7 2 Homework 3.9, 3.49, 4.5,
Data Analytics (CS40003) Practice Set IV (Topic: Probability and Sampling Distribution)
 Practice Set IV (Topic: Probability and Sampling Distribution)") Data Analytics (CS40003) Practice Set IV (Topic: Probability and Sampling Distribution) I. Concept Questions 1. Give an example of a random variable in the context of Drawing a card from a deck of cards.
Data Analytics (CS40003) Practice Set IV (Topic: Probability and Sampling Distribution) I. Concept Questions 1. Give an example of a random variable in the context of Drawing a card from a deck of cards.
Chapter 4 Continuous Random Variables and Probability Distributions
 Chapter 4 Continuous Random Variables and Probability Distributions Part 2: More on Continuous Random Variables Section 4.5 Continuous Uniform Distribution Section 4.6 Normal Distribution 1 / 28 One more
Normal distribution. We say that a random variable X follows the normal distribution if the probability density function of X is given by
 Normal distribution The normal distribution is the most important distribution. It describes well the distribution of random variables that arise in practice, such as the heights or weights of people,
The Normal Distribution
 The Normal Distribution The normal distribution plays a central role in probability theory and in statistics. It is often used as a model for the distribution of continuous random variables. Like all models,
4-1. Chapter 4. Commonly Used Distributions by The McGraw-Hill Companies, Inc. All rights reserved.
 4-1 Chapter 4 Commonly Used Distributions 2014 by The Companies, Inc. All rights reserved. Section 4.1: The Bernoulli Distribution 4-2 We use the Bernoulli distribution when we have an experiment which
Problems from 9th edition of Probability and Statistical Inference by Hogg, Tanis and Zimmerman:
 Math 224 Fall 207 Homework 5 Drew Armstrong Problems from 9th edition of Probability and Statistical Inference by Hogg, Tanis and Zimmerman: Section 3., Exercises 3, 0. Section 3.3, Exercises 2, 3, 0,.
Probability Distributions for Discrete RV
 Probability Distributions for Discrete RV Probability Distributions for Discrete RV Definition The probability distribution or probability mass function (pmf) of a discrete rv is defined for every number
Section Distributions of Random Variables
 Section 8.1 - Distributions of Random Variables Definition: A random variable is a rule that assigns a number to each outcome of an experiment. Example 1: Suppose we toss a coin three times. Then we could
Chapter 7: Point Estimation and Sampling Distributions
 Chapter 7: Point Estimation and Sampling Distributions Seungchul Baek Department of Statistics, University of South Carolina STAT 509: Statistics for Engineers 1 / 20 Motivation In chapter 3, we learned
AMS 7 Sampling Distributions, Central limit theorem, Confidence Intervals Lecture 4
 AMS 7 Sampling Distributions, Central limit theorem, Confidence Intervals Lecture 4 Department of Applied Mathematics and Statistics, University of California, Santa Cruz Summer 2014 1 / 26 Sampling Distributions!!!!!!
CVE SOME DISCRETE PROBABILITY DISTRIBUTIONS
 CVE 472 2. SOME DISCRETE PROBABILITY DISTRIBUTIONS Assist. Prof. Dr. Bertuğ Akıntuğ Civil Engineering Program Middle East Technical University Northern Cyprus Campus CVE 472 Statistical Techniques in Hydrology.
Business Statistics 41000: Probability 4
 Business Statistics 41000: Probability 4 Drew D. Creal University of Chicago, Booth School of Business February 14 and 15, 2014 1 Class information Drew D. Creal Email: dcreal@chicagobooth.edu Office:
Exam 2 Spring 2015 Statistics for Applications 4/9/2015
 18.443 Exam 2 Spring 2015 Statistics for Applications 4/9/2015 1. True or False (and state why). (a). The significance level of a statistical test is not equal to the probability that the null hypothesis
Chapter 5. Continuous Random Variables and Probability Distributions. 5.1 Continuous Random Variables
 Chapter 5 Continuous Random Variables and Probability Distributions 5.1 Continuous Random Variables 1 2CHAPTER 5. CONTINUOUS RANDOM VARIABLES AND PROBABILITY DISTRIBUTIONS Probability Distributions Probability
ECO220Y Continuous Probability Distributions: Normal Readings: Chapter 9, section 9.10
 ECO220Y Continuous Probability Distributions: Normal Readings: Chapter 9, section 9.10 Fall 2011 Lecture 8 Part 2 (Fall 2011) Probability Distributions Lecture 8 Part 2 1 / 23 Normal Density Function f
TOPIC: PROBABILITY DISTRIBUTIONS
 TOPIC: PROBABILITY DISTRIBUTIONS There are two types of random variables: A Discrete random variable can take on only specified, distinct values. A Continuous random variable can take on any value within
Lecture Stat 302 Introduction to Probability - Slides 15
 Lecture Stat 30 Introduction to Probability - Slides 15 AD March 010 AD () March 010 1 / 18 Continuous Random Variable Let X a (real-valued) continuous r.v.. It is characterized by its pdf f : R! [0, )
Chapter 4 Discrete Random variables
 Chapter 4 Discrete Random variables A is a variable that assumes numerical values associated with the random outcomes of an experiment, where only one numerical value is assigned to each sample point.
Chapter 8. Introduction to Statistical Inference
 Chapter 8. Introduction to Statistical Inference Point Estimation Statistical inference is to draw some type of conclusion about one or more parameters(population characteristics). Now you know that a
Discrete Probability Distribution
 1 Discrete Probability Distribution Key Definitions Discrete Random Variable: Has a countable number of values. This means that each data point is distinct and separate. Continuous Random Variable: Has
CIVL Discrete Distributions
 CIVL 3103 Discrete Distributions Learning Objectives Define discrete distributions, and identify common distributions applicable to engineering problems. Identify the appropriate distribution (i.e. binomial,
Lecture Notes 6. Assume F belongs to a family of distributions, (e.g. F is Normal), indexed by some parameter θ.
, indexed by some parameter θ.") Sufficient Statistics Lecture Notes 6 Sufficiency Data reduction in terms of a particular statistic can be thought of as a partition of the sample space X. Definition T is sufficient for θ if the conditional
Sufficient Statistics Lecture Notes 6 Sufficiency Data reduction in terms of a particular statistic can be thought of as a partition of the sample space X. Definition T is sufficient for θ if the conditional
Some Discrete Distribution Families
 Some Discrete Distribution Families ST 370 Many families of discrete distributions have been studied; we shall discuss the ones that are most commonly found in applications. In each family, we need a formula
Using the Central Limit Theorem It is important for you to understand when to use the CLT. If you are being asked to find the probability of the
 Using the Central Limit Theorem It is important for you to understand when to use the CLT. If you are being asked to find the probability of the mean, use the CLT for the mean. If you are being asked to
2011 Pearson Education, Inc
 Statistics for Business and Economics Chapter 4 Random Variables & Probability Distributions Content 1. Two Types of Random Variables 2. Probability Distributions for Discrete Random Variables 3. The Binomial
. (i) What is the probability that X is at most 8.75? =.875
 What is the probability that X is at most 8.75? =.875") Worksheet 1 Prep-Work (Distributions) 1)Let X be the random variable whose c.d.f. is given below. F X 0 0.3 ( x) 0.5 0.8 1.0 if if if if if x 5 5 x 10 10 x 15 15 x 0 0 x Compute the mean, X. (Hint: First
Worksheet 1 Prep-Work (Distributions) 1)Let X be the random variable whose c.d.f. is given below. F X 0 0.3 ( x) 0.5 0.8 1.0 if if if if if x 5 5 x 10 10 x 15 15 x 0 0 x Compute the mean, X. (Hint: First