CHAPTER 8 PROBABILITY DISTRIBUTIONS AND STATISTICS
|
|
|
- Terence Dorsey
- 5 years ago
- Views:
Transcription
1 CHAPTER 8 PROBABILITY DISTRIBUTIONS AND STATISTICS
2 8.1 Distribution of Random Variables

3 Random Variable

4 Probability Distribution of Random Variables
5 8.2 Expected Value

6 Mean Mean is the average value of a set of numbers.

7 Applied Example Find the average number of cars waiting in line at the bank s drive-in teller at the beginning of each 2-minute interval during the period in question.
 of a random variable")
8 Expected Value The following gives a general method for calculating the expected value (that is, the average or mean) of a random variable X.

9 Applied Example
10 8.3 Variance and Standard Deviation
11 Variance The mean, or expected value, of a random variable enables us to express an important property of the probability distribution associated with the random variable in terms of a single number. But the knowledge of the location, or central tendency, of a probability distribution alone is usually not enough to give a reasonably accurate picture of the probability distribution. Illustration. Olivia has ten packages of Brand A potato chips and ten packages of Brand B potato chips. After carefully measuring the weights of each package, she obtains the following results: We can verify that the mean weights for each of the two brands is 16 ounces. However, a cursory examination of the data now shows that the weights of the Brand B packages exhibit much greater dispersion about the mean than do those of Brand A. One measure of the degree of dispersion, or spread, of a probability distribution about its mean is given by the variance of the random variable associated with the probability distribution. A probability distribution with a small spread about its mean will have a small variance, whereas one with a larger spread will have a larger variance.

12 Variance of a Random Variable
13 Example

14 Standard Deviation
15 8.4 The Binomial Distribution
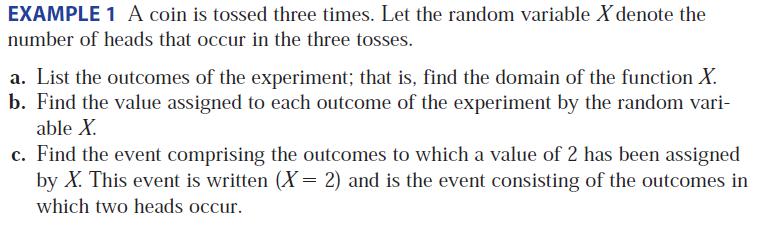
16 Bernoulli Trials An important class of experiments have (or may be viewed as having) two outcomes. Example: In a coin-tossing experiment, the two outcomes are heads and tails. An experiment in which a person is inoculated with a flu vaccine. Here, the vaccine may be classified as being effective or ineffective with respect to that particular person. Experiments with two outcomes are called Bernoulli trials or binomial trials. It is standard practice to label one of the outcomes of a binomial trial a success and the other a failure. Example: In a coin-tossing experiment, the outcome a head may be called a success, in which case the outcome a tail is called a failure.
 trials is called a binomial")
17 Binomial Experiment A sequence of Bernoulli (binomial) trials is called a binomial experiment.
18 n, p, and q In a binomial experiment, it is customary to denote the number of trials by n, the probability of a success by p, and the probability of a failure by q. Because the event of a success and the event of a failure are complementary events, we have the relationship p + q = 1 or, equivalently, q = 1 p
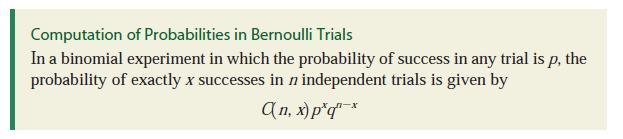
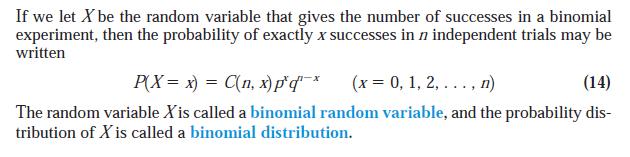
19 Probabilities in Bernoulli Trials

20 Mean, Variance, and Standard Deviation of Binomial Distribution EXAMPLE 4 For the experiment in Examples, compute the mean, the variance, and the standard deviation of X

21 Applied Example
22 Finite and Continuous Probability Distributions The probability distributions discussed in the preceding sections were all associated with finite random variables that is, random variables that take on finitely many values. Such probability distributions are referred to as finite probability distributions. We also consider probability distributions associated with a continuous random variable that is, a random variable that may take on any value lying in an interval of real numbers. Such probability distributions are called continuous probability distributions.

 is nonnegative for all values of x in its domain. 2.")
23 Probability Density Functions A continuous probability distribution is defined by a function f whose domain coincides with the interval of values taken on by the random variable associated with the experiment. Such a function f is called the probability density function associated with the probability distribution, and it has the following properties: 1. f (x) is nonnegative for all values of x in its domain. 2. The area of the region between the graph of f and the x-axis is equal to 1
24 Normal Distributions Normal distributions are without a doubt the most important of all the probability distributions. Many phenomena such as the heights of people in a given population, the weights of newborn infants, the IQs of college students, the actual weights of 16-ounce packages of cereals, and so on have probability distributions that are normal. The normal distribution also provides us with an accurate approximation to the distributions of many random variables associated with random-sampling problems.


25 Normal Curve The graph of a normal distribution, which is bell shaped, is called a normal curve
26 Standard Normal Distribution The normal curve with mean = 0 and standard deviation = 1 is called the standard normal curve. The corresponding distribution is called the standard normal distribution. The random variable itself is called the standard normal random variable and is commonly denoted by Z.

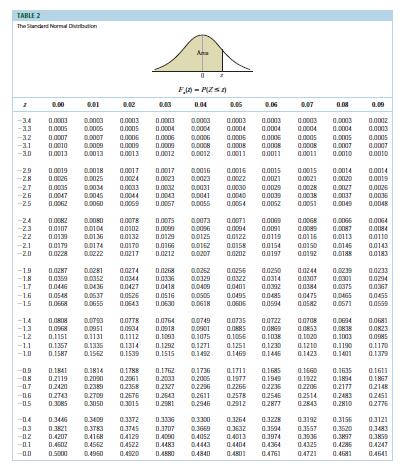
27 Table of Standard Normal Distribution
28 Examples 1. Let Z be the standard normal variable. Find the values of a. P(Z < 1.24) b. P(Z > 0.5) c. P(0.24 < Z < 1.48) d. P(1.65 < Z < 2.02) 2. Let Z be the standard normal random variable. Find the value of z if z satisfies a. P(Z < z) =.9474 b. P(Z > z) =.9115 c. P(-z < Z < z) = Suppose X is a normal random variable with = 100 and = 20. Find the values of: a. P(X < 120) b. P(X > 70) c. P(75 < X < 110)

29 Applied Examples
Section 7.5 The Normal Distribution. Section 7.6 Application of the Normal Distribution
 Section 7.6 Application of the Normal Distribution A random variable that may take on infinitely many values is called a continuous random variable. A continuous probability distribution is defined by
STAT Chapter 5: Continuous Distributions. Probability distributions are used a bit differently for continuous r.v. s than for discrete r.v. s.
 STAT 515 -- Chapter 5: Continuous Distributions Probability distributions are used a bit differently for continuous r.v. s than for discrete r.v. s. Continuous distributions typically are represented by
Section Random Variables and Histograms
 Section 3.1 - Random Variables and Histograms Definition: A random variable is a rule that assigns a number to each outcome of an experiment. Example 1: Suppose we toss a coin three times. Then we could
Statistics 6 th Edition
 Statistics 6 th Edition Chapter 5 Discrete Probability Distributions Chap 5-1 Definitions Random Variables Random Variables Discrete Random Variable Continuous Random Variable Ch. 5 Ch. 6 Chap 5-2 Discrete
ECON 214 Elements of Statistics for Economists 2016/2017
 ECON 214 Elements of Statistics for Economists 2016/2017 Topic The Normal Distribution Lecturer: Dr. Bernardin Senadza, Dept. of Economics bsenadza@ug.edu.gh College of Education School of Continuing and
2011 Pearson Education, Inc
 Statistics for Business and Economics Chapter 4 Random Variables & Probability Distributions Content 1. Two Types of Random Variables 2. Probability Distributions for Discrete Random Variables 3. The Binomial
AMS7: WEEK 4. CLASS 3
 AMS7: WEEK 4. CLASS 3 Sampling distributions and estimators. Central Limit Theorem Normal Approximation to the Binomial Distribution Friday April 24th, 2015 Sampling distributions and estimators REMEMBER:
STAT Chapter 5: Continuous Distributions. Probability distributions are used a bit differently for continuous r.v. s than for discrete r.v. s.
 STAT 515 -- Chapter 5: Continuous Distributions Probability distributions are used a bit differently for continuous r.v. s than for discrete r.v. s. Continuous distributions typically are represented by
Discrete Random Variables and Probability Distributions
 Chapter 4 Discrete Random Variables and Probability Distributions 4.1 Random Variables A quantity resulting from an experiment that, by chance, can assume different values. A random variable is a variable
Theoretical Foundations
 Theoretical Foundations Probabilities Monia Ranalli monia.ranalli@uniroma2.it Ranalli M. Theoretical Foundations - Probabilities 1 / 27 Objectives understand the probability basics quantify random phenomena
Section Distributions of Random Variables
 Section 8.1 - Distributions of Random Variables Definition: A random variable is a rule that assigns a number to each outcome of an experiment. Example 1: Suppose we toss a coin three times. Then we could
Introduction to Business Statistics QM 120 Chapter 6
 DEPARTMENT OF QUANTITATIVE METHODS & INFORMATION SYSTEMS Introduction to Business Statistics QM 120 Chapter 6 Spring 2008 Chapter 6: Continuous Probability Distribution 2 When a RV x is discrete, we can
Statistics 511 Supplemental Materials
 Gaussian (or Normal) Random Variable In this section we introduce the Gaussian Random Variable, which is more commonly referred to as the Normal Random Variable. This is a random variable that has a bellshaped
Example. Chapter 8 Probability Distributions and Statistics Section 8.1 Distributions of Random Variables
 Chapter 8 Probability Distributions and Statistics Section 8.1 Distributions of Random Variables You are dealt a hand of 5 cards. Find the probability distribution table for the number of hearts. Graph
5.4 Normal Approximation of the Binomial Distribution
 5.4 Normal Approximation of the Binomial Distribution Bernoulli Trials have 3 properties: 1. Only two outcomes - PASS or FAIL 2. n identical trials Review from yesterday. 3. Trials are independent - probability
Statistical Methods in Practice STAT/MATH 3379
 Statistical Methods in Practice STAT/MATH 3379 Dr. A. B. W. Manage Associate Professor of Mathematics & Statistics Department of Mathematics & Statistics Sam Houston State University Overview 6.1 Discrete
Example - Let X be the number of boys in a 4 child family. Find the probability distribution table:
 Chapter8 Probability Distributions and Statistics Section 8.1 Distributions of Random Variables tthe value of the result of the probability experiment is a RANDOM VARIABLE. Example - Let X be the number
Chapter 3 - Lecture 5 The Binomial Probability Distribution
 Chapter 3 - Lecture 5 The Binomial Probability October 12th, 2009 Experiment Examples Moments and moment generating function of a Binomial Random Variable Outline Experiment Examples A binomial experiment
MAS1403. Quantitative Methods for Business Management. Semester 1, Module leader: Dr. David Walshaw
 MAS1403 Quantitative Methods for Business Management Semester 1, 2018 2019 Module leader: Dr. David Walshaw Additional lecturers: Dr. James Waldren and Dr. Stuart Hall Announcements: Written assignment
The normal distribution is a theoretical model derived mathematically and not empirically.
 Sociology 541 The Normal Distribution Probability and An Introduction to Inferential Statistics Normal Approximation The normal distribution is a theoretical model derived mathematically and not empirically.
8.2 The Standard Deviation as a Ruler Chapter 8 The Normal and Other Continuous Distributions 8-1
 8.2 The Standard Deviation as a Ruler Chapter 8 The Normal and Other Continuous Distributions For Example: On August 8, 2011, the Dow dropped 634.8 points, sending shock waves through the financial community.
Uniform Probability Distribution. Continuous Random Variables &
 Continuous Random Variables & What is a Random Variable? It is a quantity whose values are real numbers and are determined by the number of desired outcomes of an experiment. Is there any special Random
MAKING SENSE OF DATA Essentials series
 MAKING SENSE OF DATA Essentials series THE NORMAL DISTRIBUTION Copyright by City of Bradford MDC Prerequisites Descriptive statistics Charts and graphs The normal distribution Surveys and sampling Correlation
Week 7. Texas A& M University. Department of Mathematics Texas A& M University, College Station Section 3.2, 3.3 and 3.4
 Week 7 Oğuz Gezmiş Texas A& M University Department of Mathematics Texas A& M University, College Station Section 3.2, 3.3 and 3.4 Oğuz Gezmiş (TAMU) Topics in Contemporary Mathematics II Week7 1 / 19
ECON 214 Elements of Statistics for Economists
 ECON 214 Elements of Statistics for Economists Session 7 The Normal Distribution Part 1 Lecturer: Dr. Bernardin Senadza, Dept. of Economics Contact Information: bsenadza@ug.edu.gh College of Education
ECON 214 Elements of Statistics for Economists 2016/2017
 ECON 214 Elements of Statistics for Economists 2016/2017 Topic Probability Distributions: Binomial and Poisson Distributions Lecturer: Dr. Bernardin Senadza, Dept. of Economics bsenadza@ug.edu.gh College
5.4 Normal Approximation of the Binomial Distribution Lesson MDM4U Jensen
 5.4 Normal Approximation of the Binomial Distribution Lesson MDM4U Jensen Review From Yesterday Bernoulli Trials have 3 properties: 1. 2. 3. Binomial Probability Distribution In a binomial experiment with
MLLunsford 1. Activity: Central Limit Theorem Theory and Computations
 MLLunsford 1 Activity: Central Limit Theorem Theory and Computations Concepts: The Central Limit Theorem; computations using the Central Limit Theorem. Prerequisites: The student should be familiar with
Binomial Random Variables. Binomial Random Variables
 Bernoulli Trials Definition A Bernoulli trial is a random experiment in which there are only two possible outcomes - success and failure. 1 Tossing a coin and considering heads as success and tails as
Part V - Chance Variability
 Part V - Chance Variability Dr. Joseph Brennan Math 148, BU Dr. Joseph Brennan (Math 148, BU) Part V - Chance Variability 1 / 78 Law of Averages In Chapter 13 we discussed the Kerrich coin-tossing experiment.
Econ 6900: Statistical Problems. Instructor: Yogesh Uppal
 Econ 6900: Statistical Problems Instructor: Yogesh Uppal Email: yuppal@ysu.edu Lecture Slides 4 Random Variables Probability Distributions Discrete Distributions Discrete Uniform Probability Distribution
Example - Let X be the number of boys in a 4 child family. Find the probability distribution table:
 Chapter7 Probability Distributions and Statistics Distributions of Random Variables tthe value of the result of the probability experiment is a RANDOM VARIABLE. Example - Let X be the number of boys in
The Binomial Distribution
 The Binomial Distribution Properties of a Binomial Experiment 1. It consists of a fixed number of observations called trials. 2. Each trial can result in one of only two mutually exclusive outcomes labeled
Section Distributions of Random Variables
 Section 8.1 - Distributions of Random Variables Definition: A random variable is a rule that assigns a number to each outcome of an experiment. Example 1: Suppose we toss a coin three times. Then we could
CS 237: Probability in Computing
 CS 237: Probability in Computing Wayne Snyder Computer Science Department Boston University Lecture 12: Continuous Distributions Uniform Distribution Normal Distribution (motivation) Discrete vs Continuous
Math 227 Elementary Statistics. Bluman 5 th edition
 Math 227 Elementary Statistics Bluman 5 th edition CHAPTER 6 The Normal Distribution 2 Objectives Identify distributions as symmetrical or skewed. Identify the properties of the normal distribution. Find
ME3620. Theory of Engineering Experimentation. Spring Chapter III. Random Variables and Probability Distributions.
 ME3620 Theory of Engineering Experimentation Chapter III. Random Variables and Probability Distributions Chapter III 1 3.2 Random Variables In an experiment, a measurement is usually denoted by a variable
Chapter 4 and 5 Note Guide: Probability Distributions
 Chapter 4 and 5 Note Guide: Probability Distributions Probability Distributions for a Discrete Random Variable A discrete probability distribution function has two characteristics: Each probability is
Probability. An intro for calculus students P= Figure 1: A normal integral
 Probability An intro for calculus students.8.6.4.2 P=.87 2 3 4 Figure : A normal integral Suppose we flip a coin 2 times; what is the probability that we get more than 2 heads? Suppose we roll a six-sided
Chapter 8. Variables. Copyright 2004 Brooks/Cole, a division of Thomson Learning, Inc.
 Chapter 8 Random Variables Copyright 2004 Brooks/Cole, a division of Thomson Learning, Inc. 8.1 What is a Random Variable? Random Variable: assigns a number to each outcome of a random circumstance, or,
MATH 264 Problem Homework I
 MATH Problem Homework I Due to December 9, 00@:0 PROBLEMS & SOLUTIONS. A student answers a multiple-choice examination question that offers four possible answers. Suppose that the probability that the
Section M Discrete Probability Distribution
 Section M Discrete Probability Distribution A random variable is a numerical measure of the outcome of a probability experiment, so its value is determined by chance. Random variables are typically denoted
A continuous random variable is one that can theoretically take on any value on some line interval. We use f ( x)
") Section 6-2 I. Continuous Probability Distributions A continuous random variable is one that can theoretically take on any value on some line interval. We use f ( x) to represent a probability density
Section 6-2 I. Continuous Probability Distributions A continuous random variable is one that can theoretically take on any value on some line interval. We use f ( x) to represent a probability density
Elementary Statistics Lecture 5
 Elementary Statistics Lecture 5 Sampling Distributions Chong Ma Department of Statistics University of South Carolina Chong Ma (Statistics, USC) STAT 201 Elementary Statistics 1 / 24 Outline 1 Introduction
No, because np = 100(0.02) = 2. The value of np must be greater than or equal to 5 to use the normal approximation.
 = 2. The value of np must be greater than or equal to 5 to use the normal approximation.") 1) If n 100 and p 0.02 in a binomial experiment, does this satisfy the rule for a normal approximation? Why or why not? No, because np 100(0.02) 2. The value of np must be greater than or equal to 5 to
1) If n 100 and p 0.02 in a binomial experiment, does this satisfy the rule for a normal approximation? Why or why not? No, because np 100(0.02) 2. The value of np must be greater than or equal to 5 to
Example 1: Identify the following random variables as discrete or continuous: a) Weight of a package. b) Number of students in a first-grade classroom
 Weight of a package. b) Number of students in a first-grade classroom") Section 5-1 Probability Distributions I. Random Variables A variable x is a if the value that it assumes, corresponding to the of an experiment, is a or event. A random variable is if it potentially can
Section 5-1 Probability Distributions I. Random Variables A variable x is a if the value that it assumes, corresponding to the of an experiment, is a or event. A random variable is if it potentially can
Introduction to Statistics I
 Introduction to Statistics I Keio University, Faculty of Economics Continuous random variables Simon Clinet (Keio University) Intro to Stats November 1, 2018 1 / 18 Definition (Continuous random variable)
Chapter 7 1. Random Variables
 Chapter 7 1 Random Variables random variable numerical variable whose value depends on the outcome of a chance experiment - discrete if its possible values are isolated points on a number line - continuous
Statistics 431 Spring 2007 P. Shaman. Preliminaries
 Statistics 4 Spring 007 P. Shaman The Binomial Distribution Preliminaries A binomial experiment is defined by the following conditions: A sequence of n trials is conducted, with each trial having two possible
Normal distribution. We say that a random variable X follows the normal distribution if the probability density function of X is given by
 Normal distribution The normal distribution is the most important distribution. It describes well the distribution of random variables that arise in practice, such as the heights or weights of people,
Business Statistics 41000: Probability 4
 Business Statistics 41000: Probability 4 Drew D. Creal University of Chicago, Booth School of Business February 14 and 15, 2014 1 Class information Drew D. Creal Email: dcreal@chicagobooth.edu Office:
Central Limit Theorem 11/08/2005
 Central Limit Theorem 11/08/2005 A More General Central Limit Theorem Theorem. Let X 1, X 2,..., X n,... be a sequence of independent discrete random variables, and let S n = X 1 + X 2 + + X n. For each
Lecture 12. Some Useful Continuous Distributions. The most important continuous probability distribution in entire field of statistics.
 ENM 207 Lecture 12 Some Useful Continuous Distributions Normal Distribution The most important continuous probability distribution in entire field of statistics. Its graph, called the normal curve, is
Statistics, Measures of Central Tendency I
 Statistics, Measures of Central Tendency I We are considering a random variable X with a probability distribution which has some parameters. We want to get an idea what these parameters are. We perfom
Continuous Probability Distributions
 Continuous Probability Distributions Chapter 7 McGraw-Hill/Irwin Copyright 2010 by The McGraw-Hill Companies, Inc. All rights reserved. GOALS 1. Understand the difference between discrete and continuous
Examples: Random Variables. Discrete and Continuous Random Variables. Probability Distributions
 Random Variables Examples: Random variable a variable (typically represented by x) that takes a numerical value by chance. Number of boys in a randomly selected family with three children. Possible values:
d) Find the standard deviation of the random variable X.
 Find the standard deviation of the random variable X.") Q 1: The number of students using Math lab per day is found in the distribution below. x 6 8 10 12 14 P(x) 0.15 0.3 0.35 0.1 0.1 a) Find the mean for this probability distribution. b) Find the variance
Q 1: The number of students using Math lab per day is found in the distribution below. x 6 8 10 12 14 P(x) 0.15 0.3 0.35 0.1 0.1 a) Find the mean for this probability distribution. b) Find the variance
Lecture 8. The Binomial Distribution. Binomial Distribution. Binomial Distribution. Probability Distributions: Normal and Binomial
 Lecture 8 The Binomial Distribution Probability Distributions: Normal and Binomial 1 2 Binomial Distribution >A binomial experiment possesses the following properties. The experiment consists of a fixed
Lecture 9. Probability Distributions. Outline. Outline
 Outline Lecture 9 Probability Distributions 6-1 Introduction 6- Probability Distributions 6-3 Mean, Variance, and Expectation 6-4 The Binomial Distribution Outline 7- Properties of the Normal Distribution
Week 1 Variables: Exploration, Familiarisation and Description. Descriptive Statistics.
 Week 1 Variables: Exploration, Familiarisation and Description. Descriptive Statistics. Convergent validity: the degree to which results/evidence from different tests/sources, converge on the same conclusion.
Consider the following examples: ex: let X = tossing a coin three times and counting the number of heads
 Overview Both chapters and 6 deal with a similar concept probability distributions. The difference is that chapter concerns itself with discrete probability distribution while chapter 6 covers continuous
CH 5 Normal Probability Distributions Properties of the Normal Distribution
 Properties of the Normal Distribution Example A friend that is always late. Let X represent the amount of minutes that pass from the moment you are suppose to meet your friend until the moment your friend
MA : Introductory Probability
 MA 320-001: Introductory Probability David Murrugarra Department of Mathematics, University of Kentucky http://www.math.uky.edu/~dmu228/ma320/ Spring 2017 David Murrugarra (University of Kentucky) MA 320:
x is a random variable which is a numerical description of the outcome of an experiment.
 Chapter 5 Discrete Probability Distributions Random Variables is a random variable which is a numerical description of the outcome of an eperiment. Discrete: If the possible values change by steps or jumps.
Engineering Statistics ECIV 2305
 Engineering Statistics ECIV 2305 Section 5.3 Approximating Distributions with the Normal Distribution Introduction A very useful property of the normal distribution is that it provides good approximations
Lecture 9. Probability Distributions
 Lecture 9 Probability Distributions Outline 6-1 Introduction 6-2 Probability Distributions 6-3 Mean, Variance, and Expectation 6-4 The Binomial Distribution Outline 7-2 Properties of the Normal Distribution
MTH 245: Mathematics for Management, Life, and Social Sciences
 1/14 MTH 245: Mathematics for Management, Life, and Social Sciences May 18, 2015 Section 7.6 Section 7.6: The Normal Distribution. 2/14 The Normal Distribution. Figure: Abraham DeMoivre Section 7.6: The
Statistics for Business and Economics
 Statistics for Business and Economics Chapter 5 Continuous Random Variables and Probability Distributions Ch. 5-1 Probability Distributions Probability Distributions Ch. 4 Discrete Continuous Ch. 5 Probability
Continuous Random Variables and Probability Distributions
 CHAPTER 5 CHAPTER OUTLINE Continuous Random Variables and Probability Distributions 5.1 Continuous Random Variables The Uniform Distribution 5.2 Expectations for Continuous Random Variables 5.3 The Normal
Activity #17b: Central Limit Theorem #2. 1) Explain the Central Limit Theorem in your own words.
 Explain the Central Limit Theorem in your own words.") Activity #17b: Central Limit Theorem #2 1) Explain the Central Limit Theorem in your own words. Importance of the CLT: You can standardize and use normal distribution tables to calculate probabilities
Activity #17b: Central Limit Theorem #2 1) Explain the Central Limit Theorem in your own words. Importance of the CLT: You can standardize and use normal distribution tables to calculate probabilities
Math 14 Lecture Notes Ch The Normal Approximation to the Binomial Distribution. P (X ) = nc X p X q n X =
 = nc X p X q n X =") 6.4 The Normal Approximation to the Binomial Distribution Recall from section 6.4 that g A binomial experiment is a experiment that satisfies the following four requirements: 1. Each trial can have only
6.4 The Normal Approximation to the Binomial Distribution Recall from section 6.4 that g A binomial experiment is a experiment that satisfies the following four requirements: 1. Each trial can have only
The Normal Probability Distribution
 1 The Normal Probability Distribution Key Definitions Probability Density Function: An equation used to compute probabilities for continuous random variables where the output value is greater than zero
Chapter 6: Random Variables
 Chapter 6: Random Variables Section 6.1 Discrete and Continuous Random Variables The Practice of Statistics, 4 th edition For AP* STARNES, YATES, MOORE Chapter 6 Random Variables 6.1 Discrete and Continuous
Lecture 6: Chapter 6
 Lecture 6: Chapter 6 C C Moxley UAB Mathematics 3 October 16 6.1 Continuous Probability Distributions Last week, we discussed the binomial probability distribution, which was discrete. 6.1 Continuous Probability
Chapter 6 Continuous Probability Distributions. Learning objectives
 Chapter 6 Continuous s Slide 1 Learning objectives 1. Understand continuous probability distributions 2. Understand Uniform distribution 3. Understand Normal distribution 3.1. Understand Standard normal
MTH 245: Mathematics for Management, Life, and Social Sciences
 1/14 MTH 245: Mathematics for Management, Life, and Social Sciences Section 7.6 Section 7.6: The Normal Distribution. 2/14 The Normal Distribution. Figure: Abraham DeMoivre Section 7.6: The Normal Distribution.
University of California, Los Angeles Department of Statistics. Normal distribution
 University of California, Los Angeles Department of Statistics Statistics 110A Instructor: Nicolas Christou Normal distribution The normal distribution is the most important distribution. It describes
CHAPTER 6 Random Variables
 CHAPTER 6 Random Variables 6.1 Discrete and Continuous Random Variables The Practice of Statistics, 5th Edition Starnes, Tabor, Yates, Moore Bedford Freeman Worth Publishers Discrete and Continuous Random
The topics in this section are related and necessary topics for both course objectives.
 2.5 Probability Distributions The topics in this section are related and necessary topics for both course objectives. A probability distribution indicates how the probabilities are distributed for outcomes
Chapter 3: Probability Distributions and Statistics
 Chapter 3: Probability Distributions and Statistics Section 3.-3.3 3. Random Variables and Histograms A is a rule that assigns precisely one real number to each outcome of an experiment. We usually denote
STAT 201 Chapter 6. Distribution
 STAT 201 Chapter 6 Distribution 1 Random Variable We know variable Random Variable: a numerical measurement of the outcome of a random phenomena Capital letter refer to the random variable Lower case letters
Business Statistics 41000: Probability 3
 Business Statistics 41000: Probability 3 Drew D. Creal University of Chicago, Booth School of Business February 7 and 8, 2014 1 Class information Drew D. Creal Email: dcreal@chicagobooth.edu Office: 404
Random Variable: Definition
 Random Variables Random Variable: Definition A Random Variable is a numerical description of the outcome of an experiment Experiment Roll a die 10 times Inspect a shipment of 100 parts Open a gas station
UQ, STAT2201, 2017, Lectures 3 and 4 Unit 3 Probability Distributions.
 UQ, STAT2201, 2017, Lectures 3 and 4 Unit 3 Probability Distributions. Random Variables 2 A random variable X is a numerical (integer, real, complex, vector etc.) summary of the outcome of the random experiment.
Distributions in Excel
 Distributions in Excel Functions Normal Inverse normal function Log normal Random Number Percentile functions Other distributions Probability Distributions A random variable is a numerical measure of the
Chapter ! Bell Shaped
 Chapter 6 6-1 Business Statistics: A First Course 5 th Edition Chapter 7 Continuous Probability Distributions Learning Objectives In this chapter, you learn:! To compute probabilities from the normal distribution!
Chapter 4: Commonly Used Distributions. Statistics for Engineers and Scientists Fourth Edition William Navidi
 Chapter 4: Commonly Used Distributions Statistics for Engineers and Scientists Fourth Edition William Navidi 2014 by Education. This is proprietary material solely for authorized instructor use. Not authorized
Binomial and Normal Distributions
 Binomial and Normal Distributions Bernoulli Trials A Bernoulli trial is a random experiment with 2 special properties: The result of a Bernoulli trial is binary. Examples: Heads vs. Tails, Healthy vs.
The binomial distribution p314
 The binomial distribution p314 Example: A biased coin (P(H) = p = 0.6) ) is tossed 5 times. Let X be the number of H s. Fine P(X = 2). This X is a binomial r. v. The binomial setting p314 1. There are
MATH 118 Class Notes For Chapter 5 By: Maan Omran
 MATH 118 Class Notes For Chapter 5 By: Maan Omran Section 5.1 Central Tendency Mode: the number or numbers that occur most often. Median: the number at the midpoint of a ranked data. Ex1: The test scores
Chapter 4 Discrete Random variables
 Chapter 4 Discrete Random variables A is a variable that assumes numerical values associated with the random outcomes of an experiment, where only one numerical value is assigned to each sample point.
PROBABILITY DISTRIBUTIONS
 CHAPTER 3 PROBABILITY DISTRIBUTIONS Page Contents 3.1 Introduction to Probability Distributions 51 3.2 The Normal Distribution 56 3.3 The Binomial Distribution 60 3.4 The Poisson Distribution 64 Exercise
Central Limit Theorem (cont d) 7/28/2006
 7/28/2006") Central Limit Theorem (cont d) 7/28/2006 Central Limit Theorem for Binomial Distributions Theorem. For the binomial distribution b(n, p, j) we have lim npq b(n, p, np + x npq ) = φ(x), n where φ(x) is
Central Limit Theorem (cont d) 7/28/2006 Central Limit Theorem for Binomial Distributions Theorem. For the binomial distribution b(n, p, j) we have lim npq b(n, p, np + x npq ) = φ(x), n where φ(x) is
4: Probability. Notes: Range of possible probabilities: Probabilities can be no less than 0% and no more than 100% (of course).
.") 4: Probability What is probability? The probability of an event is its relative frequency (proportion) in the population. An event that happens half the time (such as a head showing up on the flip of a
4: Probability What is probability? The probability of an event is its relative frequency (proportion) in the population. An event that happens half the time (such as a head showing up on the flip of a
Homework: Due Wed, Feb 20 th. Chapter 8, # 60a + 62a (count together as 1), 74, 82
, 74, 82") Announcements: Week 5 quiz begins at 4pm today and ends at 3pm on Wed If you take more than 20 minutes to complete your quiz, you will only receive partial credit. (It doesn t cut you off.) Today: Sections
Announcements: Week 5 quiz begins at 4pm today and ends at 3pm on Wed If you take more than 20 minutes to complete your quiz, you will only receive partial credit. (It doesn t cut you off.) Today: Sections
+ Chapter 7. Random Variables. Chapter 7: Random Variables 2/26/2015. Transforming and Combining Random Variables
 + Chapter 7: Random Variables Section 7.1 Discrete and Continuous Random Variables The Practice of Statistics, 4 th edition For AP* STARNES, YATES, MOORE + Chapter 7 Random Variables 7.1 7.2 7.2 Discrete
Data Analysis and Statistical Methods Statistics 651
 Data Analysis and Statistical Methods Statistics 651 http://www.stat.tamu.edu/~suhasini/teaching.html Suhasini Subba Rao The binomial: mean and variance Recall that the number of successes out of n, denoted
Probability Distributions. Definitions Discrete vs. Continuous Mean and Standard Deviation TI 83/84 Calculator Binomial Distribution
 Probability Distributions Definitions Discrete vs. Continuous Mean and Standard Deviation TI 83/84 Calculator Binomial Distribution Definitions Random Variable: a variable that has a single numerical value
8.1 Estimation of the Mean and Proportion
 8.1 Estimation of the Mean and Proportion Statistical inference enables us to make judgments about a population on the basis of sample information. The mean, standard deviation, and proportions of a population
Lecture Slides. Elementary Statistics Tenth Edition. by Mario F. Triola. and the Triola Statistics Series. Slide 1
 Lecture Slides Elementary Statistics Tenth Edition and the Triola Statistics Series by Mario F. Triola Slide 1 Chapter 6 Normal Probability Distributions 6-1 Overview 6-2 The Standard Normal Distribution