1. Distinguish three missing data mechanisms:
|
|
|
- Rafe Reeves
- 5 years ago
- Views:
Transcription
1 1 DATA SCREENING I. Preliminary inspection of the raw data make sure that there are no obvious coding errors (e.g., all values for the observed variables are in the admissible range) and that all variables have been recoded appropriately if necessary (including missing values); II. Treatment of missing values 1. Distinguish three missing data mechanisms: Missing completely at random (MCAR): the distribution of missingness depends neither on the observed nor on the missing parts of the data; Missing at random (MAR): the distribution of missingness depends on the observed but not on the missing part of the data; Missing not at random (MNAR): the distribution of missingness also depends on the missing part of the data; 2. older methods (not recommended in general) a. case deletion (pairwise deletion or available case analysis, listwise deletion or complete case analysis) b. averaging the available items in multi-item scales c. single imputation (e.g., mean substitution, etc.) 3. newer methods (recommended) a. full information ML estimation: if the data are MAR, the correct observed data likelihood can be obtained by integrating out the missing data; correct standard errors can be obtained from the observed (rather than the expected) information matrix; b. Bayesian multiple imputation: each missing value is replaced by a number of imputations, and the results of these multiple imputations are combined in some fashion; 4. practical implementation: use PROC MI and PROC MIANALYZE in SAS (see the file mi.pdf) or the missing value procedures in LISREL, Mplus, etc.;
2 2 III. Outlier detection 1. graphical methods: histograms, stem-and-leaf plots, boxplots, normal probability or quantile-quantile plots, bivariate scatterplots, etc. 2. computational methods: Mahalanobis distance and variants; a. let X (N x q) be the matrix of observed variables (where N is the number of observations and q the number of variables) and S the covariance matrix of the observations, and let X contain the variable 2 means for each observation; then the diagonal values d ii of D 2, where D 2 is given by D 2 ( X X) S 1 ( X X)', contain the squared Mahalanobis distance of each observation from the centroid of the observations; if the variables are uncorrelated and the variances are the same, d reduces to the Euclidean distance; 2 ii b. Bollen (1989) suggests another measure, closely related to D 2, which can be obtained as follows; let Z (N x q) be the matrix of observed variables in deviation form and define a matrix A as: A Z( Z' Z) ' 1 Z the diagonal values aii of this matrix give the distance of the ith case from the centroid of the observations, where the distances have a range of 0 to 1; the sum of the distances across N equals q, so that q/n is the average size of aii and each aii can be compared to this average; observations with aii values much larger than the average may be considered outliers; c. more sophisticated techniques that take into account masking and swamping problems are also available (e.g., Hadi 1992, 1994); IV. Assessment of distributional assumptions (esp. normality) 1. graphical methods: histograms, stem-and-leaf plots, boxplots, probability or quantile-quantile plots, etc. 2. computational methods: statistical tests of normality, skewness and kurtosis, etc.;
3 3 a. tests of univariate normality: Shapiro-Wilk, Kolmogorov-Smirnov, etc. b. skewness: lack of symmetry of a distribution; positively skewed data have a long tail above the mean (are skewed to the right), negatively skewed data have a long tail below the mean (are skewed to the left); a normal distribution has a skewness of zero; various tests of univariate and multivariate normality based on skewness are available; c. kurtosis: distributions with positive kurtosis (leptokurtic distributions) have heavier tails and a higher peak than the normal; distributions with negative kurtosis (platykurtic distributions) have lighter tails and a lower peak than the normal; thus, distributions with excess kurtosis usually cross the normal twice on each side of the mean (see DeCarlo 1997); a normal distribution has a kurtosis of three (or zero when three has been subtracted to measure excess kurtosis); various tests of univariate and multivariate normality based on kurtosis are available; Appendix: Interpreting normal probability or quantile-quantile plots: Description of Point Pattern All but a few points fall on a line Left end of pattern is below line; right end of pattern is above line Left end of pattern is above line; right end of pattern is below line Curved pattern with slope increasing from left to right Curved pattern with slope increasing from right to left Staircase pattern (plateaus and gaps) Interpretation Outliers in data Symmetric, with long tails at both ends (positive kurtosis) Symmetric, with short tails at both ends (negative kurtosis) Data skewed to the right (positive skew) Data skewed to the left (negative skew) Data rounded or discrete Note: It is assumed that the raw data are shown on the y axis and the normal quantiles or percentiles on the x axis.
4 4 %INCLUDE 'd:\m554\programs\jitter.sas'; TITLE 'Attitude toward using coupons -- data screening'; DATA coupon; INFILE 'd:\m554\datascreening\cfa.dat'; INPUT id aa1t1 aa2t1 aa3t1 aa4t1 aa1t2 aa2t2 aa3t2 aa4t2; RUN; DATA coupont1; SET coupon(keep=id aa1t1 aa2t1 aa3t1 aa4t1); RUN; %JITTER(data=coupont1,out=coupont1,var=aa1t1 aa2t1 aa3t1 aa4t1,new=jaa1t1 jaa2t1 jaa3t1 jaa4t1); TITLE 'proc univariate for coupon data'; PROC UNIVARIATE PLOT NORMAL; VAR aa1t1 aa2t1 aa3t1 aa4t1; HISTOGRAM aa1t1 aa2t1 aa3t1 aa4t1 / NORMAL (MU=est SIGMA=est COLOR=red W=2.5 ) MIDPOINTS = 1 to 7 by 1; PROBPLOT aa1t1 aa2t1 aa3t1 aa4t1 / NORMAL (MU=est SIGMA=est COLOR=red W=2.5 ); QQPLOT aa1t1 aa2t1 aa3t1 aa4t1 / NORMAL (MU=est SIGMA=est COLOR=red W=2.5 ); RUN; PROC SGSCATTER DATA=coupont1; TITLE 'Scatterplot Matrix for original coupon data'; MATRIX aa1t1 aa2t1 aa3t1 aa4t1 / DIAGONAL=(HISTOGRAM NORMAL) ELLIPSE=(TYPE=PREDICTED); RUN; PROC SGSCATTER DATA=coupont1; TITLE 'Scatterplot Matrix for jittered coupon data'; MATRIX jaa1t1 jaa2t1 jaa3t1 jaa4t1 / DIAGONAL=(HISTOGRAM NORMAL) ELLIPSE=(TYPE=PREDICTED); RUN; /* proc sgplot data=coupont1; title 'jittered scatterplot'; scatter x=aa1t1 y=aa2t1 / jitter; ellipse x=aa1t1 y=aa2t1; run; */ QUIT;
5 5 The UNIVARIATE Procedure Variable: aa1t1 Moments N 250 Sum Weights 250 Mean Sum Observations 1128 Std Deviation Variance Skewness Kurtosis Uncorrected SS 5552 Corrected SS Coeff Variation Std Error Mean Basic Statistical Measures Location Variability Mean Std Deviation Median Variance Mode Range Interquartile Range Tests for Location: Mu0=0 Test -Statistic p Value Student's t t Pr > t <.0001 Sign M 125 Pr >= M <.0001 Signed Rank S Pr >= S <.0001 Tests for Normality Test --Statistic p Value Shapiro-Wilk W Pr < W < Kolmogorov-Smirnov D Pr > D < Cramer-von Mises W-Sq Pr > W-Sq < Anderson-Darling A-Sq Pr > A-Sq < Quantiles (Definition 5) Quantile Estimate 100% Max 7 99% 7 95% 7 90% 6 75% Q3 5 50% Median 5 25% Q1 4 10% 3 5% 2 1% 1 0% Min 1
6 Histogram # Boxplot Normal Probability Plot 7.25+******* ******** * ************************ 48 **********. +++.********************************* ******** ************************************* ********** ************* 26 ***** ******** 16 0 ****** *** *+**** * may represent up to 2 counts Fitted Distribution for aa1t1 Parameters for Normal Distribution Parameter Symbol Estimate Mean Mu Std Dev Sigma Goodness-of-Fit Tests for Normal Distribution Test ---Statistic p Value----- Kolmogorov-Smirnov D Pr > D <0.010 Cramer-von Mises W-Sq Pr > W-Sq <0.005 Anderson-Darling A-Sq Pr > A-Sq <0.005 Quantiles for Normal Distribution Quantile Percent Observed Estimated
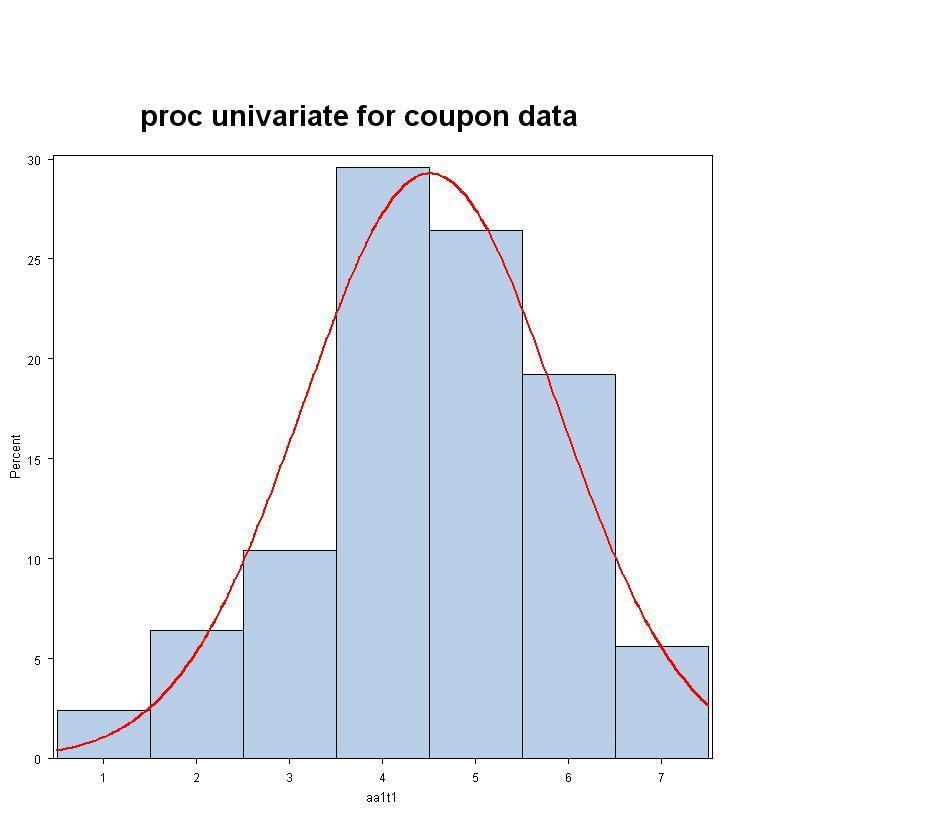
7 Histogram: 7
8 Normal probability and quantile-quantile plots (raw data): 8

9 9 Scatterplot matrix for original data: Scatterplot matrix for data with jitter:
10 10 %include 'd:\m554\programs\outlier.sas'; %include 'd:\m554\programs\label.sas'; %include 'd:\m554\programs\cqplot.sas'; %let devtyp=screen; /* To clear the Results window every time you execute your program, use the statement: */ dm "odsresults; clear;"; /* To clear the Log and Output windows as well, use the following statement: */ dm "log; clear; output; clear; odsresults; clear;"; /* to clear the Results Viewer window */ ods html close; /* close previous */ ods html; /* open new */ /* To clear the graph window, use the following statements: */ proc greplay nofs; igout gseg; delete _all_; run;quit; TITLE 'Attitude toward using coupons -- data screening'; DATA coupon; INFILE 'd:\m554\datascreening\cfa.dat' PAD; INPUT id aa1t1 aa2t1 aa3t1 aa4t1 aa1t2 aa2t2 aa3t2 aa4t2; DATA coupont1; SET coupon(keep=id aa1t1 aa2t1 aa3t1 aa4t1); title 'Multivariate outlier detection - 5 passes'; %outlier(data=coupont1, var=aa1t1 aa2t1 aa3t1 aa4t1, id=id, pvalue=.0002, passes=5); run; quit;
11 11 Observations trimmed in calculating Mahalanobis distance _pass_ id _case_ dsq prob E E E E E E
12 12
Topic 8: Model Diagnostics
 Topic 8: Model Diagnostics Outline Diagnostics to check model assumptions Diagnostics concerning X Diagnostics using the residuals Diagnostics and remedial measures Diagnostics: look at the data to diagnose
Notice that X2 and Y2 are skewed. Taking the SQRT of Y2 reduces the skewness greatly.
 Notice that X2 and Y2 are skewed. Taking the SQRT of Y2 reduces the skewness greatly. The MEANS Procedure Variable Mean Std Dev Minimum Maximum Skewness ƒƒƒƒƒƒƒƒƒƒƒƒƒƒƒƒƒƒƒƒƒƒƒƒƒƒƒƒƒƒƒƒƒƒƒƒƒƒƒƒƒƒƒƒƒƒƒƒƒƒƒƒƒƒƒƒƒƒƒƒƒƒƒƒƒƒƒƒƒƒƒƒƒƒƒƒƒƒƒƒƒƒƒƒƒƒƒƒ
Chapter 11 : Model checking and refinement An example: Blood-brain barrier study on rats
 EXST3201 Chapter 11b Geaghan Fall 2005: Page 1 Chapter 11 : Model checking and refinement An example: Blood-brain barrier study on rats This study investigates the permeability of the blood-brain barrier
SAS Simple Linear Regression Example
 SAS Simple Linear Regression Example This handout gives examples of how to use SAS to generate a simple linear regression plot, check the correlation between two variables, fit a simple linear regression
Empirical Rule (P148)
") Interpreting the Standard Deviation Numerical Descriptive Measures for Quantitative data III Dr. Tom Ilvento FREC 408 We can use the standard deviation to express the proportion of cases that might fall
Interpreting the Standard Deviation Numerical Descriptive Measures for Quantitative data III Dr. Tom Ilvento FREC 408 We can use the standard deviation to express the proportion of cases that might fall
GGraph. Males Only. Premium. Experience. GGraph. Gender. 1 0: R 2 Linear = : R 2 Linear = Page 1
 GGraph 9 Gender : R Linear =.43 : R Linear =.769 8 7 6 5 4 3 5 5 Males Only GGraph Page R Linear =.43 R Loess 9 8 7 6 5 4 5 5 Explore Case Processing Summary Cases Valid Missing Total N Percent N Percent
Table of Contents. New to the Second Edition... Chapter 1: Introduction : Social Research...
 iii Table of Contents Preface... xiii Purpose... xiii Outline of Chapters... xiv New to the Second Edition... xvii Acknowledgements... xviii Chapter 1: Introduction... 1 1.1: Social Research... 1 Introduction...
Overview/Outline. Moving beyond raw data. PSY 464 Advanced Experimental Design. Describing and Exploring Data The Normal Distribution
 PSY 464 Advanced Experimental Design Describing and Exploring Data The Normal Distribution 1 Overview/Outline Questions-problems? Exploring/Describing data Organizing/summarizing data Graphical presentations
Terms & Characteristics
 NORMAL CURVE Knowledge that a variable is distributed normally can be helpful in drawing inferences as to how frequently certain observations are likely to occur. NORMAL CURVE A Normal distribution: Distribution
Chapter 3. Populations and Statistics. 3.1 Statistical populations
 Chapter 3 Populations and Statistics This chapter covers two topics that are fundamental in statistics. The first is the concept of a statistical population, which is the basic unit on which statistics
Introduction to Statistical Data Analysis II
 Introduction to Statistical Data Analysis II JULY 2011 Afsaneh Yazdani Preface Major branches of Statistics: - Descriptive Statistics - Inferential Statistics Preface What is Inferential Statistics? Preface
2018 AAPM: Normal and non normal distributions: Why understanding distributions are important when designing experiments and analyzing data
 Statistical Failings that Keep Us All in the Dark Normal and non normal distributions: Why understanding distributions are important when designing experiments and Conflict of Interest Disclosure I have
Descriptive Analysis
 Descriptive Analysis HERTANTO WAHYU SUBAGIO Univariate Analysis Univariate analysis involves the examination across cases of one variable at a time. There are three major characteristics of a single variable
Lecture Week 4 Inspecting Data: Distributions
 Lecture Week 4 Inspecting Data: Distributions Introduction to Research Methods & Statistics 2013 2014 Hemmo Smit So next week No lecture & workgroups But Practice Test on-line (BB) Enter data for your
Basic Procedure for Histograms
 Basic Procedure for Histograms 1. Compute the range of observations (min. & max. value) 2. Choose an initial # of classes (most likely based on the range of values, try and find a number of classes that
Review: Chebyshev s Rule. Measures of Dispersion II. Review: Empirical Rule. Review: Empirical Rule. Auto Batteries Example, p 59.
 Review: Chebyshev s Rule Measures of Dispersion II Tom Ilvento STAT 200 Is based on a mathematical theorem for any data At least ¾ of the measurements will fall within ± 2 standard deviations from the
Frequency Distribution and Summary Statistics
 Frequency Distribution and Summary Statistics Dongmei Li Department of Public Health Sciences Office of Public Health Studies University of Hawai i at Mānoa Outline 1. Stemplot 2. Frequency table 3. Summary
Dot Plot: A graph for displaying a set of data. Each numerical value is represented by a dot placed above a horizontal number line.
 Introduction We continue our study of descriptive statistics with measures of dispersion, such as dot plots, stem and leaf displays, quartiles, percentiles, and box plots. Dot plots, a stem-and-leaf display,
Data Distributions and Normality
 Data Distributions and Normality Definition (Non)Parametric Parametric statistics assume that data come from a normal distribution, and make inferences about parameters of that distribution. These statistical
AP STATISTICS FALL SEMESTSER FINAL EXAM STUDY GUIDE
 AP STATISTICS Name: FALL SEMESTSER FINAL EXAM STUDY GUIDE Period: *Go over Vocabulary Notecards! *This is not a comprehensive review you still should look over your past notes, homework/practice, Quizzes,
Some estimates of the height of the podium
 Some estimates of the height of the podium 24 36 40 40 40 41 42 44 46 48 50 53 65 98 1 5 number summary Inter quartile range (IQR) range = max min 2 1.5 IQR outlier rule 3 make a boxplot 24 36 40 40 40
Exploring Data and Graphics
 Exploring Data and Graphics Rick White Department of Statistics, UBC Graduate Pathways to Success Graduate & Postdoctoral Studies November 13, 2013 Outline Summarizing Data Types of Data Visualizing Data
1 Exercise One. 1.1 Calculate the mean ROI. Note that the data is not grouped! Below you find the raw data in tabular form:
 1 Exercise One Note that the data is not grouped! 1.1 Calculate the mean ROI Below you find the raw data in tabular form: Obs Data 1 18.5 2 18.6 3 17.4 4 12.2 5 19.7 6 5.6 7 7.7 8 9.8 9 19.9 10 9.9 11
Valid Missing Total. N Percent N Percent N Percent , ,0% 0,0% 2 100,0% 1, ,0% 0,0% 2 100,0% 2, ,0% 0,0% 5 100,0%
 dimension1 GET FILE= validacaonestscoremédico.sav' (só com os 59 doentes) /COMPRESSED. SORT CASES BY UMcpEVA (D). EXAMINE VARIABLES=UMcpEVA BY NoRespostasSignif /PLOT BOXPLOT HISTOGRAM NPPLOT /COMPARE
How To: Perform a Process Capability Analysis Using STATGRAPHICS Centurion
 How To: Perform a Process Capability Analysis Using STATGRAPHICS Centurion by Dr. Neil W. Polhemus July 17, 2005 Introduction For individuals concerned with the quality of the goods and services that they
Data screening, transformations: MRC05
 Dale Berger Data screening, transformations: MRC05 This is a demonstration of data screening and transformations for a regression analysis. Our interest is in predicting current salary from education level
The SAS System 11:03 Monday, November 11,
 The SAS System 11:3 Monday, November 11, 213 1 The CONTENTS Procedure Data Set Name BIO.AUTO_PREMIUMS Observations 5 Member Type DATA Variables 3 Engine V9 Indexes Created Monday, November 11, 213 11:4:19
DATA SUMMARIZATION AND VISUALIZATION
 APPENDIX DATA SUMMARIZATION AND VISUALIZATION PART 1 SUMMARIZATION 1: BUILDING BLOCKS OF DATA ANALYSIS 294 PART 2 PART 3 PART 4 VISUALIZATION: GRAPHS AND TABLES FOR SUMMARIZING AND ORGANIZING DATA 296
Lecture 6: Non Normal Distributions
 Lecture 6: Non Normal Distributions and their Uses in GARCH Modelling Prof. Massimo Guidolin 20192 Financial Econometrics Spring 2015 Overview Non-normalities in (standardized) residuals from asset return
Stat 101 Exam 1 - Embers Important Formulas and Concepts 1
 1 Chapter 1 1.1 Definitions Stat 101 Exam 1 - Embers Important Formulas and Concepts 1 1. Data Any collection of numbers, characters, images, or other items that provide information about something. 2.
NCSS Statistical Software. Reference Intervals
 Chapter 586 Introduction A reference interval contains the middle 95% of measurements of a substance from a healthy population. It is a type of prediction interval. This procedure calculates one-, and
2 Exploring Univariate Data
 2 Exploring Univariate Data A good picture is worth more than a thousand words! Having the data collected we examine them to get a feel for they main messages and any surprising features, before attempting
Math 2311 Bekki George Office Hours: MW 11am to 12:45pm in 639 PGH Online Thursdays 4-5:30pm And by appointment
 Math 2311 Bekki George bekki@math.uh.edu Office Hours: MW 11am to 12:45pm in 639 PGH Online Thursdays 4-5:30pm And by appointment Class webpage: http://www.math.uh.edu/~bekki/math2311.html Math 2311 Class
Introduction to Computational Finance and Financial Econometrics Descriptive Statistics
 You can t see this text! Introduction to Computational Finance and Financial Econometrics Descriptive Statistics Eric Zivot Summer 2015 Eric Zivot (Copyright 2015) Descriptive Statistics 1 / 28 Outline
Handout 4 numerical descriptive measures part 2. Example 1. Variance and Standard Deviation for Grouped Data. mf N 535 = = 25
 Handout 4 numerical descriptive measures part Calculating Mean for Grouped Data mf Mean for population data: µ mf Mean for sample data: x n where m is the midpoint and f is the frequency of a class. Example
Summary of Statistical Analysis Tools EDAD 5630
 Summary of Statistical Analysis Tools EDAD 5630 Test Name Program Used Purpose Steps Main Uses/Applications in Schools Principal Component Analysis SPSS Measure Underlying Constructs Reliability SPSS Measure
CHAPTER 6. ' From the table the z value corresponding to this value Z = 1.96 or Z = 1.96 (d) P(Z >?) =
 P(Z >?) =") Solutions to End-of-Section and Chapter Review Problems 225 CHAPTER 6 6.1 (a) P(Z < 1.20) = 0.88493 P(Z > 1.25) = 1 0.89435 = 0.10565 P(1.25 < Z < 1.70) = 0.95543 0.89435 = 0.06108 (d) P(Z < 1.25) or Z
Solutions to End-of-Section and Chapter Review Problems 225 CHAPTER 6 6.1 (a) P(Z < 1.20) = 0.88493 P(Z > 1.25) = 1 0.89435 = 0.10565 P(1.25 < Z < 1.70) = 0.95543 0.89435 = 0.06108 (d) P(Z < 1.25) or Z
appstats5.notebook September 07, 2016 Chapter 5
 Chapter 5 Describing Distributions Numerically Chapter 5 Objective: Students will be able to use statistics appropriate to the shape of the data distribution to compare of two or more different data sets.
SOLUTIONS TO THE LAB 1 ASSIGNMENT
 SOLUTIONS TO THE LAB 1 ASSIGNMENT Question 1 Excel produces the following histogram of pull strengths for the 100 resistors: 2 20 Histogram of Pull Strengths (lb) Frequency 1 10 0 9 61 63 6 67 69 71 73
Week 1 Variables: Exploration, Familiarisation and Description. Descriptive Statistics.
 Week 1 Variables: Exploration, Familiarisation and Description. Descriptive Statistics. Convergent validity: the degree to which results/evidence from different tests/sources, converge on the same conclusion.
1 Describing Distributions with numbers
 1 Describing Distributions with numbers Only for quantitative variables!! 1.1 Describing the center of a data set The mean of a set of numerical observation is the familiar arithmetic average. To write
Lecture 1: Empirical Properties of Returns
 Lecture 1: Empirical Properties of Returns Econ 589 Eric Zivot Spring 2011 Updated: March 29, 2011 Daily CC Returns on MSFT -0.3 r(t) -0.2-0.1 0.1 1986 1987 1988 1989 1990 1991 1992 1993 1994 1995 1996
Descriptive Statistics Bios 662
 Descriptive Statistics Bios 662 Michael G. Hudgens, Ph.D. mhudgens@bios.unc.edu http://www.bios.unc.edu/ mhudgens 2008-08-19 08:51 BIOS 662 1 Descriptive Statistics Descriptive Statistics Types of variables
Chapter 3. Numerical Descriptive Measures. Copyright 2016 Pearson Education, Ltd. Chapter 3, Slide 1
 Chapter 3 Numerical Descriptive Measures Copyright 2016 Pearson Education, Ltd. Chapter 3, Slide 1 Objectives In this chapter, you learn to: Describe the properties of central tendency, variation, and
Fundamentals of Statistics
 CHAPTER 4 Fundamentals of Statistics Expected Outcomes Know the difference between a variable and an attribute. Perform mathematical calculations to the correct number of significant figures. Construct
Some Characteristics of Data
 Some Characteristics of Data Not all data is the same, and depending on some characteristics of a particular dataset, there are some limitations as to what can and cannot be done with that data. Some key
STAT 113 Variability
 STAT 113 Variability Colin Reimer Dawson Oberlin College September 14, 2017 1 / 48 Outline Last Time: Shape and Center Variability Boxplots and the IQR Variance and Standard Deviaton Transformations 2
An Insight Into Heavy-Tailed Distribution
 An Insight Into Heavy-Tailed Distribution Annapurna Ravi Ferry Butar Butar ABSTRACT The heavy-tailed distribution provides a much better fit to financial data than the normal distribution. Modeling heavy-tailed
David Tenenbaum GEOG 090 UNC-CH Spring 2005
 Simple Descriptive Statistics Review and Examples You will likely make use of all three measures of central tendency (mode, median, and mean), as well as some key measures of dispersion (standard deviation,
9/17/2015. Basic Statistics for the Healthcare Professional. Relax.it won t be that bad! Purpose of Statistic. Objectives
 Basic Statistics for the Healthcare Professional 1 F R A N K C O H E N, M B B, M P A D I R E C T O R O F A N A L Y T I C S D O C T O R S M A N A G E M E N T, LLC Purpose of Statistic 2 Provide a numerical
Financial Time Series and Their Characteristics
 Financial Time Series and Their Characteristics Egon Zakrajšek Division of Monetary Affairs Federal Reserve Board Summer School in Financial Mathematics Faculty of Mathematics & Physics University of Ljubljana
Establishing a framework for statistical analysis via the Generalized Linear Model
 PSY349: Lecture 1: INTRO & CORRELATION Establishing a framework for statistical analysis via the Generalized Linear Model GLM provides a unified framework that incorporates a number of statistical methods
Analysis of 2x2 Cross-Over Designs using T-Tests for Non-Inferiority
 Chapter 235 Analysis of 2x2 Cross-Over Designs using -ests for Non-Inferiority Introduction his procedure analyzes data from a two-treatment, two-period (2x2) cross-over design where the goal is to demonstrate
Getting to know data. Play with data get to know it. Image source: Descriptives & Graphing
 Descriptives & Graphing Getting to know data (how to approach data) Lecture 3 Image source: http://commons.wikimedia.org/wiki/file:3d_bar_graph_meeting.jpg Survey Research & Design in Psychology James
Homework 0 Key (not to be handed in) due? Jan. 10
 due? Jan. 10") Homework 0 Key (not to be handed in) due? Jan. 10 The results of running diamond.sas is listed below: Note: I did slightly reduce the size of some of the graphs so that they would fit on the page. The
Homework 0 Key (not to be handed in) due? Jan. 10 The results of running diamond.sas is listed below: Note: I did slightly reduce the size of some of the graphs so that they would fit on the page. The
Simple Descriptive Statistics
 Simple Descriptive Statistics These are ways to summarize a data set quickly and accurately The most common way of describing a variable distribution is in terms of two of its properties: Central tendency
Descriptive Statistics
 Petra Petrovics Descriptive Statistics 2 nd seminar DESCRIPTIVE STATISTICS Definition: Descriptive statistics is concerned only with collecting and describing data Methods: - statistical tables and graphs
Lectures delivered by Prof.K.K.Achary, YRC
 Lectures delivered by Prof.K.K.Achary, YRC Given a data set, we say that it is symmetric about a central value if the observations are distributed symmetrically about the central value. In symmetrically
Measures of Center. Mean. 1. Mean 2. Median 3. Mode 4. Midrange (rarely used) Measure of Center. Notation. Mean
 Measure of Center. Notation. Mean") Measure of Center Measures of Center The value at the center or middle of a data set 1. Mean 2. Median 3. Mode 4. Midrange (rarely used) 1 2 Mean Notation The measure of center obtained by adding the values
Measure of Center Measures of Center The value at the center or middle of a data set 1. Mean 2. Median 3. Mode 4. Midrange (rarely used) 1 2 Mean Notation The measure of center obtained by adding the values
Chapter 6 Part 3 October 21, Bootstrapping
 Chapter 6 Part 3 October 21, 2008 Bootstrapping From the internet: The bootstrap involves repeated re-estimation of a parameter using random samples with replacement from the original data. Because the
Lecture 1: Review and Exploratory Data Analysis (EDA)
") Lecture 1: Review and Exploratory Data Analysis (EDA) Ani Manichaikul amanicha@jhsph.edu 16 April 2007 1 / 40 Course Information I Office hours For questions and help When? I ll announce this tomorrow
Lecture 1: Review and Exploratory Data Analysis (EDA) Ani Manichaikul amanicha@jhsph.edu 16 April 2007 1 / 40 Course Information I Office hours For questions and help When? I ll announce this tomorrow
Introduction to R (2)
") Introduction to R (2) Boxplots Boxplots are highly efficient tools for the representation of the data distributions. The five number summary can be located in boxplots. Additionally, we can distinguish
Introduction to R (2) Boxplots Boxplots are highly efficient tools for the representation of the data distributions. The five number summary can be located in boxplots. Additionally, we can distinguish
Getting to know a data-set (how to approach data) Overview: Descriptives & Graphing
 Overview: Descriptives & Graphing") Overview: Descriptives & Graphing 1. Getting to know a data set 2. LOM & types of statistics 3. Descriptive statistics 4. Normal distribution 5. Non-normal distributions 6. Effect of skew on central tendency
Overview: Descriptives & Graphing 1. Getting to know a data set 2. LOM & types of statistics 3. Descriptive statistics 4. Normal distribution 5. Non-normal distributions 6. Effect of skew on central tendency
Chapter 6 Simple Correlation and
 Contents Chapter 1 Introduction to Statistics Meaning of Statistics... 1 Definition of Statistics... 2 Importance and Scope of Statistics... 2 Application of Statistics... 3 Characteristics of Statistics...
STATISTICAL DISTRIBUTIONS AND THE CALCULATOR
 STATISTICAL DISTRIBUTIONS AND THE CALCULATOR 1. Basic data sets a. Measures of Center - Mean ( ): average of all values. Characteristic: non-resistant is affected by skew and outliers. - Median: Either
Financial Econometrics (FinMetrics04) Time-series Statistics Concepts Exploratory Data Analysis Testing for Normality Empirical VaR
 Time-series Statistics Concepts Exploratory Data Analysis Testing for Normality Empirical VaR") Financial Econometrics (FinMetrics04) Time-series Statistics Concepts Exploratory Data Analysis Testing for Normality Empirical VaR Nelson Mark University of Notre Dame Fall 2017 September 11, 2017 Introduction
Financial Econometrics (FinMetrics04) Time-series Statistics Concepts Exploratory Data Analysis Testing for Normality Empirical VaR Nelson Mark University of Notre Dame Fall 2017 September 11, 2017 Introduction
Midterm Exam. b. What are the continuously compounded returns for the two stocks?
 University of Washington Fall 004 Department of Economics Eric Zivot Economics 483 Midterm Exam This is a closed book and closed note exam. However, you are allowed one page of notes (double-sided). Answer
Subject CS1 Actuarial Statistics 1 Core Principles. Syllabus. for the 2019 exams. 1 June 2018
 ` Subject CS1 Actuarial Statistics 1 Core Principles Syllabus for the 2019 exams 1 June 2018 Copyright in this Core Reading is the property of the Institute and Faculty of Actuaries who are the sole distributors.
Steps with data (how to approach data)
") Descriptives & Graphing Lecture 3 Survey Research & Design in Psychology James Neill, 216 Creative Commons Attribution 4. Overview: Descriptives & Graphing 1. Steps with data 2. Level of measurement &
Descriptives & Graphing Lecture 3 Survey Research & Design in Psychology James Neill, 216 Creative Commons Attribution 4. Overview: Descriptives & Graphing 1. Steps with data 2. Level of measurement &
Chapter 3. Descriptive Measures. Copyright 2016, 2012, 2008 Pearson Education, Inc. Chapter 3, Slide 1
 Chapter 3 Descriptive Measures Copyright 2016, 2012, 2008 Pearson Education, Inc. Chapter 3, Slide 1 Chapter 3 Descriptive Measures Mean, Median and Mode Copyright 2016, 2012, 2008 Pearson Education, Inc.
Frequency Distribution Models 1- Probability Density Function (PDF)
") Models 1- Probability Density Function (PDF) What is a PDF model? A mathematical equation that describes the frequency curve or probability distribution of a data set. Why modeling? It represents and summarizes
Models 1- Probability Density Function (PDF) What is a PDF model? A mathematical equation that describes the frequency curve or probability distribution of a data set. Why modeling? It represents and summarizes
Module Tag PSY_P2_M 7. PAPER No.2: QUANTITATIVE METHODS MODULE No.7: NORMAL DISTRIBUTION
 Subject Paper No and Title Module No and Title Paper No.2: QUANTITATIVE METHODS Module No.7: NORMAL DISTRIBUTION Module Tag PSY_P2_M 7 TABLE OF CONTENTS 1. Learning Outcomes 2. Introduction 3. Properties
Financial Econometrics Jeffrey R. Russell Midterm 2014
 Name: Financial Econometrics Jeffrey R. Russell Midterm 2014 You have 2 hours to complete the exam. Use can use a calculator and one side of an 8.5x11 cheat sheet. Try to fit all your work in the space
Quantile regression and surroundings using SAS
 Appendix B Quantile regression and surroundings using SAS Introduction This appendix is devoted to the presentation of the main commands available in SAS for carrying out a complete data analysis, that
Descriptive Statistics
 Chapter 3 Descriptive Statistics Chapter 2 presented graphical techniques for organizing and displaying data. Even though such graphical techniques allow the researcher to make some general observations
A New Hybrid Estimation Method for the Generalized Pareto Distribution
 A New Hybrid Estimation Method for the Generalized Pareto Distribution Chunlin Wang Department of Mathematics and Statistics University of Calgary May 18, 2011 A New Hybrid Estimation Method for the GPD
Lecture 2 Describing Data
 Lecture 2 Describing Data Thais Paiva STA 111 - Summer 2013 Term II July 2, 2013 Lecture Plan 1 Types of data 2 Describing the data with plots 3 Summary statistics for central tendency and spread 4 Histograms
Gamma Distribution Fitting
 Chapter 552 Gamma Distribution Fitting Introduction This module fits the gamma probability distributions to a complete or censored set of individual or grouped data values. It outputs various statistics
Epidemiology Principle of Biostatistics Chapter 7: Sampling Distributions (continued) John Koval
 John Koval") Principle of Biostatistics Chapter 7: Sampling Distributions (continued) John Koval Department of Epidemiology and Biostatistics University of Western Ontario Next want to look at histogram of sample statistics
Principle of Biostatistics Chapter 7: Sampling Distributions (continued) John Koval Department of Epidemiology and Biostatistics University of Western Ontario Next want to look at histogram of sample statistics
Description of Data I
 Description of Data I (Summary and Variability measures) Objectives: Able to understand how to summarize the data Able to understand how to measure the variability of the data Able to use and interpret
Subject Index. average and range method GAGE application, 1818 gage studies, 1809, 1825 average and standard deviation charts
 Subject Index A A-optimal designs See optimal designs, optimality criteria aberration of a design See minimum aberration acceptance probability double-sampling plan, 1853 1854 PROBACC2 function, 1853 Type
Standardized Data Percentiles, Quartiles and Box Plots Grouped Data Skewness and Kurtosis
 Descriptive Statistics (Part 2) 4 Chapter Percentiles, Quartiles and Box Plots Grouped Data Skewness and Kurtosis McGraw-Hill/Irwin Copyright 2009 by The McGraw-Hill Companies, Inc. Chebyshev s Theorem
We will use an example which will result in a paired t test regarding the labor force participation rate for women in the 60 s and 70 s.
 Now let s review methods for one quantitative variable. We will use an example which will result in a paired t test regarding the labor force participation rate for women in the 60 s and 70 s. 17 The labor
the display, exploration and transformation of the data are demonstrated and biases typically encountered are highlighted.
 1 Insurance data Generalized linear modeling is a methodology for modeling relationships between variables. It generalizes the classical normal linear model, by relaxing some of its restrictive assumptions,
Models of Patterns. Lecture 3, SMMD 2005 Bob Stine
 Models of Patterns Lecture 3, SMMD 2005 Bob Stine Review Speculative investing and portfolios Risk and variance Volatility adjusted return Volatility drag Dependence Covariance Review Example Stock and
Two-Sample T-Test for Superiority by a Margin
 Chapter 219 Two-Sample T-Test for Superiority by a Margin Introduction This procedure provides reports for making inference about the superiority of a treatment mean compared to a control mean from data
Economics 483. Midterm Exam. 1. Consider the following monthly data for Microsoft stock over the period December 1995 through December 1996:
 University of Washington Summer Department of Economics Eric Zivot Economics 3 Midterm Exam This is a closed book and closed note exam. However, you are allowed one page of handwritten notes. Answer all
Examples of continuous probability distributions: The normal and standard normal
 Examples of continuous probability distributions: The normal and standard normal The Normal Distribution f(x) Changing μ shifts the distribution left or right. Changing σ increases or decreases the spread.
Probability & Statistics Modular Learning Exercises
 Probability & Statistics Modular Learning Exercises About The Actuarial Foundation The Actuarial Foundation, a 501(c)(3) nonprofit organization, develops, funds and executes education, scholarship and
Introduction to Descriptive Statistics
 Introduction to Descriptive Statistics 17.871 Types of Variables ~Nominal (Quantitative) Nominal (Qualitative) categorical Ordinal Interval or ratio Describing data Moment Non-mean based measure Center
Section3-2: Measures of Center
 Chapter 3 Section3-: Measures of Center Notation Suppose we are making a series of observations, n of them, to be exact. Then we write x 1, x, x 3,K, x n as the values we observe. Thus n is the total number
Two-Sample T-Test for Non-Inferiority
 Chapter 198 Two-Sample T-Test for Non-Inferiority Introduction This procedure provides reports for making inference about the non-inferiority of a treatment mean compared to a control mean from data taken
Variance, Standard Deviation Counting Techniques
 Variance, Standard Deviation Counting Techniques Section 1.3 & 2.1 Cathy Poliak, Ph.D. cathy@math.uh.edu Department of Mathematics University of Houston 1 / 52 Outline 1 Quartiles 2 The 1.5IQR Rule 3 Understanding
Data Analysis and Statistical Methods Statistics 651
 Data Analysis and Statistical Methods Statistics 651 http://www.stat.tamu.edu/~suhasini/teaching.html Lecture 10 (MWF) Checking for normality of the data using the QQplot Suhasini Subba Rao Review of previous
Data Analysis and Statistical Methods Statistics 651
 Data Analysis and Statistical Methods Statistics 651 http://www.stat.tamu.edu/~suhasini/teaching.html Lecture 10 (MWF) Checking for normality of the data using the QQplot Suhasini Subba Rao Checking for
Biostatistics and Design of Experiments Prof. Mukesh Doble Department of Biotechnology Indian Institute of Technology, Madras
 Biostatistics and Design of Experiments Prof. Mukesh Doble Department of Biotechnology Indian Institute of Technology, Madras Lecture - 05 Normal Distribution So far we have looked at discrete distributions
Loss Simulation Model Testing and Enhancement
 Loss Simulation Model Testing and Enhancement Casualty Loss Reserve Seminar By Kailan Shang Sept. 2011 Agenda Research Overview Model Testing Real Data Model Enhancement Further Development Enterprise
Measures of Central Tendency Lecture 5 22 February 2006 R. Ryznar
 Measures of Central Tendency 11.220 Lecture 5 22 February 2006 R. Ryznar Today s Content Wrap-up from yesterday Frequency Distributions The Mean, Median and Mode Levels of Measurement and Measures of Central
Computing Statistics ID1050 Quantitative & Qualitative Reasoning
 Computing Statistics ID1050 Quantitative & Qualitative Reasoning Single-variable Statistics We will be considering six statistics of a data set Three measures of the middle Mean, median, and mode Two measures
Categorical. A general name for non-numerical data; the data is separated into categories of some kind.
 Chapter 5 Categorical A general name for non-numerical data; the data is separated into categories of some kind. Nominal data Categorical data with no implied order. Eg. Eye colours, favourite TV show,