Fundamentals of Statistics
|
|
|
- Howard Jenkins
- 5 years ago
- Views:
Transcription

1 CHAPTER 4 Fundamentals of Statistics Expected Outcomes Know the difference between a variable and an attribute. Perform mathematical calculations to the correct number of significant figures. Construct histograms for simple and complex data. Calculate and effectively use the different measures of central tendency, dispersion, and how related
2 Definition of Statistics: Introduction 1. A collection of quantitative data pertaining to to a subject or group. Examples are blood pressure statistics etc. 2. The science that deals with the collection, tabulation, analysis, interpretation, and presentation of quantitative data 2
3 Types of Data: Attribute: Collection of Data Discrete data. Data values can only be integers. Counted data or attribute data. Examples include: How many of the products are defective? How often are the machines repaired? How many people are absent each day? 3


4 Precision Precision description of a level of measurement that yields consistent results when repeated. It is associated with the concept of "random error", a form of observational error that leads to measurable values being inconsistent when repeated. 4


 results. 5")
5 Accuracy Accuracy The more common definition is that accuracy is a level of measurement with no inherent limitation The ISO definition is that accuracy is a level of measurement that yields true (no systematic errors) and consistent (no random errors) results. 5
6 Describing Data Frequency Distribution: Three types--categorical, Ungrouped, & Grouped Categorical frequency distributions Data that can be placed in specific categories, such as nominal- or ordinal-level data. 6
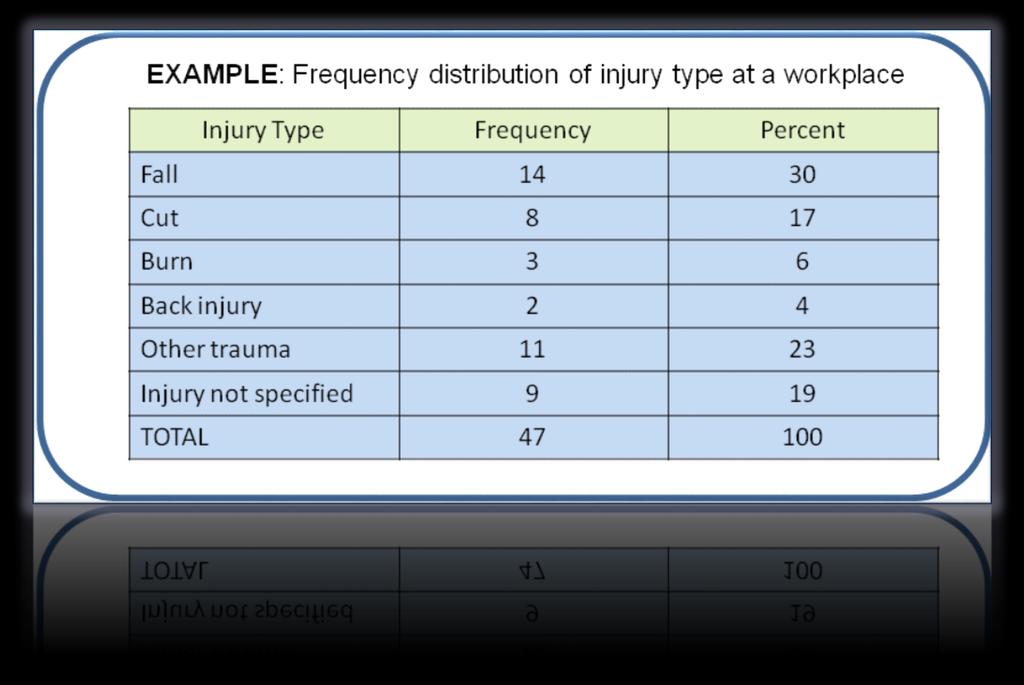
7 Categorical 7
8 Ungrouped Ungrouped frequency distributions Ungrouped frequency distributions - can be used for data that can be enumerated and when the range of values in the data set is not large. 8

9 Grouped Grouped frequency distributions Can be used when the range of values in the data set is very large. The data must be grouped into classes that are more than one unit in width. 9
10 Frequency Distributions Number non conforming Frequency Relative Frequency Cumulative Frequency Relative Frequency 10


11 Frequency Frequency Histogram Number Nonconforming 11
12 The Histogram The histogram is the most important graphical tool for exploring the shape of data distributions. 12
13 Constructing a Histogram Step 1: Find range of distribution, largest - smallest values Step 2: Choose number of classes, 5 to 20 Step 3: Determine width of classes, one decimal place more than the data, class width = range/number of classes #classes n Step 4: Determine class boundaries Step 5: Draw frequency histogram 13
14 Constructing a Histogram Number of groups or cells If no. of observations < to 9 cells Between to 17 cells Greater than to 20 cells 14
15 Other Types of Frequency Distribution Graphs Bar Graph Polygon of Data Cumulative Frequency Distribution or Ogive 15


16 Bar Graph and Polygon of Data 16


17 Cumulative Frequency 17
18 Characteristics of Frequency Distribution Graphs
19 Analysis of Histograms Figure 4-7 Differences due to location, spread, and shape 19
20 Measures of Central Tendency The three measures in common use are the: Average Median Mode 20
21 Average There are three different techniques available for calculating the average three measures in common use are the: Ungrouped data Grouped data Weighted average 21
22 Average-Ungrouped Data X n X i i1 n 22
23 Average-Grouped Data X h fx i i i1 n f X f X... f X f f... f 1 2 h h h h = number of cells Xi=midpoint fi=frequency 23
24 Average-Weighted Average Used when a number of averages are combined with different frequencies X w n i1 n wx i i i1 w i 24
25 Median-Grouped Data n m cf M 2 d Lm i f m Lm=lower boundary of the cell with the median N=total number of observations Cfm=cumulative frequency of all cells below m Fm=frequency of median cell i=cell interval 25
26 Mode The Mode is the value that occurs with the greatest frequency. It is possible to have no modes in a series or numbers or to have more than one mode. 26
27 Relationship Among the Measures of Central Tendency Figure 5-9 Relationship among average, median and mode 27
28 Measures of Dispersion Range Standard Deviation Variance 28
29 Measures of Dispersion-Range The range is the simplest and easiest to calculate of the measures of dispersion. Range = R = Xh - Xl Largest value - Smallest value in data set 29
30 30 Sample Standard Deviation: 2 1 ( ) 1 n i Xi X S n / 1 n n i i Xi Xi n S n Measures of Dispersion-Standard Deviation
31 Standard Deviation Ungrouped Technique S n 2 n 2 n Xi ( Xi ) i1 i1 nn ( 1) 31
32 Standard Deviation Grouped Technique s h i1 h 2 2 i i i i i1 n ( f X ) ( f X ) nn ( 1) 32
33 Relationship Between the Measures of Dispersion As n increases, accuracy of R decreases Use R when there is small amount of data or data is too scattered If n> 10 use standard deviation A smaller standard deviation means better quality 33
34 Other Measures There are three other measures that are frequently used to analyze a collection of data: Skewness Kurtosis Coefficient of Variation 34
35 Skewness Skewness is the lack of symmetry of the data. For grouped data: h 1 i i a i f ( X X ) / n s 35

36 Skewness 36
37 Kurtosis provides information regrading the shape of the population distribution (the peakedness or heaviness of the tails of a distribution). For grouped data: a Kurtosis h 1 i i i f ( X X ) / n s 37

38 Kurtosis Figure 5-12 Leptokurtic and Platykurtic distributions 38
39 The Normal Curve Characteristics of the normal curve: It is symmetrical -- Half the cases are to one side of the center; the other half is on the other side. The distribution is single peaked, not bimodal or multi-modal Also known as the Gaussian distribution Mean is best measure of central tendency 39
40 Characteristics: The Normal Curve Most of the cases will fall in the center portion of the curve and as values of the variable become more extreme they become less frequent, with "outliers" at the "tail" of the distribution few in number. It is one of many frequency distributions. 40
41 Standard Normal Distribution The standard normal distribution is a normal distribution with a mean of 0 and a standard deviation of 1. Normal distributions can be transformed to standard normal distributions by the formula: Z X i 41
42 Standardized Normal Distribution with μ = 0 and σ = 1 42
43 Percent of Items Included between certain values of the standard deviation 43
44 Relationship between the Mean and Standard Deviation 44
45 Mean and Standard Deviation Same mean but different standard deviation 45
46 Tests for Normality Histogram Skewness Kurtosis 46
47 Histogram: Shape Symmetrical Tests for Normality The larger the sampler size, the better the judgment of normality. A minimum sample size of 50 is recommended 47
48 Skewness (a3) and Kurtosis (a4) Tests for Normality Skewed to the left or to the right (a3=0 for a normal distribution) The data are peaked as the normal distribution (a4=3 for a normal distribution) The larger the sample size, the better the judgment of normality (sample size of 100 is recommended) 48
49 Probability Plots Tests for Normality Order the data from the smallest to the largest Rank the observations (starting from 1 for the lowest observation) Calculate the plotting position PP 100( i 0.5) n Where i = rank PP=plotting position n=sample size 49
50 Probability Plots Procedure cont d: Order the data Rank the observations Calculate the plotting position Label the data scale Plot the points Attempt to fit by eye a best line Determine normality 50
51 Probability Plots 51
PSYCHOLOGICAL STATISTICS
 UNIVERSITY OF CALICUT SCHOOL OF DISTANCE EDUCATION B Sc COUNSELLING PSYCHOLOGY (2011 Admission Onwards) II Semester Complementary Course PSYCHOLOGICAL STATISTICS QUESTION BANK 1. The process of grouping
Week 1 Variables: Exploration, Familiarisation and Description. Descriptive Statistics.
 Week 1 Variables: Exploration, Familiarisation and Description. Descriptive Statistics. Convergent validity: the degree to which results/evidence from different tests/sources, converge on the same conclusion.
Chapter 3. Numerical Descriptive Measures. Copyright 2016 Pearson Education, Ltd. Chapter 3, Slide 1
 Chapter 3 Numerical Descriptive Measures Copyright 2016 Pearson Education, Ltd. Chapter 3, Slide 1 Objectives In this chapter, you learn to: Describe the properties of central tendency, variation, and
David Tenenbaum GEOG 090 UNC-CH Spring 2005
 Simple Descriptive Statistics Review and Examples You will likely make use of all three measures of central tendency (mode, median, and mean), as well as some key measures of dispersion (standard deviation,
Descriptive Statistics
 Petra Petrovics Descriptive Statistics 2 nd seminar DESCRIPTIVE STATISTICS Definition: Descriptive statistics is concerned only with collecting and describing data Methods: - statistical tables and graphs
Overview/Outline. Moving beyond raw data. PSY 464 Advanced Experimental Design. Describing and Exploring Data The Normal Distribution
 PSY 464 Advanced Experimental Design Describing and Exploring Data The Normal Distribution 1 Overview/Outline Questions-problems? Exploring/Describing data Organizing/summarizing data Graphical presentations
Some Characteristics of Data
 Some Characteristics of Data Not all data is the same, and depending on some characteristics of a particular dataset, there are some limitations as to what can and cannot be done with that data. Some key
Engineering Mathematics III. Moments
 Moments Mean and median Mean value (centre of gravity) f(x) x f (x) x dx Median value (50th percentile) F(x med ) 1 2 P(x x med ) P(x x med ) 1 0 F(x) x med 1/2 x x Variance and standard deviation
Frequency Distribution and Summary Statistics
 Frequency Distribution and Summary Statistics Dongmei Li Department of Public Health Sciences Office of Public Health Studies University of Hawai i at Mānoa Outline 1. Stemplot 2. Frequency table 3. Summary
CSC Advanced Scientific Programming, Spring Descriptive Statistics
 CSC 223 - Advanced Scientific Programming, Spring 2018 Descriptive Statistics Overview Statistics is the science of collecting, organizing, analyzing, and interpreting data in order to make decisions.
Numerical Descriptions of Data
 Numerical Descriptions of Data Measures of Center Mean x = x i n Excel: = average ( ) Weighted mean x = (x i w i ) w i x = data values x i = i th data value w i = weight of the i th data value Median =
Basic Procedure for Histograms
 Basic Procedure for Histograms 1. Compute the range of observations (min. & max. value) 2. Choose an initial # of classes (most likely based on the range of values, try and find a number of classes that
Math 2311 Bekki George Office Hours: MW 11am to 12:45pm in 639 PGH Online Thursdays 4-5:30pm And by appointment
 Math 2311 Bekki George bekki@math.uh.edu Office Hours: MW 11am to 12:45pm in 639 PGH Online Thursdays 4-5:30pm And by appointment Class webpage: http://www.math.uh.edu/~bekki/math2311.html Math 2311 Class
3.1 Measures of Central Tendency
 3.1 Measures of Central Tendency n Summation Notation x i or x Sum observation on the variable that appears to the right of the summation symbol. Example 1 Suppose the variable x i is used to represent
Numerical Measurements
 El-Shorouk Academy Acad. Year : 2013 / 2014 Higher Institute for Computer & Information Technology Term : Second Year : Second Department of Computer Science Statistics & Probabilities Section # 3 umerical
Descriptive Analysis
 Descriptive Analysis HERTANTO WAHYU SUBAGIO Univariate Analysis Univariate analysis involves the examination across cases of one variable at a time. There are three major characteristics of a single variable
Measures of Dispersion (Range, standard deviation, standard error) Introduction
 Introduction") Measures of Dispersion (Range, standard deviation, standard error) Introduction We have already learnt that frequency distribution table gives a rough idea of the distribution of the variables in a sample
Measures of Dispersion (Range, standard deviation, standard error) Introduction We have already learnt that frequency distribution table gives a rough idea of the distribution of the variables in a sample
The Normal Distribution
 5.1 Introduction to Normal Distributions and the Standard Normal Distribution Section Learning objectives: 1. How to interpret graphs of normal probability distributions 2. How to find areas under the
Measures of Central tendency
 Elementary Statistics Measures of Central tendency By Prof. Mirza Manzoor Ahmad In statistics, a central tendency (or, more commonly, a measure of central tendency) is a central or typical value for a
Module Tag PSY_P2_M 7. PAPER No.2: QUANTITATIVE METHODS MODULE No.7: NORMAL DISTRIBUTION
 Subject Paper No and Title Module No and Title Paper No.2: QUANTITATIVE METHODS Module No.7: NORMAL DISTRIBUTION Module Tag PSY_P2_M 7 TABLE OF CONTENTS 1. Learning Outcomes 2. Introduction 3. Properties
2 Exploring Univariate Data
 2 Exploring Univariate Data A good picture is worth more than a thousand words! Having the data collected we examine them to get a feel for they main messages and any surprising features, before attempting
9/17/2015. Basic Statistics for the Healthcare Professional. Relax.it won t be that bad! Purpose of Statistic. Objectives
 Basic Statistics for the Healthcare Professional 1 F R A N K C O H E N, M B B, M P A D I R E C T O R O F A N A L Y T I C S D O C T O R S M A N A G E M E N T, LLC Purpose of Statistic 2 Provide a numerical
Dot Plot: A graph for displaying a set of data. Each numerical value is represented by a dot placed above a horizontal number line.
 Introduction We continue our study of descriptive statistics with measures of dispersion, such as dot plots, stem and leaf displays, quartiles, percentiles, and box plots. Dot plots, a stem-and-leaf display,
DESCRIPTIVE STATISTICS
 DESCRIPTIVE STATISTICS INTRODUCTION Numbers and quantification offer us a very special language which enables us to express ourselves in exact terms. This language is called Mathematics. We will now learn
Data Distributions and Normality
 Data Distributions and Normality Definition (Non)Parametric Parametric statistics assume that data come from a normal distribution, and make inferences about parameters of that distribution. These statistical
Simple Descriptive Statistics
 Simple Descriptive Statistics These are ways to summarize a data set quickly and accurately The most common way of describing a variable distribution is in terms of two of its properties: Central tendency
Descriptive Statistics
 Chapter 3 Descriptive Statistics Chapter 2 presented graphical techniques for organizing and displaying data. Even though such graphical techniques allow the researcher to make some general observations
Lecture Week 4 Inspecting Data: Distributions
 Lecture Week 4 Inspecting Data: Distributions Introduction to Research Methods & Statistics 2013 2014 Hemmo Smit So next week No lecture & workgroups But Practice Test on-line (BB) Enter data for your
IOP 201-Q (Industrial Psychological Research) Tutorial 5
 Tutorial 5") IOP 201-Q (Industrial Psychological Research) Tutorial 5 TRUE/FALSE [1 point each] Indicate whether the sentence or statement is true or false. 1. To establish a cause-and-effect relation between two variables,
IOP 201-Q (Industrial Psychological Research) Tutorial 5 TRUE/FALSE [1 point each] Indicate whether the sentence or statement is true or false. 1. To establish a cause-and-effect relation between two variables,
MEASURES OF DISPERSION, RELATIVE STANDING AND SHAPE. Dr. Bijaya Bhusan Nanda,
 MEASURES OF DISPERSION, RELATIVE STANDING AND SHAPE Dr. Bijaya Bhusan Nanda, CONTENTS What is measures of dispersion? Why measures of dispersion? How measures of dispersions are calculated? Range Quartile
Summarising Data. Summarising Data. Examples of Types of Data. Types of Data
 Summarising Data Summarising Data Mark Lunt Arthritis Research UK Epidemiology Unit University of Manchester Today we will consider Different types of data Appropriate ways to summarise these data 17/10/2017
Graphical and Tabular Methods in Descriptive Statistics. Descriptive Statistics
 Graphical and Tabular Methods in Descriptive Statistics MATH 3342 Section 1.2 Descriptive Statistics n Graphs and Tables n Numerical Summaries Sections 1.3 and 1.4 1 Why graph data? n The amount of data
DATA SUMMARIZATION AND VISUALIZATION
 APPENDIX DATA SUMMARIZATION AND VISUALIZATION PART 1 SUMMARIZATION 1: BUILDING BLOCKS OF DATA ANALYSIS 294 PART 2 PART 3 PART 4 VISUALIZATION: GRAPHS AND TABLES FOR SUMMARIZING AND ORGANIZING DATA 296
STATISTICS KEY POINTS
 STATISTICS KEY POINTS The three measures of central tendency are : i. Mean ii. Median iii. Mode Mean Of grouped frequency distribution can be calculated by the following methods. (i) (ii) (iii) Direct
SUMMARY STATISTICS EXAMPLES AND ACTIVITIES
 Session 6 SUMMARY STATISTICS EXAMPLES AD ACTIVITIES Example 1.1 Expand the following: 1. X 2. 2 6 5 X 3. X 2 4 3 4 4. X 4 2 Solution 1. 2 3 2 X X X... X 2. 6 4 X X X X 4 5 6 5 3. X 2 X 3 2 X 4 2 X 5 2
Basic Data Analysis. Stephen Turnbull Business Administration and Public Policy Lecture 3: April 25, Abstract
 Basic Data Analysis Stephen Turnbull Business Administration and Public Policy Lecture 3: April 25, 2013 Abstract Review summary statistics and measures of location. Discuss the placement exam as an exercise
Unit 2 Statistics of One Variable
 Unit 2 Statistics of One Variable Day 6 Summarizing Quantitative Data Summarizing Quantitative Data We have discussed how to display quantitative data in a histogram It is useful to be able to describe
Chapter 6 Simple Correlation and
 Contents Chapter 1 Introduction to Statistics Meaning of Statistics... 1 Definition of Statistics... 2 Importance and Scope of Statistics... 2 Application of Statistics... 3 Characteristics of Statistics...
MAS1403. Quantitative Methods for Business Management. Semester 1, Module leader: Dr. David Walshaw
 MAS1403 Quantitative Methods for Business Management Semester 1, 2018 2019 Module leader: Dr. David Walshaw Additional lecturers: Dr. James Waldren and Dr. Stuart Hall Announcements: Written assignment
MATHEMATICS APPLIED TO BIOLOGICAL SCIENCES MVE PA 07. LP07 DESCRIPTIVE STATISTICS - Calculating of statistical indicators (1)
") LP07 DESCRIPTIVE STATISTICS - Calculating of statistical indicators (1) Descriptive statistics are ways of summarizing large sets of quantitative (numerical) information. The best way to reduce a set of
LP07 DESCRIPTIVE STATISTICS - Calculating of statistical indicators (1) Descriptive statistics are ways of summarizing large sets of quantitative (numerical) information. The best way to reduce a set of
DESCRIPTIVE STATISTICS II. Sorana D. Bolboacă
 DESCRIPTIVE STATISTICS II Sorana D. Bolboacă OUTLINE Measures of centrality Measures of spread Measures of symmetry Measures of localization Mainly applied on quantitative variables 2 DESCRIPTIVE STATISTICS
KING FAHD UNIVERSITY OF PETROLEUM & MINERALS DEPARTMENT OF MATHEMATICAL SCIENCES DHAHRAN, SAUDI ARABIA. Name: ID# Section
 KING FAHD UNIVERSITY OF PETROLEUM & MINERALS DEPARTMENT OF MATHEMATICAL SCIENCES DHAHRAN, SAUDI ARABIA STAT 11: BUSINESS STATISTICS I Semester 04 Major Exam #1 Sunday March 7, 005 Please circle your instructor
Chapter 3 Descriptive Statistics: Numerical Measures Part A
 Slides Prepared by JOHN S. LOUCKS St. Edward s University Slide 1 Chapter 3 Descriptive Statistics: Numerical Measures Part A Measures of Location Measures of Variability Slide Measures of Location Mean
Moments and Measures of Skewness and Kurtosis
 Moments and Measures of Skewness and Kurtosis Moments The term moment has been taken from physics. The term moment in statistical use is analogous to moments of forces in physics. In statistics the values
Description of Data I
 Description of Data I (Summary and Variability measures) Objectives: Able to understand how to summarize the data Able to understand how to measure the variability of the data Able to use and interpret
Master of Science in Strategic Management Degree Master of Science in Strategic Supply Chain Management Degree
 CHINHOYI UNIVERSITY OF TECHNOLOGY SCHOOL OF BUSINESS SCIENCES AND MANAGEMENT POST GRADUATE PROGRAMME Master of Science in Strategic Management Degree Master of Science in Strategic Supply Chain Management
E.D.A. Exploratory Data Analysis E.D.A. Steps for E.D.A. Greg C Elvers, Ph.D.
 E.D.A. Greg C Elvers, Ph.D. 1 Exploratory Data Analysis One of the most important steps in analyzing data is to look at the raw data This allows you to: find observations that may be incorrect quickly
Lecture 2 Describing Data
 Lecture 2 Describing Data Thais Paiva STA 111 - Summer 2013 Term II July 2, 2013 Lecture Plan 1 Types of data 2 Describing the data with plots 3 Summary statistics for central tendency and spread 4 Histograms
Measures of Central Tendency: Ungrouped Data. Mode. Median. Mode -- Example. Median: Example with an Odd Number of Terms
 Measures of Central Tendency: Ungrouped Data Measures of central tendency yield information about particular places or locations in a group of numbers. Common Measures of Location Mode Median Percentiles
Measures of Central Tendency Lecture 5 22 February 2006 R. Ryznar
 Measures of Central Tendency 11.220 Lecture 5 22 February 2006 R. Ryznar Today s Content Wrap-up from yesterday Frequency Distributions The Mean, Median and Mode Levels of Measurement and Measures of Central
Normal Probability Distributions
 Normal Probability Distributions Properties of Normal Distributions The most important probability distribution in statistics is the normal distribution. Normal curve A normal distribution is a continuous
MAS187/AEF258. University of Newcastle upon Tyne
 MAS187/AEF258 University of Newcastle upon Tyne 2005-6 Contents 1 Collecting and Presenting Data 5 1.1 Introduction...................................... 5 1.1.1 Examples...................................
1 Exercise One. 1.1 Calculate the mean ROI. Note that the data is not grouped! Below you find the raw data in tabular form:
 1 Exercise One Note that the data is not grouped! 1.1 Calculate the mean ROI Below you find the raw data in tabular form: Obs Data 1 18.5 2 18.6 3 17.4 4 12.2 5 19.7 6 5.6 7 7.7 8 9.8 9 19.9 10 9.9 11
Statistics for Managers Using Microsoft Excel/SPSS Chapter 6 The Normal Distribution And Other Continuous Distributions
 Statistics for Managers Using Microsoft Excel/SPSS Chapter 6 The Normal Distribution And Other Continuous Distributions 1999 Prentice-Hall, Inc. Chap. 6-1 Chapter Topics The Normal Distribution The Standard
Continuous Probability Distributions
 8.1 Continuous Probability Distributions Distributions like the binomial probability distribution and the hypergeometric distribution deal with discrete data. The possible values of the random variable
Measures of Center. Mean. 1. Mean 2. Median 3. Mode 4. Midrange (rarely used) Measure of Center. Notation. Mean
 Measure of Center. Notation. Mean") Measure of Center Measures of Center The value at the center or middle of a data set 1. Mean 2. Median 3. Mode 4. Midrange (rarely used) 1 2 Mean Notation The measure of center obtained by adding the values
Measure of Center Measures of Center The value at the center or middle of a data set 1. Mean 2. Median 3. Mode 4. Midrange (rarely used) 1 2 Mean Notation The measure of center obtained by adding the values
Random Variables and Probability Distributions
 Chapter 3 Random Variables and Probability Distributions Chapter Three Random Variables and Probability Distributions 3. Introduction An event is defined as the possible outcome of an experiment. In engineering
NCSS Statistical Software. Reference Intervals
 Chapter 586 Introduction A reference interval contains the middle 95% of measurements of a substance from a healthy population. It is a type of prediction interval. This procedure calculates one-, and
STAT 113 Variability
 STAT 113 Variability Colin Reimer Dawson Oberlin College September 14, 2017 1 / 48 Outline Last Time: Shape and Center Variability Boxplots and the IQR Variance and Standard Deviaton Transformations 2
Stat 101 Exam 1 - Embers Important Formulas and Concepts 1
 1 Chapter 1 1.1 Definitions Stat 101 Exam 1 - Embers Important Formulas and Concepts 1 1. Data Any collection of numbers, characters, images, or other items that provide information about something. 2.
UNIT 4 NORMAL DISTRIBUTION: DEFINITION, CHARACTERISTICS AND PROPERTIES
 f UNIT 4 NORMAL DISTRIBUTION: DEFINITION, CHARACTERISTICS AND PROPERTIES Normal Distribution: Definition, Characteristics and Properties Structure 4.1 Introduction 4.2 Objectives 4.3 Definitions of Probability
Statistics 114 September 29, 2012
 Statistics 114 September 29, 2012 Third Long Examination TGCapistrano I. TRUE OR FALSE. Write True if the statement is always true; otherwise, write False. 1. The fifth decile is equal to the 50 th percentile.
Lectures delivered by Prof.K.K.Achary, YRC
 Lectures delivered by Prof.K.K.Achary, YRC Given a data set, we say that it is symmetric about a central value if the observations are distributed symmetrically about the central value. In symmetrically
CHAPTER 2 Describing Data: Numerical
 CHAPTER Multiple-Choice Questions 1. A scatter plot can illustrate all of the following except: A) the median of each of the two variables B) the range of each of the two variables C) an indication of
Descriptive Statistics Bios 662
 Descriptive Statistics Bios 662 Michael G. Hudgens, Ph.D. mhudgens@bios.unc.edu http://www.bios.unc.edu/ mhudgens 2008-08-19 08:51 BIOS 662 1 Descriptive Statistics Descriptive Statistics Types of variables
KARACHI UNIVERSITY BUSINESS SCHOOL UNIVERSITY OF KARACHI BS (BBA) VI
 VI") 88 P a g e B S ( B B A ) S y l l a b u s KARACHI UNIVERSITY BUSINESS SCHOOL UNIVERSITY OF KARACHI BS (BBA) VI Course Title : STATISTICS Course Number : BA(BS) 532 Credit Hours : 03 Course 1. Statistical
88 P a g e B S ( B B A ) S y l l a b u s KARACHI UNIVERSITY BUSINESS SCHOOL UNIVERSITY OF KARACHI BS (BBA) VI Course Title : STATISTICS Course Number : BA(BS) 532 Credit Hours : 03 Course 1. Statistical
Terms & Characteristics
 NORMAL CURVE Knowledge that a variable is distributed normally can be helpful in drawing inferences as to how frequently certain observations are likely to occur. NORMAL CURVE A Normal distribution: Distribution
Review: Types of Summary Statistics
 Review: Types of Summary Statistics We re often interested in describing the following characteristics of the distribution of a data series: Central tendency - where is the middle of the distribution?
Statistics I Chapter 2: Analysis of univariate data
 Statistics I Chapter 2: Analysis of univariate data Numerical summary Central tendency Location Spread Form mean quartiles range coeff. asymmetry median percentiles interquartile range coeff. kurtosis
The Mode: An Example. The Mode: An Example. Measure of Central Tendency: The Mode. Measure of Central Tendency: The Median
 Chapter 4: What is a measure of Central Tendency? Numbers that describe what is typical of the distribution You can think of this value as where the middle of a distribution lies (the median). or The value
DATA HANDLING Five-Number Summary
 DATA HANDLING Five-Number Summary The five-number summary consists of the minimum and maximum values, the median, and the upper and lower quartiles. The minimum and the maximum are the smallest and greatest
MBEJ 1023 Dr. Mehdi Moeinaddini Dept. of Urban & Regional Planning Faculty of Built Environment
 MBEJ 1023 Planning Analytical Methods Dr. Mehdi Moeinaddini Dept. of Urban & Regional Planning Faculty of Built Environment Contents What is statistics? Population and Sample Descriptive Statistics Inferential
A LEVEL MATHEMATICS ANSWERS AND MARKSCHEMES SUMMARY STATISTICS AND DIAGRAMS. 1. a) 45 B1 [1] b) 7 th value 37 M1 A1 [2]
![A LEVEL MATHEMATICS ANSWERS AND MARKSCHEMES SUMMARY STATISTICS AND DIAGRAMS. 1. a) 45 B1 [1] b) 7 th value 37 M1 A1 [2]](/thumbs/81/83043398.jpg "A LEVEL MATHEMATICS ANSWERS AND MARKSCHEMES SUMMARY STATISTICS AND DIAGRAMS. 1. a) 45 B1 [1] b) 7 th value 37 M1 A1 [2]") 1. a) 45 [1] b) 7 th value 37 [] n c) LQ : 4 = 3.5 4 th value so LQ = 5 3 n UQ : 4 = 9.75 10 th value so UQ = 45 IQR = 0 f.t. d) Median is closer to upper quartile Hence negative skew [] Page 1 . a) Orders
1. a) 45 [1] b) 7 th value 37 [] n c) LQ : 4 = 3.5 4 th value so LQ = 5 3 n UQ : 4 = 9.75 10 th value so UQ = 45 IQR = 0 f.t. d) Median is closer to upper quartile Hence negative skew [] Page 1 . a) Orders
Monte Carlo Simulation (Random Number Generation)
") Monte Carlo Simulation (Random Number Generation) Revised: 10/11/2017 Summary... 1 Data Input... 1 Analysis Options... 6 Summary Statistics... 6 Box-and-Whisker Plots... 7 Percentiles... 9 Quantile Plots...
Monte Carlo Simulation (Random Number Generation) Revised: 10/11/2017 Summary... 1 Data Input... 1 Analysis Options... 6 Summary Statistics... 6 Box-and-Whisker Plots... 7 Percentiles... 9 Quantile Plots...
Establishing a framework for statistical analysis via the Generalized Linear Model
 PSY349: Lecture 1: INTRO & CORRELATION Establishing a framework for statistical analysis via the Generalized Linear Model GLM provides a unified framework that incorporates a number of statistical methods
ECON 214 Elements of Statistics for Economists
 ECON 214 Elements of Statistics for Economists Session 3 Presentation of Data: Numerical Summary Measures Part 2 Lecturer: Dr. Bernardin Senadza, Dept. of Economics Contact Information: bsenadza@ug.edu.gh
Averages and Variability. Aplia (week 3 Measures of Central Tendency) Measures of central tendency (averages)
 Measures of central tendency (averages)") Chapter 4 Averages and Variability Aplia (week 3 Measures of Central Tendency) Chapter 5 (omit 5.2, 5.6, 5.8, 5.9) Aplia (week 4 Measures of Variability) Measures of central tendency (averages) Measures
Chapter 4 Averages and Variability Aplia (week 3 Measures of Central Tendency) Chapter 5 (omit 5.2, 5.6, 5.8, 5.9) Aplia (week 4 Measures of Variability) Measures of central tendency (averages) Measures
Skewness and the Mean, Median, and Mode *
 OpenStax-CNX module: m46931 1 Skewness and the Mean, Median, and Mode * OpenStax This work is produced by OpenStax-CNX and licensed under the Creative Commons Attribution License 3.0 Consider the following
value BE.104 Spring Biostatistics: Distribution and the Mean J. L. Sherley
 BE.104 Spring Biostatistics: Distribution and the Mean J. L. Sherley Outline: 1) Review of Variation & Error 2) Binomial Distributions 3) The Normal Distribution 4) Defining the Mean of a population Goals:
chapter 2-3 Normal Positive Skewness Negative Skewness
 chapter 2-3 Testing Normality Introduction In the previous chapters we discussed a variety of descriptive statistics which assume that the data are normally distributed. This chapter focuses upon testing
Introduction to Descriptive Statistics
 Introduction to Descriptive Statistics 17.871 Types of Variables ~Nominal (Quantitative) Nominal (Qualitative) categorical Ordinal Interval or ratio Describing data Moment Non-mean based measure Center
Quantitative Analysis and Empirical Methods
 3) Descriptive Statistics Sciences Po, Paris, CEE / LIEPP Introduction Data and statistics Introduction to distributions Measures of central tendency Measures of dispersion Skewness Data and Statistics
AP Statistics Chapter 6 - Random Variables
 AP Statistics Chapter 6 - Random 6.1 Discrete and Continuous Random Objective: Recognize and define discrete random variables, and construct a probability distribution table and a probability histogram
Contents. An Overview of Statistical Applications CHAPTER 1. Contents (ix) Preface... (vii)
 Preface... (vii)") Contents (ix) Contents Preface... (vii) CHAPTER 1 An Overview of Statistical Applications 1.1 Introduction... 1 1. Probability Functions and Statistics... 1..1 Discrete versus Continuous Functions... 1..
Contents (ix) Contents Preface... (vii) CHAPTER 1 An Overview of Statistical Applications 1.1 Introduction... 1 1. Probability Functions and Statistics... 1..1 Discrete versus Continuous Functions... 1..
Chapter ! Bell Shaped
 Chapter 6 6-1 Business Statistics: A First Course 5 th Edition Chapter 7 Continuous Probability Distributions Learning Objectives In this chapter, you learn:! To compute probabilities from the normal distribution!
CHAPTER 5 Sampling Distributions
 CHAPTER 5 Sampling Distributions 5.1 The possible values of p^ are 0, 1/3, 2/3, and 1. These correspond to getting 0 persons with lung cancer, 1 with lung cancer, 2 with lung cancer, and all 3 with lung
Standardized Data Percentiles, Quartiles and Box Plots Grouped Data Skewness and Kurtosis
 Descriptive Statistics (Part 2) 4 Chapter Percentiles, Quartiles and Box Plots Grouped Data Skewness and Kurtosis McGraw-Hill/Irwin Copyright 2009 by The McGraw-Hill Companies, Inc. Chebyshev s Theorem
Exploring Data and Graphics
 Exploring Data and Graphics Rick White Department of Statistics, UBC Graduate Pathways to Success Graduate & Postdoctoral Studies November 13, 2013 Outline Summarizing Data Types of Data Visualizing Data
Categorical. A general name for non-numerical data; the data is separated into categories of some kind.
 Chapter 5 Categorical A general name for non-numerical data; the data is separated into categories of some kind. Nominal data Categorical data with no implied order. Eg. Eye colours, favourite TV show,
4. DESCRIPTIVE STATISTICS
 4. DESCRIPTIVE STATISTICS Descriptive Statistics is a body of techniques for summarizing and presenting the essential information in a data set. Eg: Here are daily high temperatures for Jan 16, 2009 in
32.S [F] SU 02 June All Syllabus Science Faculty B.A. I Yr. Stat. [Opt.] [Sem.I & II] 1
![32.S [F] SU 02 June All Syllabus Science Faculty B.A. I Yr. Stat. [Opt.] [Sem.I & II] 1](/thumbs/87/96342483.jpg "32.S [F] SU 02 June All Syllabus Science Faculty B.A. I Yr. Stat. [Opt.] [Sem.I & II] 1") 32.S [F] SU 02 June 2014 2015 All Syllabus Science Faculty B.A. I Yr. Stat. [Opt.] [Sem.I & II] 1 32.S [F] SU 02 June 2014 2015 All Syllabus Science Faculty B.A. I Yr. Stat. [Opt.] [Sem.I & II] 2 32.S
32.S [F] SU 02 June 2014 2015 All Syllabus Science Faculty B.A. I Yr. Stat. [Opt.] [Sem.I & II] 1 32.S [F] SU 02 June 2014 2015 All Syllabus Science Faculty B.A. I Yr. Stat. [Opt.] [Sem.I & II] 2 32.S
Math 227 Elementary Statistics. Bluman 5 th edition
 Math 227 Elementary Statistics Bluman 5 th edition CHAPTER 6 The Normal Distribution 2 Objectives Identify distributions as symmetrical or skewed. Identify the properties of the normal distribution. Find
Numerical Descriptive Measures. Measures of Center: Mean and Median
 Steve Sawin Statistics Numerical Descriptive Measures Having seen the shape of a distribution by looking at the histogram, the two most obvious questions to ask about the specific distribution is where
AP STATISTICS FALL SEMESTSER FINAL EXAM STUDY GUIDE
 AP STATISTICS Name: FALL SEMESTSER FINAL EXAM STUDY GUIDE Period: *Go over Vocabulary Notecards! *This is not a comprehensive review you still should look over your past notes, homework/practice, Quizzes,
CHAPTER 6. ' From the table the z value corresponding to this value Z = 1.96 or Z = 1.96 (d) P(Z >?) =
 P(Z >?) =") Solutions to End-of-Section and Chapter Review Problems 225 CHAPTER 6 6.1 (a) P(Z < 1.20) = 0.88493 P(Z > 1.25) = 1 0.89435 = 0.10565 P(1.25 < Z < 1.70) = 0.95543 0.89435 = 0.06108 (d) P(Z < 1.25) or Z
Solutions to End-of-Section and Chapter Review Problems 225 CHAPTER 6 6.1 (a) P(Z < 1.20) = 0.88493 P(Z > 1.25) = 1 0.89435 = 0.10565 P(1.25 < Z < 1.70) = 0.95543 0.89435 = 0.06108 (d) P(Z < 1.25) or Z
Modern Methods of Data Analysis - SS 2009
 Modern Methods of Data Analysis Lecture II (7.04.09) Contents: Characterize data samples Characterize distributions Correlations, covariance Reminder: Average of a Sample arithmetic mean of data set: weighted
Lecture 1: Review and Exploratory Data Analysis (EDA)
") Lecture 1: Review and Exploratory Data Analysis (EDA) Ani Manichaikul amanicha@jhsph.edu 16 April 2007 1 / 40 Course Information I Office hours For questions and help When? I ll announce this tomorrow
Lecture 1: Review and Exploratory Data Analysis (EDA) Ani Manichaikul amanicha@jhsph.edu 16 April 2007 1 / 40 Course Information I Office hours For questions and help When? I ll announce this tomorrow
34.S-[F] SU-02 June All Syllabus Science Faculty B.Sc. I Yr. Stat. [Opt.] [Sem.I & II] - 1 -
![34.S-[F] SU-02 June All Syllabus Science Faculty B.Sc. I Yr. Stat. [Opt.] [Sem.I & II] - 1 -](/thumbs/87/96342487.jpg "34.S-[F] SU-02 June All Syllabus Science Faculty B.Sc. I Yr. Stat. [Opt.] [Sem.I & II] - 1 -") [Sem.I & II] - 1 - [Sem.I & II] - 2 - [Sem.I & II] - 3 - Syllabus of B.Sc. First Year Statistics [Optional ] Sem. I & II effect for the academic year 2014 2015 [Sem.I & II] - 4 - SYLLABUS OF F.Y.B.Sc.
[Sem.I & II] - 1 - [Sem.I & II] - 2 - [Sem.I & II] - 3 - Syllabus of B.Sc. First Year Statistics [Optional ] Sem. I & II effect for the academic year 2014 2015 [Sem.I & II] - 4 - SYLLABUS OF F.Y.B.Sc.
Data that can be any numerical value are called continuous. These are usually things that are measured, such as height, length, time, speed, etc.
 Chapter 8 Measures of Center Data that can be any numerical value are called continuous. These are usually things that are measured, such as height, length, time, speed, etc. Data that can only be integer
2011 Pearson Education, Inc
 Statistics for Business and Economics Chapter 4 Random Variables & Probability Distributions Content 1. Two Types of Random Variables 2. Probability Distributions for Discrete Random Variables 3. The Binomial