Terms & Characteristics
|
|
|
- Juniper Goodwin
- 6 years ago
- Views:
Transcription

1
2 NORMAL CURVE Knowledge that a variable is distributed normally can be helpful in drawing inferences as to how frequently certain observations are likely to occur.
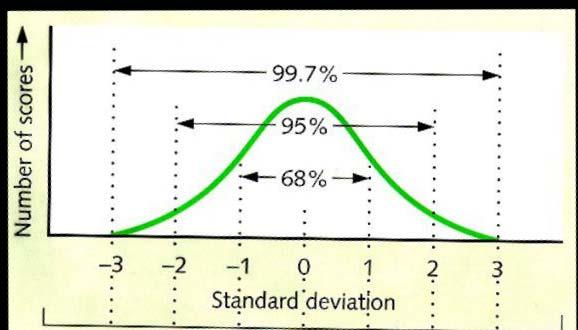
3 NORMAL CURVE A Normal distribution: Distribution with specific characteristics symmetrical, bell-shaped mean, median, and mode are the same this is an assumption for many statistical techniques and should be checked 68% w/i + 1SD, 95% w/i + 2SD, 99% w/in + 3SD
4
5 Terms & Characteristics Outliers - scores that differ so markedly from the main body of data as to raise questions about their accuracy need to double check outliers, do not delete without a good reason.
6 Terms & Characteristics Skewness - refers to the asymmetry of a distribution Positively skewed or right skewed means that extreme scores lie to the right. (Hint: order of appearance on axis is reverse alphabetic: mode, median, mean)
7 Terms & Characteristics Negatively skewed or left skewed means that extreme scores lie to the left. (Hint: order of appearance on axis is alphabetic: mean, median, mode)
8 Terms & Characteristics Kurtosis - peakedness or flatness, or somewhere in between. Platykurtic: flat (broad hump and thick tails) Mesokurtic: peakedness like the normal distribution. Leptokurtic: peaked (narrow and thin tails)
9
10 Quantiles maximum 100.0% % % % quartile 75.0% median 50.0% quartile 25.0% % % % minimum 0.0%
11 Moments Mean Std Dev Std Error Mean Upper 95% Mean Lower 95% Mean N Sum Weights Test for Normality Shapiro-Wilk W Test W Prob<W
12
13 The standard normal is a very useful distribution. It has a mean (μ) of 0 and a standard deviation (σ) of 1. It expresses scores in terms of how many sd (+or-) from the mean. z = (x - μ)/σ Let s look at Table A


14 Example Determine the area under the normal curve falling to the right of the given Z: Z = 1.84
15 Example Find the value (1.84) in the table and locate the associated area between the value and the mean 1.84
16 Example Find the value (1.84) in the table and locate the associated area between the value and the mean
17 Example Subtract that area from 0.5 Area = =
18 Example Interpretation: 3.29 % of values fall above 1.84 standard deviations
19 Exercise #1 Serum cholesterol levels were taken from a population of college students. The results were normally distributed. Males: μ = 195, σ = 10 Females: μ = 185, σ = 12
20 What %age of females would have a cholesterol level greater than 200? What kind of picture should you draw?
21 What is the z-score associated with cholesterol of 200? Recall: z = (x - μ)/σ In this case: μ = 185 & σ = 12 z = (200 - )/ z =
22 What percentage of (female) scores are greater than z = 1.25? Table A value Area of interest z =
23 Interpretation: What %age of females would have cholesterol level greater than 200? % of females have cholesterol > 200.
24 What %age of males would have cholesterol level less than 180? What is the z-score associated with cholesterol of 180?
25 What is the z-score associated with cholesterol of 180? Recall: z = (x - μ)/σ In this case: μ = 195 & σ = 10 z = (180 - )/ z =
26 z = 0
27 What %age of males would have a cholesterol level less than 180? 6.68 % of males have cholesterol < 180.
28 Exercise #2 We have two weights on a female patient. Reading A is 175 lbs. and Reading B is 74.8 kg. Has there been a change in the patient between readings? Given: A: μ = 175, σ = 10 B: μ = 68, σ = 4.5
29 Solution Exercise #2 z a = ( ) / 10 = 2.5 area between mean & 2.5 is.4938 z b = ( )/ 4.5 = 1.5 area between mean & 1.5 is.4332
30 What is the 95th percentile in pounds? Kilograms? (Given the above means and standard deviations.) You are looking for the x-value (ie, pounds) that corresponds to the 95th percentile.
31 Solution Solve the equation for x (Wt in Pounds). Plug in the values that you know. Z= x - μ = x σ (10) = x = x = x = weight in lbs
32 Solution Solve the equation for x. Plug in the values that you know. Z= x - μ = x -68 σ (4.5) = x = x = x 77 = weight in kg.
33 Central Limit Theorem states: If random samples are selected from a population with mean μ and finite standard deviation σ, as the sample size n increases, the distribution of X approaches a normal distribution with mean, μ and standard deviation, σ/ n.
34 Why is this so-o-o-o cool? Regardless of the shape of the sampled population, the means of sufficiently large samples will be nearly normally distributed. Therefore, we can work with sample means (provided n is large enough), and meet the assumption of normality!!!
35 A simple example. We have a uniform distribution with four data points. They are: 1,2,3,4 The mean and standard deviation are: μ = 2.5 and σ = 1.118
36
37 Sample Mean Sample Mean 1,1 1 2, , , , ,4 3 1,3 2 4,2 3 3,1 2 3,3 3 1, , , , ,2 2 4,4 4
38 Means
39 So what is μ and σ for the means? μ = μ (from original distribution) σ = σ / n μ = 2.5 σ = / 2 =.790 which is what we get when we calculate directly from 16 means.
40 From JMP mean Mean Std Dev
41 How Smart are you? Standardized IQ test: μ = 100 σ = 15 If you score 130, what percentile?
42 How Smart are you? Standardized exam: μ = 1000 σ = 200 If you score 1390, what is your IQ?
43 How Smart are WE? Standardized IQ test: μ = 100 σ = 15 If WE (n = 9) have an average score = 125, are we the same as the general population?
44 Are WE different? How different is our average score = 125 than the general population mean = 100? Z = ( )/ (15/ 9) Z = 25 / 5 = 5


45 Are WE different? Table A value Area of interest z = 0 5
Moments and Measures of Skewness and Kurtosis
 Moments and Measures of Skewness and Kurtosis Moments The term moment has been taken from physics. The term moment in statistical use is analogous to moments of forces in physics. In statistics the values
Simple Descriptive Statistics
 Simple Descriptive Statistics These are ways to summarize a data set quickly and accurately The most common way of describing a variable distribution is in terms of two of its properties: Central tendency
Module Tag PSY_P2_M 7. PAPER No.2: QUANTITATIVE METHODS MODULE No.7: NORMAL DISTRIBUTION
 Subject Paper No and Title Module No and Title Paper No.2: QUANTITATIVE METHODS Module No.7: NORMAL DISTRIBUTION Module Tag PSY_P2_M 7 TABLE OF CONTENTS 1. Learning Outcomes 2. Introduction 3. Properties
The Normal Probability Distribution
 1 The Normal Probability Distribution Key Definitions Probability Density Function: An equation used to compute probabilities for continuous random variables where the output value is greater than zero
Engineering Mathematics III. Moments
 Moments Mean and median Mean value (centre of gravity) f(x) x f (x) x dx Median value (50th percentile) F(x med ) 1 2 P(x x med ) P(x x med ) 1 0 F(x) x med 1/2 x x Variance and standard deviation
Density curves. (James Madison University) February 4, / 20
 February 4, / 20") Density curves Figure 6.2 p 230. A density curve is always on or above the horizontal axis, and has area exactly 1 underneath it. A density curve describes the overall pattern of a distribution. Example
Density curves Figure 6.2 p 230. A density curve is always on or above the horizontal axis, and has area exactly 1 underneath it. A density curve describes the overall pattern of a distribution. Example
David Tenenbaum GEOG 090 UNC-CH Spring 2005
 Simple Descriptive Statistics Review and Examples You will likely make use of all three measures of central tendency (mode, median, and mean), as well as some key measures of dispersion (standard deviation,
CHAPTER 6. ' From the table the z value corresponding to this value Z = 1.96 or Z = 1.96 (d) P(Z >?) =
 P(Z >?) =") Solutions to End-of-Section and Chapter Review Problems 225 CHAPTER 6 6.1 (a) P(Z < 1.20) = 0.88493 P(Z > 1.25) = 1 0.89435 = 0.10565 P(1.25 < Z < 1.70) = 0.95543 0.89435 = 0.06108 (d) P(Z < 1.25) or Z
Solutions to End-of-Section and Chapter Review Problems 225 CHAPTER 6 6.1 (a) P(Z < 1.20) = 0.88493 P(Z > 1.25) = 1 0.89435 = 0.10565 P(1.25 < Z < 1.70) = 0.95543 0.89435 = 0.06108 (d) P(Z < 1.25) or Z
Applications of Data Dispersions
 1 Applications of Data Dispersions Key Definitions Standard Deviation: The standard deviation shows how far away each value is from the mean on average. Z-Scores: The distance between the mean and a given
STAT Chapter 6 The Standard Deviation (SD) as a Ruler and The Normal Model
 as a Ruler and The Normal Model") STAT 203 - Chapter 6 The Standard Deviation (SD) as a Ruler and The Normal Model In Chapter 5, we introduced a few measures of center and spread, and discussed how the mean and standard deviation are good
STAT 203 - Chapter 6 The Standard Deviation (SD) as a Ruler and The Normal Model In Chapter 5, we introduced a few measures of center and spread, and discussed how the mean and standard deviation are good
Some Characteristics of Data
 Some Characteristics of Data Not all data is the same, and depending on some characteristics of a particular dataset, there are some limitations as to what can and cannot be done with that data. Some key
CH 5 Normal Probability Distributions Properties of the Normal Distribution
 Properties of the Normal Distribution Example A friend that is always late. Let X represent the amount of minutes that pass from the moment you are suppose to meet your friend until the moment your friend
STAT Chapter 6 The Standard Deviation (SD) as a Ruler and The Normal Model
 as a Ruler and The Normal Model") STAT 203 - Chapter 6 The Standard Deviation (SD) as a Ruler and The Normal Model In Chapter 5, we introduced a few measures of center and spread, and discussed how the mean and standard deviation are good
STAT 203 - Chapter 6 The Standard Deviation (SD) as a Ruler and The Normal Model In Chapter 5, we introduced a few measures of center and spread, and discussed how the mean and standard deviation are good
Lecture 6: Chapter 6
 Lecture 6: Chapter 6 C C Moxley UAB Mathematics 3 October 16 6.1 Continuous Probability Distributions Last week, we discussed the binomial probability distribution, which was discrete. 6.1 Continuous Probability
Both the quizzes and exams are closed book. However, For quizzes: Formulas will be provided with quiz papers if there is any need.
 Both the quizzes and exams are closed book. However, For quizzes: Formulas will be provided with quiz papers if there is any need. For exams (MD1, MD2, and Final): You may bring one 8.5 by 11 sheet of
Numerical Descriptions of Data
 Numerical Descriptions of Data Measures of Center Mean x = x i n Excel: = average ( ) Weighted mean x = (x i w i ) w i x = data values x i = i th data value w i = weight of the i th data value Median =
Data Distributions and Normality
 Data Distributions and Normality Definition (Non)Parametric Parametric statistics assume that data come from a normal distribution, and make inferences about parameters of that distribution. These statistical
Lectures delivered by Prof.K.K.Achary, YRC
 Lectures delivered by Prof.K.K.Achary, YRC Given a data set, we say that it is symmetric about a central value if the observations are distributed symmetrically about the central value. In symmetrically
Hypothesis Tests: One Sample Mean Cal State Northridge Ψ320 Andrew Ainsworth PhD
 Hypothesis Tests: One Sample Mean Cal State Northridge Ψ320 Andrew Ainsworth PhD MAJOR POINTS Sampling distribution of the mean revisited Testing hypotheses: sigma known An example Testing hypotheses:
Measures of Central tendency
 Elementary Statistics Measures of Central tendency By Prof. Mirza Manzoor Ahmad In statistics, a central tendency (or, more commonly, a measure of central tendency) is a central or typical value for a
9/17/2015. Basic Statistics for the Healthcare Professional. Relax.it won t be that bad! Purpose of Statistic. Objectives
 Basic Statistics for the Healthcare Professional 1 F R A N K C O H E N, M B B, M P A D I R E C T O R O F A N A L Y T I C S D O C T O R S M A N A G E M E N T, LLC Purpose of Statistic 2 Provide a numerical
Frequency Distribution and Summary Statistics
 Frequency Distribution and Summary Statistics Dongmei Li Department of Public Health Sciences Office of Public Health Studies University of Hawai i at Mānoa Outline 1. Stemplot 2. Frequency table 3. Summary
The Normal Distribution & Descriptive Statistics. Kin 304W Week 2: Jan 15, 2012
 The Normal Distribution & Descriptive Statistics Kin 304W Week 2: Jan 15, 2012 1 Questionnaire Results I received 71 completed questionnaires. Thank you! Are you nervous about scientific writing? You re
The probability of having a very tall person in our sample. We look to see how this random variable is distributed.
 Distributions We're doing things a bit differently than in the text (it's very similar to BIOL 214/312 if you've had either of those courses). 1. What are distributions? When we look at a random variable,
ECON 214 Elements of Statistics for Economists 2016/2017
 ECON 214 Elements of Statistics for Economists 2016/2017 Topic The Normal Distribution Lecturer: Dr. Bernardin Senadza, Dept. of Economics bsenadza@ug.edu.gh College of Education School of Continuing and
Math 227 Elementary Statistics. Bluman 5 th edition
 Math 227 Elementary Statistics Bluman 5 th edition CHAPTER 6 The Normal Distribution 2 Objectives Identify distributions as symmetrical or skewed. Identify the properties of the normal distribution. Find
Lecture 9. Probability Distributions. Outline. Outline
 Outline Lecture 9 Probability Distributions 6-1 Introduction 6- Probability Distributions 6-3 Mean, Variance, and Expectation 6-4 The Binomial Distribution Outline 7- Properties of the Normal Distribution
UNIT 4 NORMAL DISTRIBUTION: DEFINITION, CHARACTERISTICS AND PROPERTIES
 f UNIT 4 NORMAL DISTRIBUTION: DEFINITION, CHARACTERISTICS AND PROPERTIES Normal Distribution: Definition, Characteristics and Properties Structure 4.1 Introduction 4.2 Objectives 4.3 Definitions of Probability
chapter 2-3 Normal Positive Skewness Negative Skewness
 chapter 2-3 Testing Normality Introduction In the previous chapters we discussed a variety of descriptive statistics which assume that the data are normally distributed. This chapter focuses upon testing
Examples of continuous probability distributions: The normal and standard normal
 Examples of continuous probability distributions: The normal and standard normal The Normal Distribution f(x) Changing μ shifts the distribution left or right. Changing σ increases or decreases the spread.
Shifting and rescaling data distributions
 Shifting and rescaling data distributions It is useful to consider the effect of systematic alterations of all the values in a data set. The simplest such systematic effect is a shift by a fixed constant.
Lecture 9. Probability Distributions
 Lecture 9 Probability Distributions Outline 6-1 Introduction 6-2 Probability Distributions 6-3 Mean, Variance, and Expectation 6-4 The Binomial Distribution Outline 7-2 Properties of the Normal Distribution
Empirical Rule (P148)
") Interpreting the Standard Deviation Numerical Descriptive Measures for Quantitative data III Dr. Tom Ilvento FREC 408 We can use the standard deviation to express the proportion of cases that might fall
Interpreting the Standard Deviation Numerical Descriptive Measures for Quantitative data III Dr. Tom Ilvento FREC 408 We can use the standard deviation to express the proportion of cases that might fall
Measures of Dispersion (Range, standard deviation, standard error) Introduction
 Introduction") Measures of Dispersion (Range, standard deviation, standard error) Introduction We have already learnt that frequency distribution table gives a rough idea of the distribution of the variables in a sample
Measures of Dispersion (Range, standard deviation, standard error) Introduction We have already learnt that frequency distribution table gives a rough idea of the distribution of the variables in a sample
6.2 Normal Distribution. Normal Distributions
 6.2 Normal Distribution Normal Distributions 1 Homework Read Sec 6-1, and 6-2. Make sure you have a good feel for the normal curve. Do discussion question p302 2 3 Objective Identify Complete normal model
Chapter 6. y y. Standardizing with z-scores. Standardizing with z-scores (cont.)
") Starter Ch. 6: A z-score Analysis Starter Ch. 6 Your Statistics teacher has announced that the lower of your two tests will be dropped. You got a 90 on test 1 and an 85 on test 2. You re all set to drop
Starter Ch. 6: A z-score Analysis Starter Ch. 6 Your Statistics teacher has announced that the lower of your two tests will be dropped. You got a 90 on test 1 and an 85 on test 2. You re all set to drop
Overview/Outline. Moving beyond raw data. PSY 464 Advanced Experimental Design. Describing and Exploring Data The Normal Distribution
 PSY 464 Advanced Experimental Design Describing and Exploring Data The Normal Distribution 1 Overview/Outline Questions-problems? Exploring/Describing data Organizing/summarizing data Graphical presentations
Department of Quantitative Methods & Information Systems. Business Statistics. Chapter 6 Normal Probability Distribution QMIS 120. Dr.
 Department of Quantitative Methods & Information Systems Business Statistics Chapter 6 Normal Probability Distribution QMIS 120 Dr. Mohammad Zainal Chapter Goals After completing this chapter, you should
Statistics 431 Spring 2007 P. Shaman. Preliminaries
 Statistics 4 Spring 007 P. Shaman The Binomial Distribution Preliminaries A binomial experiment is defined by the following conditions: A sequence of n trials is conducted, with each trial having two possible
The Normal Distribution
 Stat 6 Introduction to Business Statistics I Spring 009 Professor: Dr. Petrutza Caragea Section A Tuesdays and Thursdays 9:300:50 a.m. Chapter, Section.3 The Normal Distribution Density Curves So far we
ECON 214 Elements of Statistics for Economists
 ECON 214 Elements of Statistics for Economists Session 7 The Normal Distribution Part 1 Lecturer: Dr. Bernardin Senadza, Dept. of Economics Contact Information: bsenadza@ug.edu.gh College of Education
MULTIPLE CHOICE. Choose the one alternative that best completes the statement or answers the question.
 Chapter 6 Exam A Name The given values are discrete. Use the continuity correction and describe the region of the normal distribution that corresponds to the indicated probability. 1) The probability of
MATH 104 CHAPTER 5 page 1 NORMAL DISTRIBUTION
 MATH 104 CHAPTER 5 page 1 NORMAL DISTRIBUTION We have examined discrete random variables, those random variables for which we can list the possible values. We will now look at continuous random variables.
Standardized Data Percentiles, Quartiles and Box Plots Grouped Data Skewness and Kurtosis
 Descriptive Statistics (Part 2) 4 Chapter Percentiles, Quartiles and Box Plots Grouped Data Skewness and Kurtosis McGraw-Hill/Irwin Copyright 2009 by The McGraw-Hill Companies, Inc. Chebyshev s Theorem
Section 6.5. The Central Limit Theorem
 Section 6.5 The Central Limit Theorem Idea Will allow us to combine the theory from 6.4 (sampling distribution idea) with our central limit theorem and that will allow us the do hypothesis testing in the
The "bell-shaped" curve, or normal curve, is a probability distribution that describes many real-life situations.
 6.1 6.2 The Standard Normal Curve The "bell-shaped" curve, or normal curve, is a probability distribution that describes many real-life situations. Basic Properties 1. The total area under the curve is.
Chapter 4. The Normal Distribution
 Chapter 4 The Normal Distribution 1 Chapter 4 Overview Introduction 4-1 Normal Distributions 4-2 Applications of the Normal Distribution 4-3 The Central Limit Theorem 4-4 The Normal Approximation to the
Chapter Seven. The Normal Distribution
 Chapter Seven The Normal Distribution 7-1 Introduction Many continuous variables have distributions that are bellshaped and are called approximately normally distributed variables, such as the heights
Unit2: Probabilityanddistributions. 3. Normal distribution
 Announcements Unit: Probabilityanddistributions 3 Normal distribution Sta 101 - Spring 015 Duke University, Department of Statistical Science February, 015 Peer evaluation 1 by Friday 11:59pm Office hours:
MEASURES OF DISPERSION, RELATIVE STANDING AND SHAPE. Dr. Bijaya Bhusan Nanda,
 MEASURES OF DISPERSION, RELATIVE STANDING AND SHAPE Dr. Bijaya Bhusan Nanda, CONTENTS What is measures of dispersion? Why measures of dispersion? How measures of dispersions are calculated? Range Quartile
Continuous Probability Distributions & Normal Distribution
 Mathematical Methods Units 3/4 Student Learning Plan Continuous Probability Distributions & Normal Distribution 7 lessons Notes: Students need practice in recognising whether a problem involves a discrete
Chapter 6: The Normal Distribution
 Chapter 6: The Normal Distribution Diana Pell Section 6.1: Normal Distributions Note: Recall that a continuous variable can assume all values between any two given values of the variables. Many continuous
The Normal Distribution
 5.1 Introduction to Normal Distributions and the Standard Normal Distribution Section Learning objectives: 1. How to interpret graphs of normal probability distributions 2. How to find areas under the
Statistics 511 Supplemental Materials
 Gaussian (or Normal) Random Variable In this section we introduce the Gaussian Random Variable, which is more commonly referred to as the Normal Random Variable. This is a random variable that has a bellshaped
Fundamentals of Statistics
 CHAPTER 4 Fundamentals of Statistics Expected Outcomes Know the difference between a variable and an attribute. Perform mathematical calculations to the correct number of significant figures. Construct
Dot Plot: A graph for displaying a set of data. Each numerical value is represented by a dot placed above a horizontal number line.
 Introduction We continue our study of descriptive statistics with measures of dispersion, such as dot plots, stem and leaf displays, quartiles, percentiles, and box plots. Dot plots, a stem-and-leaf display,
DESCRIPTIVE STATISTICS
 DESCRIPTIVE STATISTICS INTRODUCTION Numbers and quantification offer us a very special language which enables us to express ourselves in exact terms. This language is called Mathematics. We will now learn
Example - Let X be the number of boys in a 4 child family. Find the probability distribution table:
 Chapter8 Probability Distributions and Statistics Section 8.1 Distributions of Random Variables tthe value of the result of the probability experiment is a RANDOM VARIABLE. Example - Let X be the number
CHAPTER 5 SAMPLING DISTRIBUTIONS
 CHAPTER 5 SAMPLING DISTRIBUTIONS Sampling Variability. We will visualize our data as a random sample from the population with unknown parameter μ. Our sample mean Ȳ is intended to estimate population mean
Chapter 3. Numerical Descriptive Measures. Copyright 2016 Pearson Education, Ltd. Chapter 3, Slide 1
 Chapter 3 Numerical Descriptive Measures Copyright 2016 Pearson Education, Ltd. Chapter 3, Slide 1 Objectives In this chapter, you learn to: Describe the properties of central tendency, variation, and
22.2 Shape, Center, and Spread
 Name Class Date 22.2 Shape, Center, and Spread Essential Question: Which measures of center and spread are appropriate for a normal distribution, and which are appropriate for a skewed distribution? Eplore
Descriptive Statistics for Educational Data Analyst: A Conceptual Note
 Recommended Citation: Behera, N.P., & Balan, R. T. (2016). Descriptive statistics for educational data analyst: a conceptual note. Pedagogy of Learning, 2 (3), 25-30. Descriptive Statistics for Educational
AP * Statistics Review
 AP * Statistics Review Normal Models and Sampling Distributions Teacher Packet AP* is a trademark of the College Entrance Examination Board. The College Entrance Examination Board was not involved in the
SOLUTIONS TO THE LAB 1 ASSIGNMENT
 SOLUTIONS TO THE LAB 1 ASSIGNMENT Question 1 Excel produces the following histogram of pull strengths for the 100 resistors: 2 20 Histogram of Pull Strengths (lb) Frequency 1 10 0 9 61 63 6 67 69 71 73
The Standard Deviation as a Ruler and the Normal Model. Copyright 2009 Pearson Education, Inc.
 The Standard Deviation as a Ruler and the Normal Mol Copyright 2009 Pearson Education, Inc. The trick in comparing very different-looking values is to use standard viations as our rulers. The standard
1 Exercise One. 1.1 Calculate the mean ROI. Note that the data is not grouped! Below you find the raw data in tabular form:
 1 Exercise One Note that the data is not grouped! 1.1 Calculate the mean ROI Below you find the raw data in tabular form: Obs Data 1 18.5 2 18.6 3 17.4 4 12.2 5 19.7 6 5.6 7 7.7 8 9.8 9 19.9 10 9.9 11
5.1 Mean, Median, & Mode
 5.1 Mean, Median, & Mode definitions Mean: Median: Mode: Example 1 The Blue Jays score these amounts of runs in their last 9 games: 4, 7, 2, 4, 10, 5, 6, 7, 7 Find the mean, median, and mode: Example 2
NORMAL RANDOM VARIABLES (Normal or gaussian distribution)
") NORMAL RANDOM VARIABLES (Normal or gaussian distribution) Many variables, as pregnancy lengths, foot sizes etc.. exhibit a normal distribution. The shape of the distribution is a symmetric bell shape.
NORMAL RANDOM VARIABLES (Normal or gaussian distribution) Many variables, as pregnancy lengths, foot sizes etc.. exhibit a normal distribution. The shape of the distribution is a symmetric bell shape.
Math 120 Introduction to Statistics Mr. Toner s Lecture Notes. Standardizing normal distributions The Standard Normal Curve
 6.1 6.2 The Standard Normal Curve Standardizing normal distributions The "bell-shaped" curve, or normal curve, is a probability distribution that describes many reallife situations. Basic Properties 1.
Lecture Slides. Elementary Statistics Tenth Edition. by Mario F. Triola. and the Triola Statistics Series. Slide 1
 Lecture Slides Elementary Statistics Tenth Edition and the Triola Statistics Series by Mario F. Triola Slide 1 Chapter 6 Normal Probability Distributions 6-1 Overview 6-2 The Standard Normal Distribution
Getting to know a data-set (how to approach data) Overview: Descriptives & Graphing
 Overview: Descriptives & Graphing") Overview: Descriptives & Graphing 1. Getting to know a data set 2. LOM & types of statistics 3. Descriptive statistics 4. Normal distribution 5. Non-normal distributions 6. Effect of skew on central tendency
Overview: Descriptives & Graphing 1. Getting to know a data set 2. LOM & types of statistics 3. Descriptive statistics 4. Normal distribution 5. Non-normal distributions 6. Effect of skew on central tendency
Chapter 6: The Normal Distribution
 Chapter 6: The Normal Distribution Diana Pell Section 6.1: Normal Distributions Note: Recall that a continuous variable can assume all values between any two given values of the variables. Many continuous
Basic Procedure for Histograms
 Basic Procedure for Histograms 1. Compute the range of observations (min. & max. value) 2. Choose an initial # of classes (most likely based on the range of values, try and find a number of classes that
Stat 101 Exam 1 - Embers Important Formulas and Concepts 1
 1 Chapter 1 1.1 Definitions Stat 101 Exam 1 - Embers Important Formulas and Concepts 1 1. Data Any collection of numbers, characters, images, or other items that provide information about something. 2.
No, because np = 100(0.02) = 2. The value of np must be greater than or equal to 5 to use the normal approximation.
 = 2. The value of np must be greater than or equal to 5 to use the normal approximation.") 1) If n 100 and p 0.02 in a binomial experiment, does this satisfy the rule for a normal approximation? Why or why not? No, because np 100(0.02) 2. The value of np must be greater than or equal to 5 to
1) If n 100 and p 0.02 in a binomial experiment, does this satisfy the rule for a normal approximation? Why or why not? No, because np 100(0.02) 2. The value of np must be greater than or equal to 5 to
Review: Chebyshev s Rule. Measures of Dispersion II. Review: Empirical Rule. Review: Empirical Rule. Auto Batteries Example, p 59.
 Review: Chebyshev s Rule Measures of Dispersion II Tom Ilvento STAT 200 Is based on a mathematical theorem for any data At least ¾ of the measurements will fall within ± 2 standard deviations from the
Section3-2: Measures of Center
 Chapter 3 Section3-: Measures of Center Notation Suppose we are making a series of observations, n of them, to be exact. Then we write x 1, x, x 3,K, x n as the values we observe. Thus n is the total number
Summary of Statistical Analysis Tools EDAD 5630
 Summary of Statistical Analysis Tools EDAD 5630 Test Name Program Used Purpose Steps Main Uses/Applications in Schools Principal Component Analysis SPSS Measure Underlying Constructs Reliability SPSS Measure
Homework: Due Wed, Feb 20 th. Chapter 8, # 60a + 62a (count together as 1), 74, 82
, 74, 82") Announcements: Week 5 quiz begins at 4pm today and ends at 3pm on Wed If you take more than 20 minutes to complete your quiz, you will only receive partial credit. (It doesn t cut you off.) Today: Sections
Announcements: Week 5 quiz begins at 4pm today and ends at 3pm on Wed If you take more than 20 minutes to complete your quiz, you will only receive partial credit. (It doesn t cut you off.) Today: Sections
Chapter Seven: Confidence Intervals and Sample Size
 Chapter Seven: Confidence Intervals and Sample Size A point estimate is: The best point estimate of the population mean µ is the sample mean X. Three Properties of a Good Estimator 1. Unbiased 2. Consistent
Lecture 6: Normal distribution
 Lecture 6: Normal distribution Statistics 101 Mine Çetinkaya-Rundel February 2, 2012 Announcements Announcements HW 1 due now. Due: OQ 2 by Monday morning 8am. Statistics 101 (Mine Çetinkaya-Rundel) L6:
3.1 Measures of Central Tendency
 3.1 Measures of Central Tendency n Summation Notation x i or x Sum observation on the variable that appears to the right of the summation symbol. Example 1 Suppose the variable x i is used to represent
Making Sense of Cents
 Name: Date: Making Sense of Cents Exploring the Central Limit Theorem Many of the variables that you have studied so far in this class have had a normal distribution. You have used a table of the normal
Previously, when making inferences about the population mean, μ, we were assuming the following simple conditions:
 Chapter 17 Inference about a Population Mean Conditions for inference Previously, when making inferences about the population mean, μ, we were assuming the following simple conditions: (1) Our data (observations)
Statistics for Managers Using Microsoft Excel 7 th Edition
 Statistics for Managers Using Microsoft Excel 7 th Edition Chapter 7 Sampling Distributions Statistics for Managers Using Microsoft Excel 7e Copyright 2014 Pearson Education, Inc. Chap 7-1 Learning Objectives
BIOL The Normal Distribution and the Central Limit Theorem
 BIOL 300 - The Normal Distribution and the Central Limit Theorem In the first week of the course, we introduced a few measures of center and spread, and discussed how the mean and standard deviation are
In a binomial experiment of n trials, where p = probability of success and q = probability of failure. mean variance standard deviation
 Name In a binomial experiment of n trials, where p = probability of success and q = probability of failure mean variance standard deviation µ = n p σ = n p q σ = n p q Notation X ~ B(n, p) The probability
Central Limit Theorem
 Central Limit Theorem Lots of Samples 1 Homework Read Sec 6-5. Discussion Question pg 329 Do Ex 6-5 8-15 2 Objective Use the Central Limit Theorem to solve problems involving sample means 3 Sample Means
The normal distribution is a theoretical model derived mathematically and not empirically.
 Sociology 541 The Normal Distribution Probability and An Introduction to Inferential Statistics Normal Approximation The normal distribution is a theoretical model derived mathematically and not empirically.
Sampling Distribution of and Simulation Methods. Ontario Public Sector Salaries. Strange Sample? Lecture 11. Reading: Sections
 Sampling Distribution of and Simulation Methods Lecture 11 Reading: Sections 1.3 1.5 1 Ontario Public Sector Salaries Public Sector Salary Disclosure Act, 1996 Requires organizations that receive public
Normal Probability Distributions
 Normal Probability Distributions Properties of Normal Distributions The most important probability distribution in statistics is the normal distribution. Normal curve A normal distribution is a continuous
Measures of Central Tendency: Ungrouped Data. Mode. Median. Mode -- Example. Median: Example with an Odd Number of Terms
 Measures of Central Tendency: Ungrouped Data Measures of central tendency yield information about particular places or locations in a group of numbers. Common Measures of Location Mode Median Percentiles
Quantitative Methods for Economics, Finance and Management (A86050 F86050)
") Quantitative Methods for Economics, Finance and Management (A86050 F86050) Matteo Manera matteo.manera@unimib.it Marzio Galeotti marzio.galeotti@unimi.it 1 This material is taken and adapted from Guy Judge
Quantitative Methods for Economics, Finance and Management (A86050 F86050) Matteo Manera matteo.manera@unimib.it Marzio Galeotti marzio.galeotti@unimi.it 1 This material is taken and adapted from Guy Judge
Prob and Stats, Nov 7
 Prob and Stats, Nov 7 The Standard Normal Distribution Book Sections: 7.1, 7.2 Essential Questions: What is the standard normal distribution, how is it related to all other normal distributions, and how
T.I.H.E. IT 233 Statistics and Probability: Sem. 1: 2013 ESTIMATION
 In Inferential Statistic, ESTIMATION (i) (ii) is called the True Population Mean and is called the True Population Proportion. You must also remember that are not the only population parameters. There
15.063: Communicating with Data Summer Recitation 4 Probability III
 15.063: Communicating with Data Summer 2003 Recitation 4 Probability III Today s Content Normal RV Central Limit Theorem (CLT) Statistical Sampling 15.063, Summer '03 2 Normal Distribution Any normal RV
Sampling Distributions
 Section 8.1 119 Sampling Distributions Section 8.1 C H A P T E R 8 4Example 2 (pg. 378) Sampling Distribution of the Sample Mean The heights of 3-year-old girls are normally distributed with μ=38.72 and
8.2 The Standard Deviation as a Ruler Chapter 8 The Normal and Other Continuous Distributions 8-1
 8.2 The Standard Deviation as a Ruler Chapter 8 The Normal and Other Continuous Distributions For Example: On August 8, 2011, the Dow dropped 634.8 points, sending shock waves through the financial community.
Math 243 Lecture Notes
 Assume the average annual rainfall for in Portland is 36 inches per year with a standard deviation of 9 inches. Also assume that the average wind speed in Chicago is 10 mph with a standard deviation of
1. Distinguish three missing data mechanisms:
 1 DATA SCREENING I. Preliminary inspection of the raw data make sure that there are no obvious coding errors (e.g., all values for the observed variables are in the admissible range) and that all variables