Exploring Data and Graphics
|
|
|
- Elinor Perkins
- 6 years ago
- Views:
Transcription
1 Exploring Data and Graphics Rick White Department of Statistics, UBC Graduate Pathways to Success Graduate & Postdoctoral Studies November 13, 2013
2 Outline Summarizing Data Types of Data Visualizing Data Questions
3 Moments Quantitative measures of the shape of a set of points 1st raw moment: mean (center) 2nd central moment: variance (width) Sqrt of variance is standard deviation 3rd central moment: skewness (lopsidedness) 4th central moment: kurtosis (how fat is the data) Mixed moments are co moments (covariance) Covariance is standardized to correlation Moments are susceptible to outliers
4 Computing Moments Computing the kth raw moment: Raise each observation to the kth power Sum all the data Divide by th number of observations Computing the kth central moment: Compute the mean of the data Subtract the mean from all observed data Proceed as for a raw moment Standardized kth moment (k > 2) Based on the variance
5 The different means The arithmetic mean (or simply "mean") of a sample is the sum the sampled values divided by the number of items in the sample. The geometric mean is an average that is useful for sets of positive numbers. Take the nth root of the product of the data points. Or log the data, compute the arithmetic mean, exponentiate result. There are many other types of means.
6 Quantiles Points that split the ordered data into equal sized groups 2 groups: median (50%) 3 groups: terciles (33%) 4 groups: quartiles (25%) 5 groups: quintiles (20%) 10 groups: deciles (10%) 100 groups: percentiles (1%)
7 Wikipedia A good source of information Website Moment (mathematics) Mean Variance Quantiles Many ways to estimate
8 Example Distributions distribution Mean Variance Skewness Kurtosis Normal Negative Binomial Gamma distribution 1% 25% 50% 75% 90% 99% Normal Negative Binomial Gamma
9 Tabulating Data Only useful if data takes on relatively few different values Data can be binned to reduce the number of distinct values. Count the number of items in each bin To express as a percentage: divide the number of items in each bin by the total number of items and multiply by 100.
10 Types of Data Nominal scale Differentiated by label but no logical order Ordinal scale Differentiate by rank order: data can be sorted Interval scale Numeric data with an arbitrarily defined zero. Ratio scale Numeric data with a meaningful zero
11 Nominal scale Gender, Ethnicity, Species, Genre Moments are undefined Arithmetic is meaningless (+, -, *, /) Quantiles are undefined Only Logical operation is equality Central tendency: mode (most common value) Generally not of much value Data can be tabulated
12 Ordinal scale Likert scales; descriptive size Moments are undefined Arithmetic is meaningless (+, -, *, /) Quantiles are defined Logical operations: =, <, >=, etc Central tendency: median, mode Generally not of much value Data can be tabulated
13 Interval scale Celcius, date of event Moments and Quantiles are defined Central tendency: mean (arithmetic), median Dispersion: standard deviation, inter-quartile range Data usually cannot be tabulated without some manipulation Ratio of observations is meaningless but ratio of differences is interpretable
14 Ratio scale Height, length, duration Moments and Quantiles are defined Central tendency: arithmetic mean, geometric mean, median Dispersion: standard deviation, inter-quartile range, coefficient of variation Data usually cannot be tabulated without some manipulation Ratio of observations is meaningful
15 Graphics Purpose of a graphic is to communicate information in a clear and effective manner. A graphic is more effective at conveying information than a table of numbers. A graphic need not be complex to be effective. If something is present on a graphic it should serve a purpose.
16 One Variable Categorical variables (ordinal or nominal) Pie Charts (not recommended) The eye is good at judging linear measures and bad at judging relative areas. Barcharts or dotplots Numeric variables (interval or ratio) Barchart with error bars (not recommended) Too much information is lost Boxplots, histograms, density plots

17 Pie Charts: Are any the same?

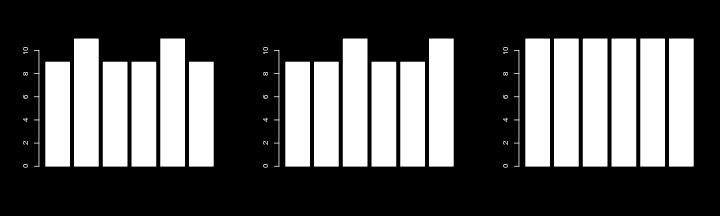
18 Barcharts: Are any the same?

19 Barchart with errors Barchart for numeric data Bar height represents the mean. Whisker represents the SD Is the data the same?

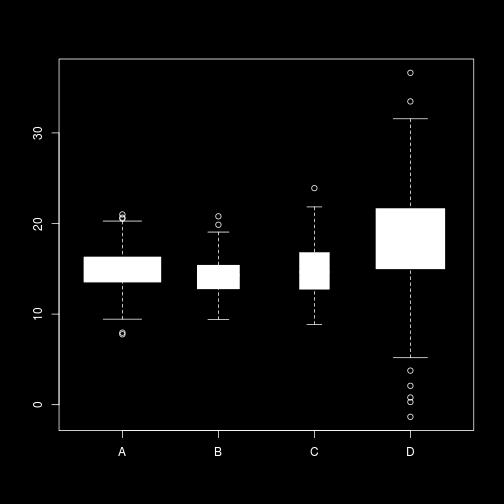
20 Box and Whiskers plot Boxplots. Center line: Median Box: Q1 to Q3 Whiskers: Max & Min Each has same mean and SD but is the data the same?


21 Histogram and Density Plots
22 Two variables Both categorical Stacked barchart (not recommended) Side by side barchart One categorical, one numeric Side by side boxplots Histogram or Density plot within each category Both numeric scatterplot


23 Stacked Barchart Compare the relative size of each colour category within each bar and between the different bars. Are the different sizes obvious?

24 Side by side barchart Can you tell the difference if we make it a side by side bar chart?
25 Side by side boxplot

26 Adding more information
27 Same Scale Histogram/Density

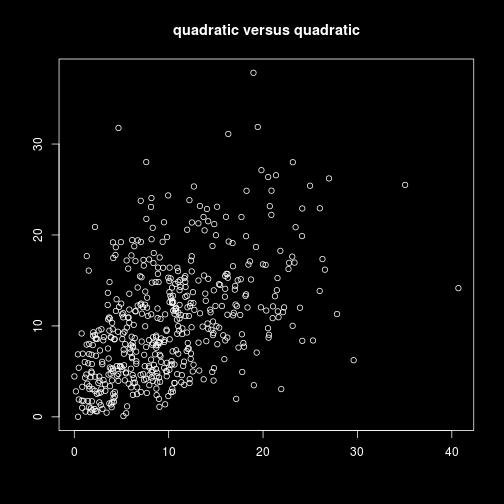
28 Scatterplots Scatterplots show the type of relationship that exists between two numeric variables. This is an example of a linear relationship.
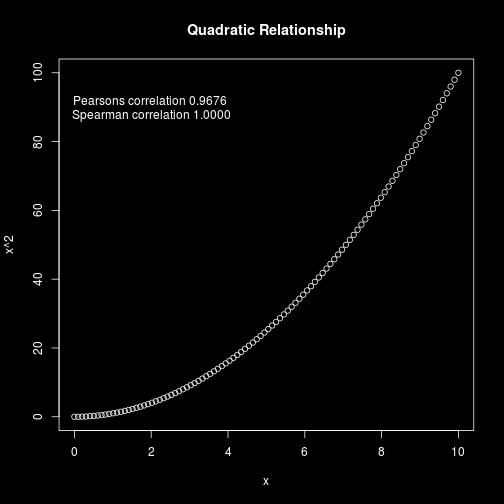
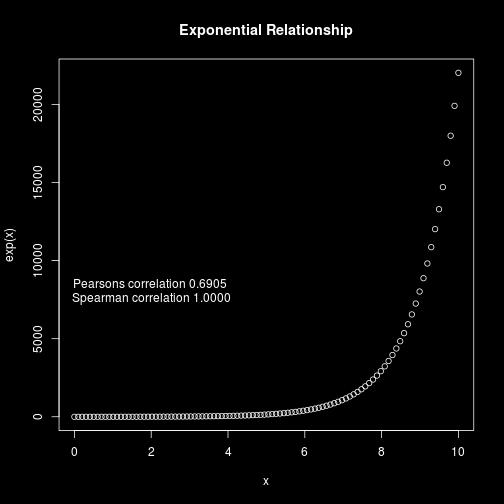
29 Other Relationships
30 Other Relationships
31 Outlier Detection

32 Scatterplots with too many points can appear as a big blob of ink Overplotting
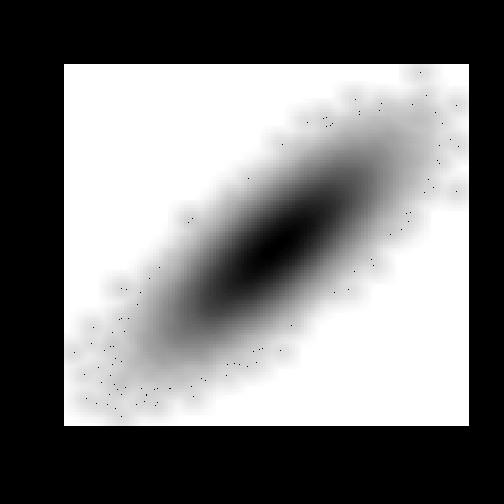

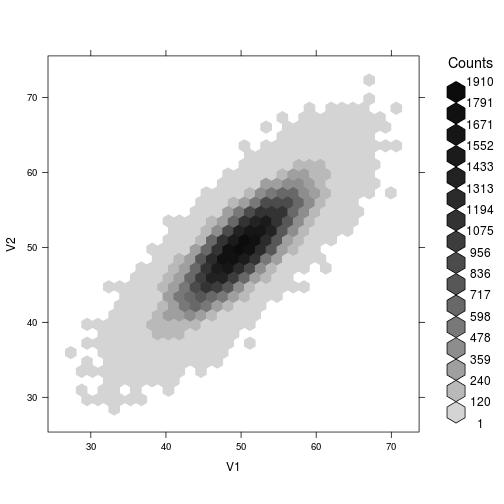
33 Overplotting option
34 Demonstration in R R is a free software programming language and a software environment for statistical computing and graphics. RStudio IDE is a powerful and productive user interface for R. It s free and open source, and works great on Windows, Mac, and Linux.
35 Questions Column 1 Column 2 Column Row 1 Row 2 Row 3 Row 4
2 Exploring Univariate Data
 2 Exploring Univariate Data A good picture is worth more than a thousand words! Having the data collected we examine them to get a feel for they main messages and any surprising features, before attempting
DATA SUMMARIZATION AND VISUALIZATION
 APPENDIX DATA SUMMARIZATION AND VISUALIZATION PART 1 SUMMARIZATION 1: BUILDING BLOCKS OF DATA ANALYSIS 294 PART 2 PART 3 PART 4 VISUALIZATION: GRAPHS AND TABLES FOR SUMMARIZING AND ORGANIZING DATA 296
Summarising Data. Summarising Data. Examples of Types of Data. Types of Data
 Summarising Data Summarising Data Mark Lunt Arthritis Research UK Epidemiology Unit University of Manchester Today we will consider Different types of data Appropriate ways to summarise these data 17/10/2017
Math 2311 Bekki George Office Hours: MW 11am to 12:45pm in 639 PGH Online Thursdays 4-5:30pm And by appointment
 Math 2311 Bekki George bekki@math.uh.edu Office Hours: MW 11am to 12:45pm in 639 PGH Online Thursdays 4-5:30pm And by appointment Class webpage: http://www.math.uh.edu/~bekki/math2311.html Math 2311 Class
Description of Data I
 Description of Data I (Summary and Variability measures) Objectives: Able to understand how to summarize the data Able to understand how to measure the variability of the data Able to use and interpret
Contents Part I Descriptive Statistics 1 Introduction and Framework Population, Sample, and Observations Variables Quali
 Part I Descriptive Statistics 1 Introduction and Framework... 3 1.1 Population, Sample, and Observations... 3 1.2 Variables.... 4 1.2.1 Qualitative and Quantitative Variables.... 5 1.2.2 Discrete and Continuous
Some Characteristics of Data
 Some Characteristics of Data Not all data is the same, and depending on some characteristics of a particular dataset, there are some limitations as to what can and cannot be done with that data. Some key
Stat 101 Exam 1 - Embers Important Formulas and Concepts 1
 1 Chapter 1 1.1 Definitions Stat 101 Exam 1 - Embers Important Formulas and Concepts 1 1. Data Any collection of numbers, characters, images, or other items that provide information about something. 2.
Contents. An Overview of Statistical Applications CHAPTER 1. Contents (ix) Preface... (vii)
 Preface... (vii)") Contents (ix) Contents Preface... (vii) CHAPTER 1 An Overview of Statistical Applications 1.1 Introduction... 1 1. Probability Functions and Statistics... 1..1 Discrete versus Continuous Functions... 1..
Contents (ix) Contents Preface... (vii) CHAPTER 1 An Overview of Statistical Applications 1.1 Introduction... 1 1. Probability Functions and Statistics... 1..1 Discrete versus Continuous Functions... 1..
MVE051/MSG Lecture 7
 MVE051/MSG810 2017 Lecture 7 Petter Mostad Chalmers November 20, 2017 The purpose of collecting and analyzing data Purpose: To build and select models for parts of the real world (which can be used for
Chapter 6 Simple Correlation and
 Contents Chapter 1 Introduction to Statistics Meaning of Statistics... 1 Definition of Statistics... 2 Importance and Scope of Statistics... 2 Application of Statistics... 3 Characteristics of Statistics...
Lecture 2 Describing Data
 Lecture 2 Describing Data Thais Paiva STA 111 - Summer 2013 Term II July 2, 2013 Lecture Plan 1 Types of data 2 Describing the data with plots 3 Summary statistics for central tendency and spread 4 Histograms
Chapter 3. Numerical Descriptive Measures. Copyright 2016 Pearson Education, Ltd. Chapter 3, Slide 1
 Chapter 3 Numerical Descriptive Measures Copyright 2016 Pearson Education, Ltd. Chapter 3, Slide 1 Objectives In this chapter, you learn to: Describe the properties of central tendency, variation, and
Simple Descriptive Statistics
 Simple Descriptive Statistics These are ways to summarize a data set quickly and accurately The most common way of describing a variable distribution is in terms of two of its properties: Central tendency
Descriptive Statistics
 Petra Petrovics Descriptive Statistics 2 nd seminar DESCRIPTIVE STATISTICS Definition: Descriptive statistics is concerned only with collecting and describing data Methods: - statistical tables and graphs
Basic Procedure for Histograms
 Basic Procedure for Histograms 1. Compute the range of observations (min. & max. value) 2. Choose an initial # of classes (most likely based on the range of values, try and find a number of classes that
9/17/2015. Basic Statistics for the Healthcare Professional. Relax.it won t be that bad! Purpose of Statistic. Objectives
 Basic Statistics for the Healthcare Professional 1 F R A N K C O H E N, M B B, M P A D I R E C T O R O F A N A L Y T I C S D O C T O R S M A N A G E M E N T, LLC Purpose of Statistic 2 Provide a numerical
Percentiles, STATA, Box Plots, Standardizing, and Other Transformations
 Percentiles, STATA, Box Plots, Standardizing, and Other Transformations Lecture 3 Reading: Sections 5.7 54 Remember, when you finish a chapter make sure not to miss the last couple of boxes: What Can Go
Introduction to Descriptive Statistics
 Introduction to Descriptive Statistics 17.871 Types of Variables ~Nominal (Quantitative) Nominal (Qualitative) categorical Ordinal Interval or ratio Describing data Moment Non-mean based measure Center
Graphical and Tabular Methods in Descriptive Statistics. Descriptive Statistics
 Graphical and Tabular Methods in Descriptive Statistics MATH 3342 Section 1.2 Descriptive Statistics n Graphs and Tables n Numerical Summaries Sections 1.3 and 1.4 1 Why graph data? n The amount of data
Some estimates of the height of the podium
 Some estimates of the height of the podium 24 36 40 40 40 41 42 44 46 48 50 53 65 98 1 5 number summary Inter quartile range (IQR) range = max min 2 1.5 IQR outlier rule 3 make a boxplot 24 36 40 40 40
KARACHI UNIVERSITY BUSINESS SCHOOL UNIVERSITY OF KARACHI BS (BBA) VI
 VI") 88 P a g e B S ( B B A ) S y l l a b u s KARACHI UNIVERSITY BUSINESS SCHOOL UNIVERSITY OF KARACHI BS (BBA) VI Course Title : STATISTICS Course Number : BA(BS) 532 Credit Hours : 03 Course 1. Statistical
88 P a g e B S ( B B A ) S y l l a b u s KARACHI UNIVERSITY BUSINESS SCHOOL UNIVERSITY OF KARACHI BS (BBA) VI Course Title : STATISTICS Course Number : BA(BS) 532 Credit Hours : 03 Course 1. Statistical
Describing Data: One Quantitative Variable
 STAT 250 Dr. Kari Lock Morgan The Big Picture Describing Data: One Quantitative Variable Population Sampling SECTIONS 2.2, 2.3 One quantitative variable (2.2, 2.3) Statistical Inference Sample Descriptive
Standardized Data Percentiles, Quartiles and Box Plots Grouped Data Skewness and Kurtosis
 Descriptive Statistics (Part 2) 4 Chapter Percentiles, Quartiles and Box Plots Grouped Data Skewness and Kurtosis McGraw-Hill/Irwin Copyright 2009 by The McGraw-Hill Companies, Inc. Chebyshev s Theorem
PSYCHOLOGICAL STATISTICS
 UNIVERSITY OF CALICUT SCHOOL OF DISTANCE EDUCATION B Sc COUNSELLING PSYCHOLOGY (2011 Admission Onwards) II Semester Complementary Course PSYCHOLOGICAL STATISTICS QUESTION BANK 1. The process of grouping
Table of Contents. New to the Second Edition... Chapter 1: Introduction : Social Research...
 iii Table of Contents Preface... xiii Purpose... xiii Outline of Chapters... xiv New to the Second Edition... xvii Acknowledgements... xviii Chapter 1: Introduction... 1 1.1: Social Research... 1 Introduction...
St. Xavier s College Autonomous Mumbai STATISTICS. F.Y.B.Sc. Syllabus For 1 st Semester Courses in Statistics (June 2015 onwards)
") St. Xavier s College Autonomous Mumbai STATISTICS F.Y.B.Sc Syllabus For 1 st Semester Courses in Statistics (June 2015 onwards) Contents: Theory Syllabus for Courses: S.STA.1.01 Descriptive Statistics
St. Xavier s College Autonomous Mumbai STATISTICS F.Y.B.Sc Syllabus For 1 st Semester Courses in Statistics (June 2015 onwards) Contents: Theory Syllabus for Courses: S.STA.1.01 Descriptive Statistics
STATISTICAL DISTRIBUTIONS AND THE CALCULATOR
 STATISTICAL DISTRIBUTIONS AND THE CALCULATOR 1. Basic data sets a. Measures of Center - Mean ( ): average of all values. Characteristic: non-resistant is affected by skew and outliers. - Median: Either
St. Xavier s College Autonomous Mumbai F.Y.B.A. Syllabus For 1 st Semester Course in Statistics (June 2017 onwards)
") St. Xavier s College Autonomous Mumbai Syllabus For 1 st Semester Course in Statistics (June 2017 onwards) Contents: Theory Syllabus for Courses: A.STA.1.01 Descriptive Statistics (A). Practical Course
St. Xavier s College Autonomous Mumbai Syllabus For 1 st Semester Course in Statistics (June 2017 onwards) Contents: Theory Syllabus for Courses: A.STA.1.01 Descriptive Statistics (A). Practical Course
AP STATISTICS FALL SEMESTSER FINAL EXAM STUDY GUIDE
 AP STATISTICS Name: FALL SEMESTSER FINAL EXAM STUDY GUIDE Period: *Go over Vocabulary Notecards! *This is not a comprehensive review you still should look over your past notes, homework/practice, Quizzes,
34.S-[F] SU-02 June All Syllabus Science Faculty B.Sc. I Yr. Stat. [Opt.] [Sem.I & II] - 1 -
![34.S-[F] SU-02 June All Syllabus Science Faculty B.Sc. I Yr. Stat. [Opt.] [Sem.I & II] - 1 -](/thumbs/87/96342487.jpg "34.S-[F] SU-02 June All Syllabus Science Faculty B.Sc. I Yr. Stat. [Opt.] [Sem.I & II] - 1 -") [Sem.I & II] - 1 - [Sem.I & II] - 2 - [Sem.I & II] - 3 - Syllabus of B.Sc. First Year Statistics [Optional ] Sem. I & II effect for the academic year 2014 2015 [Sem.I & II] - 4 - SYLLABUS OF F.Y.B.Sc.
[Sem.I & II] - 1 - [Sem.I & II] - 2 - [Sem.I & II] - 3 - Syllabus of B.Sc. First Year Statistics [Optional ] Sem. I & II effect for the academic year 2014 2015 [Sem.I & II] - 4 - SYLLABUS OF F.Y.B.Sc.
Categorical. A general name for non-numerical data; the data is separated into categories of some kind.
 Chapter 5 Categorical A general name for non-numerical data; the data is separated into categories of some kind. Nominal data Categorical data with no implied order. Eg. Eye colours, favourite TV show,
Getting to know a data-set (how to approach data) Overview: Descriptives & Graphing
 Overview: Descriptives & Graphing") Overview: Descriptives & Graphing 1. Getting to know a data set 2. LOM & types of statistics 3. Descriptive statistics 4. Normal distribution 5. Non-normal distributions 6. Effect of skew on central tendency
Overview: Descriptives & Graphing 1. Getting to know a data set 2. LOM & types of statistics 3. Descriptive statistics 4. Normal distribution 5. Non-normal distributions 6. Effect of skew on central tendency
Exploratory Data Analysis
 Exploratory Data Analysis Stemplots (or Stem-and-leaf plots) Stemplot and Boxplot T -- leading digits are called stems T -- final digits are called leaves STAT 74 Descriptive Statistics 2 Example: (number
appstats5.notebook September 07, 2016 Chapter 5
 Chapter 5 Describing Distributions Numerically Chapter 5 Objective: Students will be able to use statistics appropriate to the shape of the data distribution to compare of two or more different data sets.
32.S [F] SU 02 June All Syllabus Science Faculty B.A. I Yr. Stat. [Opt.] [Sem.I & II] 1
![32.S [F] SU 02 June All Syllabus Science Faculty B.A. I Yr. Stat. [Opt.] [Sem.I & II] 1](/thumbs/87/96342483.jpg "32.S [F] SU 02 June All Syllabus Science Faculty B.A. I Yr. Stat. [Opt.] [Sem.I & II] 1") 32.S [F] SU 02 June 2014 2015 All Syllabus Science Faculty B.A. I Yr. Stat. [Opt.] [Sem.I & II] 1 32.S [F] SU 02 June 2014 2015 All Syllabus Science Faculty B.A. I Yr. Stat. [Opt.] [Sem.I & II] 2 32.S
32.S [F] SU 02 June 2014 2015 All Syllabus Science Faculty B.A. I Yr. Stat. [Opt.] [Sem.I & II] 1 32.S [F] SU 02 June 2014 2015 All Syllabus Science Faculty B.A. I Yr. Stat. [Opt.] [Sem.I & II] 2 32.S
Descriptive Statistics Bios 662
 Descriptive Statistics Bios 662 Michael G. Hudgens, Ph.D. mhudgens@bios.unc.edu http://www.bios.unc.edu/ mhudgens 2008-08-19 08:51 BIOS 662 1 Descriptive Statistics Descriptive Statistics Types of variables
Monte Carlo Simulation (General Simulation Models)
") Monte Carlo Simulation (General Simulation Models) Revised: 10/11/2017 Summary... 1 Example #1... 1 Example #2... 10 Summary Monte Carlo simulation is used to estimate the distribution of variables when
Monte Carlo Simulation (General Simulation Models) Revised: 10/11/2017 Summary... 1 Example #1... 1 Example #2... 10 Summary Monte Carlo simulation is used to estimate the distribution of variables when
CHAPTER 2 Describing Data: Numerical
 CHAPTER Multiple-Choice Questions 1. A scatter plot can illustrate all of the following except: A) the median of each of the two variables B) the range of each of the two variables C) an indication of
Empirical Rule (P148)
") Interpreting the Standard Deviation Numerical Descriptive Measures for Quantitative data III Dr. Tom Ilvento FREC 408 We can use the standard deviation to express the proportion of cases that might fall
Interpreting the Standard Deviation Numerical Descriptive Measures for Quantitative data III Dr. Tom Ilvento FREC 408 We can use the standard deviation to express the proportion of cases that might fall
Week 1 Variables: Exploration, Familiarisation and Description. Descriptive Statistics.
 Week 1 Variables: Exploration, Familiarisation and Description. Descriptive Statistics. Convergent validity: the degree to which results/evidence from different tests/sources, converge on the same conclusion.
Frequency Distribution and Summary Statistics
 Frequency Distribution and Summary Statistics Dongmei Li Department of Public Health Sciences Office of Public Health Studies University of Hawai i at Mānoa Outline 1. Stemplot 2. Frequency table 3. Summary
The Range, the Inter Quartile Range (or IQR), and the Standard Deviation (which we usually denote by a lower case s).
, and the Standard Deviation (which we usually denote by a lower case s).") We will look the three common and useful measures of spread. The Range, the Inter Quartile Range (or IQR), and the Standard Deviation (which we usually denote by a lower case s). 1 Ameasure of the center
We will look the three common and useful measures of spread. The Range, the Inter Quartile Range (or IQR), and the Standard Deviation (which we usually denote by a lower case s). 1 Ameasure of the center
Steps with data (how to approach data)
") Descriptives & Graphing Lecture 3 Survey Research & Design in Psychology James Neill, 216 Creative Commons Attribution 4. Overview: Descriptives & Graphing 1. Steps with data 2. Level of measurement &
Descriptives & Graphing Lecture 3 Survey Research & Design in Psychology James Neill, 216 Creative Commons Attribution 4. Overview: Descriptives & Graphing 1. Steps with data 2. Level of measurement &
MEASURES OF CENTRAL TENDENCY & VARIABILITY + NORMAL DISTRIBUTION
 MEASURES OF CENTRAL TENDENCY & VARIABILITY + NORMAL DISTRIBUTION 1 Day 3 Summer 2017.07.31 DISTRIBUTION Symmetry Modality 单峰, 双峰 Skewness 正偏或负偏 Kurtosis 2 3 CHAPTER 4 Measures of Central Tendency 集中趋势
Section 6-1 : Numerical Summaries
 MAT 2377 (Winter 2012) Section 6-1 : Numerical Summaries With a random experiment comes data. In these notes, we learn techniques to describe the data. Data : We will denote the n observations of the random
HIGHER SECONDARY I ST YEAR STATISTICS MODEL QUESTION PAPER
 HIGHER SECONDARY I ST YEAR STATISTICS MODEL QUESTION PAPER Time - 2½ Hrs Max. Marks - 70 PART - I 15 x 1 = 15 Answer all the Questions I. Choose the Best Answer 1. Statistics may be called the Science
Fundamentals of Statistics
 CHAPTER 4 Fundamentals of Statistics Expected Outcomes Know the difference between a variable and an attribute. Perform mathematical calculations to the correct number of significant figures. Construct
Introduction to Computational Finance and Financial Econometrics Descriptive Statistics
 You can t see this text! Introduction to Computational Finance and Financial Econometrics Descriptive Statistics Eric Zivot Summer 2015 Eric Zivot (Copyright 2015) Descriptive Statistics 1 / 28 Outline
Summary of Information from Recapitulation Report Submittals (DR-489 series, DR-493, Central Assessment, Agricultural Schedule):
:") County: Martin Study Type: 2014 - In-Depth The department approved your preliminary assessment roll for 2014. Roll approval statistical summary reports and graphics for 2014 are attached for additional
County: Martin Study Type: 2014 - In-Depth The department approved your preliminary assessment roll for 2014. Roll approval statistical summary reports and graphics for 2014 are attached for additional
Chapter 4-Describing Data: Displaying and Exploring Data
 Chapter 4-Describing Data: Displaying and Exploring Data Jie Zhang, Ph.D. Student Account and Information Systems Department College of Business Administration The University of Texas at El Paso jzhang6@utep.edu
MBEJ 1023 Dr. Mehdi Moeinaddini Dept. of Urban & Regional Planning Faculty of Built Environment
 MBEJ 1023 Planning Analytical Methods Dr. Mehdi Moeinaddini Dept. of Urban & Regional Planning Faculty of Built Environment Contents What is statistics? Population and Sample Descriptive Statistics Inferential
Getting to know data. Play with data get to know it. Image source: Descriptives & Graphing
 Descriptives & Graphing Getting to know data (how to approach data) Lecture 3 Image source: http://commons.wikimedia.org/wiki/file:3d_bar_graph_meeting.jpg Survey Research & Design in Psychology James
CSC Advanced Scientific Programming, Spring Descriptive Statistics
 CSC 223 - Advanced Scientific Programming, Spring 2018 Descriptive Statistics Overview Statistics is the science of collecting, organizing, analyzing, and interpreting data in order to make decisions.
1 Describing Distributions with numbers
 1 Describing Distributions with numbers Only for quantitative variables!! 1.1 Describing the center of a data set The mean of a set of numerical observation is the familiar arithmetic average. To write
STAT 113 Variability
 STAT 113 Variability Colin Reimer Dawson Oberlin College September 14, 2017 1 / 48 Outline Last Time: Shape and Center Variability Boxplots and the IQR Variance and Standard Deviaton Transformations 2
Lecture 1: Review and Exploratory Data Analysis (EDA)
") Lecture 1: Review and Exploratory Data Analysis (EDA) Ani Manichaikul amanicha@jhsph.edu 16 April 2007 1 / 40 Course Information I Office hours For questions and help When? I ll announce this tomorrow
Lecture 1: Review and Exploratory Data Analysis (EDA) Ani Manichaikul amanicha@jhsph.edu 16 April 2007 1 / 40 Course Information I Office hours For questions and help When? I ll announce this tomorrow
A LEVEL MATHEMATICS ANSWERS AND MARKSCHEMES SUMMARY STATISTICS AND DIAGRAMS. 1. a) 45 B1 [1] b) 7 th value 37 M1 A1 [2]
![A LEVEL MATHEMATICS ANSWERS AND MARKSCHEMES SUMMARY STATISTICS AND DIAGRAMS. 1. a) 45 B1 [1] b) 7 th value 37 M1 A1 [2]](/thumbs/81/83043398.jpg "A LEVEL MATHEMATICS ANSWERS AND MARKSCHEMES SUMMARY STATISTICS AND DIAGRAMS. 1. a) 45 B1 [1] b) 7 th value 37 M1 A1 [2]") 1. a) 45 [1] b) 7 th value 37 [] n c) LQ : 4 = 3.5 4 th value so LQ = 5 3 n UQ : 4 = 9.75 10 th value so UQ = 45 IQR = 0 f.t. d) Median is closer to upper quartile Hence negative skew [] Page 1 . a) Orders
1. a) 45 [1] b) 7 th value 37 [] n c) LQ : 4 = 3.5 4 th value so LQ = 5 3 n UQ : 4 = 9.75 10 th value so UQ = 45 IQR = 0 f.t. d) Median is closer to upper quartile Hence negative skew [] Page 1 . a) Orders
Descriptive Statistics (Devore Chapter One)
") Descriptive Statistics (Devore Chapter One) 1016-345-01 Probability and Statistics for Engineers Winter 2010-2011 Contents 0 Perspective 1 1 Pictorial and Tabular Descriptions of Data 2 1.1 Stem-and-Leaf
Descriptive Statistics (Devore Chapter One) 1016-345-01 Probability and Statistics for Engineers Winter 2010-2011 Contents 0 Perspective 1 1 Pictorial and Tabular Descriptions of Data 2 1.1 Stem-and-Leaf
IMPORTING & MANAGING FINANCIAL DATA IN PYTHON. Summarize your data with descriptive stats
 IMPORTING & MANAGING FINANCIAL DATA IN PYTHON Summarize your data with descriptive stats Be on top of your data Goal: Capture key quantitative characteristics Important angles to look at: Central tendency:
Subject CS1 Actuarial Statistics 1 Core Principles. Syllabus. for the 2019 exams. 1 June 2018
 ` Subject CS1 Actuarial Statistics 1 Core Principles Syllabus for the 2019 exams 1 June 2018 Copyright in this Core Reading is the property of the Institute and Faculty of Actuaries who are the sole distributors.
Descriptive Statistics
 Chapter 3 Descriptive Statistics Chapter 2 presented graphical techniques for organizing and displaying data. Even though such graphical techniques allow the researcher to make some general observations
Descriptive Analysis
 Descriptive Analysis HERTANTO WAHYU SUBAGIO Univariate Analysis Univariate analysis involves the examination across cases of one variable at a time. There are three major characteristics of a single variable
STAB22 section 1.3 and Chapter 1 exercises
 STAB22 section 1.3 and Chapter 1 exercises 1.101 Go up and down two times the standard deviation from the mean. So 95% of scores will be between 572 (2)(51) = 470 and 572 + (2)(51) = 674. 1.102 Same idea
Numerical Descriptions of Data
 Numerical Descriptions of Data Measures of Center Mean x = x i n Excel: = average ( ) Weighted mean x = (x i w i ) w i x = data values x i = i th data value w i = weight of the i th data value Median =
3.1 Measures of Central Tendency
 3.1 Measures of Central Tendency n Summation Notation x i or x Sum observation on the variable that appears to the right of the summation symbol. Example 1 Suppose the variable x i is used to represent
Measures of Dispersion (Range, standard deviation, standard error) Introduction
 Introduction") Measures of Dispersion (Range, standard deviation, standard error) Introduction We have already learnt that frequency distribution table gives a rough idea of the distribution of the variables in a sample
Measures of Dispersion (Range, standard deviation, standard error) Introduction We have already learnt that frequency distribution table gives a rough idea of the distribution of the variables in a sample
GOALS. Describing Data: Displaying and Exploring Data. Dot Plots - Examples. Dot Plots. Dot Plot Minitab Example. Stem-and-Leaf.
 Describing Data: Displaying and Exploring Data Chapter 4 GOALS 1. Develop and interpret a dot plot.. Develop and interpret a stem-and-leaf display. 3. Compute and understand quartiles, deciles, and percentiles.
Lecture Data Science
 Web Science & Technologies University of Koblenz Landau, Germany Lecture Data Science Statistics Foundations JProf. Dr. Claudia Wagner Learning Goals How to describe sample data? What is mode/median/mean?
MATHEMATICS APPLIED TO BIOLOGICAL SCIENCES MVE PA 07. LP07 DESCRIPTIVE STATISTICS - Calculating of statistical indicators (1)
") LP07 DESCRIPTIVE STATISTICS - Calculating of statistical indicators (1) Descriptive statistics are ways of summarizing large sets of quantitative (numerical) information. The best way to reduce a set of
LP07 DESCRIPTIVE STATISTICS - Calculating of statistical indicators (1) Descriptive statistics are ways of summarizing large sets of quantitative (numerical) information. The best way to reduce a set of
Quantitative Analysis and Empirical Methods
 3) Descriptive Statistics Sciences Po, Paris, CEE / LIEPP Introduction Data and statistics Introduction to distributions Measures of central tendency Measures of dispersion Skewness Data and Statistics
SUMMARY STATISTICS EXAMPLES AND ACTIVITIES
 Session 6 SUMMARY STATISTICS EXAMPLES AD ACTIVITIES Example 1.1 Expand the following: 1. X 2. 2 6 5 X 3. X 2 4 3 4 4. X 4 2 Solution 1. 2 3 2 X X X... X 2. 6 4 X X X X 4 5 6 5 3. X 2 X 3 2 X 4 2 X 5 2
Basic Data Analysis. Stephen Turnbull Business Administration and Public Policy Lecture 3: April 25, Abstract
 Basic Data Analysis Stephen Turnbull Business Administration and Public Policy Lecture 3: April 25, 2013 Abstract Review summary statistics and measures of location. Discuss the placement exam as an exercise
Dot Plot: A graph for displaying a set of data. Each numerical value is represented by a dot placed above a horizontal number line.
 Introduction We continue our study of descriptive statistics with measures of dispersion, such as dot plots, stem and leaf displays, quartiles, percentiles, and box plots. Dot plots, a stem-and-leaf display,
Monetary Economics Measuring Asset Returns. Gerald P. Dwyer Fall 2015
 Monetary Economics Measuring Asset Returns Gerald P. Dwyer Fall 2015 WSJ Readings Readings this lecture, Cuthbertson Ch. 9 Readings next lecture, Cuthbertson, Chs. 10 13 Measuring Asset Returns Outline
DESCRIPTIVE STATISTICS II. Sorana D. Bolboacă
 DESCRIPTIVE STATISTICS II Sorana D. Bolboacă OUTLINE Measures of centrality Measures of spread Measures of symmetry Measures of localization Mainly applied on quantitative variables 2 DESCRIPTIVE STATISTICS
Introduction to R (2)
") Introduction to R (2) Boxplots Boxplots are highly efficient tools for the representation of the data distributions. The five number summary can be located in boxplots. Additionally, we can distinguish
Introduction to R (2) Boxplots Boxplots are highly efficient tools for the representation of the data distributions. The five number summary can be located in boxplots. Additionally, we can distinguish
Data Distributions and Normality
 Data Distributions and Normality Definition (Non)Parametric Parametric statistics assume that data come from a normal distribution, and make inferences about parameters of that distribution. These statistical
Monte Carlo Simulation (Random Number Generation)
") Monte Carlo Simulation (Random Number Generation) Revised: 10/11/2017 Summary... 1 Data Input... 1 Analysis Options... 6 Summary Statistics... 6 Box-and-Whisker Plots... 7 Percentiles... 9 Quantile Plots...
Monte Carlo Simulation (Random Number Generation) Revised: 10/11/2017 Summary... 1 Data Input... 1 Analysis Options... 6 Summary Statistics... 6 Box-and-Whisker Plots... 7 Percentiles... 9 Quantile Plots...
Overview/Outline. Moving beyond raw data. PSY 464 Advanced Experimental Design. Describing and Exploring Data The Normal Distribution
 PSY 464 Advanced Experimental Design Describing and Exploring Data The Normal Distribution 1 Overview/Outline Questions-problems? Exploring/Describing data Organizing/summarizing data Graphical presentations
MEASURES OF DISPERSION, RELATIVE STANDING AND SHAPE. Dr. Bijaya Bhusan Nanda,
 MEASURES OF DISPERSION, RELATIVE STANDING AND SHAPE Dr. Bijaya Bhusan Nanda, CONTENTS What is measures of dispersion? Why measures of dispersion? How measures of dispersions are calculated? Range Quartile
Statistics 114 September 29, 2012
 Statistics 114 September 29, 2012 Third Long Examination TGCapistrano I. TRUE OR FALSE. Write True if the statement is always true; otherwise, write False. 1. The fifth decile is equal to the 50 th percentile.
The Normal Distribution & Descriptive Statistics. Kin 304W Week 2: Jan 15, 2012
 The Normal Distribution & Descriptive Statistics Kin 304W Week 2: Jan 15, 2012 1 Questionnaire Results I received 71 completed questionnaires. Thank you! Are you nervous about scientific writing? You re
Chapter 3 Statistical Quality Control, 7th Edition by Douglas C. Montgomery. Copyright (c) 2013 John Wiley & Sons, Inc.
 2013 John Wiley & Sons, Inc.") 1 3.1 Describing Variation Stem-and-Leaf Display Easy to find percentiles of the data; see page 69 2 Plot of Data in Time Order Marginal plot produced by MINITAB Also called a run chart 3 Histograms Useful
1 3.1 Describing Variation Stem-and-Leaf Display Easy to find percentiles of the data; see page 69 2 Plot of Data in Time Order Marginal plot produced by MINITAB Also called a run chart 3 Histograms Useful
Moments and Measures of Skewness and Kurtosis
 Moments and Measures of Skewness and Kurtosis Moments The term moment has been taken from physics. The term moment in statistical use is analogous to moments of forces in physics. In statistics the values
Measures of Central Tendency Lecture 5 22 February 2006 R. Ryznar
 Measures of Central Tendency 11.220 Lecture 5 22 February 2006 R. Ryznar Today s Content Wrap-up from yesterday Frequency Distributions The Mean, Median and Mode Levels of Measurement and Measures of Central
Session 5: Associations
 Session 5: Associations Li (Sherlly) Xie http://www.nemoursresearch.org/open/statclass/february2013/ Session 5 Flow 1. Bivariate data visualization Cross-Tab Stacked bar plots Box plot Scatterplot 2. Correlation
Review: Chebyshev s Rule. Measures of Dispersion II. Review: Empirical Rule. Review: Empirical Rule. Auto Batteries Example, p 59.
 Review: Chebyshev s Rule Measures of Dispersion II Tom Ilvento STAT 200 Is based on a mathematical theorem for any data At least ¾ of the measurements will fall within ± 2 standard deviations from the
Establishing a framework for statistical analysis via the Generalized Linear Model
 PSY349: Lecture 1: INTRO & CORRELATION Establishing a framework for statistical analysis via the Generalized Linear Model GLM provides a unified framework that incorporates a number of statistical methods
the display, exploration and transformation of the data are demonstrated and biases typically encountered are highlighted.
 1 Insurance data Generalized linear modeling is a methodology for modeling relationships between variables. It generalizes the classical normal linear model, by relaxing some of its restrictive assumptions,
Describing Data: Displaying and Exploring Data
 Describing Data: Displaying and Exploring Data Chapter 4 McGraw-Hill/Irwin Copyright 2011 by the McGraw-Hill Companies, Inc. All rights reserved. LEARNING OBJECTIVES LO1. Develop and interpret a dot plot.
AP Statistics Chapter 6 - Random Variables
 AP Statistics Chapter 6 - Random 6.1 Discrete and Continuous Random Objective: Recognize and define discrete random variables, and construct a probability distribution table and a probability histogram
Mini-Lecture 3.1 Measures of Central Tendency
 Mini-Lecture 3.1 Measures of Central Tendency Objectives 1. Determine the arithmetic mean of a variable from raw data 2. Determine the median of a variable from raw data 3. Explain what it means for a
M249 Diagnostic Quiz
 THE OPEN UNIVERSITY Faculty of Mathematics and Computing M249 Diagnostic Quiz Prepared by the Course Team [Press to begin] c 2005, 2006 The Open University Last Revision Date: May 19, 2006 Version 4.2
Lecture Week 4 Inspecting Data: Distributions
 Lecture Week 4 Inspecting Data: Distributions Introduction to Research Methods & Statistics 2013 2014 Hemmo Smit So next week No lecture & workgroups But Practice Test on-line (BB) Enter data for your
Section 2.2 One Quantitative Variable: Shape and Center
 Section 2.2 One Quantitative Variable: Shape and Center Outline One Quantitative Variable Visualization: dotplot and histogram Shape: symmetric, skewed Measures of center: mean and median Outliers and
Prof. Thistleton MAT 505 Introduction to Probability Lecture 3
 Sections from Text and MIT Video Lecture: Sections 2.1 through 2.5 http://ocw.mit.edu/courses/electrical-engineering-and-computer-science/6-041-probabilistic-systemsanalysis-and-applied-probability-fall-2010/video-lectures/lecture-1-probability-models-and-axioms/
David Tenenbaum GEOG 090 UNC-CH Spring 2005
 Simple Descriptive Statistics Review and Examples You will likely make use of all three measures of central tendency (mode, median, and mean), as well as some key measures of dispersion (standard deviation,
4. DESCRIPTIVE STATISTICS
 4. DESCRIPTIVE STATISTICS Descriptive Statistics is a body of techniques for summarizing and presenting the essential information in a data set. Eg: Here are daily high temperatures for Jan 16, 2009 in
NCSS Statistical Software. Reference Intervals
 Chapter 586 Introduction A reference interval contains the middle 95% of measurements of a substance from a healthy population. It is a type of prediction interval. This procedure calculates one-, and