Getting to know a data-set (how to approach data) Overview: Descriptives & Graphing
|
|
|
- Sophie Snow
- 6 years ago
- Views:
Transcription

1 Overview: Descriptives & Graphing 1. Getting to know a data set 2. LOM & types of statistics 3. Descriptive statistics 4. Normal distribution 5. Non-normal distributions 6. Effect of skew on central tendency 7. Principles of graphing 8. Univariate graphical techniques 2 Getting to know a data-set (how to approach data) 3


2


3


4

5 Level of measurement & types of statistics Image source: 13 Golden rule of data analysis A variable's level of measurement determines the type of statistics that can be used, including types of: descriptive statistics graphs inferential statistics 14 Levels of measurement and non-parametric vs. parametric Categorical & ordinal data DV non-parametric (Does not assume a normal distribution) Interval & ratio data DV parametric (Assumes a normal distribution) non-parametric (If distribution is non-normal) DVs = dependent variables 15
6 Parametric statistics Statistics which estimate parameters of a population, based on the normal distribution Univariate: mean, standard deviation, skewness, kurtosis, t-tests, ANOVAs Bivariate: correlation, linear regression Multivariate: multiple linear regression 16 Parametric statistics More powerful (more sensitive) More assumptions (population is normally distributed) Vulnerable to violations of assumptions (less robust) 17 Non-parametric statistics Statistics which do not assume sampling from a population which is normally distributed There are non-parametric alternatives for many parametric statistics e.g., sign test, chi-squared, Mann- Whitney U test, Wilcoxon matched-pairs signed-ranks test. 18
 Fewer assumptions (do not assume a")
 19 Univariate descriptive")
7 Non-parametric statistics Less powerful (less sensitive) Fewer assumptions (do not assume a normal distribution) Less vulnerable to assumption violation (more robust) 19 Univariate descriptive statistics 20
8 What do we want to describe? The distributional properties of variables, based on: Central tendency(ies): e.g., frequencies, mode, median, mean Shape: e.g., skewness, kurtosis Spread (dispersion): min., max., range, IQR, percentiles, variance, standard deviation 22 Measures of central tendency Statistics which represent the centre of a frequency distribution: Mode (most frequent) Median (50 th percentile) Mean (average) Which ones to use depends on: Type of data (level of measurement) Shape of distribution (esp. skewness) Reporting more than one may be appropriate. 23 Measures of central tendency Mode / Freq. /%s Median Mean Nominal x x Ordinal If meaningful x Interval Ratio If meaningful 24
9 Measures of distribution Measures of shape, spread, dispersion, and deviation from the central tendency Non-parametric: Min. and max. Range Percentiles Parametric: SD Skewness Kurtosis 25 Measures of spread / dispersion / deviation Nominal Min / Max, Range Percentile Var / SD x x x Ordinal If meaningful x Interval Ratio 26 Descriptives for nominal data Nominal LOM = Labelled categories Descriptive statistics: Most frequent? (Mode e.g., females) Least frequent? (e.g., Males) Frequencies (e.g., 20 females, 10 males) Percentages (e.g. 67% females, 33% males) Cumulative percentages Ratios (e.g., twice as many females as males) 27
10 Descriptives for ordinal data Ordinal LOM = Conveys order but not distance (e.g., ranks) Descriptives approach is as for nominal (frequencies, mode etc.) Plus percentiles (including median) may be useful 28 Descriptives for interval data Interval LOM = order and distance, but no true 0 (0 is arbitrary). Central tendency (mode, median, mean) Shape/Spread (min., max., range, SD, skewness, kurtosis) Interval data is discrete, but is often treated as ratio/continuous (especially for > 5 intervals) 29 Descriptives for ratio data Ratio = Numbers convey order and distance, meaningful 0 point As for interval, use median, mean, SD, skewness etc. Can also use ratios (e.g., Category A is twice as large as Category B) 30
11 Mode (Mo) Most common score - highest point in a frequency distribution a real score the most common response Suitable for all levels of data, but may not be appropriate for ratio (continuous) Not affected by outliers Check frequencies and bar graph to see whether it is an accurate and useful statistic 31 Frequencies (f) and percentages (%) # of responses in each category % of responses in each category Frequency table Visualise using a bar or pie chart 32 Median (Mdn) Mid-point of distribution (Quartile 2, 50 th percentile) Not badly affected by outliers May not represent the central tendency in skewed data If the Median is useful, then consider what other percentiles may also be worth reporting 33


12 Summary: Descriptive statistics Level of measurement and normality determines whether data can be treated as parametric Describe the central tendency Frequencies, Percentages Mode, Median, Mean Describe the variability: Min., Max., Range, Quartiles Standard Deviation, Variance 34 Four moments of a normal distribution ve Skew Mean SD Kurtosis Column 1 Column 2 Column 3 +ve Skew 0 Row 1 Row 2 Row 3 Row 4 36
13 Four moments of a normal distribution Four mathematical qualities (parameters) can describe a continuous distribution which at least roughly follows a bell curve shape: 1 st = mean (central tendency) 2 nd = SD (dispersion) 3 rd = skewness (lean / tail) 4 th = kurtosis (peakedness / flattness) 37 Average score Mean (1st moment ) Mean = Σ X / N For normally distributed ratio or interval (if treating it as continuous) data. Influenced by extreme scores (outliers) 38 Beware inappropriate averaging... With your head in an oven and your feet in ice you would feel, on average, just fine The majority of people have more than the average number of legs (M = ). 39
 = SD / square root of N 40 Skewness (3rd moment ) Lean of distribution +ve = tail to right -ve = tail to left Can be caused by an")

14 Standard deviation (2nd moment) SD = square root of the variance = Σ (X - X) 2 N 1 For normally distributed interval or ratio data Affected by outliers Can also derive the Standard Error (SE) = SD / square root of N 40 Skewness (3rd moment ) Lean of distribution +ve = tail to right -ve = tail to left Can be caused by an outlier, or ceiling or floor effects Can be accurate (e.g., cars owned per person would have a skewed distribution) 41 Skewness (3rd moment) (with ceiling and floor effects) Image source Negative skew Ceiling effect Positive skew Floor effect 42
15 Kurtosis (4th moment ) Flatness or peakedness of distribution +ve = peaked -ve = flattened By altering the X &/or Y axis, any distribution can be made to look more peaked or flat add a normal curve to help judge kurtosis visually. 43 Kurtosis (4th moment ) Image source: 44 Judging severity of skewness & kurtosis View histogram with normal curve Deal with outliers Rule of thumb: Skewness and kurtosis > -1 or < 1 is generally considered to sufficiently normal for meeting the assumptions of parametric inferential statistics Significance tests of skewness: Tend to be overly sensitive (therefore avoid using) 45
16 Areas under the normal curve If distribution is normal (bell-shaped - or close): ~68% of scores within +/- 1 SD of M ~95% of scores within +/- 2 SD of M ~99.7% of scores within +/- 3 SD of M 46 Areas under the normal curve Image source: 47 Non-normal distributions 48
 Leptokurtic (Peaked) 49 Non-normal distributions 50 Histogram of people's weight 8 Histogram 6 4 2 Frequency 0 Std. Dev = 17.10 Mean = 69.6 N = 20.00 40.0 50.0 60.0 70.0 80.0 90.0 100.0 110.")
17 Types of non-normal distribution Modality Uni-modal (one peak) Bi-modal (two peaks) Multi-modal (more than two peaks) Skewness Positive (tail to right) Negative (tail to left) Kurtosis Platykurtic (Flat) Leptokurtic (Peaked) 49 Non-normal distributions 50 Histogram of people's weight 8 Histogram Frequency 0 Std. Dev = Mean = 69.6 N = WEIGHT 51

18 Histogram of daily calorie intake N = Histogram of fertility At what age do you think you will die? Example normal distribution 1 40 Frequency Mean =81.21 Std. Dev. = N = Die


19 Very feminine Fairly feminine Androgynous Very feminine Fairly masculine Very masculine Fairly feminine Androgynous Fairly masculine Very masculine Fairly feminine Androgynous Fairly masculine Very masculine C ou nt Distribution for females Femininity-Masculinity Distribution for males Gender: female Gender: male Count Count Femininity-Masculinity Femininity-Masculinity 56 Non-normal distribution: Use non-parametric descriptive statistics Min. & Max. Range = Max. - Min. Percentiles Quartiles Q1 Mdn (Q2) Q3 IQR (Q3-Q1) 57

20 Effects of skew on measures of central tendency +vely skewed distributions mode < median < mean symmetrical (normal) distributions mean = median = mode -vely skewed distributions mean < median < mode 58 Effects of skew on measures of central tendency 59 Transformations Converts data using various formulae to achieve normality and allow more powerful tests Loses original metric Complicates interpretation 60
21 Review questions 1. If a survey question produces a floor effect, where will the mean, median and mode lie in relation to one another? 61 Review questions 2. Would the mean # of cars owned in Australia to exceed the median? 62 Review questions 3. Would the mean score on an easy test exceed the median performance? 63

22

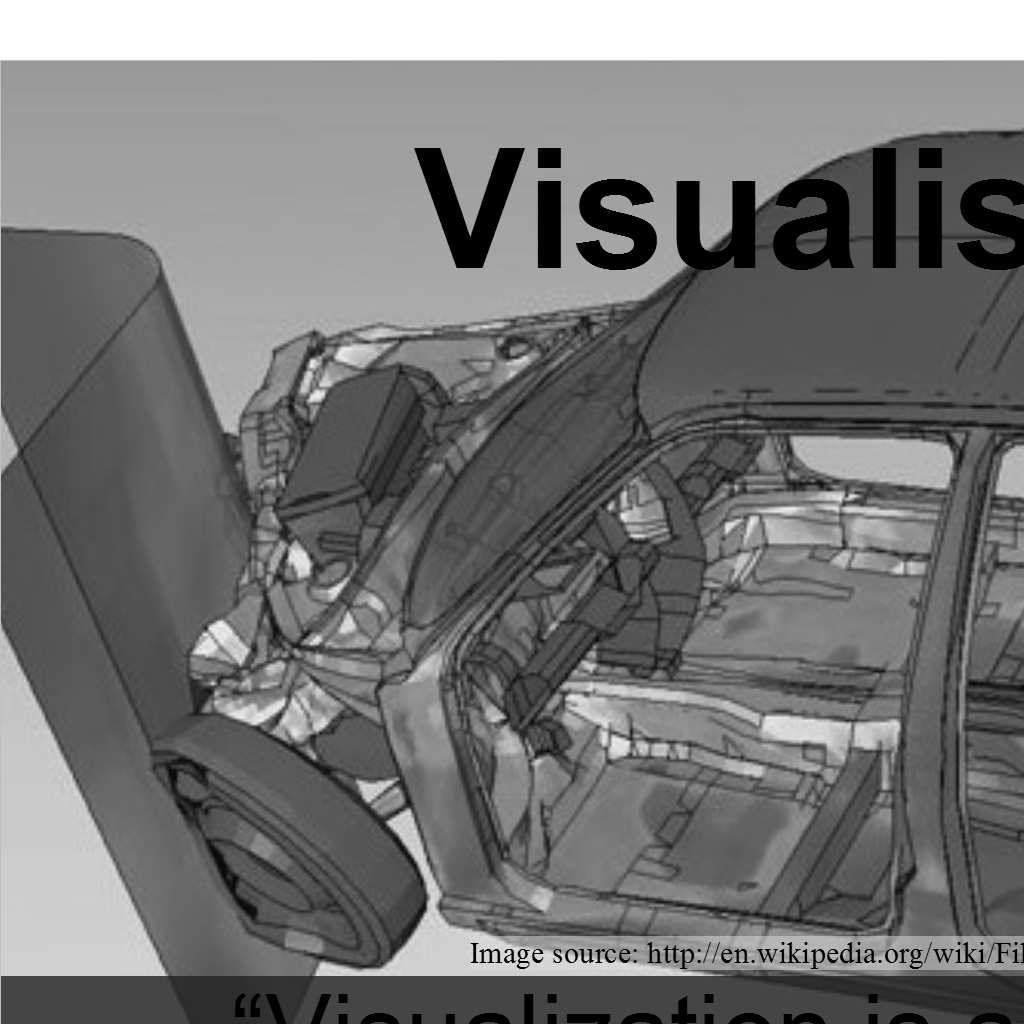
23 Principles of graphing Clear purpose Maximise clarity Minimise clutter Allow visual comparison 68 Graphs (Edward Tufte) Visualise data Reveal data Describe Explore Tabulate Decorate Communicate complex ideas with clarity, precision, and efficiency 69
24 Graphing steps 1. Identify purpose of the graph (make large amounts of data coherent; present many #s in small space; encourage the eye to make comparisons) 2. Select type of graph to use 3. Draw and modify graph to be clear, non-distorting, and welllabelled (maximise clarity, minimise clarity; show the data; avoid distortion; reveal data at several levels/layers) 70 Software for data visualisation (graphing) 1. Statistical packages e.g., SPSS Graphs or via Analyses 2. Spreadsheet packages e.g., MS Excel 3. Word-processors e.g., MS Word Insert Object Micrograph Graph Chart 71 Cleveland s hierarchy Image source: 72
25 Univariate graphs } Bar graph Non-parametric i.e., nominal or ordinal Pie chart Histogram Stem & leaf plot Data plot / Error bar Box plot } Parametric i.e., normally distributed interval or ratio Bar chart (Bar graph) Allows comparison of heights of bars X-axis: Collapse if too many categories Y-axis: Count/Frequency or % - truncation exaggerates differences Can add data labels (data values for each bar) Count Count Note truncated Y-axis 9 So cio logy Information Technolo Bio lo gy P sy ch olo gy A nt h ro p o lo gy AREA 0 So cio lo gy Information Technolo Bio lo gy P sy ch o lo gy An thro p o lo gy AREA 75

26 Std. D ev = M e an = 24.0 N = Std. Dev = M ea n = 24.0 N = Std. Dev = 9.16 Mean = 2 4 N = Pie chart Use a bar chart instead Bio lo gy Hard to read Difficult to show Small values An thro p o lo gy Small differences Rotation of chart and position of slices influences perception So cio lo gy P sy ch o lo gy Information T echnolo 76 Pie chart Use bar chart instead Image source: 77 Histogram For continuous data (Likert?, Ratio) X-axis needs a happy medium for # of categories Y-axis matters (can exaggerate) Participant Age Participant Age Participant Age 78
 79 Stem & leaf plot Use for ordinal, interval and ratio data (if rounded) May look confusing to unfamiliar reader 80 Stem & leaf plot Contains actual data Collapses tails")
27 Histogram of male & female heights Image source: Wild, C. J., & Seber, G. A. F. (2000). Chance encounters: A first course in data analysis and inference. New York: Wiley. Wild & Seber (2000) 79 Stem & leaf plot Use for ordinal, interval and ratio data (if rounded) May look confusing to unfamiliar reader 80 Stem & leaf plot Contains actual data Collapses tails Underused alternative to histogram Frequency Stem & Leaf & Extremes (>=43) 81

28 Box plot (Box & whisker) Useful for interval and ratio data Represents min., max, median, quartiles, & outliers 82 Box plot (Box & whisker) Alternative to histogram Useful for screening Useful for comparing variables Can get messy - too much info Confusing to unfamiliar reader T ime Management-T 1 0 Missing Male Participant Gender Female Self-Confidence-T 1 83 Data plot & error bar Data plot Error bar 84
 86 \"Like good writing, good graphical displays of data communicate")
29 Line graph Alternative to histogram Implies continuity e.g., time Can show multiple lines Mean OVERALL SCALES-T 0 OVERALL SCALES-T 2 OVERALL SCALES-T1 OVERALL SCALES-T 3 85 Graphical integrity (part of academic integrity) 86 "Like good writing, good graphical displays of data communicate ideas with clarity, precision, and efficiency. Like poor writing, bad graphical displays distort or obscure the data, make it harder to understand or compare, or otherwise thwart the communicative effect which the graph should convey." Michael Friendly Gallery of Data Visualisation 87
. Graphical methods for data analysis. Boston, MA: Duxbury Press. 2. Cleveland, W. S.")
. Visualizing quantitative data. Cheshire, CT: Graphics Press. 6. Tukey J. (1977).")
30 Tufte s graphical integrity Some lapses intentional, some not Lie Factor = size of effect in graph size of effect in data Misleading uses of area Misleading uses of perspective Leaving out important context Lack of taste and aesthetics 88 References 1. Chambers, J., Cleveland, B., Kleiner, B., & Tukey, P. (1983). Graphical methods for data analysis. Boston, MA: Duxbury Press. 2. Cleveland, W. S. (1985). The elements of graphing data. Monterey, CA: Wadsworth. 3. Jones, G. E. (2006). How to lie with charts. Santa Monica, CA: LaPuerta. 4. Tufte, E. R. (1983). The visual display of quantitative information. Cheshire, CT: Graphics Press. 5. Tufte. E. R. (2001). Visualizing quantitative data. Cheshire, CT: Graphics Press. 6. Tukey J. (1977). Exploratory data analysis. Addison-Wesley. 7. Wild, C. J., & Seber, G. A. F. (2000). Chance encounters: A first course in data analysis and inference. New York: Wiley. 90


31
Steps with data (how to approach data)
") Descriptives & Graphing Lecture 3 Survey Research & Design in Psychology James Neill, 216 Creative Commons Attribution 4. Overview: Descriptives & Graphing 1. Steps with data 2. Level of measurement &
Descriptives & Graphing Lecture 3 Survey Research & Design in Psychology James Neill, 216 Creative Commons Attribution 4. Overview: Descriptives & Graphing 1. Steps with data 2. Level of measurement &
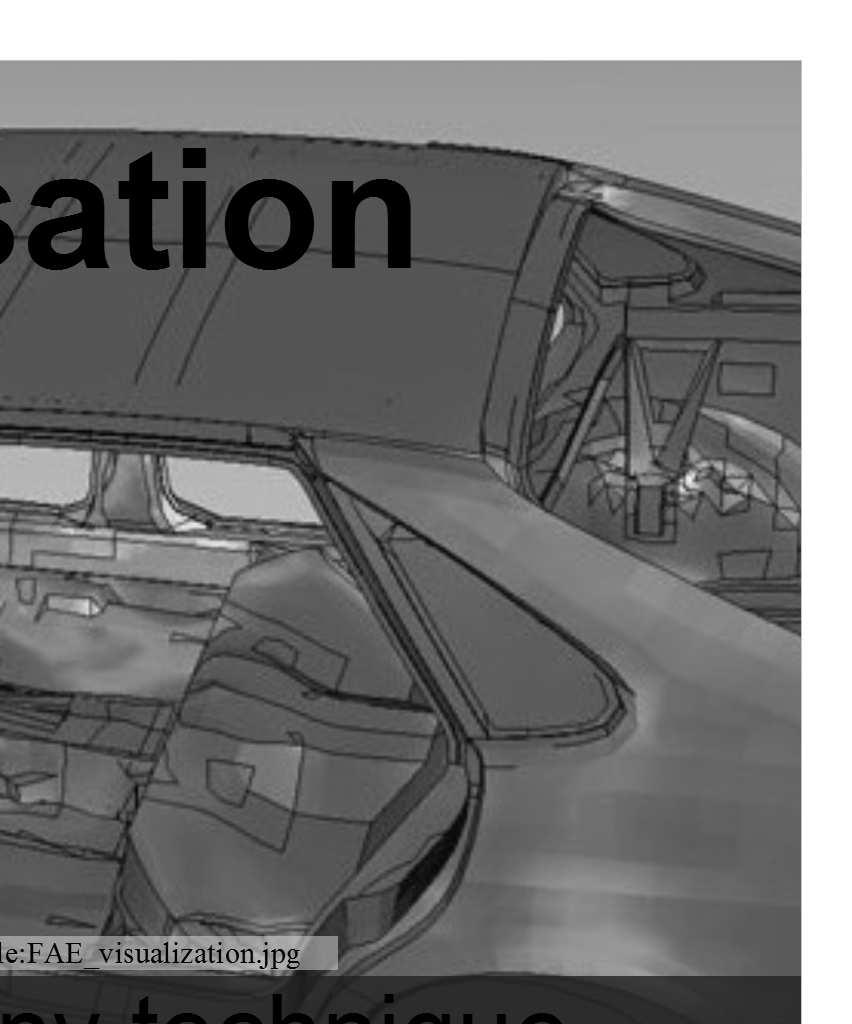
Getting to know data. Play with data get to know it. Image source: Descriptives & Graphing
 Descriptives & Graphing Getting to know data (how to approach data) Lecture 3 Image source: http://commons.wikimedia.org/wiki/file:3d_bar_graph_meeting.jpg Survey Research & Design in Psychology James
Lecture 1: Review and Exploratory Data Analysis (EDA)
") Lecture 1: Review and Exploratory Data Analysis (EDA) Ani Manichaikul amanicha@jhsph.edu 16 April 2007 1 / 40 Course Information I Office hours For questions and help When? I ll announce this tomorrow
Lecture 1: Review and Exploratory Data Analysis (EDA) Ani Manichaikul amanicha@jhsph.edu 16 April 2007 1 / 40 Course Information I Office hours For questions and help When? I ll announce this tomorrow
Lecture Week 4 Inspecting Data: Distributions
 Lecture Week 4 Inspecting Data: Distributions Introduction to Research Methods & Statistics 2013 2014 Hemmo Smit So next week No lecture & workgroups But Practice Test on-line (BB) Enter data for your
Frequency Distribution and Summary Statistics
 Frequency Distribution and Summary Statistics Dongmei Li Department of Public Health Sciences Office of Public Health Studies University of Hawai i at Mānoa Outline 1. Stemplot 2. Frequency table 3. Summary
Stat 101 Exam 1 - Embers Important Formulas and Concepts 1
 1 Chapter 1 1.1 Definitions Stat 101 Exam 1 - Embers Important Formulas and Concepts 1 1. Data Any collection of numbers, characters, images, or other items that provide information about something. 2.
Summarising Data. Summarising Data. Examples of Types of Data. Types of Data
 Summarising Data Summarising Data Mark Lunt Arthritis Research UK Epidemiology Unit University of Manchester Today we will consider Different types of data Appropriate ways to summarise these data 17/10/2017
DATA SUMMARIZATION AND VISUALIZATION
 APPENDIX DATA SUMMARIZATION AND VISUALIZATION PART 1 SUMMARIZATION 1: BUILDING BLOCKS OF DATA ANALYSIS 294 PART 2 PART 3 PART 4 VISUALIZATION: GRAPHS AND TABLES FOR SUMMARIZING AND ORGANIZING DATA 296
Description of Data I
 Description of Data I (Summary and Variability measures) Objectives: Able to understand how to summarize the data Able to understand how to measure the variability of the data Able to use and interpret
2 Exploring Univariate Data
 2 Exploring Univariate Data A good picture is worth more than a thousand words! Having the data collected we examine them to get a feel for they main messages and any surprising features, before attempting
Overview/Outline. Moving beyond raw data. PSY 464 Advanced Experimental Design. Describing and Exploring Data The Normal Distribution
 PSY 464 Advanced Experimental Design Describing and Exploring Data The Normal Distribution 1 Overview/Outline Questions-problems? Exploring/Describing data Organizing/summarizing data Graphical presentations
Math 2311 Bekki George Office Hours: MW 11am to 12:45pm in 639 PGH Online Thursdays 4-5:30pm And by appointment
 Math 2311 Bekki George bekki@math.uh.edu Office Hours: MW 11am to 12:45pm in 639 PGH Online Thursdays 4-5:30pm And by appointment Class webpage: http://www.math.uh.edu/~bekki/math2311.html Math 2311 Class
Lecture 2 Describing Data
 Lecture 2 Describing Data Thais Paiva STA 111 - Summer 2013 Term II July 2, 2013 Lecture Plan 1 Types of data 2 Describing the data with plots 3 Summary statistics for central tendency and spread 4 Histograms
Exploring Data and Graphics
 Exploring Data and Graphics Rick White Department of Statistics, UBC Graduate Pathways to Success Graduate & Postdoctoral Studies November 13, 2013 Outline Summarizing Data Types of Data Visualizing Data
Simple Descriptive Statistics
 Simple Descriptive Statistics These are ways to summarize a data set quickly and accurately The most common way of describing a variable distribution is in terms of two of its properties: Central tendency
Fundamentals of Statistics
 CHAPTER 4 Fundamentals of Statistics Expected Outcomes Know the difference between a variable and an attribute. Perform mathematical calculations to the correct number of significant figures. Construct
Basic Procedure for Histograms
 Basic Procedure for Histograms 1. Compute the range of observations (min. & max. value) 2. Choose an initial # of classes (most likely based on the range of values, try and find a number of classes that
Week 1 Variables: Exploration, Familiarisation and Description. Descriptive Statistics.
 Week 1 Variables: Exploration, Familiarisation and Description. Descriptive Statistics. Convergent validity: the degree to which results/evidence from different tests/sources, converge on the same conclusion.
9/17/2015. Basic Statistics for the Healthcare Professional. Relax.it won t be that bad! Purpose of Statistic. Objectives
 Basic Statistics for the Healthcare Professional 1 F R A N K C O H E N, M B B, M P A D I R E C T O R O F A N A L Y T I C S D O C T O R S M A N A G E M E N T, LLC Purpose of Statistic 2 Provide a numerical
Some Characteristics of Data
 Some Characteristics of Data Not all data is the same, and depending on some characteristics of a particular dataset, there are some limitations as to what can and cannot be done with that data. Some key
Introduction to Descriptive Statistics
 Introduction to Descriptive Statistics 17.871 Types of Variables ~Nominal (Quantitative) Nominal (Qualitative) categorical Ordinal Interval or ratio Describing data Moment Non-mean based measure Center
A LEVEL MATHEMATICS ANSWERS AND MARKSCHEMES SUMMARY STATISTICS AND DIAGRAMS. 1. a) 45 B1 [1] b) 7 th value 37 M1 A1 [2]
![A LEVEL MATHEMATICS ANSWERS AND MARKSCHEMES SUMMARY STATISTICS AND DIAGRAMS. 1. a) 45 B1 [1] b) 7 th value 37 M1 A1 [2]](/thumbs/81/83043398.jpg "A LEVEL MATHEMATICS ANSWERS AND MARKSCHEMES SUMMARY STATISTICS AND DIAGRAMS. 1. a) 45 B1 [1] b) 7 th value 37 M1 A1 [2]") 1. a) 45 [1] b) 7 th value 37 [] n c) LQ : 4 = 3.5 4 th value so LQ = 5 3 n UQ : 4 = 9.75 10 th value so UQ = 45 IQR = 0 f.t. d) Median is closer to upper quartile Hence negative skew [] Page 1 . a) Orders
1. a) 45 [1] b) 7 th value 37 [] n c) LQ : 4 = 3.5 4 th value so LQ = 5 3 n UQ : 4 = 9.75 10 th value so UQ = 45 IQR = 0 f.t. d) Median is closer to upper quartile Hence negative skew [] Page 1 . a) Orders
Establishing a framework for statistical analysis via the Generalized Linear Model
 PSY349: Lecture 1: INTRO & CORRELATION Establishing a framework for statistical analysis via the Generalized Linear Model GLM provides a unified framework that incorporates a number of statistical methods
David Tenenbaum GEOG 090 UNC-CH Spring 2005
 Simple Descriptive Statistics Review and Examples You will likely make use of all three measures of central tendency (mode, median, and mean), as well as some key measures of dispersion (standard deviation,
Descriptive Statistics
 Petra Petrovics Descriptive Statistics 2 nd seminar DESCRIPTIVE STATISTICS Definition: Descriptive statistics is concerned only with collecting and describing data Methods: - statistical tables and graphs
Descriptive Statistics Bios 662
 Descriptive Statistics Bios 662 Michael G. Hudgens, Ph.D. mhudgens@bios.unc.edu http://www.bios.unc.edu/ mhudgens 2008-08-19 08:51 BIOS 662 1 Descriptive Statistics Descriptive Statistics Types of variables
Chapter 3. Numerical Descriptive Measures. Copyright 2016 Pearson Education, Ltd. Chapter 3, Slide 1
 Chapter 3 Numerical Descriptive Measures Copyright 2016 Pearson Education, Ltd. Chapter 3, Slide 1 Objectives In this chapter, you learn to: Describe the properties of central tendency, variation, and
Descriptive Statistics
 Chapter 3 Descriptive Statistics Chapter 2 presented graphical techniques for organizing and displaying data. Even though such graphical techniques allow the researcher to make some general observations
Lectures delivered by Prof.K.K.Achary, YRC
 Lectures delivered by Prof.K.K.Achary, YRC Given a data set, we say that it is symmetric about a central value if the observations are distributed symmetrically about the central value. In symmetrically
Terms & Characteristics
 NORMAL CURVE Knowledge that a variable is distributed normally can be helpful in drawing inferences as to how frequently certain observations are likely to occur. NORMAL CURVE A Normal distribution: Distribution
Categorical. A general name for non-numerical data; the data is separated into categories of some kind.
 Chapter 5 Categorical A general name for non-numerical data; the data is separated into categories of some kind. Nominal data Categorical data with no implied order. Eg. Eye colours, favourite TV show,
STATISTICAL DISTRIBUTIONS AND THE CALCULATOR
 STATISTICAL DISTRIBUTIONS AND THE CALCULATOR 1. Basic data sets a. Measures of Center - Mean ( ): average of all values. Characteristic: non-resistant is affected by skew and outliers. - Median: Either
chapter 2-3 Normal Positive Skewness Negative Skewness
 chapter 2-3 Testing Normality Introduction In the previous chapters we discussed a variety of descriptive statistics which assume that the data are normally distributed. This chapter focuses upon testing
AP STATISTICS FALL SEMESTSER FINAL EXAM STUDY GUIDE
 AP STATISTICS Name: FALL SEMESTSER FINAL EXAM STUDY GUIDE Period: *Go over Vocabulary Notecards! *This is not a comprehensive review you still should look over your past notes, homework/practice, Quizzes,
CHAPTER 2 Describing Data: Numerical
 CHAPTER Multiple-Choice Questions 1. A scatter plot can illustrate all of the following except: A) the median of each of the two variables B) the range of each of the two variables C) an indication of
Data Distributions and Normality
 Data Distributions and Normality Definition (Non)Parametric Parametric statistics assume that data come from a normal distribution, and make inferences about parameters of that distribution. These statistical
STAT 113 Variability
 STAT 113 Variability Colin Reimer Dawson Oberlin College September 14, 2017 1 / 48 Outline Last Time: Shape and Center Variability Boxplots and the IQR Variance and Standard Deviaton Transformations 2
Dot Plot: A graph for displaying a set of data. Each numerical value is represented by a dot placed above a horizontal number line.
 Introduction We continue our study of descriptive statistics with measures of dispersion, such as dot plots, stem and leaf displays, quartiles, percentiles, and box plots. Dot plots, a stem-and-leaf display,
Both the quizzes and exams are closed book. However, For quizzes: Formulas will be provided with quiz papers if there is any need.
 Both the quizzes and exams are closed book. However, For quizzes: Formulas will be provided with quiz papers if there is any need. For exams (MD1, MD2, and Final): You may bring one 8.5 by 11 sheet of
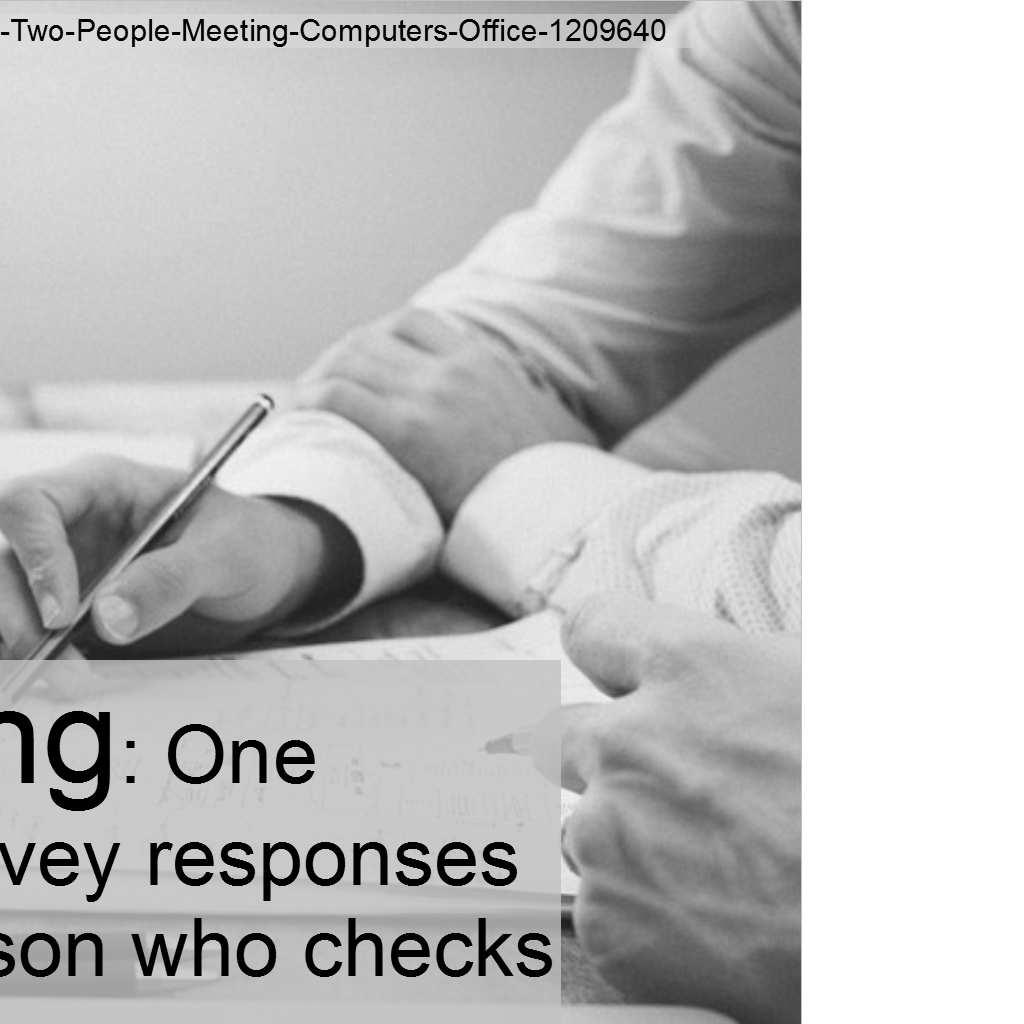
Describing Data: One Quantitative Variable
 STAT 250 Dr. Kari Lock Morgan The Big Picture Describing Data: One Quantitative Variable Population Sampling SECTIONS 2.2, 2.3 One quantitative variable (2.2, 2.3) Statistical Inference Sample Descriptive
Measures of Center. Mean. 1. Mean 2. Median 3. Mode 4. Midrange (rarely used) Measure of Center. Notation. Mean
 Measure of Center. Notation. Mean") Measure of Center Measures of Center The value at the center or middle of a data set 1. Mean 2. Median 3. Mode 4. Midrange (rarely used) 1 2 Mean Notation The measure of center obtained by adding the values
Measure of Center Measures of Center The value at the center or middle of a data set 1. Mean 2. Median 3. Mode 4. Midrange (rarely used) 1 2 Mean Notation The measure of center obtained by adding the values
Table of Contents. New to the Second Edition... Chapter 1: Introduction : Social Research...
 iii Table of Contents Preface... xiii Purpose... xiii Outline of Chapters... xiv New to the Second Edition... xvii Acknowledgements... xviii Chapter 1: Introduction... 1 1.1: Social Research... 1 Introduction...
Empirical Rule (P148)
") Interpreting the Standard Deviation Numerical Descriptive Measures for Quantitative data III Dr. Tom Ilvento FREC 408 We can use the standard deviation to express the proportion of cases that might fall
Interpreting the Standard Deviation Numerical Descriptive Measures for Quantitative data III Dr. Tom Ilvento FREC 408 We can use the standard deviation to express the proportion of cases that might fall
Descriptive Analysis
 Descriptive Analysis HERTANTO WAHYU SUBAGIO Univariate Analysis Univariate analysis involves the examination across cases of one variable at a time. There are three major characteristics of a single variable
Summary of Statistical Analysis Tools EDAD 5630
 Summary of Statistical Analysis Tools EDAD 5630 Test Name Program Used Purpose Steps Main Uses/Applications in Schools Principal Component Analysis SPSS Measure Underlying Constructs Reliability SPSS Measure
Standardized Data Percentiles, Quartiles and Box Plots Grouped Data Skewness and Kurtosis
 Descriptive Statistics (Part 2) 4 Chapter Percentiles, Quartiles and Box Plots Grouped Data Skewness and Kurtosis McGraw-Hill/Irwin Copyright 2009 by The McGraw-Hill Companies, Inc. Chebyshev s Theorem
Review: Chebyshev s Rule. Measures of Dispersion II. Review: Empirical Rule. Review: Empirical Rule. Auto Batteries Example, p 59.
 Review: Chebyshev s Rule Measures of Dispersion II Tom Ilvento STAT 200 Is based on a mathematical theorem for any data At least ¾ of the measurements will fall within ± 2 standard deviations from the
The Normal Distribution & Descriptive Statistics. Kin 304W Week 2: Jan 15, 2012
 The Normal Distribution & Descriptive Statistics Kin 304W Week 2: Jan 15, 2012 1 Questionnaire Results I received 71 completed questionnaires. Thank you! Are you nervous about scientific writing? You re
MBEJ 1023 Dr. Mehdi Moeinaddini Dept. of Urban & Regional Planning Faculty of Built Environment
 MBEJ 1023 Planning Analytical Methods Dr. Mehdi Moeinaddini Dept. of Urban & Regional Planning Faculty of Built Environment Contents What is statistics? Population and Sample Descriptive Statistics Inferential
Chapter 6. y y. Standardizing with z-scores. Standardizing with z-scores (cont.)
") Starter Ch. 6: A z-score Analysis Starter Ch. 6 Your Statistics teacher has announced that the lower of your two tests will be dropped. You got a 90 on test 1 and an 85 on test 2. You re all set to drop
Starter Ch. 6: A z-score Analysis Starter Ch. 6 Your Statistics teacher has announced that the lower of your two tests will be dropped. You got a 90 on test 1 and an 85 on test 2. You re all set to drop
Numerical Descriptions of Data
 Numerical Descriptions of Data Measures of Center Mean x = x i n Excel: = average ( ) Weighted mean x = (x i w i ) w i x = data values x i = i th data value w i = weight of the i th data value Median =
MATHEMATICS APPLIED TO BIOLOGICAL SCIENCES MVE PA 07. LP07 DESCRIPTIVE STATISTICS - Calculating of statistical indicators (1)
") LP07 DESCRIPTIVE STATISTICS - Calculating of statistical indicators (1) Descriptive statistics are ways of summarizing large sets of quantitative (numerical) information. The best way to reduce a set of
LP07 DESCRIPTIVE STATISTICS - Calculating of statistical indicators (1) Descriptive statistics are ways of summarizing large sets of quantitative (numerical) information. The best way to reduce a set of
Data that can be any numerical value are called continuous. These are usually things that are measured, such as height, length, time, speed, etc.
 Chapter 8 Measures of Center Data that can be any numerical value are called continuous. These are usually things that are measured, such as height, length, time, speed, etc. Data that can only be integer
Measures of Central Tendency Lecture 5 22 February 2006 R. Ryznar
 Measures of Central Tendency 11.220 Lecture 5 22 February 2006 R. Ryznar Today s Content Wrap-up from yesterday Frequency Distributions The Mean, Median and Mode Levels of Measurement and Measures of Central
appstats5.notebook September 07, 2016 Chapter 5
 Chapter 5 Describing Distributions Numerically Chapter 5 Objective: Students will be able to use statistics appropriate to the shape of the data distribution to compare of two or more different data sets.
STAB22 section 1.3 and Chapter 1 exercises
 STAB22 section 1.3 and Chapter 1 exercises 1.101 Go up and down two times the standard deviation from the mean. So 95% of scores will be between 572 (2)(51) = 470 and 572 + (2)(51) = 674. 1.102 Same idea
IOP 201-Q (Industrial Psychological Research) Tutorial 5
 Tutorial 5") IOP 201-Q (Industrial Psychological Research) Tutorial 5 TRUE/FALSE [1 point each] Indicate whether the sentence or statement is true or false. 1. To establish a cause-and-effect relation between two variables,
IOP 201-Q (Industrial Psychological Research) Tutorial 5 TRUE/FALSE [1 point each] Indicate whether the sentence or statement is true or false. 1. To establish a cause-and-effect relation between two variables,
Contents Part I Descriptive Statistics 1 Introduction and Framework Population, Sample, and Observations Variables Quali
 Part I Descriptive Statistics 1 Introduction and Framework... 3 1.1 Population, Sample, and Observations... 3 1.2 Variables.... 4 1.2.1 Qualitative and Quantitative Variables.... 5 1.2.2 Discrete and Continuous
Statistics I Chapter 2: Analysis of univariate data
 Statistics I Chapter 2: Analysis of univariate data Numerical summary Central tendency Location Spread Form mean quartiles range coeff. asymmetry median percentiles interquartile range coeff. kurtosis
Unit 2 Statistics of One Variable
 Unit 2 Statistics of One Variable Day 6 Summarizing Quantitative Data Summarizing Quantitative Data We have discussed how to display quantitative data in a histogram It is useful to be able to describe
Numerical Descriptive Measures. Measures of Center: Mean and Median
 Steve Sawin Statistics Numerical Descriptive Measures Having seen the shape of a distribution by looking at the histogram, the two most obvious questions to ask about the specific distribution is where
Descriptive Statistics in Analysis of Survey Data
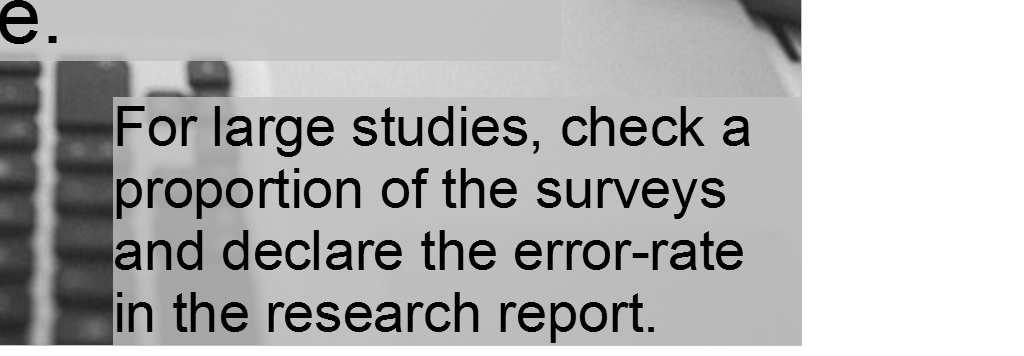
 Descriptive Statistics in Analysis of Survey Data March 2013 Kenneth M Coleman Mohammad Nizamuddiin Khan Survey: Definition A survey is a systematic method for gathering information from (a sample of)
MEASURES OF DISPERSION, RELATIVE STANDING AND SHAPE. Dr. Bijaya Bhusan Nanda,
 MEASURES OF DISPERSION, RELATIVE STANDING AND SHAPE Dr. Bijaya Bhusan Nanda, CONTENTS What is measures of dispersion? Why measures of dispersion? How measures of dispersions are calculated? Range Quartile
MEASURES OF CENTRAL TENDENCY & VARIABILITY + NORMAL DISTRIBUTION
 MEASURES OF CENTRAL TENDENCY & VARIABILITY + NORMAL DISTRIBUTION 1 Day 3 Summer 2017.07.31 DISTRIBUTION Symmetry Modality 单峰, 双峰 Skewness 正偏或负偏 Kurtosis 2 3 CHAPTER 4 Measures of Central Tendency 集中趋势
The normal distribution is a theoretical model derived mathematically and not empirically.
 Sociology 541 The Normal Distribution Probability and An Introduction to Inferential Statistics Normal Approximation The normal distribution is a theoretical model derived mathematically and not empirically.
PSYCHOLOGICAL STATISTICS
 UNIVERSITY OF CALICUT SCHOOL OF DISTANCE EDUCATION B Sc COUNSELLING PSYCHOLOGY (2011 Admission Onwards) II Semester Complementary Course PSYCHOLOGICAL STATISTICS QUESTION BANK 1. The process of grouping
Exploratory Data Analysis
 Exploratory Data Analysis Stemplots (or Stem-and-leaf plots) Stemplot and Boxplot T -- leading digits are called stems T -- final digits are called leaves STAT 74 Descriptive Statistics 2 Example: (number
Module Tag PSY_P2_M 7. PAPER No.2: QUANTITATIVE METHODS MODULE No.7: NORMAL DISTRIBUTION
 Subject Paper No and Title Module No and Title Paper No.2: QUANTITATIVE METHODS Module No.7: NORMAL DISTRIBUTION Module Tag PSY_P2_M 7 TABLE OF CONTENTS 1. Learning Outcomes 2. Introduction 3. Properties
2018 AAPM: Normal and non normal distributions: Why understanding distributions are important when designing experiments and analyzing data
 Statistical Failings that Keep Us All in the Dark Normal and non normal distributions: Why understanding distributions are important when designing experiments and Conflict of Interest Disclosure I have
2011 Pearson Education, Inc
 Statistics for Business and Economics Chapter 4 Random Variables & Probability Distributions Content 1. Two Types of Random Variables 2. Probability Distributions for Discrete Random Variables 3. The Binomial
DESCRIPTIVE STATISTICS II. Sorana D. Bolboacă
 DESCRIPTIVE STATISTICS II Sorana D. Bolboacă OUTLINE Measures of centrality Measures of spread Measures of symmetry Measures of localization Mainly applied on quantitative variables 2 DESCRIPTIVE STATISTICS
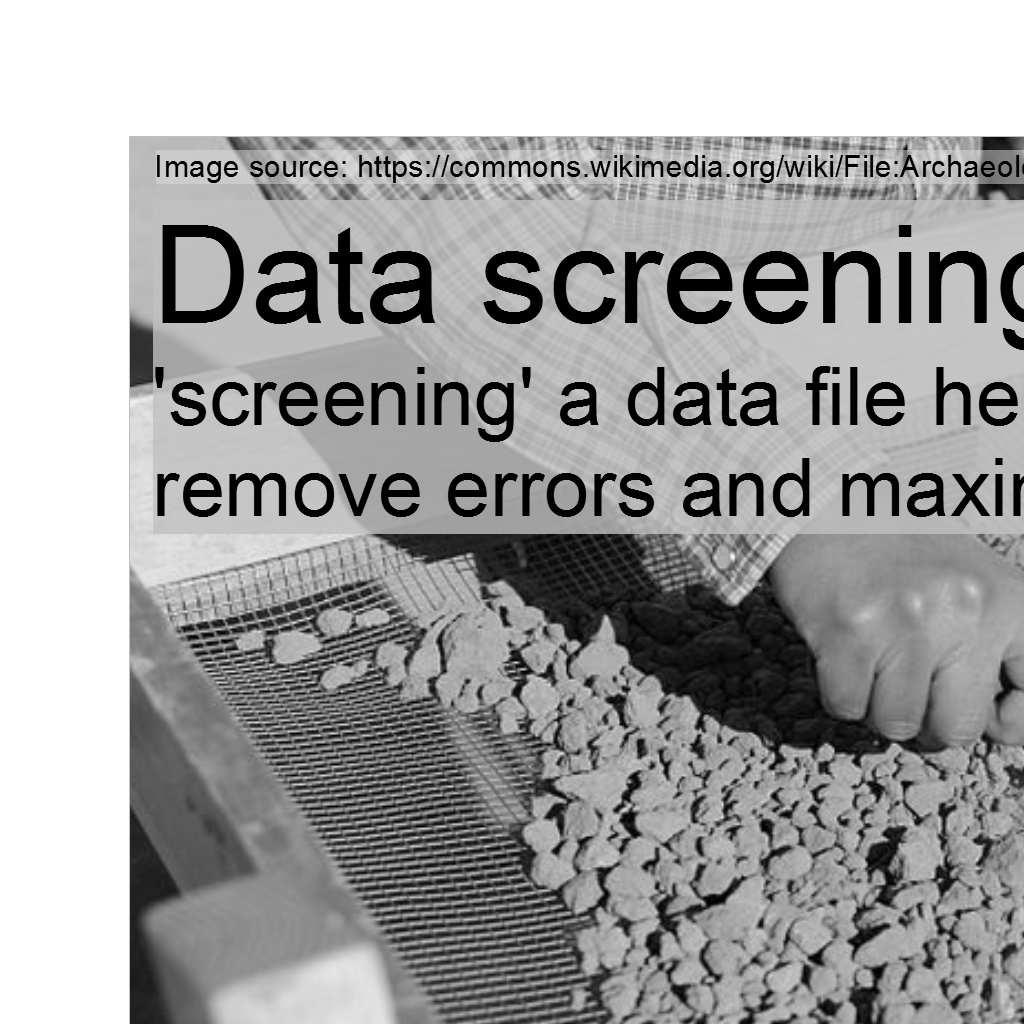
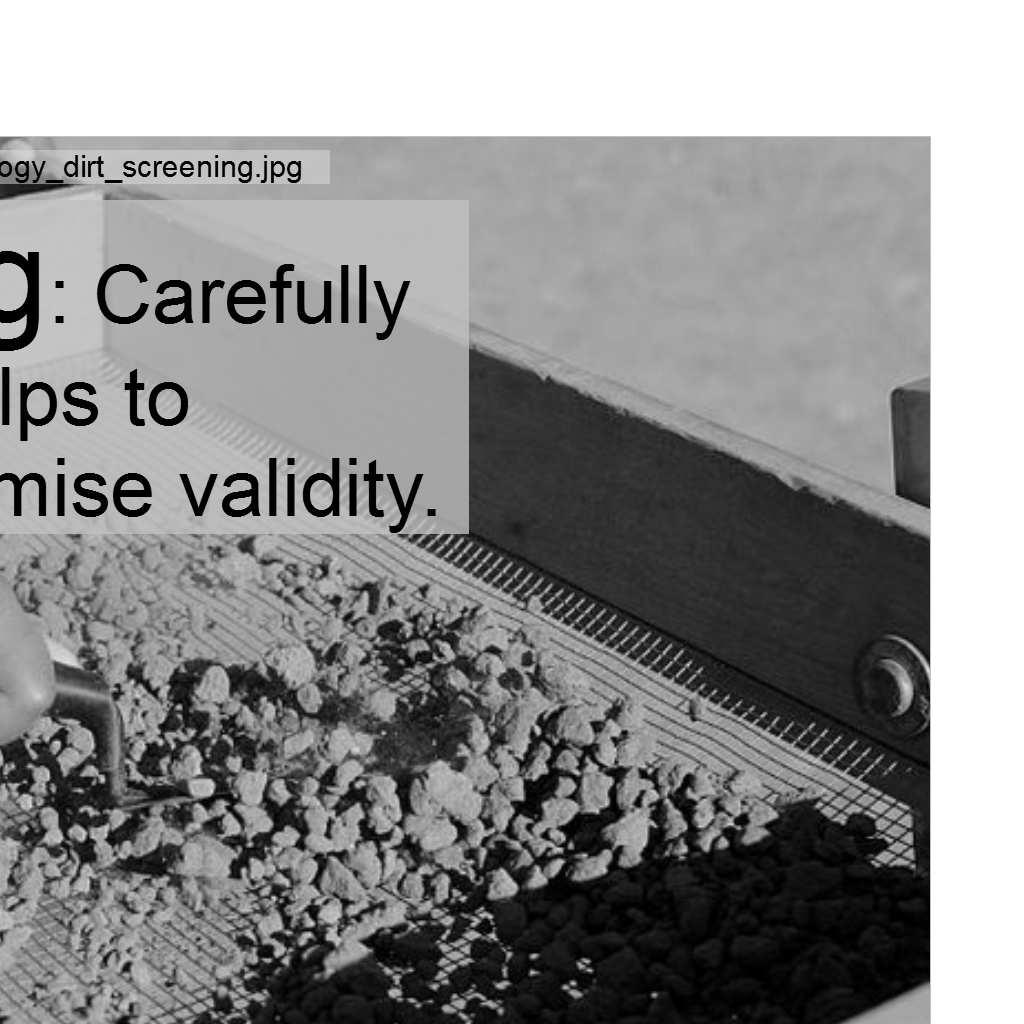
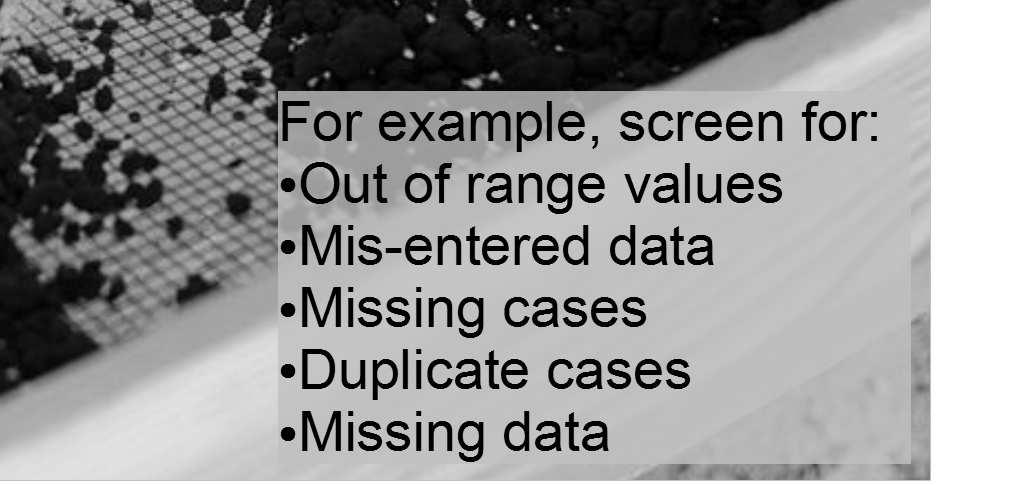
Data screening, transformations: MRC05
 Dale Berger Data screening, transformations: MRC05 This is a demonstration of data screening and transformations for a regression analysis. Our interest is in predicting current salary from education level
1 Exercise One. 1.1 Calculate the mean ROI. Note that the data is not grouped! Below you find the raw data in tabular form:
 1 Exercise One Note that the data is not grouped! 1.1 Calculate the mean ROI Below you find the raw data in tabular form: Obs Data 1 18.5 2 18.6 3 17.4 4 12.2 5 19.7 6 5.6 7 7.7 8 9.8 9 19.9 10 9.9 11
STAT 157 HW1 Solutions
 STAT 157 HW1 Solutions http://www.stat.ucla.edu/~dinov/courses_students.dir/10/spring/stats157.dir/ Problem 1. 1.a: (6 points) Determine the Relative Frequency and the Cumulative Relative Frequency (fill
Measures of Central tendency
 Elementary Statistics Measures of Central tendency By Prof. Mirza Manzoor Ahmad In statistics, a central tendency (or, more commonly, a measure of central tendency) is a central or typical value for a
1 Describing Distributions with numbers
 1 Describing Distributions with numbers Only for quantitative variables!! 1.1 Describing the center of a data set The mean of a set of numerical observation is the familiar arithmetic average. To write
Measures of Dispersion (Range, standard deviation, standard error) Introduction
 Introduction") Measures of Dispersion (Range, standard deviation, standard error) Introduction We have already learnt that frequency distribution table gives a rough idea of the distribution of the variables in a sample
Measures of Dispersion (Range, standard deviation, standard error) Introduction We have already learnt that frequency distribution table gives a rough idea of the distribution of the variables in a sample
SOLUTIONS TO THE LAB 1 ASSIGNMENT
 SOLUTIONS TO THE LAB 1 ASSIGNMENT Question 1 Excel produces the following histogram of pull strengths for the 100 resistors: 2 20 Histogram of Pull Strengths (lb) Frequency 1 10 0 9 61 63 6 67 69 71 73
Basic Data Analysis. Stephen Turnbull Business Administration and Public Policy Lecture 3: April 25, Abstract
 Basic Data Analysis Stephen Turnbull Business Administration and Public Policy Lecture 3: April 25, 2013 Abstract Review summary statistics and measures of location. Discuss the placement exam as an exercise
Handout 4 numerical descriptive measures part 2. Example 1. Variance and Standard Deviation for Grouped Data. mf N 535 = = 25
 Handout 4 numerical descriptive measures part Calculating Mean for Grouped Data mf Mean for population data: µ mf Mean for sample data: x n where m is the midpoint and f is the frequency of a class. Example
Lecture 07: Measures of central tendency
 Lecture 07: Measures of central tendency Ernesto F. L. Amaral September 21, 2017 Advanced Methods of Social Research (SOCI 420) Source: Healey, Joseph F. 2015. Statistics: A Tool for Social Research. Stamford:
MAS1403. Quantitative Methods for Business Management. Semester 1, Module leader: Dr. David Walshaw
 MAS1403 Quantitative Methods for Business Management Semester 1, 2018 2019 Module leader: Dr. David Walshaw Additional lecturers: Dr. James Waldren and Dr. Stuart Hall Announcements: Written assignment
3.1 Measures of Central Tendency
 3.1 Measures of Central Tendency n Summation Notation x i or x Sum observation on the variable that appears to the right of the summation symbol. Example 1 Suppose the variable x i is used to represent
Graphical and Tabular Methods in Descriptive Statistics. Descriptive Statistics
 Graphical and Tabular Methods in Descriptive Statistics MATH 3342 Section 1.2 Descriptive Statistics n Graphs and Tables n Numerical Summaries Sections 1.3 and 1.4 1 Why graph data? n The amount of data
Section3-2: Measures of Center
 Chapter 3 Section3-: Measures of Center Notation Suppose we are making a series of observations, n of them, to be exact. Then we write x 1, x, x 3,K, x n as the values we observe. Thus n is the total number
KARACHI UNIVERSITY BUSINESS SCHOOL UNIVERSITY OF KARACHI BS (BBA) VI
 VI") 88 P a g e B S ( B B A ) S y l l a b u s KARACHI UNIVERSITY BUSINESS SCHOOL UNIVERSITY OF KARACHI BS (BBA) VI Course Title : STATISTICS Course Number : BA(BS) 532 Credit Hours : 03 Course 1. Statistical
88 P a g e B S ( B B A ) S y l l a b u s KARACHI UNIVERSITY BUSINESS SCHOOL UNIVERSITY OF KARACHI BS (BBA) VI Course Title : STATISTICS Course Number : BA(BS) 532 Credit Hours : 03 Course 1. Statistical
Center and Spread. Measures of Center and Spread. Example: Mean. Mean: the balance point 2/22/2009. Describing Distributions with Numbers.
 Chapter 3 Section3-: Measures of Center Section 3-3: Measurers of Variation Section 3-4: Measures of Relative Standing Section 3-5: Exploratory Data Analysis Describing Distributions with Numbers The overall
Introduction to Computational Finance and Financial Econometrics Descriptive Statistics
 You can t see this text! Introduction to Computational Finance and Financial Econometrics Descriptive Statistics Eric Zivot Summer 2015 Eric Zivot (Copyright 2015) Descriptive Statistics 1 / 28 Outline
Quantitative Analysis and Empirical Methods
 3) Descriptive Statistics Sciences Po, Paris, CEE / LIEPP Introduction Data and statistics Introduction to distributions Measures of central tendency Measures of dispersion Skewness Data and Statistics
Descriptive Statistics (Devore Chapter One)
") Descriptive Statistics (Devore Chapter One) 1016-345-01 Probability and Statistics for Engineers Winter 2010-2011 Contents 0 Perspective 1 1 Pictorial and Tabular Descriptions of Data 2 1.1 Stem-and-Leaf
Descriptive Statistics (Devore Chapter One) 1016-345-01 Probability and Statistics for Engineers Winter 2010-2011 Contents 0 Perspective 1 1 Pictorial and Tabular Descriptions of Data 2 1.1 Stem-and-Leaf
Engineering Mathematics III. Moments
 Moments Mean and median Mean value (centre of gravity) f(x) x f (x) x dx Median value (50th percentile) F(x med ) 1 2 P(x x med ) P(x x med ) 1 0 F(x) x med 1/2 x x Variance and standard deviation
Chapter 6 Simple Correlation and
 Contents Chapter 1 Introduction to Statistics Meaning of Statistics... 1 Definition of Statistics... 2 Importance and Scope of Statistics... 2 Application of Statistics... 3 Characteristics of Statistics...
Measures of Central Tendency: Ungrouped Data. Mode. Median. Mode -- Example. Median: Example with an Odd Number of Terms
 Measures of Central Tendency: Ungrouped Data Measures of central tendency yield information about particular places or locations in a group of numbers. Common Measures of Location Mode Median Percentiles
E.D.A. Exploratory Data Analysis E.D.A. Steps for E.D.A. Greg C Elvers, Ph.D.
 E.D.A. Greg C Elvers, Ph.D. 1 Exploratory Data Analysis One of the most important steps in analyzing data is to look at the raw data This allows you to: find observations that may be incorrect quickly
Review: Types of Summary Statistics
 Review: Types of Summary Statistics We re often interested in describing the following characteristics of the distribution of a data series: Central tendency - where is the middle of the distribution?
4. DESCRIPTIVE STATISTICS
 4. DESCRIPTIVE STATISTICS Descriptive Statistics is a body of techniques for summarizing and presenting the essential information in a data set. Eg: Here are daily high temperatures for Jan 16, 2009 in
Moments and Measures of Skewness and Kurtosis
 Moments and Measures of Skewness and Kurtosis Moments The term moment has been taken from physics. The term moment in statistical use is analogous to moments of forces in physics. In statistics the values
Some estimates of the height of the podium
 Some estimates of the height of the podium 24 36 40 40 40 41 42 44 46 48 50 53 65 98 1 5 number summary Inter quartile range (IQR) range = max min 2 1.5 IQR outlier rule 3 make a boxplot 24 36 40 40 40
Statistics & Statistical Tests: Assumptions & Conclusions
 Degrees of Freedom Statistics & Statistical Tests: Assumptions & Conclusions Kinds of degrees of freedom Kinds of Distributions Kinds of Statistics & assumptions required to perform each Normal Distributions
Math146 - Chapter 3 Handouts. The Greek Alphabet. Source: Page 1 of 39
 Source: www.mathwords.com The Greek Alphabet Page 1 of 39 Some Miscellaneous Tips on Calculations Examples: Round to the nearest thousandth 0.92431 0.75693 CAUTION! Do not truncate numbers! Example: 1