Chapter 3 Statistical Quality Control, 7th Edition by Douglas C. Montgomery. Copyright (c) 2013 John Wiley & Sons, Inc.
|
|
|
- Kelley McLaughlin
- 6 years ago
- Views:
Transcription

1 1

2 3.1 Describing Variation Stem-and-Leaf Display Easy to find percentiles of the data; see page 69 2
3 Plot of Data in Time Order Marginal plot produced by MINITAB Also called a run chart 3

 versus the values of the")
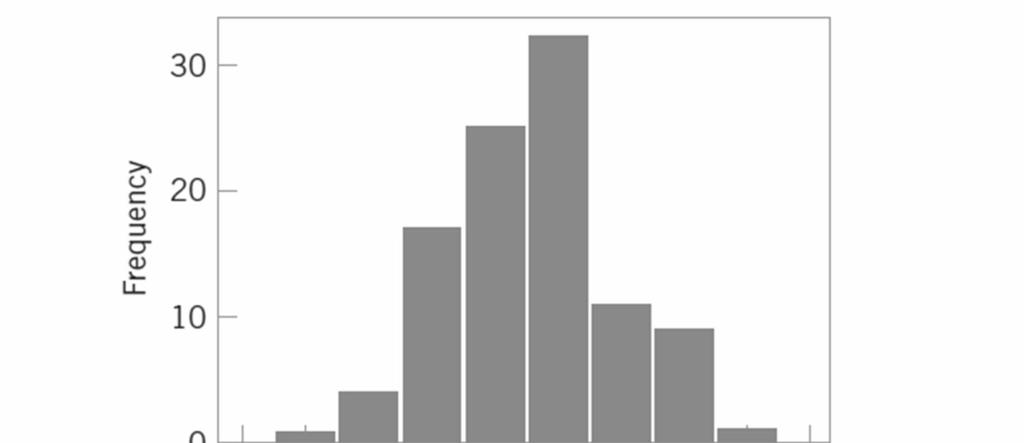
4 Histograms Useful for large data sets Group values of the variable into bins, then count the number of observations that fall into each bin Plot frequency (or relative frequency) versus the values of the variable 4
5 10 bins 5

6 Additional Minitab Graphs 15 bins 6
7 7
8 Numerical Summary of Data Sample average: 8
9 9
10 The Standard Deviation 10
 120.1 1 120.2 2 120.3 3 120.")

11 The Box Plot (or Box-and-Whisker Plot)
12 Comparative Box Plots 12

13 Probability Distributions 13
14 14
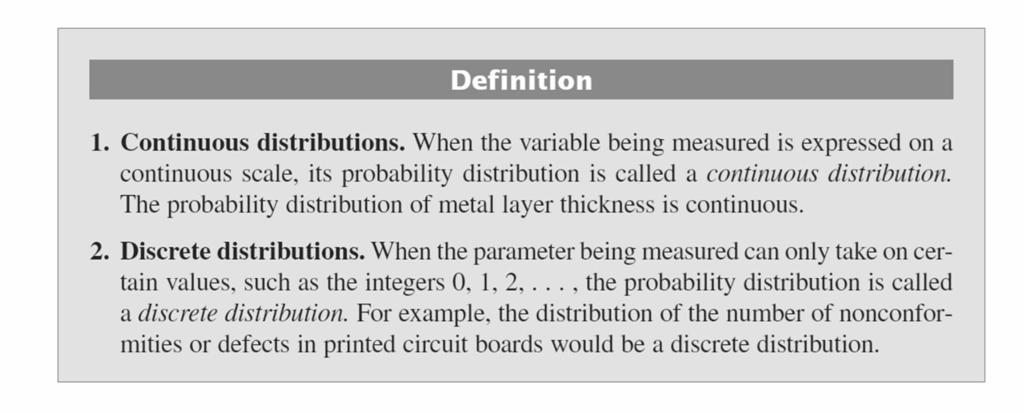
15 Sometimes called a probability mass function Sometimes called a probability density function Will see many examples in the text 15

16
17 17
18 The mean is the point at which the distribution exactly balances. x P(x) x p(x) xp(x) SUM
19 The mean is not necessarily the 50 th percentile of the distribution (that s the median) The mean is not necessarily the most likely value of the random variable (that s the mode) 19
20 20
 Pick n marbles without replacement Looking for p(x) No.")
21 Discrete Distributions The Hypergeometric Distribution N (50 Marbles) D (20 RED) N-D (30 GREEN) Pick n marbles without replacement Looking for p(x) No. of red in n 21


22 3.2 Important Discrete Distributions The Hypergeometric Distribution 22
23 Discrete distributions are used frequently in designing acceptance sampling plans see Chapter 15 23
24 24

25 25


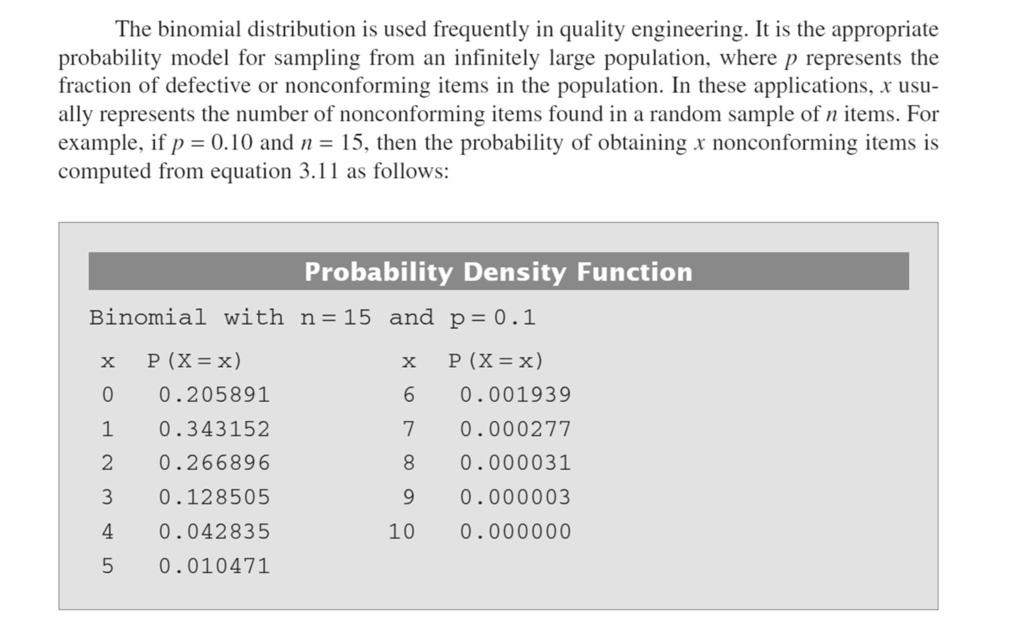
26 The Binomial Distribution Basis is in Bernoulli trials The random variable x is the number of successes out of n Bernoulli trials with constant probability of success p on each trial 26
27 27
28 Binomial Distributions 28
29 29


30 The Poisson Distribution Frequently used as a model for count data 30
31 31

32 32

33 The Negative Binomial Distribution The random variable x is the number of Bernoulli trials upon which the rth success occurs 33
34 The negative binomial distribution is also sometimes called the Pascal distribution When r = 1 the negative binomial distribution is known as the geometric distribution The geometric distribution has many useful applications in SQC 34
35 Geometric Distribution 35

36 3.3 Important Continuous Distributions The Normal Distribution 36
37 37
38 38
39 39
40 40
41 41

42 The Central Limit Theorem Practical interpretation the sum of independent random variables is approximately normally distributed regardless of the distribution of each individual random variable in the sum 42

43 The Lognormal Distribution 43
44 44
45 45
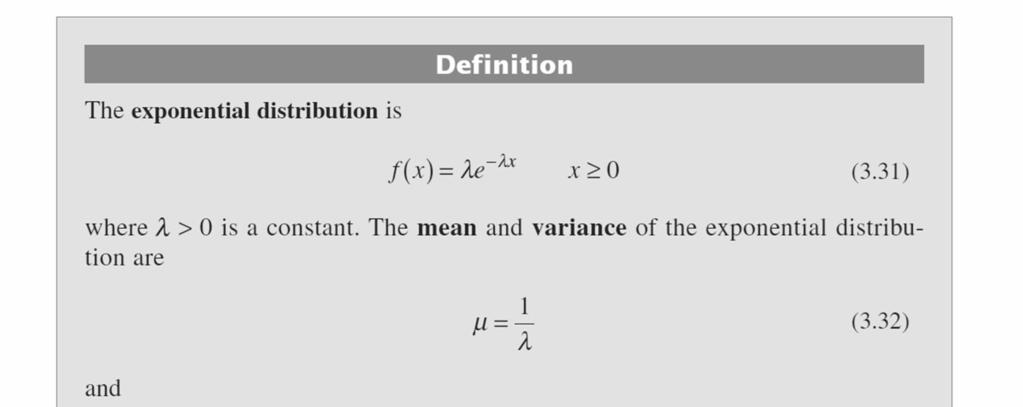

46 The Exponential Distribution 46
47 Relationship between the Poisson and exponential distributions 47
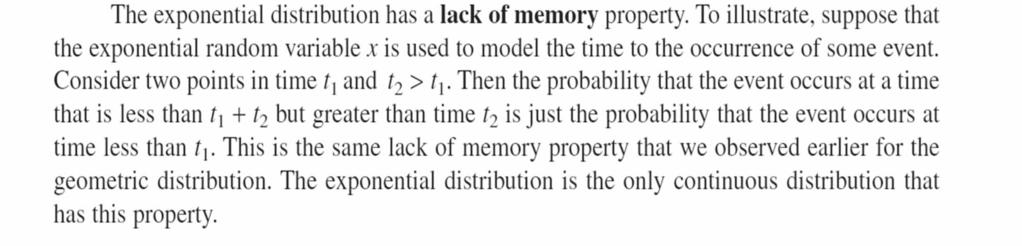
48 Lack-of-memory property 48
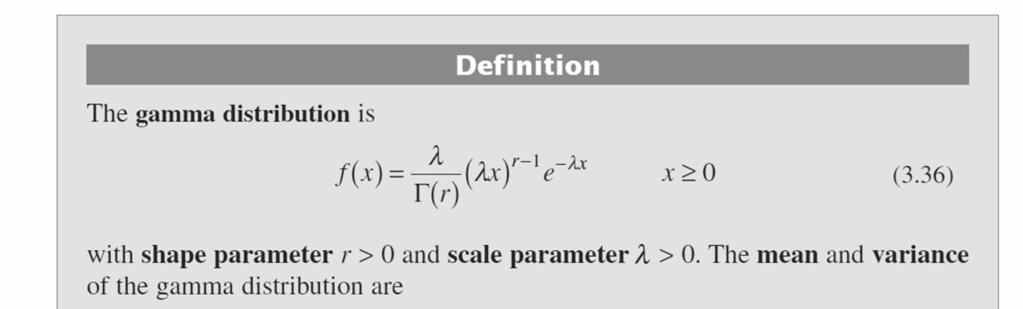

49 The Gamma Distribution 49
50 50

51 When r is an integer, the gamma distribution is the result of summing r independently and identically exponential random variables each with parameter λ. The gamma distribution has many applications in reliability engineering. 51


52 The Weibull Distribution Chapter 3 Introduction to Statistical Quality Control, 7th Edition by Douglas C. Montgomery. 52 Copyright (c) 2012 John Wiley & Sons, Inc.
53 When β = 1, the Weibull reduces to the exponential 53
54 An Application of the Weibull Distribution 54
55 3.4 Probability Plots Determining if a sample of data might reasonably be assumed to come from a specific distribution Probability plots are available for various distributions Easy to construct with computer software (MINITAB) Subjective interpretation 55
56 Normal Probability Plot 56
57 57
58 The Normal Probability Plot on Standard Graph Paper 58

59 Other Probability Plots What is a reasonable choice as a probability model for these data? 59
60 60
61 3.5 Some Useful Approximations 61
62 62
Chapter 4: Commonly Used Distributions. Statistics for Engineers and Scientists Fourth Edition William Navidi
 Chapter 4: Commonly Used Distributions Statistics for Engineers and Scientists Fourth Edition William Navidi 2014 by Education. This is proprietary material solely for authorized instructor use. Not authorized
Commonly Used Distributions
 Chapter 4: Commonly Used Distributions 1 Introduction Statistical inference involves drawing a sample from a population and analyzing the sample data to learn about the population. We often have some knowledge
MAS187/AEF258. University of Newcastle upon Tyne
 MAS187/AEF258 University of Newcastle upon Tyne 2005-6 Contents 1 Collecting and Presenting Data 5 1.1 Introduction...................................... 5 1.1.1 Examples...................................
Probability Theory and Simulation Methods. April 9th, Lecture 20: Special distributions
 April 9th, 2018 Lecture 20: Special distributions Week 1 Chapter 1: Axioms of probability Week 2 Chapter 3: Conditional probability and independence Week 4 Chapters 4, 6: Random variables Week 9 Chapter
4-2 Probability Distributions and Probability Density Functions. Figure 4-2 Probability determined from the area under f(x).
.") 4-2 Probability Distributions and Probability Density Functions Figure 4-2 Probability determined from the area under f(x). 4-2 Probability Distributions and Probability Density Functions Definition 4-2
4-2 Probability Distributions and Probability Density Functions Figure 4-2 Probability determined from the area under f(x). 4-2 Probability Distributions and Probability Density Functions Definition 4-2
Subject CS1 Actuarial Statistics 1 Core Principles. Syllabus. for the 2019 exams. 1 June 2018
 ` Subject CS1 Actuarial Statistics 1 Core Principles Syllabus for the 2019 exams 1 June 2018 Copyright in this Core Reading is the property of the Institute and Faculty of Actuaries who are the sole distributors.
Lean Six Sigma: Training/Certification Books and Resources
 Lean Si Sigma Training/Certification Books and Resources Samples from MINITAB BOOK Quality and Si Sigma Tools using MINITAB Statistical Software A complete Guide to Si Sigma DMAIC Tools using MINITAB Prof.
ME3620. Theory of Engineering Experimentation. Spring Chapter III. Random Variables and Probability Distributions.
 ME3620 Theory of Engineering Experimentation Chapter III. Random Variables and Probability Distributions Chapter III 1 3.2 Random Variables In an experiment, a measurement is usually denoted by a variable
Session Window. Variable Name Row. Worksheet Window. Double click on MINITAB icon. You will see a split screen: Getting Started with MINITAB
 STARTING MINITAB: Double click on MINITAB icon. You will see a split screen: Session Window Worksheet Window Variable Name Row ACTIVE WINDOW = BLUE INACTIVE WINDOW = GRAY f(x) F(x) Getting Started with
Discrete Random Variables and Their Probability Distributions
 58 Chapter 5 Discrete Random Variables and Their Probability Distributions Discrete Random Variables and Their Probability Distributions Chapter 5 Section 5.6 Example 5-18, pg. 213 Calculating a Binomial
MAS187/AEF258. University of Newcastle upon Tyne
 MAS187/AEF258 University of Newcastle upon Tyne 2005-6 Contents 1 Collecting and Presenting Data 5 1.1 Introduction...................................... 5 1.1.1 Examples...................................
PROBABILITY. Wiley. With Applications and R ROBERT P. DOBROW. Department of Mathematics. Carleton College Northfield, MN
 PROBABILITY With Applications and R ROBERT P. DOBROW Department of Mathematics Carleton College Northfield, MN Wiley CONTENTS Preface Acknowledgments Introduction xi xiv xv 1 First Principles 1 1.1 Random
Probability (10A) Young Won Lim 5/29/17
 Young Won Lim 5/29/17") Probability (10A) Copyright (c) 2017 Young W. Lim. Permission is granted to copy, distribute and/or modify this document under the terms of the GNU Free Documentation License, Version 1.2 or any later
Probability (10A) Copyright (c) 2017 Young W. Lim. Permission is granted to copy, distribute and/or modify this document under the terms of the GNU Free Documentation License, Version 1.2 or any later
Chapter 4 Probability Distributions
 Slide 1 Chapter 4 Probability Distributions Slide 2 4-1 Overview 4-2 Random Variables 4-3 Binomial Probability Distributions 4-4 Mean, Variance, and Standard Deviation for the Binomial Distribution 4-5
Lecture Slides. Elementary Statistics Tenth Edition. by Mario F. Triola. and the Triola Statistics Series
 Lecture Slides Elementary Statistics Tenth Edition and the Triola Statistics Series by Mario F. Triola Slide 1 Chapter 5 Probability Distributions 5-1 Overview 5-2 Random Variables 5-3 Binomial Probability
2011 Pearson Education, Inc
 Statistics for Business and Economics Chapter 4 Random Variables & Probability Distributions Content 1. Two Types of Random Variables 2. Probability Distributions for Discrete Random Variables 3. The Binomial
Probability and Statistics
 Kristel Van Steen, PhD 2 Montefiore Institute - Systems and Modeling GIGA - Bioinformatics ULg kristel.vansteen@ulg.ac.be CHAPTER 3: PARAMETRIC FAMILIES OF UNIVARIATE DISTRIBUTIONS 1 Why do we need distributions?
Chapter 7: Point Estimation and Sampling Distributions
 Chapter 7: Point Estimation and Sampling Distributions Seungchul Baek Department of Statistics, University of South Carolina STAT 509: Statistics for Engineers 1 / 20 Motivation In chapter 3, we learned
Contents. An Overview of Statistical Applications CHAPTER 1. Contents (ix) Preface... (vii)
 Preface... (vii)") Contents (ix) Contents Preface... (vii) CHAPTER 1 An Overview of Statistical Applications 1.1 Introduction... 1 1. Probability Functions and Statistics... 1..1 Discrete versus Continuous Functions... 1..
Contents (ix) Contents Preface... (vii) CHAPTER 1 An Overview of Statistical Applications 1.1 Introduction... 1 1. Probability Functions and Statistics... 1..1 Discrete versus Continuous Functions... 1..
4-1. Chapter 4. Commonly Used Distributions by The McGraw-Hill Companies, Inc. All rights reserved.
 4-1 Chapter 4 Commonly Used Distributions 2014 by The Companies, Inc. All rights reserved. Section 4.1: The Bernoulli Distribution 4-2 We use the Bernoulli distribution when we have an experiment which
Contents Part I Descriptive Statistics 1 Introduction and Framework Population, Sample, and Observations Variables Quali
 Part I Descriptive Statistics 1 Introduction and Framework... 3 1.1 Population, Sample, and Observations... 3 1.2 Variables.... 4 1.2.1 Qualitative and Quantitative Variables.... 5 1.2.2 Discrete and Continuous
Discrete Probability Distributions
 90 Discrete Probability Distributions Discrete Probability Distributions C H A P T E R 6 Section 6.2 4Example 2 (pg. 00) Constructing a Binomial Probability Distribution In this example, 6% of the human
Basic Procedure for Histograms
 Basic Procedure for Histograms 1. Compute the range of observations (min. & max. value) 2. Choose an initial # of classes (most likely based on the range of values, try and find a number of classes that
St. Xavier s College Autonomous Mumbai STATISTICS. F.Y.B.Sc. Syllabus For 1 st Semester Courses in Statistics (June 2015 onwards)
") St. Xavier s College Autonomous Mumbai STATISTICS F.Y.B.Sc Syllabus For 1 st Semester Courses in Statistics (June 2015 onwards) Contents: Theory Syllabus for Courses: S.STA.1.01 Descriptive Statistics
St. Xavier s College Autonomous Mumbai STATISTICS F.Y.B.Sc Syllabus For 1 st Semester Courses in Statistics (June 2015 onwards) Contents: Theory Syllabus for Courses: S.STA.1.01 Descriptive Statistics
Overview. Definitions. Definitions. Graphs. Chapter 4 Probability Distributions. probability distributions
 Chapter 4 Probability Distributions 4-1 Overview 4-2 Random Variables 4-3 Binomial Probability Distributions 4-4 Mean, Variance, and Standard Deviation for the Binomial Distribution 4-5 The Poisson Distribution
Chapter 3 Discrete Random Variables and Probability Distributions
 Chapter 3 Discrete Random Variables and Probability Distributions Part 3: Special Discrete Random Variable Distributions Section 3.5 Discrete Uniform Section 3.6 Bernoulli and Binomial Others sections
Describing Uncertain Variables
 Describing Uncertain Variables L7 Uncertainty in Variables Uncertainty in concepts and models Uncertainty in variables Lack of precision Lack of knowledge Variability in space/time Describing Uncertainty
St. Xavier s College Autonomous Mumbai F.Y.B.A. Syllabus For 1 st Semester Course in Statistics (June 2017 onwards)
") St. Xavier s College Autonomous Mumbai Syllabus For 1 st Semester Course in Statistics (June 2017 onwards) Contents: Theory Syllabus for Courses: A.STA.1.01 Descriptive Statistics (A). Practical Course
St. Xavier s College Autonomous Mumbai Syllabus For 1 st Semester Course in Statistics (June 2017 onwards) Contents: Theory Syllabus for Courses: A.STA.1.01 Descriptive Statistics (A). Practical Course
Normal Distribution. Definition A continuous rv X is said to have a normal distribution with. the pdf of X is
 Normal Distribution Normal Distribution Definition A continuous rv X is said to have a normal distribution with parameter µ and σ (µ and σ 2 ), where < µ < and σ > 0, if the pdf of X is f (x; µ, σ) = 1
Chapter 5: Statistical Inference (in General)
") Chapter 5: Statistical Inference (in General) Shiwen Shen University of South Carolina 2016 Fall Section 003 1 / 17 Motivation In chapter 3, we learn the discrete probability distributions, including Bernoulli,
Chapter 5: Statistical Inference (in General) Shiwen Shen University of South Carolina 2016 Fall Section 003 1 / 17 Motivation In chapter 3, we learn the discrete probability distributions, including Bernoulli,
Probability Distribution Unit Review
 Probability Distribution Unit Review Topics: Pascal's Triangle and Binomial Theorem Probability Distributions and Histograms Expected Values, Fair Games of chance Binomial Distributions Hypergeometric
2 of PU_2015_375 Which of the following measures is more flexible when compared to other measures?
 PU M Sc Statistics 1 of 100 194 PU_2015_375 The population census period in India is for every:- quarterly Quinqennial year biannual Decennial year 2 of 100 105 PU_2015_375 Which of the following measures
The normal distribution is a theoretical model derived mathematically and not empirically.
 Sociology 541 The Normal Distribution Probability and An Introduction to Inferential Statistics Normal Approximation The normal distribution is a theoretical model derived mathematically and not empirically.
Some Discrete Distribution Families
 Some Discrete Distribution Families ST 370 Many families of discrete distributions have been studied; we shall discuss the ones that are most commonly found in applications. In each family, we need a formula
GETTING STARTED. To OPEN MINITAB: Click Start>Programs>Minitab14>Minitab14 or Click Minitab 14 on your Desktop
 Minitab 14 1 GETTING STARTED To OPEN MINITAB: Click Start>Programs>Minitab14>Minitab14 or Click Minitab 14 on your Desktop The Minitab session will come up like this 2 To SAVE FILE 1. Click File>Save Project
Converting to the Standard Normal rv: Exponential PDF and CDF for x 0 Chapter 7: expected value of x
 Key Formula Sheet ASU ECN 22 ASWCC Chapter : no key formulas Chapter 2: Relative Frequency=freq of the class/n Approx Class Width: =(largest value-smallest value) /number of classes Chapter 3: sample and
Binomial and Normal Distributions
 Binomial and Normal Distributions Bernoulli Trials A Bernoulli trial is a random experiment with 2 special properties: The result of a Bernoulli trial is binary. Examples: Heads vs. Tails, Healthy vs.
DATA SUMMARIZATION AND VISUALIZATION
 APPENDIX DATA SUMMARIZATION AND VISUALIZATION PART 1 SUMMARIZATION 1: BUILDING BLOCKS OF DATA ANALYSIS 294 PART 2 PART 3 PART 4 VISUALIZATION: GRAPHS AND TABLES FOR SUMMARIZING AND ORGANIZING DATA 296
CH 5 Normal Probability Distributions Properties of the Normal Distribution
 Properties of the Normal Distribution Example A friend that is always late. Let X represent the amount of minutes that pass from the moment you are suppose to meet your friend until the moment your friend
Data Analytics (CS40003) Practice Set IV (Topic: Probability and Sampling Distribution)
 Practice Set IV (Topic: Probability and Sampling Distribution)") Data Analytics (CS40003) Practice Set IV (Topic: Probability and Sampling Distribution) I. Concept Questions 1. Give an example of a random variable in the context of Drawing a card from a deck of cards.
Data Analytics (CS40003) Practice Set IV (Topic: Probability and Sampling Distribution) I. Concept Questions 1. Give an example of a random variable in the context of Drawing a card from a deck of cards.
Chapter. Section 4.2. Chapter 4. Larson/Farber 5 th ed 1. Chapter Outline. Discrete Probability Distributions. Section 4.
 Chapter Discrete Probability s Chapter Outline 1 Probability s 2 Binomial s 3 More Discrete Probability s Copyright 2015, 2012, and 2009 Pearson Education, Inc 1 Copyright 2015, 2012, and 2009 Pearson
Counting Basics. Venn diagrams
 Counting Basics Sets Ways of specifying sets Union and intersection Universal set and complements Empty set and disjoint sets Venn diagrams Counting Inclusion-exclusion Multiplication principle Addition
ก ก ก ก ก ก ก. ก (Food Safety Risk Assessment Workshop) 1 : Fundamental ( ก ( NAC 2010)) 2 3 : Excel and Statistics Simulation Software\
 1 : Fundamental ( ก ( NAC 2010)) 2 3 : Excel and Statistics Simulation Software\") ก ก ก ก (Food Safety Risk Assessment Workshop) ก ก ก ก ก ก ก ก 5 1 : Fundamental ( ก 29-30.. 53 ( NAC 2010)) 2 3 : Excel and Statistics Simulation Software\ 1 4 2553 4 5 : Quantitative Risk Modeling Microbial
ก ก ก ก (Food Safety Risk Assessment Workshop) ก ก ก ก ก ก ก ก 5 1 : Fundamental ( ก 29-30.. 53 ( NAC 2010)) 2 3 : Excel and Statistics Simulation Software\ 1 4 2553 4 5 : Quantitative Risk Modeling Microbial
Model Paper Statistics Objective. Paper Code Time Allowed: 20 minutes
 Model Paper Statistics Objective Intermediate Part I (11 th Class) Examination Session 2012-2013 and onward Total marks: 17 Paper Code Time Allowed: 20 minutes Note:- You have four choices for each objective
UQ, STAT2201, 2017, Lectures 3 and 4 Unit 3 Probability Distributions.
 UQ, STAT2201, 2017, Lectures 3 and 4 Unit 3 Probability Distributions. Random Variables 2 A random variable X is a numerical (integer, real, complex, vector etc.) summary of the outcome of the random experiment.
Control Charts. A control chart consists of:
 Control Charts The control chart is a graph that represents the variability of a process variable over time. Control charts are used to determine whether a process is in a state of statistical control,
Example. Chapter 8 Probability Distributions and Statistics Section 8.1 Distributions of Random Variables
 Chapter 8 Probability Distributions and Statistics Section 8.1 Distributions of Random Variables You are dealt a hand of 5 cards. Find the probability distribution table for the number of hearts. Graph
LAB 2 INSTRUCTIONS PROBABILITY DISTRIBUTIONS IN EXCEL
 LAB 2 INSTRUCTIONS PROBABILITY DISTRIBUTIONS IN EXCEL There is a wide range of probability distributions (both discrete and continuous) available in Excel. They can be accessed through the Insert Function
A First Course in Probability
 A First Course in Probability Seventh Edition Sheldon Ross University of Southern California PEARSON Prentice Hall Upper Saddle River, New Jersey 07458 Preface 1 Combinatorial Analysis 1 1.1 Introduction
ENGM 720 Statistical Process Control 4/27/2016. REVIEW SHEET FOR FINAL Topics
 REVIEW SHEET FOR FINAL Topics Introduction to Statistical Quality Control 1. Definition of Quality (p. 6) 2. Cost of Quality 3. Review of Elementary Statistics** a. Stem & Leaf Plot b. Histograms c. Box
**BEGINNING OF EXAMINATION** A random sample of five observations from a population is:
 **BEGINNING OF EXAMINATION** 1. You are given: (i) A random sample of five observations from a population is: 0.2 0.7 0.9 1.1 1.3 (ii) You use the Kolmogorov-Smirnov test for testing the null hypothesis,
Examples: Random Variables. Discrete and Continuous Random Variables. Probability Distributions
 Random Variables Examples: Random variable a variable (typically represented by x) that takes a numerical value by chance. Number of boys in a randomly selected family with three children. Possible values:
SOCIETY OF ACTUARIES EXAM STAM SHORT-TERM ACTUARIAL MATHEMATICS EXAM STAM SAMPLE QUESTIONS
 SOCIETY OF ACTUARIES EXAM STAM SHORT-TERM ACTUARIAL MATHEMATICS EXAM STAM SAMPLE QUESTIONS Questions 1-307 have been taken from the previous set of Exam C sample questions. Questions no longer relevant
Probability Models.S2 Discrete Random Variables
 Probability Models.S2 Discrete Random Variables Operations Research Models and Methods Paul A. Jensen and Jonathan F. Bard Results of an experiment involving uncertainty are described by one or more random
Monte Carlo Simulation (General Simulation Models)
") Monte Carlo Simulation (General Simulation Models) Revised: 10/11/2017 Summary... 1 Example #1... 1 Example #2... 10 Summary Monte Carlo simulation is used to estimate the distribution of variables when
Monte Carlo Simulation (General Simulation Models) Revised: 10/11/2017 Summary... 1 Example #1... 1 Example #2... 10 Summary Monte Carlo simulation is used to estimate the distribution of variables when
Discrete Probability Distributions and application in Business
 http://wiki.stat.ucla.edu/socr/index.php/socr_courses_2008_thomson_econ261 Discrete Probability Distributions and application in Business By Grace Thomson DISCRETE PROBALITY DISTRIBUTIONS Discrete Probabilities
Statistics & Flood Frequency Chapter 3. Dr. Philip B. Bedient
 Statistics & Flood Frequency Chapter 3 Dr. Philip B. Bedient Predicting FLOODS Flood Frequency Analysis n Statistical Methods to evaluate probability exceeding a particular outcome - P (X >20,000 cfs)
UNIT 4 MATHEMATICAL METHODS
 UNIT 4 MATHEMATICAL METHODS PROBABILITY Section 1: Introductory Probability Basic Probability Facts Probabilities of Simple Events Overview of Set Language Venn Diagrams Probabilities of Compound Events
Background. opportunities. the transformation. probability. at the lower. data come
 The T Chart in Minitab Statisti cal Software Background The T chart is a control chart used to monitor the amount of time between adverse events, where time is measured on a continuous scale. The T chart
Statistics 6 th Edition
 Statistics 6 th Edition Chapter 5 Discrete Probability Distributions Chap 5-1 Definitions Random Variables Random Variables Discrete Random Variable Continuous Random Variable Ch. 5 Ch. 6 Chap 5-2 Discrete
Data that can be any numerical value are called continuous. These are usually things that are measured, such as height, length, time, speed, etc.
 Chapter 8 Measures of Center Data that can be any numerical value are called continuous. These are usually things that are measured, such as height, length, time, speed, etc. Data that can only be integer
Binomial Random Variables. Binomial Random Variables
 Bernoulli Trials Definition A Bernoulli trial is a random experiment in which there are only two possible outcomes - success and failure. 1 Tossing a coin and considering heads as success and tails as
Cambridge University Press Risk Modelling in General Insurance: From Principles to Practice Roger J. Gray and Susan M.
 adjustment coefficient, 272 and Cramér Lundberg approximation, 302 existence, 279 and Lundberg s inequality, 272 numerical methods for, 303 properties, 272 and reinsurance (case study), 348 statistical
Overview. Definitions. Definitions. Graphs. Chapter 5 Probability Distributions. probability distributions
 Chapter 5 Probability Distributions 5-1 Overview 5-2 Random Variables 5-3 Binomial Probability Distributions 5-4 Mean, Variance, and Standard Deviation for the Binomial Distribution 5-5 The Poisson Distribution
5. In fact, any function of a random variable is also a random variable
 Random Variables - Class 11 October 14, 2012 Debdeep Pati 1 Random variables 1.1 Expectation of a function of a random variable 1. Expectation of a function of a random variable 2. We know E(X) = x xp(x)
Gujarat University Choice Based Credit System (CBCS) Syllabus for Statistics (UG) B. Sc. Semester III and IV Effective from June, 2018.
 Syllabus for Statistics (UG) B. Sc. Semester III and IV Effective from June, 2018.") Gujarat University Choice Based Credit System (CBCS) Syllabus for Statistics (UG) B. Sc. Semester III and IV Effective from June, 2018 Semester -III Paper Number Name of the Paper Hours per Week Credit
Gujarat University Choice Based Credit System (CBCS) Syllabus for Statistics (UG) B. Sc. Semester III and IV Effective from June, 2018 Semester -III Paper Number Name of the Paper Hours per Week Credit
4.3 Normal distribution
 43 Normal distribution Prof Tesler Math 186 Winter 216 Prof Tesler 43 Normal distribution Math 186 / Winter 216 1 / 4 Normal distribution aka Bell curve and Gaussian distribution The normal distribution
The Normal Distribution
 The Normal Distribution The normal distribution plays a central role in probability theory and in statistics. It is often used as a model for the distribution of continuous random variables. Like all models,
STAT 157 HW1 Solutions
 STAT 157 HW1 Solutions http://www.stat.ucla.edu/~dinov/courses_students.dir/10/spring/stats157.dir/ Problem 1. 1.a: (6 points) Determine the Relative Frequency and the Cumulative Relative Frequency (fill
Chapter Learning Objectives. Discrete Random Variables. Chapter 3: Discrete Random Variables and Probability Distributions.
 Chapter 3: Discrete Random Variables and Probability Distributions 3-1Discrete Random Variables ibl 3-2 Probability Distributions and Probability Mass Functions 3-33 Cumulative Distribution ib ti Functions
Example - Let X be the number of boys in a 4 child family. Find the probability distribution table:
 Chapter8 Probability Distributions and Statistics Section 8.1 Distributions of Random Variables tthe value of the result of the probability experiment is a RANDOM VARIABLE. Example - Let X be the number
Epidemiology Principle of Biostatistics Chapter 7: Sampling Distributions (continued) John Koval
 John Koval") Principle of Biostatistics Chapter 7: Sampling Distributions (continued) John Koval Department of Epidemiology and Biostatistics University of Western Ontario Next want to look at histogram of sample statistics
Principle of Biostatistics Chapter 7: Sampling Distributions (continued) John Koval Department of Epidemiology and Biostatistics University of Western Ontario Next want to look at histogram of sample statistics
CVE SOME DISCRETE PROBABILITY DISTRIBUTIONS
 CVE 472 2. SOME DISCRETE PROBABILITY DISTRIBUTIONS Assist. Prof. Dr. Bertuğ Akıntuğ Civil Engineering Program Middle East Technical University Northern Cyprus Campus CVE 472 Statistical Techniques in Hydrology.
ECON 214 Elements of Statistics for Economists 2016/2017
 ECON 214 Elements of Statistics for Economists 2016/2017 Topic The Normal Distribution Lecturer: Dr. Bernardin Senadza, Dept. of Economics bsenadza@ug.edu.gh College of Education School of Continuing and
Introduction to Statistical Data Analysis II
 Introduction to Statistical Data Analysis II JULY 2011 Afsaneh Yazdani Preface Major branches of Statistics: - Descriptive Statistics - Inferential Statistics Preface What is Inferential Statistics? Preface
Chapter 5 Normal Probability Distributions
 Chapter 5 Normal Probability Distributions Section 5-1 Introduction to Normal Distributions and the Standard Normal Distribution A The normal distribution is the most important of the continuous probability
Normal distribution Approximating binomial distribution by normal 2.10 Central Limit Theorem
 1.1.2 Normal distribution 1.1.3 Approimating binomial distribution by normal 2.1 Central Limit Theorem Prof. Tesler Math 283 Fall 216 Prof. Tesler 1.1.2-3, 2.1 Normal distribution Math 283 / Fall 216 1
Example - Let X be the number of boys in a 4 child family. Find the probability distribution table:
 Chapter7 Probability Distributions and Statistics Distributions of Random Variables tthe value of the result of the probability experiment is a RANDOM VARIABLE. Example - Let X be the number of boys in
Lecture 3: Probability Distributions (cont d)
") EAS31116/B9036: Statistics in Earth & Atmospheric Sciences Lecture 3: Probability Distributions (cont d) Instructor: Prof. Johnny Luo www.sci.ccny.cuny.edu/~luo Dates Topic Reading (Based on the 2 nd Edition
EAS31116/B9036: Statistics in Earth & Atmospheric Sciences Lecture 3: Probability Distributions (cont d) Instructor: Prof. Johnny Luo www.sci.ccny.cuny.edu/~luo Dates Topic Reading (Based on the 2 nd Edition
Discrete Probability Distributions
 Page 1 of 6 Discrete Probability Distributions In order to study inferential statistics, we need to combine the concepts from descriptive statistics and probability. This combination makes up the basics
Appendix A. Selecting and Using Probability Distributions. In this appendix
 Appendix A Selecting and Using Probability Distributions In this appendix Understanding probability distributions Selecting a probability distribution Using basic distributions Using continuous distributions
Statistics for Managers Using Microsoft Excel 7 th Edition
 Statistics for Managers Using Microsoft Excel 7 th Edition Chapter 5 Discrete Probability Distributions Statistics for Managers Using Microsoft Excel 7e Copyright 014 Pearson Education, Inc. Chap 5-1 Learning
Math 2311 Bekki George Office Hours: MW 11am to 12:45pm in 639 PGH Online Thursdays 4-5:30pm And by appointment
 Math 2311 Bekki George bekki@math.uh.edu Office Hours: MW 11am to 12:45pm in 639 PGH Online Thursdays 4-5:30pm And by appointment Class webpage: http://www.math.uh.edu/~bekki/math2311.html Math 2311 Class
AP STATISTICS FALL SEMESTSER FINAL EXAM STUDY GUIDE
 AP STATISTICS Name: FALL SEMESTSER FINAL EXAM STUDY GUIDE Period: *Go over Vocabulary Notecards! *This is not a comprehensive review you still should look over your past notes, homework/practice, Quizzes,
STATISTICAL DISTRIBUTIONS AND THE CALCULATOR
 STATISTICAL DISTRIBUTIONS AND THE CALCULATOR 1. Basic data sets a. Measures of Center - Mean ( ): average of all values. Characteristic: non-resistant is affected by skew and outliers. - Median: Either
ExcelSim 2003 Documentation
 ExcelSim 2003 Documentation Note: The ExcelSim 2003 add-in program is copyright 2001-2003 by Timothy R. Mayes, Ph.D. It is free to use, but it is meant for educational use only. If you wish to perform
CS 237: Probability in Computing
 CS 237: Probability in Computing Wayne Snyder Computer Science Department Boston University Lecture 10: o Cumulative Distribution Functions o Standard Deviations Bernoulli Binomial Geometric Cumulative
3.2 Binomial and Hypergeometric Probabilities
 3.2 Binomial and Hypergeometric Probabilities Ulrich Hoensch Wednesday, January 23, 2013 Example An urn contains ten balls, exactly seven of which are red. Suppose five balls are drawn at random and with
Statistics (This summary is for chapters 17, 28, 29 and section G of chapter 19)
") Statistics (This summary is for chapters 17, 28, 29 and section G of chapter 19) Mean, Median, Mode Mode: most common value Median: middle value (when the values are in order) Mean = total how many = x
Statistics (This summary is for chapters 17, 28, 29 and section G of chapter 19) Mean, Median, Mode Mode: most common value Median: middle value (when the values are in order) Mean = total how many = x
Chapter 17. Probability Models. Copyright 2010 Pearson Education, Inc.
 Chapter 17 Probability Models Copyright 2010 Pearson Education, Inc. Bernoulli Trials The basis for the probability models we will examine in this chapter is the Bernoulli trial. We have Bernoulli trials
Chapter 4 Random Variables & Probability. Chapter 4.5, 6, 8 Probability Distributions for Continuous Random Variables
 Chapter 4.5, 6, 8 Probability for Continuous Random Variables Discrete vs. continuous random variables Examples of continuous distributions o Uniform o Exponential o Normal Recall: A random variable =
34.S-[F] SU-02 June All Syllabus Science Faculty B.Sc. I Yr. Stat. [Opt.] [Sem.I & II] - 1 -
![34.S-[F] SU-02 June All Syllabus Science Faculty B.Sc. I Yr. Stat. [Opt.] [Sem.I & II] - 1 -](/thumbs/87/96342487.jpg "34.S-[F] SU-02 June All Syllabus Science Faculty B.Sc. I Yr. Stat. [Opt.] [Sem.I & II] - 1 -") [Sem.I & II] - 1 - [Sem.I & II] - 2 - [Sem.I & II] - 3 - Syllabus of B.Sc. First Year Statistics [Optional ] Sem. I & II effect for the academic year 2014 2015 [Sem.I & II] - 4 - SYLLABUS OF F.Y.B.Sc.
[Sem.I & II] - 1 - [Sem.I & II] - 2 - [Sem.I & II] - 3 - Syllabus of B.Sc. First Year Statistics [Optional ] Sem. I & II effect for the academic year 2014 2015 [Sem.I & II] - 4 - SYLLABUS OF F.Y.B.Sc.
Sampling Distributions
 Section 8.1 119 Sampling Distributions Section 8.1 C H A P T E R 8 4Example 2 (pg. 378) Sampling Distribution of the Sample Mean The heights of 3-year-old girls are normally distributed with μ=38.72 and
Chapter 3 Discrete Random Variables and Probability Distributions
 Chapter 3 Discrete Random Variables and Probability Distributions Part 4: Special Discrete Random Variable Distributions Sections 3.7 & 3.8 Geometric, Negative Binomial, Hypergeometric NOTE: The discrete
Discrete-time Asset Pricing Models in Applied Stochastic Finance
 Discrete-time Asset Pricing Models in Applied Stochastic Finance P.C.G. Vassiliou ) WILEY Table of Contents Preface xi Chapter ^Probability and Random Variables 1 1.1. Introductory notes 1 1.2. Probability
KARACHI UNIVERSITY BUSINESS SCHOOL UNIVERSITY OF KARACHI BS (BBA) VI
 VI") 88 P a g e B S ( B B A ) S y l l a b u s KARACHI UNIVERSITY BUSINESS SCHOOL UNIVERSITY OF KARACHI BS (BBA) VI Course Title : STATISTICS Course Number : BA(BS) 532 Credit Hours : 03 Course 1. Statistical
88 P a g e B S ( B B A ) S y l l a b u s KARACHI UNIVERSITY BUSINESS SCHOOL UNIVERSITY OF KARACHI BS (BBA) VI Course Title : STATISTICS Course Number : BA(BS) 532 Credit Hours : 03 Course 1. Statistical
Basic Principles of Probability and Statistics. Lecture notes for PET 472 Spring 2010 Prepared by: Thomas W. Engler, Ph.D., P.E
 Basic Principles of Probability and Statistics Lecture notes for PET 472 Spring 2010 Prepared by: Thomas W. Engler, Ph.D., P.E Definitions Risk Analysis Assessing probabilities of occurrence for each possible
Descriptive Statistics Bios 662
 Descriptive Statistics Bios 662 Michael G. Hudgens, Ph.D. mhudgens@bios.unc.edu http://www.bios.unc.edu/ mhudgens 2008-08-19 08:51 BIOS 662 1 Descriptive Statistics Descriptive Statistics Types of variables
Continuous Probability Distributions
 8.1 Continuous Probability Distributions Distributions like the binomial probability distribution and the hypergeometric distribution deal with discrete data. The possible values of the random variable
Review for Final Exam Spring 2014 Jeremy Orloff and Jonathan Bloom
 Review for Final Exam 18.05 Spring 2014 Jeremy Orloff and Jonathan Bloom THANK YOU!!!! JON!! PETER!! RUTHI!! ERIKA!! ALL OF YOU!!!! Probability Counting Sets Inclusion-exclusion principle Rule of product