Statistics & Flood Frequency Chapter 3. Dr. Philip B. Bedient
|
|
|
- Geraldine Horton
- 6 years ago
- Views:
Transcription


1 Statistics & Flood Frequency Chapter 3 Dr. Philip B. Bedient
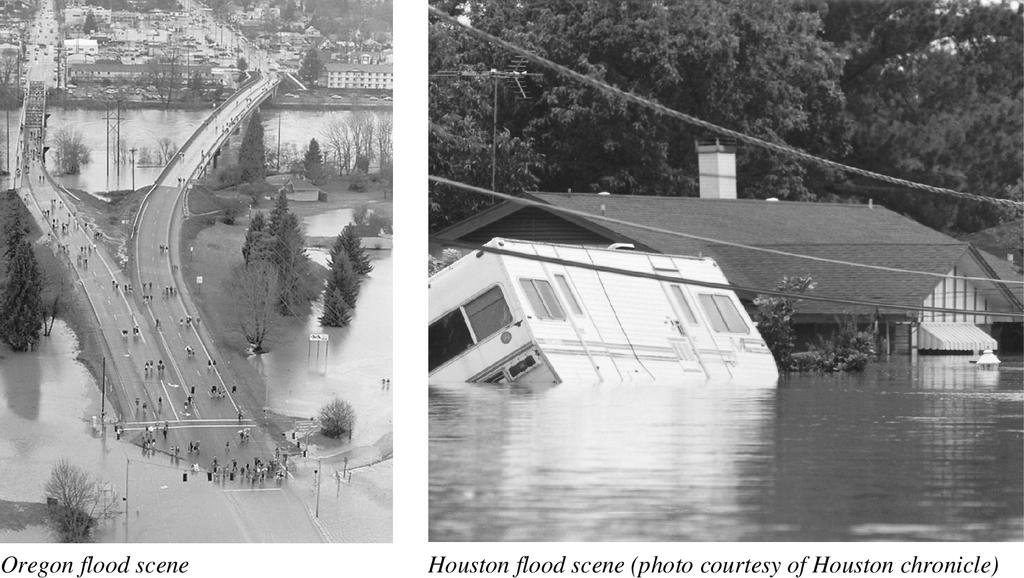
2 Predicting FLOODS
3 Flood Frequency Analysis n Statistical Methods to evaluate probability exceeding a particular outcome - P (X >20,000 cfs) = 10% n Used to determine return periods of rainfall or flows n Used to determine specific frequency flows for floodplain mapping purposes (10, 25, 50, 100 yr) n Used for datasets that have no obvious trends n Used to statistically extend data sets
4 Random Variables n Parameter that cannot be predicted with certainty n Outcome of a random or uncertain process - flipping a coin or picking out a card from deck n Can be discrete or continuous n Data are usually discrete or quantized n Usually easier to apply continuous distribution to discrete data that has been organized into bins
5 Typical CDF F(x 1 ) - F(x 2 ) Continuous Discrete F(x 1 ) = P(x < x 1 )
6 Freq Histogram of Flows Probability that Q is 10,000 to 15, 000 = 17.3% Prob that Q < 20,000 = = 54.6%
7 Probability Distributions CDF is the most useful form for analysis i F(x) = P(X x) = P(x i ) F(x 1 ) = P( x x 1 ) = x 1 f (x) dx P(x 1 x x 2 ) = F(x 2 ) F(x 1 )
8 Moments of a Distribution Used to characterize a distribution or set of data! Moments taken about the origin (1 st ) or the mean (2 nd, 3 rd, etc)" Discrete P (x i ) µ N ' = x i N P( x ) i Continuous f (x) µ N ' = x N f x ( )dx
9 Moments of a Distribution First Moment about the Origin - Mean" E(x) = µ = x i P(x i ) Discrete E(x) = µ = xf (x) dx Continuous
10 Var(x) = Variance " Second moment about mean Var(x) = σ 2 = (x i µ) 2 P(x i ) Var(x) = (x µ) 2 f (x) dx Var(x) = E(x 2 ) (E(x)) 2 cv = σ µ = Coeff. of Variation
11 Estimates of Moments from a Dataset x = 1 n n x Mean of Data i i s x 2 = 1 n 1 (x x ) 2 Variance i Std Dev. S x = (S x2 ) 1/2
12 Skewness Coefficient" Used to evaluate high or low data points - flood or drought data Skewness µ 3 third central moment 3 σ C s = n (n 1)(n 2) (x i x ) 3 s x 3 skewness coeff. Coeff of Var = σ µ
13 Mean, Median, Mode Positive Skew moves mean to right Negative Skew moves mean to left Normal Dist n has mean = median = mode Median has highest prob. of occurrence
14 Skewed PDF - Long Right Tail

15 76 83 '98 01

16 Skewed Data

17 Climate Change Data
18 Siletz River Data Stationary Data Showing No Obvious Trends
19 Data with Trends
20 Frequency Histogram Probability that Q is 10,000 to 15, 000 = 17.3% Prob that Q < 20,000 = = 54.6%
21 Cumulative Histogram Probability that Q < 20,000 is 54.6 % Probability that Q > 25,000 is 19 %
22 PDF - Gamma Dist
23 Major Distributions n Binomial - P (x successes in n trials) n Exponential - decays rapidly to low probability - event arrival times n Normal - Symmetric based on µ and σ n Lognormal - Log data are normally dist d n Gamma - skewed distribution - hydro data n Log Pearson III -skewed logs -recommended by the IAC on water data - most often used
24 Binomial Distribution The probability of getting x successes followed by n-x failures is the product of prob of n independent events: p x (1-p) n-x This could be used to represent the case of flooding a success is exceeding a certain level while a failure is falling below that level in any given year. Thus, over a 25 year period, one would just add up the number of successes and the number of failures by year.
25 Binomial Distribution The probability of getting x successes followed by n-x failures is the product of prob of n independent events: p x (1-p) n-x This represents only one possible outcome. The number of ways of choosing x successes out of n events is the binomial coeff. The resulting distribution is the Binomial or B(n,p). n! P(x) = x!(n x)! px (1 p) n x x = 0, 1, 2, 3,..., n Bin. Coeff for single success in 3 years = 3(2)(1) / 2(1) = 3 For 3 success in 3 years = 6 / (3) (2)(1) = 1
26 Binomial Dist n B(n,p)
27 Risk and Reliability The probability of at least one success in n years, where the probability of success in any year is 1/T, is called the RISK. Prob success = p = 1/T and Prob failure = 1-p RISK = 1 - P(0) = 1 - Prob(no success in n years) = 1 - (1-p) n = 1 - (1-1/T) n Reliability = (1-1/T) n


28 Design Periods vs RISK and Design Life Expected Design Life (Years) Risk % x 2 x
29 Risk Example What is the probability of at least one 50 yr flood in a 30 year mortgage period, where the probability of success in any year is 1/T = 1.50 = 0.02 RISK = 1 - (1-1/T) n = 1 - (1-0.02) 30 = 1 - (0.98) 30 = or 46% If this is too large a risk, then increase design level to the 100 year where p = 0.01 RISK = 1 - (0.99) 30 = 0.26 or 26%
30 Important Probability Distributions Normal mean and std dev. zero skew Log Normal (Log data ) same as normal Gamma skewed data Exponential- constant skew
31 Normal, LogN, LPIII Data in bins Normal
32 Normal Prob Paper Normal Prob Paper converts the Normal CDF S curve into a straight line on a prob scale

33 Normal Prob Paper Std Dev = cfs Mean = 5200 cfs Std Dev = 1000 cfs Place mean at F = 50% Place one S x at 15.9 and 84.1% Connect points with st. line Plot data with plotting position formula P = m/n+1

34 Normal Dist n Fit Mean
35 Exponential Dist n Poisson Process where k is average no. of events per time and 1/k is the average time between arrivals f(t) = k e - kt for t > 0 Traffic flow Flood arrivals Telephone calls
36 Exponential Dist n f(t) = k e - kt for t > 0 F(t) = 1 - e - kt E(t) = 0 (tk)e kt dt Letting u = kt Mean or E(t) = 1 k Avg Time Between Events 0 ue u du = 1 k Var = 1 k 2
37 Q n = Gamma Dist n 1 # t % & n 1 ( e t / K KΓ(n) $ k ' Mean or E(t) = nk Var = nk 2 whereγ(n) = (n 1)! n =1 n =2 Unit Hydrographs n =3


38 Parameters of Dist n Distribution Normal x LogN Y =logx Gamma x Exp t Mean µ x µ y nk 1/k Variance σ x 2 σ y 2 nk 2 1/k 2 Skewness zero zero 2/n 0.5 2


39 Frequency Analysis of Peak Flow Data Year Rank Ordered cfs , , , , , , , ,
40 Frequency Analysis of Peak Flow Data n Take Mean and Variance (S.D.) of ranked data n Take Skewness C s of data (3rd moment about mean) n If C s near zero, assume normal dist n n If C s large, convert Y = Log x - (Mean and Var of Y) n Take Skewness of Log data - C s (Y) n If C s near zero, then fits Lognormal n If C s not zero, fit data to Log Pearson III


41 Siletz River Example " 75 data points - Excel Tools Original Q Y = Log Q Mean 20, Std Dev Skew Coef of Variation
42 Siletz River Example - Fit Normal and LogN Normal Distribution Q = Q m + z S Q Q 100 = (6089) = 34,620 cfs Mean + z (S.D.) Where z = std normal variate - tables Log N Distribution Y = Y m + k S Y Y 100 = (0.129) = k = freq factor and Q = 10 Y = 39,100 cfs
43 Log Pearson Type III Log Pearson Type III Y = Y m + k S Y K is a function of Cs and Recurrence Interval Table 3.4 lists values for pos and neg skews For Cs = -0.15, thus K = 2.15 from Table 3.4 Y 100 = (0.129) = Q = 10 Y = 36,927 cfs for LP III Plot several points on Log Prob paper

44 LogN Prob Paper for CDF What is the prob that flow exceeds some given value yr value Plot data with plotting position formula P = m/n+1, m = rank, n = # Log N dist n plots as straight line

45 LogN Plot of Siletz R. Mean Straight Line Fits Data Well

46 Siletz River Flow Data Various Fits of CDFs LP3 has curvature LN is straight line
47 Flow Duration Curves
48 Trends in data have to be removed before any Frequency Analysis White Oak at Houston ( ) Peak Flow (cfs) ' Years
Describing Uncertain Variables
 Describing Uncertain Variables L7 Uncertainty in Variables Uncertainty in concepts and models Uncertainty in variables Lack of precision Lack of knowledge Variability in space/time Describing Uncertainty
INDIAN INSTITUTE OF SCIENCE STOCHASTIC HYDROLOGY. Lecture -5 Course Instructor : Prof. P. P. MUJUMDAR Department of Civil Engg., IISc.
 INDIAN INSTITUTE OF SCIENCE STOCHASTIC HYDROLOGY Lecture -5 Course Instructor : Prof. P. P. MUJUMDAR Department of Civil Engg., IISc. Summary of the previous lecture Moments of a distribubon Measures of
Probability Theory and Simulation Methods. April 9th, Lecture 20: Special distributions
 April 9th, 2018 Lecture 20: Special distributions Week 1 Chapter 1: Axioms of probability Week 2 Chapter 3: Conditional probability and independence Week 4 Chapters 4, 6: Random variables Week 9 Chapter
4.3 Normal distribution
 43 Normal distribution Prof Tesler Math 186 Winter 216 Prof Tesler 43 Normal distribution Math 186 / Winter 216 1 / 4 Normal distribution aka Bell curve and Gaussian distribution The normal distribution
Chapter 7 1. Random Variables
 Chapter 7 1 Random Variables random variable numerical variable whose value depends on the outcome of a chance experiment - discrete if its possible values are isolated points on a number line - continuous
Normal distribution Approximating binomial distribution by normal 2.10 Central Limit Theorem
 1.1.2 Normal distribution 1.1.3 Approimating binomial distribution by normal 2.1 Central Limit Theorem Prof. Tesler Math 283 Fall 216 Prof. Tesler 1.1.2-3, 2.1 Normal distribution Math 283 / Fall 216 1
Statistics 6 th Edition
 Statistics 6 th Edition Chapter 5 Discrete Probability Distributions Chap 5-1 Definitions Random Variables Random Variables Discrete Random Variable Continuous Random Variable Ch. 5 Ch. 6 Chap 5-2 Discrete
Some Characteristics of Data
 Some Characteristics of Data Not all data is the same, and depending on some characteristics of a particular dataset, there are some limitations as to what can and cannot be done with that data. Some key
Version A. Problem 1. Let X be the continuous random variable defined by the following pdf: 1 x/2 when 0 x 2, f(x) = 0 otherwise.
 = 0 otherwise.") Math 224 Q Exam 3A Fall 217 Tues Dec 12 Version A Problem 1. Let X be the continuous random variable defined by the following pdf: { 1 x/2 when x 2, f(x) otherwise. (a) Compute the mean µ E[X]. E[X] x
Math 224 Q Exam 3A Fall 217 Tues Dec 12 Version A Problem 1. Let X be the continuous random variable defined by the following pdf: { 1 x/2 when x 2, f(x) otherwise. (a) Compute the mean µ E[X]. E[X] x
Basic Procedure for Histograms
 Basic Procedure for Histograms 1. Compute the range of observations (min. & max. value) 2. Choose an initial # of classes (most likely based on the range of values, try and find a number of classes that
Chapter 6 Continuous Probability Distributions. Learning objectives
 Chapter 6 Continuous s Slide 1 Learning objectives 1. Understand continuous probability distributions 2. Understand Uniform distribution 3. Understand Normal distribution 3.1. Understand Standard normal
Commonly Used Distributions
 Chapter 4: Commonly Used Distributions 1 Introduction Statistical inference involves drawing a sample from a population and analyzing the sample data to learn about the population. We often have some knowledge
MAS1403. Quantitative Methods for Business Management. Semester 1, Module leader: Dr. David Walshaw
 MAS1403 Quantitative Methods for Business Management Semester 1, 2018 2019 Module leader: Dr. David Walshaw Additional lecturers: Dr. James Waldren and Dr. Stuart Hall Announcements: Written assignment
Chapter 2. Random variables. 2.3 Expectation
 Random processes - Chapter 2. Random variables 1 Random processes Chapter 2. Random variables 2.3 Expectation 2.3 Expectation Random processes - Chapter 2. Random variables 2 Among the parameters representing
Chapter 8: The Binomial and Geometric Distributions
 Chapter 8: The Binomial and Geometric Distributions 8.1 Binomial Distributions 8.2 Geometric Distributions 1 Let me begin with an example My best friends from Kent School had three daughters. What is the
Hydrology 4410 Class 29. In Class Notes & Exercises Mar 27, 2013
 Hydrology 4410 Class 29 In Class Notes & Exercises Mar 27, 2013 Log Normal Distribution We will not work an example in class. The procedure is exactly the same as in the normal distribution, but first
ME3620. Theory of Engineering Experimentation. Spring Chapter III. Random Variables and Probability Distributions.
 ME3620 Theory of Engineering Experimentation Chapter III. Random Variables and Probability Distributions Chapter III 1 3.2 Random Variables In an experiment, a measurement is usually denoted by a variable
Topic 6 - Continuous Distributions I. Discrete RVs. Probability Density. Continuous RVs. Background Reading. Recall the discrete distributions
 Topic 6 - Continuous Distributions I Discrete RVs Recall the discrete distributions STAT 511 Professor Bruce Craig Binomial - X= number of successes (x =, 1,...,n) Geometric - X= number of trials (x =,...)
Frequency Distribution Models 1- Probability Density Function (PDF)
") Models 1- Probability Density Function (PDF) What is a PDF model? A mathematical equation that describes the frequency curve or probability distribution of a data set. Why modeling? It represents and summarizes
Models 1- Probability Density Function (PDF) What is a PDF model? A mathematical equation that describes the frequency curve or probability distribution of a data set. Why modeling? It represents and summarizes
2011 Pearson Education, Inc
 Statistics for Business and Economics Chapter 4 Random Variables & Probability Distributions Content 1. Two Types of Random Variables 2. Probability Distributions for Discrete Random Variables 3. The Binomial
4-2 Probability Distributions and Probability Density Functions. Figure 4-2 Probability determined from the area under f(x).
.") 4-2 Probability Distributions and Probability Density Functions Figure 4-2 Probability determined from the area under f(x). 4-2 Probability Distributions and Probability Density Functions Definition 4-2
4-2 Probability Distributions and Probability Density Functions Figure 4-2 Probability determined from the area under f(x). 4-2 Probability Distributions and Probability Density Functions Definition 4-2
1/2 2. Mean & variance. Mean & standard deviation
 Question # 1 of 10 ( Start time: 09:46:03 PM ) Total Marks: 1 The probability distribution of X is given below. x: 0 1 2 3 4 p(x): 0.73? 0.06 0.04 0.01 What is the value of missing probability? 0.54 0.16
Continuous random variables
 Continuous random variables probability density function (f(x)) the probability distribution function of a continuous random variable (analogous to the probability mass function for a discrete random variable),
AP Statistics Ch 8 The Binomial and Geometric Distributions
 Ch 8.1 The Binomial Distributions The Binomial Setting A situation where these four conditions are satisfied is called a binomial setting. 1. Each observation falls into one of just two categories, which
Statistics for Managers Using Microsoft Excel 7 th Edition
 Statistics for Managers Using Microsoft Excel 7 th Edition Chapter 5 Discrete Probability Distributions Statistics for Managers Using Microsoft Excel 7e Copyright 014 Pearson Education, Inc. Chap 5-1 Learning
INDIAN INSTITUTE OF SCIENCE STOCHASTIC HYDROLOGY. Lecture -26 Course Instructor : Prof. P. P. MUJUMDAR Department of Civil Engg., IISc.
 INDIAN INSTITUTE OF SCIENCE STOCHASTIC HYDROLOGY Lecture -26 Course Instructor : Prof. P. P. MUJUMDAR Department of Civil Engg., IISc. Summary of the previous lecture Hydrologic data series for frequency
4 Random Variables and Distributions
 4 Random Variables and Distributions Random variables A random variable assigns each outcome in a sample space. e.g. called a realization of that variable to Note: We ll usually denote a random variable
8.1 Binomial Distributions
 8.1 Binomial Distributions The Binomial Setting The 4 Conditions of a Binomial Setting: 1.Each observation falls into 1 of 2 categories ( success or fail ) 2 2.There is a fixed # n of observations. 3.All
Chapter 3 Statistical Quality Control, 7th Edition by Douglas C. Montgomery. Copyright (c) 2013 John Wiley & Sons, Inc.
 2013 John Wiley & Sons, Inc.") 1 3.1 Describing Variation Stem-and-Leaf Display Easy to find percentiles of the data; see page 69 2 Plot of Data in Time Order Marginal plot produced by MINITAB Also called a run chart 3 Histograms Useful
1 3.1 Describing Variation Stem-and-Leaf Display Easy to find percentiles of the data; see page 69 2 Plot of Data in Time Order Marginal plot produced by MINITAB Also called a run chart 3 Histograms Useful
**BEGINNING OF EXAMINATION** A random sample of five observations from a population is:
 **BEGINNING OF EXAMINATION** 1. You are given: (i) A random sample of five observations from a population is: 0.2 0.7 0.9 1.1 1.3 (ii) You use the Kolmogorov-Smirnov test for testing the null hypothesis,
Statistics (This summary is for chapters 17, 28, 29 and section G of chapter 19)
") Statistics (This summary is for chapters 17, 28, 29 and section G of chapter 19) Mean, Median, Mode Mode: most common value Median: middle value (when the values are in order) Mean = total how many = x
Statistics (This summary is for chapters 17, 28, 29 and section G of chapter 19) Mean, Median, Mode Mode: most common value Median: middle value (when the values are in order) Mean = total how many = x
Chapter 4 Continuous Random Variables and Probability Distributions
 Chapter 4 Continuous Random Variables and Probability Distributions Part 2: More on Continuous Random Variables Section 4.5 Continuous Uniform Distribution Section 4.6 Normal Distribution 1 / 28 One more
Random Variables and Probability Distributions
 Chapter 3 Random Variables and Probability Distributions Chapter Three Random Variables and Probability Distributions 3. Introduction An event is defined as the possible outcome of an experiment. In engineering
Week 1 Variables: Exploration, Familiarisation and Description. Descriptive Statistics.
 Week 1 Variables: Exploration, Familiarisation and Description. Descriptive Statistics. Convergent validity: the degree to which results/evidence from different tests/sources, converge on the same conclusion.
MA : Introductory Probability
 MA 320-001: Introductory Probability David Murrugarra Department of Mathematics, University of Kentucky http://www.math.uky.edu/~dmu228/ma320/ Spring 2017 David Murrugarra (University of Kentucky) MA 320:
Probability Models.S2 Discrete Random Variables
 Probability Models.S2 Discrete Random Variables Operations Research Models and Methods Paul A. Jensen and Jonathan F. Bard Results of an experiment involving uncertainty are described by one or more random
Random Variables Handout. Xavier Vilà
 Random Variables Handout Xavier Vilà Course 2004-2005 1 Discrete Random Variables. 1.1 Introduction 1.1.1 Definition of Random Variable A random variable X is a function that maps each possible outcome
Why Pooling Works. CAJPA Spring Mujtaba Datoo Actuarial Practice Leader, Public Entities Aon Global Risk Consulting
 Why Pooling Works CAJPA Spring 2017 Mujtaba Datoo Actuarial Practice Leader, Public Entities Aon Global Risk Consulting Discussion Points Mathematical preliminaries Why insurance works Pooling examples
Lecture 8. The Binomial Distribution. Binomial Distribution. Binomial Distribution. Probability Distributions: Normal and Binomial
 Lecture 8 The Binomial Distribution Probability Distributions: Normal and Binomial 1 2 Binomial Distribution >A binomial experiment possesses the following properties. The experiment consists of a fixed
Statistical Tables Compiled by Alan J. Terry
 Statistical Tables Compiled by Alan J. Terry School of Science and Sport University of the West of Scotland Paisley, Scotland Contents Table 1: Cumulative binomial probabilities Page 1 Table 2: Cumulative
Favorite Distributions
 Favorite Distributions Binomial, Poisson and Normal Here we consider 3 favorite distributions in statistics: Binomial, discovered by James Bernoulli in 1700 Poisson, a limiting form of the Binomial, found
Examples of continuous probability distributions: The normal and standard normal
 Examples of continuous probability distributions: The normal and standard normal The Normal Distribution f(x) Changing μ shifts the distribution left or right. Changing σ increases or decreases the spread.
Chapter 5. Continuous Random Variables and Probability Distributions. 5.1 Continuous Random Variables
 Chapter 5 Continuous Random Variables and Probability Distributions 5.1 Continuous Random Variables 1 2CHAPTER 5. CONTINUOUS RANDOM VARIABLES AND PROBABILITY DISTRIBUTIONS Probability Distributions Probability
Homework: Due Wed, Feb 20 th. Chapter 8, # 60a + 62a (count together as 1), 74, 82
, 74, 82") Announcements: Week 5 quiz begins at 4pm today and ends at 3pm on Wed If you take more than 20 minutes to complete your quiz, you will only receive partial credit. (It doesn t cut you off.) Today: Sections
Announcements: Week 5 quiz begins at 4pm today and ends at 3pm on Wed If you take more than 20 minutes to complete your quiz, you will only receive partial credit. (It doesn t cut you off.) Today: Sections
Econ 6900: Statistical Problems. Instructor: Yogesh Uppal
 Econ 6900: Statistical Problems Instructor: Yogesh Uppal Email: yuppal@ysu.edu Lecture Slides 4 Random Variables Probability Distributions Discrete Distributions Discrete Uniform Probability Distribution
Discrete Random Variables and Probability Distributions
 Chapter 4 Discrete Random Variables and Probability Distributions 4.1 Random Variables A quantity resulting from an experiment that, by chance, can assume different values. A random variable is a variable
Continuous Distributions
 Quantitative Methods 2013 Continuous Distributions 1 The most important probability distribution in statistics is the normal distribution. Carl Friedrich Gauss (1777 1855) Normal curve A normal distribution
Week 7. Texas A& M University. Department of Mathematics Texas A& M University, College Station Section 3.2, 3.3 and 3.4
 Week 7 Oğuz Gezmiş Texas A& M University Department of Mathematics Texas A& M University, College Station Section 3.2, 3.3 and 3.4 Oğuz Gezmiş (TAMU) Topics in Contemporary Mathematics II Week7 1 / 19
Theoretical Foundations
 Theoretical Foundations Probabilities Monia Ranalli monia.ranalli@uniroma2.it Ranalli M. Theoretical Foundations - Probabilities 1 / 27 Objectives understand the probability basics quantify random phenomena
Chapter 8 Homework Solutions Compiled by Joe Kahlig. speed(x) freq 25 x < x < x < x < x < x < 55 5
 freq 25 x < x < x < x < x < x < 55 5") H homework problems, C-copyright Joe Kahlig Chapter Solutions, Page Chapter Homework Solutions Compiled by Joe Kahlig. (a) finite discrete (b) infinite discrete (c) continuous (d) finite discrete (e) continuous.
H homework problems, C-copyright Joe Kahlig Chapter Solutions, Page Chapter Homework Solutions Compiled by Joe Kahlig. (a) finite discrete (b) infinite discrete (c) continuous (d) finite discrete (e) continuous.
The normal distribution is a theoretical model derived mathematically and not empirically.
 Sociology 541 The Normal Distribution Probability and An Introduction to Inferential Statistics Normal Approximation The normal distribution is a theoretical model derived mathematically and not empirically.
INF FALL NATURAL LANGUAGE PROCESSING. Jan Tore Lønning, Lecture 3, 1.9
 1 INF5830 2015 FALL NATURAL LANGUAGE PROCESSING Jan Tore Lønning, Lecture 3, 1.9 Today: More statistics 2 Recap Probability distributions Categorical distributions Bernoulli trial Binomial distribution
5.2 Random Variables, Probability Histograms and Probability Distributions
 Chapter 5 5.2 Random Variables, Probability Histograms and Probability Distributions A random variable (r.v.) can be either continuous or discrete. It takes on the possible values of an experiment. It
Homework: Due Wed, Nov 3 rd Chapter 8, # 48a, 55c and 56 (count as 1), 67a
, 67a") Homework: Due Wed, Nov 3 rd Chapter 8, # 48a, 55c and 56 (count as 1), 67a Announcements: There are some office hour changes for Nov 5, 8, 9 on website Week 5 quiz begins after class today and ends at
Homework: Due Wed, Nov 3 rd Chapter 8, # 48a, 55c and 56 (count as 1), 67a Announcements: There are some office hour changes for Nov 5, 8, 9 on website Week 5 quiz begins after class today and ends at
MAS187/AEF258. University of Newcastle upon Tyne
 MAS187/AEF258 University of Newcastle upon Tyne 2005-6 Contents 1 Collecting and Presenting Data 5 1.1 Introduction...................................... 5 1.1.1 Examples...................................
Lecture 3: Probability Distributions (cont d)
") EAS31116/B9036: Statistics in Earth & Atmospheric Sciences Lecture 3: Probability Distributions (cont d) Instructor: Prof. Johnny Luo www.sci.ccny.cuny.edu/~luo Dates Topic Reading (Based on the 2 nd Edition
EAS31116/B9036: Statistics in Earth & Atmospheric Sciences Lecture 3: Probability Distributions (cont d) Instructor: Prof. Johnny Luo www.sci.ccny.cuny.edu/~luo Dates Topic Reading (Based on the 2 nd Edition
Business Statistics 41000: Probability 3
 Business Statistics 41000: Probability 3 Drew D. Creal University of Chicago, Booth School of Business February 7 and 8, 2014 1 Class information Drew D. Creal Email: dcreal@chicagobooth.edu Office: 404
Definition 9.1 A point estimate is any function T (X 1,..., X n ) of a random sample. We often write an estimator of the parameter θ as ˆθ.
 of a random sample. We often write an estimator of the parameter θ as ˆθ.") 9 Point estimation 9.1 Rationale behind point estimation When sampling from a population described by a pdf f(x θ) or probability function P [X = x θ] knowledge of θ gives knowledge of the entire population.
9 Point estimation 9.1 Rationale behind point estimation When sampling from a population described by a pdf f(x θ) or probability function P [X = x θ] knowledge of θ gives knowledge of the entire population.
ECE 340 Probabilistic Methods in Engineering M/W 3-4:15. Lecture 10: Continuous RV Families. Prof. Vince Calhoun
 ECE 340 Probabilistic Methods in Engineering M/W 3-4:15 Lecture 10: Continuous RV Families Prof. Vince Calhoun 1 Reading This class: Section 4.4-4.5 Next class: Section 4.6-4.7 2 Homework 3.9, 3.49, 4.5,
Chapter 6: Random Variables. Ch. 6-3: Binomial and Geometric Random Variables
 Chapter : Random Variables Ch. -3: Binomial and Geometric Random Variables X 0 2 3 4 5 7 8 9 0 0 P(X) 3???????? 4 4 When the same chance process is repeated several times, we are often interested in whether
Converting to the Standard Normal rv: Exponential PDF and CDF for x 0 Chapter 7: expected value of x
 Key Formula Sheet ASU ECN 22 ASWCC Chapter : no key formulas Chapter 2: Relative Frequency=freq of the class/n Approx Class Width: =(largest value-smallest value) /number of classes Chapter 3: sample and
Engineering Statistics ECIV 2305
 Engineering Statistics ECIV 2305 Section 5.3 Approximating Distributions with the Normal Distribution Introduction A very useful property of the normal distribution is that it provides good approximations
CVE SOME DISCRETE PROBABILITY DISTRIBUTIONS
 CVE 472 2. SOME DISCRETE PROBABILITY DISTRIBUTIONS Assist. Prof. Dr. Bertuğ Akıntuğ Civil Engineering Program Middle East Technical University Northern Cyprus Campus CVE 472 Statistical Techniques in Hydrology.
Normal populations. Lab 9: Normal approximations for means STT 421: Summer, 2004 Vince Melfi
 Lab 9: Normal approximations for means STT 421: Summer, 2004 Vince Melfi In previous labs where we investigated the distribution of the sample mean and sample proportion, we often noticed that the distribution
INF FALL NATURAL LANGUAGE PROCESSING. Jan Tore Lønning, Lecture 3, 1.9
 INF5830 015 FALL NATURAL LANGUAGE PROCESSING Jan Tore Lønning, Lecture 3, 1.9 Today: More statistics Binomial distribution Continuous random variables/distributions Normal distribution Sampling and sampling
Review. Binomial random variable
 Review Discrete RV s: prob y fctn: p(x) = Pr(X = x) cdf: F(x) = Pr(X x) E(X) = x x p(x) SD(X) = E { (X - E X) 2 } Binomial(n,p): no. successes in n indep. trials where Pr(success) = p in each trial If
EVA Tutorial #1 BLOCK MAXIMA APPROACH IN HYDROLOGIC/CLIMATE APPLICATIONS. Rick Katz
 1 EVA Tutorial #1 BLOCK MAXIMA APPROACH IN HYDROLOGIC/CLIMATE APPLICATIONS Rick Katz Institute for Mathematics Applied to Geosciences National Center for Atmospheric Research Boulder, CO USA email: rwk@ucar.edu
CHAPTER 6. ' From the table the z value corresponding to this value Z = 1.96 or Z = 1.96 (d) P(Z >?) =
 P(Z >?) =") Solutions to End-of-Section and Chapter Review Problems 225 CHAPTER 6 6.1 (a) P(Z < 1.20) = 0.88493 P(Z > 1.25) = 1 0.89435 = 0.10565 P(1.25 < Z < 1.70) = 0.95543 0.89435 = 0.06108 (d) P(Z < 1.25) or Z
Solutions to End-of-Section and Chapter Review Problems 225 CHAPTER 6 6.1 (a) P(Z < 1.20) = 0.88493 P(Z > 1.25) = 1 0.89435 = 0.10565 P(1.25 < Z < 1.70) = 0.95543 0.89435 = 0.06108 (d) P(Z < 1.25) or Z
value BE.104 Spring Biostatistics: Distribution and the Mean J. L. Sherley
 BE.104 Spring Biostatistics: Distribution and the Mean J. L. Sherley Outline: 1) Review of Variation & Error 2) Binomial Distributions 3) The Normal Distribution 4) Defining the Mean of a population Goals:
Normal Distribution. Notes. Normal Distribution. Standard Normal. Sums of Normal Random Variables. Normal. approximation of Binomial.
 Lecture 21,22, 23 Text: A Course in Probability by Weiss 8.5 STAT 225 Introduction to Probability Models March 31, 2014 Standard Sums of Whitney Huang Purdue University 21,22, 23.1 Agenda 1 2 Standard
Exam M Fall 2005 PRELIMINARY ANSWER KEY
 Exam M Fall 005 PRELIMINARY ANSWER KEY Question # Answer Question # Answer 1 C 1 E C B 3 C 3 E 4 D 4 E 5 C 5 C 6 B 6 E 7 A 7 E 8 D 8 D 9 B 9 A 10 A 30 D 11 A 31 A 1 A 3 A 13 D 33 B 14 C 34 C 15 A 35 A
Session Window. Variable Name Row. Worksheet Window. Double click on MINITAB icon. You will see a split screen: Getting Started with MINITAB
 STARTING MINITAB: Double click on MINITAB icon. You will see a split screen: Session Window Worksheet Window Variable Name Row ACTIVE WINDOW = BLUE INACTIVE WINDOW = GRAY f(x) F(x) Getting Started with
PROBABILITY DISTRIBUTIONS
 CHAPTER 3 PROBABILITY DISTRIBUTIONS Page Contents 3.1 Introduction to Probability Distributions 51 3.2 The Normal Distribution 56 3.3 The Binomial Distribution 60 3.4 The Poisson Distribution 64 Exercise
2.1 Properties of PDFs
 2.1 Properties of PDFs mode median epectation values moments mean variance skewness kurtosis 2.1: 1/13 Mode The mode is the most probable outcome. It is often given the symbol, µ ma. For a continuous random
NORMAL APPROXIMATION. In the last chapter we discovered that, when sampling from almost any distribution, e r2 2 rdrdϕ = 2π e u du =2π.
 NOMAL APPOXIMATION Standardized Normal Distribution Standardized implies that its mean is eual to and the standard deviation is eual to. We will always use Z as a name of this V, N (, ) will be our symbolic
x is a random variable which is a numerical description of the outcome of an experiment.
 Chapter 5 Discrete Probability Distributions Random Variables is a random variable which is a numerical description of the outcome of an eperiment. Discrete: If the possible values change by steps or jumps.
Model Paper Statistics Objective. Paper Code Time Allowed: 20 minutes
 Model Paper Statistics Objective Intermediate Part I (11 th Class) Examination Session 2012-2013 and onward Total marks: 17 Paper Code Time Allowed: 20 minutes Note:- You have four choices for each objective
Random variables. Contents
 Random variables Contents 1 Random Variable 2 1.1 Discrete Random Variable............................ 3 1.2 Continuous Random Variable........................... 5 1.3 Measures of Location...............................
Engineering Mathematics III. Moments
 Moments Mean and median Mean value (centre of gravity) f(x) x f (x) x dx Median value (50th percentile) F(x med ) 1 2 P(x x med ) P(x x med ) 1 0 F(x) x med 1/2 x x Variance and standard deviation
. (i) What is the probability that X is at most 8.75? =.875
 What is the probability that X is at most 8.75? =.875") Worksheet 1 Prep-Work (Distributions) 1)Let X be the random variable whose c.d.f. is given below. F X 0 0.3 ( x) 0.5 0.8 1.0 if if if if if x 5 5 x 10 10 x 15 15 x 0 0 x Compute the mean, X. (Hint: First
Worksheet 1 Prep-Work (Distributions) 1)Let X be the random variable whose c.d.f. is given below. F X 0 0.3 ( x) 0.5 0.8 1.0 if if if if if x 5 5 x 10 10 x 15 15 x 0 0 x Compute the mean, X. (Hint: First
Lecture 5: Fundamentals of Statistical Analysis and Distributions Derived from Normal Distributions
 Lecture 5: Fundamentals of Statistical Analysis and Distributions Derived from Normal Distributions ELE 525: Random Processes in Information Systems Hisashi Kobayashi Department of Electrical Engineering
Welcome to Stat 410!
 Welcome to Stat 410! Personnel Instructor: Liang, Feng TA: Gan, Gary (Lingrui) Instructors/TAs from two other sessions Websites: Piazza and Compass Homework When, where and how to submit your homework
Lecture 23. STAT 225 Introduction to Probability Models April 4, Whitney Huang Purdue University. Normal approximation to Binomial
 Lecture 23 STAT 225 Introduction to Probability Models April 4, 2014 approximation Whitney Huang Purdue University 23.1 Agenda 1 approximation 2 approximation 23.2 Characteristics of the random variable:
Point Estimation. Some General Concepts of Point Estimation. Example. Estimator quality
 Point Estimation Some General Concepts of Point Estimation Statistical inference = conclusions about parameters Parameters == population characteristics A point estimate of a parameter is a value (based
Lecture 2. Probability Distributions Theophanis Tsandilas
 Lecture 2 Probability Distributions Theophanis Tsandilas Comment on measures of dispersion Why do common measures of dispersion (variance and standard deviation) use sums of squares: nx (x i ˆµ) 2 i=1
Central Limit Theorem, Joint Distributions Spring 2018
 Central Limit Theorem, Joint Distributions 18.5 Spring 218.5.4.3.2.1-4 -3-2 -1 1 2 3 4 Exam next Wednesday Exam 1 on Wednesday March 7, regular room and time. Designed for 1 hour. You will have the full
Appendix A. Selecting and Using Probability Distributions. In this appendix
 Appendix A Selecting and Using Probability Distributions In this appendix Understanding probability distributions Selecting a probability distribution Using basic distributions Using continuous distributions
Review of the Topics for Midterm I
 Review of the Topics for Midterm I STA 100 Lecture 9 I. Introduction The objective of statistics is to make inferences about a population based on information contained in a sample. A population is the
The Bernoulli distribution
 This work is licensed under a Creative Commons Attribution-NonCommercial-ShareAlike License. Your use of this material constitutes acceptance of that license and the conditions of use of materials on this
Chapter 2: Random Variables (Cont d)
") Chapter : Random Variables (Cont d) Section.4: The Variance of a Random Variable Problem (1): Suppose that the random variable X takes the values, 1, 4, and 6 with probability values 1/, 1/6, 1/, and 1/6,
Chapter : Random Variables (Cont d) Section.4: The Variance of a Random Variable Problem (1): Suppose that the random variable X takes the values, 1, 4, and 6 with probability values 1/, 1/6, 1/, and 1/6,
VI. Continuous Probability Distributions
 VI. Continuous Proaility Distriutions A. An Important Definition (reminder) Continuous Random Variale - a numerical description of the outcome of an experiment whose outcome can assume any numerical value
Specific Objectives. Be able to: Apply graphical frequency analysis for data that fit the Log- Pearson Type 3 Distribution
 CVEEN 4410: Engineering Hydrology (continued) : Topic and Goal: Use frequency analysis of historical data to forecast hydrologic events Specific Be able to: Apply graphical frequency analysis for data
continuous rv Note for a legitimate pdf, we have f (x) 0 and f (x)dx = 1. For a continuous rv, P(X = c) = c f (x)dx = 0, hence
 0 and f (x)dx = 1. For a continuous rv, P(X = c) = c f (x)dx = 0, hence") continuous rv Let X be a continuous rv. Then a probability distribution or probability density function (pdf) of X is a function f(x) such that for any two numbers a and b with a b, P(a X b) = b a f (x)dx.
continuous rv Let X be a continuous rv. Then a probability distribution or probability density function (pdf) of X is a function f(x) such that for any two numbers a and b with a b, P(a X b) = b a f (x)dx.
Two Hours. Mathematical formula books and statistical tables are to be provided THE UNIVERSITY OF MANCHESTER. 22 January :00 16:00
 Two Hours MATH38191 Mathematical formula books and statistical tables are to be provided THE UNIVERSITY OF MANCHESTER STATISTICAL MODELLING IN FINANCE 22 January 2015 14:00 16:00 Answer ALL TWO questions
Chapter 3 - Lecture 5 The Binomial Probability Distribution
 Chapter 3 - Lecture 5 The Binomial Probability October 12th, 2009 Experiment Examples Moments and moment generating function of a Binomial Random Variable Outline Experiment Examples A binomial experiment
Chapter 4 Continuous Random Variables and Probability Distributions
 Chapter 4 Continuous Random Variables and Probability Distributions Part 2: More on Continuous Random Variables Section 4.5 Continuous Uniform Distribution Section 4.6 Normal Distribution 1 / 27 Continuous
A useful modeling tricks.
 .7 Joint models for more than two outcomes We saw that we could write joint models for a pair of variables by specifying the joint probabilities over all pairs of outcomes. In principal, we could do this
Probability. An intro for calculus students P= Figure 1: A normal integral
 Probability An intro for calculus students.8.6.4.2 P=.87 2 3 4 Figure : A normal integral Suppose we flip a coin 2 times; what is the probability that we get more than 2 heads? Suppose we roll a six-sided
Lecture Data Science
 Web Science & Technologies University of Koblenz Landau, Germany Lecture Data Science Statistics Foundations JProf. Dr. Claudia Wagner Learning Goals How to describe sample data? What is mode/median/mean?
Random Variable: Definition
 Random Variables Random Variable: Definition A Random Variable is a numerical description of the outcome of an experiment Experiment Roll a die 10 times Inspect a shipment of 100 parts Open a gas station