Santa Ana Watershed Project Authority. Financial Report for the Inland Empire Brine Line Enterprise/CIP for the 1st Quarter Ending September 30, 2017
|
|
|
- Luke Lambert
- 5 years ago
- Views:
Transcription
1 Santa Ana Watershed Project Authority Financial Report for the Inland Empire Brine Line Enterprise/CIP for the 1st Quarter Ending September 30, 2017
2 Agenda Cash & Investments Reserve Account Balances Transfer, Uses & Contributions from/to Reserves Enterprise Revenues Enterprise Expenses Enterprise Performance Capital Improvement Program

3 Cash & Investments $41,143,844
4 Cash & Investments
5 Reserve Account Balances Reserve Account Balance Self Insurance $3,881,186 Debt Retirement 4,810,007 Pipeline Replacement 16,050,934 OCSD Rehabilitation 3,525,815 Capacity Management 7,853,899 OCSD Future Capacity 1,729,799 Flow Imbalance Reserve 86,545 Operating Reserve 3,205,659 Total Reserves $41,143,844
6 Reserve Account Balances Trends Reserve 12/31/16 03/31/17 06/30/17 09/30/17 Self Insurance $3,795,922 $3,812,588 $3,846,181 $3,881,186 Debt Retirement 5,707,360 5,475,338 5,037,279 4,810,007 Pipeline Replacement 17,850,481 16,155,981 13,807,175 16,050,934 OCSD Rehabilitation 7,281,550 7,364,885 7,506,389 3,525,815 Capacity Mgmt 7,815,783 7,815,783 7,851,194 7,853,899 OCSD Future Capacity 1,721,404 1,721,404 1,725,296 1,729,799 Flow Imbalance Reserve 83,563 84,418 84,608 86,545 Operating Reserve 3,971,781 5,103,311 4,545,484 3,205,659 Total $48,227,844 $47,533,708 $44,403,606 $41,143,844
7 Transfers, Use and Contributions To/From Reserves Pipeline Replacement Reserve Contribution of $375,000 Transfer of $1,843,450 from Operating Reserve Transfer of $4,000,000 from OCSD Rehabilitation Use of $3,974,691 for Capital Projects Self Insurance Reserve Contribution of $25,000 Debt Service Reserve Contribution of $534,043 Flow Imbalance Reserve Contribution of $1,717
8 Total Operating Revenues Source Actual Budget Variance Positive/(Negative) BOD/TSS Fees $825,312 $651,611 $173,701 Volumetric Fees 909, ,000 8,543 Fixed Charges 1,129,842 1,183,730 (53,888) Truck Discharge 187, ,500 75,205 Permit Fees 9,400 8,063 1,337 Total Operating Revenues $3,061,802 $2,856,904 $204,898

9 Operating Revenues vs. Budget
10 Total Operating Expenses Source Actual Budget Variance Positive/(Negative) Treatment Costs ($533,243) ($651,611) $118,368 Volumetric Costs (180,343) (184,000) 3,657 Operating Costs (39,227) (103,500) 64,273 General & Administration (733,087) (736,252) 3,165 Facility Repair & Maintenance (49,220) (173,750) 124,530 Consulting & Prof. Services (5,735) (73,750) 68,015 Total Operating Expenses ($1,540,856) ($1,922,861) $382,005

11 Operating Expenses vs. Budget
12 Non Operating Revenues and Expenses Source Actual Budget Variance Positive/(Negative) Use of Reserves (Debt Service) $0 $0 $0 Interest & Investments 459, ,766 (314) Other Income Debt Service Payments (1,126,278) (1,126,278) 0 Contributions to Reserves (934,043) (934,043) 0 Total Non Operating ($1,600,835) ($1,600,555) ($281)
13 Enterprise Performance Flow, BOD, TSS Actual vs. OCSD Billing SAWPA Billed OCSD Billing Difference Total Flow (MG) 1, , (11.252) Total BOD (1,000 lbs) Total TSS (1,000 lbs) 1, , BOD cost per 1,000 lbs $ $ $28.04 TSS cost per 1,000 lbs $ $ $40.01
14 Enterprise Performance OCSD Flow, BOD & TSS Charges vs. Revenue Billed Revenue Billed OCSD Charges Difference Flow (pass through) $178,366 $180,343 ($1,977) BOD 147, ,307 47,100 TSS 677, , ,969 TD Allowance 1, ,026 Total $1,004,704 $713,586 $291,118

15 Enterprise Performance OCSD Flow, BOD & TSS Charges vs. Revenue Collected


16 Capital Project Fund Funding = Reserves and SRF Loans

17 Capital Project Fund
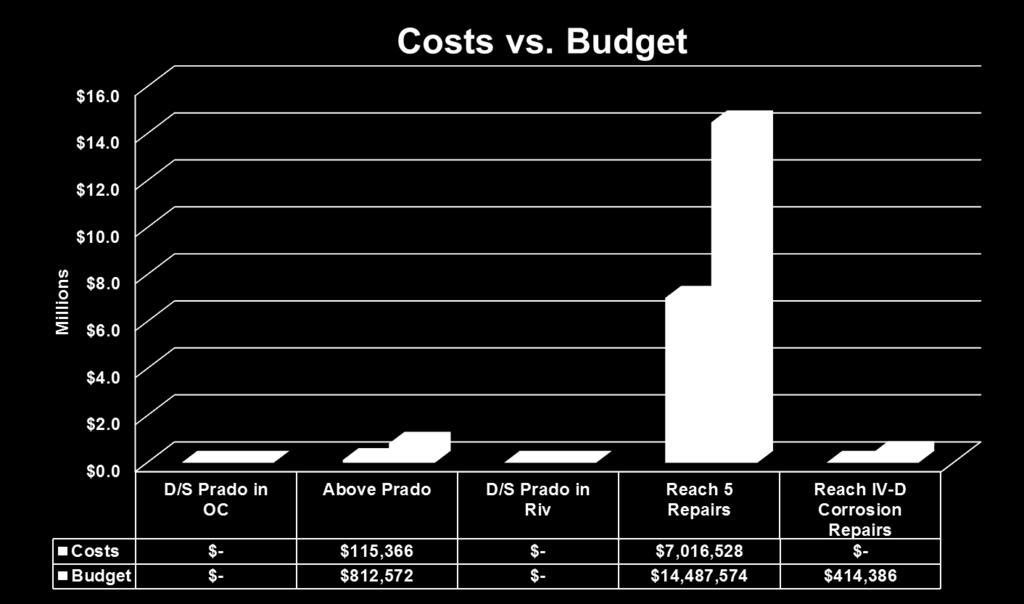
18 Capital Project Fund (320) Brine Line Protection / Relocation Projects D/S Prado in OC emergency protection work, pipeline relocation Above Prado - pipeline relocation and manhole lid adjustments when required D/S Prado in Riv County bank armoring
19 Questions?

20 One Water One Watershed Plan Update 2018 Status Report Mark R. Norton PE, LEED AP Santa Ana Watershed Project Authority November 21, 2017
21 OWOW Plan Update 2018 Schedule DWR Implementation Grant Request Due Date??? SAWPA Commission Meetings Feb 21 st Apr 18 th Jun 20 th Aug 15 th Oct 17 th Dec 19 th Feb 20 th Apr 17 th Jun 19 th Aug 21 st Oct 16 th Plan Update Begin DCI & Planning Grant Contracts Executed Goals & Objectives Reviewed Pillar Workgroups Chapter Updates Grant Guidelines Released for Comments Collaborative Project Development Draft Pillar Chapters Due Disadvantaged Communities Involvement Program Final Grant Guidelines Released Final Pillar & General Chapters Due Grant Application Prepared and Submitted Grant Data Requested OWOW Plan Update 2018 adopted Jan 26 th Mar 23 rd May 25 th July 27 th Sept 28 th Nov 16 th Jan 25 th Mar 22 nd May 24 th Jul 26 th Sept 27 th Steering Committee Meetings FEB APR JUN AUG OCT DEC FEB APR JUN AUG
22 Pillar progress towards rough chapter drafts Water Use Efficiency Water Resource Optimization Water Recycling Integrated Stormwater Management Natural Resources Stewardship Land Use & Water Planning Climate Change Response Disadvantaged Communities & Tribal Communities Data Management & Monitoring Beneficial Use Assurance Due December 31, 2017


23 US Bureau of Reclamation Renewing USBR role in the OWOW Plan Update 2018 Support for Climate Change Response Pillar Will be critical in meeting new 2016 IRWM Plan Standards related to Climate Change Climate Change Response Pillar Meeting 10am Dec 13th Will consider questions answered by USBR for OWOW 2.0 Refreshed or new questions will drive USBR work

 Plunge Creek Water Recharge and Habitat Improvement")
24 DWR visits SAWPA / OWOW Carmel Brown, new Chief of the Financial Assistance Branch of Division of IRWM at DWR visited 11/16/17 Staff meeting about ongoing and future grants Ms. Brown presented to OWOW Steering Committee Field Visits: Enhanced Stormwater Capture and Recharge System Upgrades (SBVMWD) Plunge Creek Water Recharge and Habitat Improvement (SBVWCD)
25 Goals & Objectives April: Pillar Integration meeting reviewed OWOW 1 & 2 goals, brainstorm May: OWOW Conference display (only light engagement) April June: Pillar chairs and workgroups reviewed and provided comments June: Update to Pillar Integration Meeting July: Workshop with OWOW Steering Committee September: OWOW Steering Committee agenda reviewed, provided direction and edits October: SAWPA Commission reviewed and provided comments November: OWOW Steering Committee Goals and Objectives workshop Approved for use in drafting the plan update
26 Vision The One Water One Watershed Plan Update 2018 describes how collaborative watershed planning, water and land management, and project implementation supports improved sustainability, resilience, and economic prosperity throughout the Santa Ana River Watershed through 2040.
27 Six Goals, many objectives Achieve resilient water resources through innovation and optimization. Ensure high quality water for all people and the environment. Preserve and enhance recreational areas, open space, habitat, and natural hydrologic function. Engage with members of disadvantaged communities and associated supporting organizations to diminish environmental injustices and their impacts on the watershed. Educate and build trust between people and organizations. Improve data integration, tracking and reporting to strengthen decision-making.
28 Recommendation To receive and file this informational report about the status of the One Water One Watershed Plan Update 2018 process.
29 Santa Ana Watershed Project Authority Financial Report for the 1st Quarter Ending September 30, 2017
30 Agenda Cash & Investments Fund Overview General Fund OWOW Funds Roundtable Funds

31 Cash & Investments $11,290,334 Savings - EPA $447,960 4% Checking Accounts $3,007,820 27% LAIF $7,834,554 69%
32 Cash & Investments Total by Fund General Fund $3,928,602 OWOW Fund 4,802,916 Roundtable Fund 2,110,856 Fiduciary Fund 447,960 Total $11,290,334
33 Cash & Investments General Funds Fund Checking (Cash) LAIF Account Total General Fund $3,007,820 $0 $3,007,820 Building Reserve 0 920, ,782 Total $3,007,820 $920,782 $3,928,602
34 Cash & Investments OWOW Funds Fund LAIF Account Total General Basin Planning $334,687 $334,687 USBR Partnership Studies 40,572 40,572 Watershed Mgmt Plan 364, ,046 Water Energy DAC Grant 973, ,510 Prop 84 SARCCUP Projects 3,090,101 3,090,101 Total $4,802,916 $4,802,916
35 Cash & Investments Roundtable Funds Fund LAIF Account Total Imported Water Recharge $10,591 $10,591 Basin Monitoring 351, ,616 RWQ Monitoring TF 299, ,603 SAR Fish Conservation 211, ,949 Middle SAR TMDL TF 186, ,631 Emerging Constituents TF 98,148 98,148 Mitigation Banking 952, ,318 Total $2,110,856 $2,110,856
36 Cash & Investments Fiduciary Funds Fund LAIF Account Savings EPA Total Legal Defense Fund $0 $447,960 $447,960 Total $0 $447,960 $447,960
37 Cash & Investments LAIF Interest Rates Oct'16 Nov'16 Dec'16 Jan'17 Feb'17 Mar'17 Apr'17 May'17 Jun'17 Jul'17 Aug'17 Sep'17
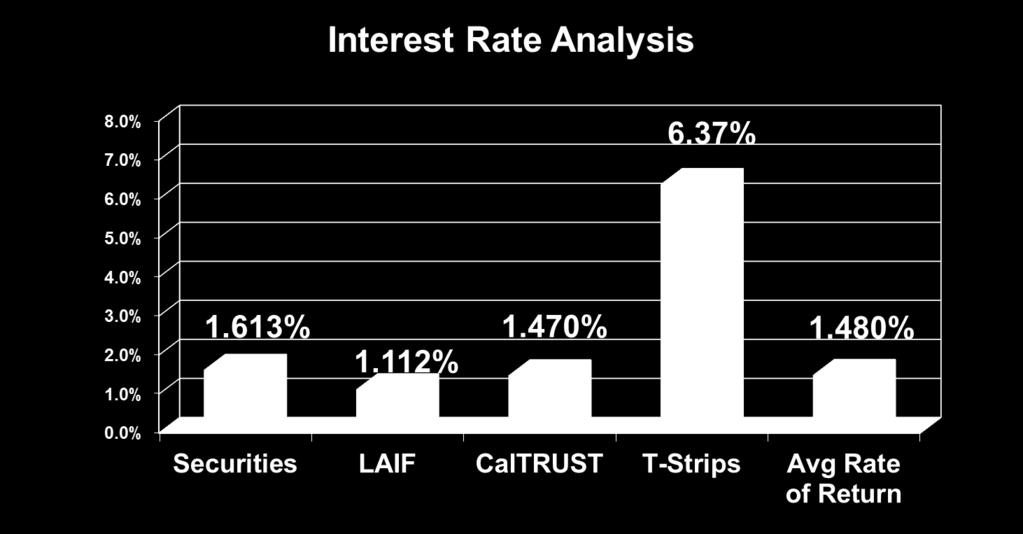
38 Cash & Investments Interest Rate Comparison 2.5% 2.0% 1.5% 1.0% 0.5% Securities LAIF Ave Rate of Return CalTRUST 2yr Treasury 0.0%
39 Analysis by Fund Type $2,500 Revenues and Expenses $2,000 Thousands $1,500 $1,000 $500 $- General Fund OWOW Roundtable Funding/Revenue $656,081 $1,993,004 $958,519 Costs/Expenses $244,595 $798,844 $513,482
40 General Fund $700 Budget vs. Actual $600 $500 Thousands $400 $300 $200 $100 $- Revenue Expense Actual $656,081 $244,595 Budget $646,118 $161,530
41 OWOW Funds Budget vs. Actual $3,500 $3,000 $2,500 Thousands $2,000 $1,500 $1,000 $500 $- Revenue Expense Actual $1,993,004 $798,844 Budget $3,029,936 $1,850,829 Project Reimbursement (Prop 84) $165,143
42 OWOW Funds Costs vs. Funding $6,000 $5,000 $4,000 Hundreds $3,000 $2,000 $1,000 $- General Planning USBR Partnership Watershed Mgmt Energy - Water DAC Grant Prop 1 - DACI Grant Prop 84 Program Mgmt Prop 84 Drought Prop 84 SARCCUP Funding $356,369 $20,067 $414,056 $541,017 $39,916 $104,532 $54,486 $462,562 Costs $78,388 $1,193 $87,674 $364,741 $84,097 $114,996 $54,486 $13,269
43 Roundtable Funds $1,200 Budget vs. Actual $1,000 Thousands $800 $600 $400 $200 $- Revenue Expense Actual $958,519 $513,482 Budget $1,078,204 $462,991
44 Roundtable Funds $400 Costs vs. Funding $350 $300 Thousands $250 $200 $150 $100 $50 $- Imported Water Recharge Basin Monitoring SAR Fish Conservation Middle SAR TMDL TF RWQ Monitoring TF Arundo Removal Emerging Constiuents LESJWA Admin Funding $25 $273,325 $29,504 $201,156 $357,440 $2,192 $40,219 $54,658 Costs $1,092 $166,225 $26,462 $197,542 $47,206 $8,277 $11,982 $54,696
45 Questions?
SAWPA. FYE 2018 and 2019 Draft Budget
 SAWPA FYE 2018 and 2019 Draft Budget 1 2 3 Combined Budget Brine Line Operating Budget Brine Line Capital Budget 4 OWOW Fund Budget 5 6 7 Roundtables Fund Budget General Fund Budget Member Agency Contributions
SAWPA. Audit Services Contract
 SAWPA Audit Services Contract Recommendation That the Commission award the contract for Audit Services for FYE 2018, 2019, and 2020, to Teaman, Ramirez & Smith, Inc. with an option for 2 additional years.
WESTWOOD LUTHERAN CHURCH Summary Financial Statement YEAR TO DATE - February 28, Over(Under) Budget WECC Fund Actual Budget
 Budget WECC Fund Actual Budget") WESTWOOD LUTHERAN CHURCH Summary Financial Statement YEAR TO DATE - February 28, 2018 General Fund Actual A B C D E F WECC Fund Actual Revenue Revenue - Faith Giving 1 $ 213 $ 234 $ (22) - Tuition $ 226
WESTWOOD LUTHERAN CHURCH Summary Financial Statement YEAR TO DATE - February 28, 2018 General Fund Actual A B C D E F WECC Fund Actual Revenue Revenue - Faith Giving 1 $ 213 $ 234 $ (22) - Tuition $ 226
Business & Financial Services December 2017
 Business & Financial Services December 217 Completed Procurement Transactions by Month 2 4 175 15 125 1 75 5 2 1 Business Days to Complete 25 Jan Feb Mar Apr May Jun Jul Aug Sep Oct Nov Dec 217 Procurement
Strategic Business Plan Department of Water Resources. Gwinnett County Department of Water Resources
 g w i n n e t t c o u n t y Strategic Business Plan Department of Water Resources Gwinnett County Department of Water Resources A Message from the Director The Department of Water Resources Strategic Business
Spheria Australian Smaller Companies Fund
 29-Jun-18 $ 2.7686 $ 2.7603 $ 2.7520 28-Jun-18 $ 2.7764 $ 2.7681 $ 2.7598 27-Jun-18 $ 2.7804 $ 2.7721 $ 2.7638 26-Jun-18 $ 2.7857 $ 2.7774 $ 2.7690 25-Jun-18 $ 2.7931 $ 2.7848 $ 2.7764 22-Jun-18 $ 2.7771
Performance Report October 2018
 Structured Investments Indicative Report October 2018 This report illustrates the indicative performance of all Structured Investment Strategies from inception to 31 October 2018 Matured Investment Strategies
Through: Finance, Legal, and Administration Committee (06/10/15) Chief Financial Officer / Assistant General Manager
 Chief Financial Officer / Assistant General Manager") Date: To: The Honorable Board of Directors Through: Finance, Legal, and Administration Committee (06/10/15) From: Submitted by: P. Joseph Grindstaff General Manager Christina Valencia Chief Financial Officer
Date: To: The Honorable Board of Directors Through: Finance, Legal, and Administration Committee (06/10/15) From: Submitted by: P. Joseph Grindstaff General Manager Christina Valencia Chief Financial Officer
XML Publisher Balance Sheet Vision Operations (USA) Feb-02
 Feb-02") Page:1 Apr-01 May-01 Jun-01 Jul-01 ASSETS Current Assets Cash and Short Term Investments 15,862,304 51,998,607 9,198,226 Accounts Receivable - Net of Allowance 2,560,786
Page:1 Apr-01 May-01 Jun-01 Jul-01 ASSETS Current Assets Cash and Short Term Investments 15,862,304 51,998,607 9,198,226 Accounts Receivable - Net of Allowance 2,560,786
Meeting #1 June 29, 2012
 Meeting #1 June 28, 2012 Rate Refinement Workgroup Meeting 1 Key Issues Overview Existing Purchase OrderReview Existing Rate Structure Review Replenishment Rate Options Ad Valorem Tax Rate Treatment Cost
Using projections to manage your programs
 Using projections to manage your programs To project total provider reimbursements To do what ifs based on caseloads or other metrics To project amounts of admin & support available for spending Based
Big Walnut Local School District
 Big Walnut Local School District Monthly Financial Report for the month ended September 30, 2012 Prepared By: Felicia Drummey Treasurer BIG WALNUT LOCAL SCHOOL DISTRICT SUMMARY OF YEAR-TO-DATE FINANCIAL
S A W P A. SANTA ANA WATERSHED PROJECT AUTHORITY Sterling Avenue, Riverside, California (951)
") S A W P A SANTA ANA WATERSHED PROJECT AUTHORITY 11615 Sterling Avenue, Riverside, California 92503 (951) 354-4220 REGULAR COMMISSION MEETING TUESDAY, MAY 16, 2017 9:30 A.M. AGENDA 1. CALL TO ORDER/PLEDGE
S A W P A SANTA ANA WATERSHED PROJECT AUTHORITY 11615 Sterling Avenue, Riverside, California 92503 (951) 354-4220 REGULAR COMMISSION MEETING TUESDAY, MAY 16, 2017 9:30 A.M. AGENDA 1. CALL TO ORDER/PLEDGE
Pilot Watersheds Plan Development: Work Plan
 Pilot Watersheds Plan Development: Work Plan This Work Plan outlines tasks for the development of watershed-based plans consistent with the One Watershed, One Plan vision and program grant requirements.
CITY MANAGER S OFFICE ADMINISTRATIVE REPORT May 17, La Palma City Council. Laurie Murray, City Manager. In This Week s Report
 CITY MANAGER S OFFICE ADMINISTRATIVE REPORT 2018-19 May 17, 2018 TO: FROM: La Palma City Council Laurie Murray, City Manager In This Week s Report GFOA Certificate of Excellence in Financial Reporting
Key IRS Interest Rates After PPA
 Key IRS Rates - After PPA - thru 2011 Page 1 of 10 Key IRS Interest Rates After PPA (updated upon release of figures in IRS Notice usually by the end of the first full business week of the month) Below
Common stock prices 1. New York Stock Exchange indexes (Dec. 31,1965=50)2. Transportation. Utility 3. Finance
2. Transportation. Utility 3. Finance") Digitized for FRASER http://fraser.stlouisfed.org/ Federal Reserve Bank of St. Louis 000 97 98 99 I90 9 9 9 9 9 9 97 98 99 970 97 97 ""..".'..'.."... 97 97 97 97 977 978 979 980 98 98 98 98 98 98 987 988
Digitized for FRASER http://fraser.stlouisfed.org/ Federal Reserve Bank of St. Louis 000 97 98 99 I90 9 9 9 9 9 9 97 98 99 970 97 97 ""..".'..'.."... 97 97 97 97 977 978 979 980 98 98 98 98 98 98 987 988
Through: Finance, Legal, and Administration Committee (3/11/15) Chief Financial Officer/Assistant General Manager
 Chief Financial Officer/Assistant General Manager") Date: To: The Honorable Board of Directors Through: Finance, Legal, and Administration Committee (3/11/15) From: Submitted by: P. Joseph Grindstaff General Manager Christina Valencia Chief Financial Officer/Assistant
Date: To: The Honorable Board of Directors Through: Finance, Legal, and Administration Committee (3/11/15) From: Submitted by: P. Joseph Grindstaff General Manager Christina Valencia Chief Financial Officer/Assistant
7/25/2012. July 25, Rate Refinement Workgroup Page 1 July 25, 2012
 July 25, 2012 Rate Refinement Workgroup Page 1 July 25, 2012 Linking rate structure and water management actions: Tier 1 Baseline alternatives Timing to implement sales year type Defining the conditions
S A W P A SANTA ANA WATERSHED PROJECT AUTHORITY Sterling Avenue, Riverside, California (951)
") S A W P A SANTA ANA WATERSHED PROJECT AUTHORITY 11615 Sterling Avenue, Riverside, California 92503 (951) 354-4220 REGULAR COMMISSION MEETING TUESDAY, JANUARY 15, 2019 9:30 A.M. AGENDA 1. CALL TO ORDER/PLEDGE
S A W P A SANTA ANA WATERSHED PROJECT AUTHORITY 11615 Sterling Avenue, Riverside, California 92503 (951) 354-4220 REGULAR COMMISSION MEETING TUESDAY, JANUARY 15, 2019 9:30 A.M. AGENDA 1. CALL TO ORDER/PLEDGE
TERMS OF REFERENCE FOR THE INVESTMENT COMMITTEE
 I. PURPOSE The purpose of the Investment Committee (the Committee ) is to recommend to the Board the investment policy, including the asset mix policy and the appropriate benchmark for both ICBC and any
2016 Spring Conference And Training Seminar. Cash Planning and Forecasting
 Cash Planning and Forecasting A different world! Cash forecasting starts with expectations about future flows Uses history to identify beginning balances.and to understand patterns of how things interact
City of Joliet 2014 Revenue Review. October 2013
 City of Joliet 2014 Revenue Review October 2013 General Fund 2014 Est. Revenues = $163.6 M Licenses, Permits, Fees Gaming Taxes 5% 12% Sales Taxes 27% Income Taxes 9% Charges for Services 14% Other Taxes
SmallBizU WORKSHEET 1: REQUIRED START-UP FUNDS. Online elearning Classroom. Item Required Amount ($) Fixed Assets. 1 -Buildings $ 2 -Land $
 Fixed Assets. 1 -Buildings $ 2 -Land $") WORKSHEET 1: REQUIRED START-UP FUNDS Item Required Amount () Fixed Assets 1 -Buildings 2 -Land 3 -Initial Inventory 4 -Equipment 5 -Furniture and Fixtures 6 -Vehicles 7 Total Fixed Assets Working Capital
WORKSHEET 1: REQUIRED START-UP FUNDS Item Required Amount () Fixed Assets 1 -Buildings 2 -Land 3 -Initial Inventory 4 -Equipment 5 -Furniture and Fixtures 6 -Vehicles 7 Total Fixed Assets Working Capital
PARADISE IRRIGATION DISTRICT
 PARADISE IRRIGATION DISTRICT 6332 Clark Rel I P.O. Box 2409 I Paradise, California 95967 I 530.$77.4971 I Fax 530.$76.04$3 1. Cash position At 5/31/2017 the Districts total cash position was $2,337,027.46.
Review of Registered Charites Compliance Rates with Annual Reporting Requirements 2016
 Review of Registered Charites Compliance Rates with Annual Reporting Requirements 2016 October 2017 The Charities Regulator, in accordance with the provisions of section 14 of the Charities Act 2009, carried
Key IRS Interest Rates After PPA
 Key IRS Interest After PPA (updated upon release of figures in IRS Notice usually by the end of the first full business week of the month) Below are Tables I, II, and III showing official interest rates
CONTENTS COMMENTARY CHARTS TABLES GLOSSARY. Section 1: Headline Inflation Section 2: Core Inflation
 COMMENTARY CONTENTS Section 1: Headline Inflation Section 2: Core Inflation CHARTS 1. National Rates of Inflation, January 2010 April 2013 2. Monthly Changes in the Cost-of-Living Index, January 2010 April
PHOENIX ENERGY MARKETING CONSULTANTS INC. HISTORICAL NATURAL GAS & CRUDE OIL PRICES UPDATED TO July, 2018
 Jan-01 $12.9112 $10.4754 $9.7870 $1.5032 $29.2595 $275.39 $43.78 $159.32 $25.33 Feb-01 $10.4670 $7.8378 $6.9397 $1.5218 $29.6447 $279.78 $44.48 $165.68 $26.34 Mar-01 $7.6303 $7.3271 $5.0903 $1.5585 $27.2714
OTHER DEPOSITS FINANCIAL INSTITUTIONS DEPOSIT BARKAT SAVING ACCOUNT
 WEIGHTAGES JAN FEB MAR APR MAY JUN JUL AUG SEPT OCT NOV DEC ANNOUNCEMENT DATE 19.Dez.14 27.Jän.15 24.Feb.15 26.Mär.15 27.Apr.15 26.Mai.15 25.Jun.15 28.Jul.15 26.Aug.15 23.Sep.15 27.Okt.15 25.Nov.15 MUDARIB
PASSENGER REJECTION REDUCTION INITIATIVE KIRK PEREIRA. 24 th April 2018
 PASSENGER REJECTION REDUCTION INITIATIVE KIRK PEREIRA 24 th April 2018 WHAT IS THIS PROJECT ABOUT? Well we are not going into that again this year! Nearly everyone in this room knows about the project
QUESTION 2. QUESTION 3 Which one of the following is most indicative of a flexible short-term financial policy?
 QUESTION 1 Compute the cash cycle based on the following information: Average Collection Period = 47 Accounts Payable Period = 40 Average Age of Inventory = 55 QUESTION 2 Jan 41,700 July 39,182 Feb 18,921
1.2 The purpose of the Finance Committee is to assist the Board in fulfilling its oversight responsibilities related to:
 Category: BOARD PROCESS Title: Terms of Reference for the Finance Committee Reference Number: AB-331 Last Approved: February 22, 2018 Last Reviewed: February 22, 2018 1. PURPOSE 1.1 Primary responsibility
HIPIOWA - IOWA COMPREHENSIVE HEALTH ASSOCIATION Unaudited Balance Sheet As of July 31
 Unaudited Balance Sheet As of July 31 Total Enrollment: 407 Assets: Cash $ 9,541,661 $ 1,237,950 Invested Cash 781,689 8,630,624 Premiums Receivable 16,445 299,134 Prepaid 32,930 34,403 Assessments Receivable
HIPIOWA - IOWA COMPREHENSIVE HEALTH ASSOCIATION Unaudited Balance Sheet As of January 31
 Unaudited Balance Sheet As of January 31 Total Enrollment: 371 Assets: Cash $ 1,408,868 $ 1,375,117 Invested Cash 4,664,286 4,136,167 Premiums Receivable 94,152 91,261 Prepaid 32,270 33,421 Assessments
Consumer Price Index (Base year 2014) Consumer Price Index
 Consumer Price Index") Consumer Price Index December 2017 (Base year 2014) Consumer Price Index 1 Release Date: January 2018 Detailed by: Expenditure groups Household welfare levels Household type Regions Briefing This publication
Consumer Price Index December 2017 (Base year 2014) Consumer Price Index 1 Release Date: January 2018 Detailed by: Expenditure groups Household welfare levels Household type Regions Briefing This publication
Fiscal Year 2018 Project 1 Annual Budget
 Fiscal Year 2018 Project 1 Annual Budget Table of Contents Table Page Summary 3 Summary of Costs Table 1 4 Treasury Related Expenses Table 2 5 Summary of Full Time Equivalent Table 3 6 Positions Cost-to-Cash
HUD NSP-1 Reporting Apr 2010 Grantee Report - New Mexico State Program
 HUD NSP-1 Reporting Apr 2010 Grantee Report - State Program State Program NSP-1 Grant Amount is $19,600,000 $9,355,381 (47.7%) has been committed $4,010,874 (20.5%) has been expended Grant Number HUD Region
Consumer Price Index (Base year 2014) Consumer Price Index
 Consumer Price Index") Consumer Price Index December 2016 (Base year 2014) Consumer Price Index 1 Release Date: January 2017 Detailed by: Expenditure groups Household welfare levels Household type Regions Briefing This publication
Consumer Price Index December 2016 (Base year 2014) Consumer Price Index 1 Release Date: January 2017 Detailed by: Expenditure groups Household welfare levels Household type Regions Briefing This publication
SCHEDULE and 2019 Budget Assumptions
 SCHEDULE 3.4 2018 and 2019 Budget Assumptions 1 2018-19 Budgets Assumptions 2 3 The following assumptions were used by EGNB in the development of its 2018 and 2019 Budgets: 4 5 Budget Item Assumption 6
Financial & Business Highlights For the Year Ended June 30, 2017
 Financial & Business Highlights For the Year Ended June, 17 17 16 15 14 13 12 Profit and Loss Account Operating Revenue 858 590 648 415 172 174 Investment gains net 5 162 909 825 322 516 Other 262 146
QUARTERLY REPORT AND CERTIFICATION OF THE COUNTY TREASURER For Quarter Ending June 30, 2009 COMPLIANCE CERTIFICATION
 QUARTERLY REPORT AND CERTIFICATION OF THE COUNTY TREASURER For Quarter Ending June 30, 2009 The Government Code requires the County Treasurer to render a Quarterly Report to the County Administrator, the
MONTHLY ECONOMIC INDICATORS
 MONTHLY ECONOMIC INDICATORS SEPTEMBER 0 Table of Contents 1. INFLATION... 2 2. MONEY, CREDIT AND INTEREST RATES... 6 3. REAL SECTOR INDICATORS... 9 4. BALANCE OF PAYMENTS AND EXTERNAL SECTOR INDICATORS...
QUARTERLY FINANCIAL REPORT June 30, 2017
 California Independent System Operator QUARTERLY FINANCIAL REPORT June 30, 2017 250 Outcropping Way Folsom, CA 95630 (916) 351-4000 CALIFORNIA INDEPENDENT SYSTEM OPERATOR CORPORATION QUARTERLY FINANCIAL
Consumer Price Index (Base year 2014) Consumer Price Index
 Consumer Price Index") Consumer Price Index July 207 (Base year 204) Consumer Price Index Release Date: Augest 207 Detailed by: Expenditure groups Household welfare levels Household type Regions Briefing This publication provides
Consumer Price Index July 207 (Base year 204) Consumer Price Index Release Date: Augest 207 Detailed by: Expenditure groups Household welfare levels Household type Regions Briefing This publication provides
THE B E A CH TO WN S O F P ALM B EA CH
 THE B E A CH TO WN S O F P ALM B EA CH C OU N T Y F LO R I D A August www.luxuryhomemarketing.com PALM BEACH TOWNS SINGLE-FAMILY HOMES LUXURY INVENTORY VS. SALES JULY Sales Luxury Benchmark Price : 7,
Big Walnut Local School District
 Big Walnut Local School District Monthly Financial Report for the month ended September 30, 2013 Prepared By: Felicia Drummey Treasurer BIG WALNUT LOCAL SCHOOL DISTRICT SUMMARY OF YEAR TO DATE FINANCIAL
City of St. Augustine. Vision
 This Page Blank This Page Blank City of St. Augustine Vision Core Values Mission Guiding Principles Livability Authenticity Character Vitality Communication and Online Presence Historic Preservation Planning
FOR RELEASE: MONDAY, MARCH 21 AT 4 PM
 Interviews with 1,012 adult Americans conducted by telephone by Opinion Research Corporation on March 18-20, 2011. The margin of sampling error for results based on the total sample is plus or minus 3
Comprehensive Monthly Financial Report July 2013
 Comprehensive Monthly Financial Report July 2013 MONTHLY FINANCIAL REPORT PERFORMANCE AT A GLANCE ALL FUNDS SUMMARY GENERAL FUND REV VS EXP PROPERTY TAXES SALES TAXES FRANCHISE FEES UTILITY FUND REV VS
US Army Corps of Engineers South Pacific Division. CMANC Eureka, CA October 2008
 US Army Corps of Engineers South Pacific Division CMANC Eureka, CA 13-15 October 2008 Most Important to the Corps is to continue our positive relationship with CMANC Current Initiatives with CMANC Regional
SLO IRWM Regional Water Management Group MEETING AGENDA
 SLO IRWM Regional Water Management Group MEETING AGENDA Date: September 2, 2015 Time: 9:00 AM 11:00 AM Location: SLO City/County Library Community Room 995 Palm St, San Luis Obispo, CA 93401 RWMG Meeting
Durham Orange Joint Staff Working Group Meeting Agenda October 10, :30 pm 4:00 pm Durham City Hall, Transportation 4B
 Durham Orange Joint Staff Working Group Meeting Agenda October 10, 2018 2:30 pm 4:00 pm Durham City Hall, Transportation 4B 1. Call to Order/Roll Call 2. Election Chair Position 3. Open Issues a. FY2019
NORTH SYRACUSE CENTRAL SCHOOL DISTRICT. Fund Balance & Budget Assumptions December 4, 2017
 NORTH SYRACUSE CENTRAL SCHOOL DISTRICT Fund Balance & Budget Assumptions 2018-2019 December 4, 2017 1 AGENDA Fund Balance Reserves Economic Factors Revenue Assumptions Expenditure Assumptions Budget Timeline
Regional overview Gisborne
 Regional overview Purchasing intentions - additional income-related rent subsidy (IRRS) places Area District 1 2 3 4+ TOTAL 3 35 5 7 total 3 35 5 7 7 8 9 1 11 Purchasing intentions - change within the
Rate Structure Administrative Procedures Handbook FY 2017/18
 FY 2017/18 Page i Table of Contents 1 OVERVIEW... 1 2 RATE STRUCTURE AT-A-GLANCE... 2 2.1 CURRENT RATES... 2 2.2 TWO-YEAR RATE CYCLE & BILLING CYCLE MILESTONES... 3 2.3 WATER SERVICES AND PROGRAMS AND
CALHOUN COUNTY CHAMBER OF COMMERCE AND VISITORS CENTER
 2017 Economic Forum CALHOUN COUNTY CHAMBER OF COMMERCE AND VISITORS CENTER Information provided by School of Business and Industry THANK YOU to our SPONSORS Calhoun County Economy Forum National Update
NORTH SYRACUSE CENTRAL SCHOOL DISTRICT. Fund Balance & Budget Assumptions December 3, 2018
 NORTH SYRACUSE CENTRAL SCHOOL DISTRICT Fund Balance & Budget Assumptions 2019-2020 December 3, 2018 1 AGENDA Fund Balance Reserves Economic Factors Revenue Assumptions Expenditure Assumptions Budget Timeline
Budget Manager Meeting. February 20, 2018
 Budget Manager Meeting February 20, 2018 Meeting Agenda DISCUSSION DRAFT NOT FOR DISTRIBUTION Budget Office Current Year Forecast Process Endowment Payout Control Charts FY19 Target Meetings Delphi Project
Rate Structure Administrative Procedures Handbook FY 2018/19
 FY 2018/19 Page i Table of Contents 1 OVERVIEW... 1 2 RATE STRUCTURE AT-A-GLANCE... 2 2.1 CURRENT RATES... 2 2.2 TWO-YEAR RATE CYCLE & BILLING CYCLE MILESTONES... 3 2.3 WATER SERVICES AND PROGRAMS AND
General Fund Revenue
 Millions Percent of Kathy Steinert, Director of Fiscal Services Phone: 541.923.8927 145 SE Salmon Ave Redmond, OR 97756 kathy.steinert@redmond.k12.or.us Date: May 23, 2014 To: Redmond School District Board
Permian Basin Workforce Development Area* February 2016
 Workforce Development Area* February 2016 WDA CLF Employed Unemployed Rate CLF Employed Unemployed Rate Feb-16 232,454 221,480 10,974 4.7 Feb-16 13,221,720 12,654,923 566,797 4.3 Jan-16 230,842 220,266
Historical Pricing PJM COMED, Around the Clock. Cal '15 Cal '16 Cal '17 Cal '18 Cal '19 Cal '20 Cal '21 Cal '22
 $50 Historical Pricing PJM COMED, Around the Clock $48 $46 $44 $42 $40 $38 $36 $34 $32 $30 $28 $26 Cal '15 Cal '16 Cal '17 Cal '18 Cal '19 Cal '20 Cal '21 Cal '22 The information presented above was gathered
HIGHLANDS RANCH METROPOLITAN DISTRICT SPECIAL BOARD MEETING FIRE AND EMERGENCY WORKSHOP ADDENDA
 HIGHLANDS RANCH METROPOLITAN DISTRICT SPECIAL BOARD MEETING FIRE AND EMERGENCY WORKSHOP ADDENDA September 11, 2017 Addendum documents can also be viewed at http://highlandsranch.org or http://intranet.highlandsranch.org/default.aspx
Public-Private Partnerships in Maryland. Canada-US Forum on Public-Private Partnerships October 3, 2013
 Public-Private Partnerships in Maryland Canada-US Forum on Public-Private Partnerships October 3, 2013 Towards a More Comprehensive P3 Approach 2010 P3 Law (Chapters 640 and 641 of 2010) Joint Legislative
Revenue Estimating Conference Tobacco Tax and Surcharge Executive Summary
 Revenue Estimating Conference Tobacco Tax and Surcharge Executive Summary February 12, 2014 The Revenue Estimating Conference reviewed Tobacco Tax and Surcharge revenues on February 12, 2014. The forecasts
Isle Of Wight half year business confidence report
 half year business confidence report half year report contents new company registrations closed companies (dissolved) net company growth uk company share director age director gender naming trends sic
Managing Revenue in Water Systems
 Managing Revenue in Water Systems Monday, June 1, 2015 2:40 3:55 1.5 CPE Moderator: Speakers: Rodney Greek, San Diego County Water Authority Debby Cherney, Eastern Municipal Water District Jeffrey Hughes,
September 2014 Monthly Financial Report PREPARED BY
 September 2014 Monthly Financial Report PREPARED BY Financial Accounting & Reporting Division City of Phoenix Monthly Financial Report September 2014 Table of Contents by Programs Page Performance Status
Regional overview Hawke's Bay
 Regional overview Purchasing intentions - additional income-related rent subsidy (IRRS) places Area Hastings Central 1 2 3 4+ TOTAL 5 5 25 125 3 3 1 7 total 8 8 35 195 7 8 9 1 11 Purchasing intentions
EMPLOYER S MUNICIPAL INCOME TAX WITHHOLDING FORMS INSTRUCTIONS FOR FILING FORM LW-1
 CITY TAX DEPT 50 TOWN SQUARE P.O. BOX 155 LIMA, OHIO 45802 PHONE (419) 221-5245 FAX (419) 998-5527 (MONTHLY OR QUARTERLY STATEMENT) FORM LW-3 (ANNUAL RECONCILIATION) EMPLOYER S MUNICIPAL INCOME TAX WITHHOLDING
Solution to Problem 31 Adjusting entries. Solution to Problem 32 Closing entries.
 Solution to Problem 31 Adjusting entries. 1. Utilities expense 27,000 Accounts payable 27,000 2. Rent revenue 4,000 Unearned revenue 4,000 3. Supplies 2,000 Supplies expense 2,000 4. Interest receivable
The World Bank. Key Dates. Project Development Objectives. Components. Public Disclosure Authorized. Implementation Status & Results Report
 Public Disclosure Authorized AFRICA Africa Environment & Natural Resources Global Practice IBRD/IDA Adaptable Program Loan FY 2009 Seq No: 13 ARCHIVED on 29-Dec-2016 ISR26629 Implementing Agencies: Ministry
BUTTE COUNTY TREASURY OVERSIGHT COMMITTEE
 BUTTE COUNTY TREASURY OVERSIGHT COMMITTEE 25 County Center Drive, Ste 125 Oroville, CA 95965 Lisa Anderson, BCOE Director of Fiscal Services, Superintendent of Schools Representative David A. Houser, Butte
Cost Estimation of a Manufacturing Company
 Cost Estimation of a Manufacturing Company Name: Business: Date: Economics of One Unit: Manufacturing Company (Only complete if you are making a product, such as a bracelet or beauty product) Economics
Chapter 6. Solution: Austin Electronics. State of Economy Sales Probability
 Chapter 6 Problems 6-1. Austin Electronics expects sales next year to be $900,000 if the economy is strong, $650,000 if the economy is steady, and $375,000 if the economy is weak. The firm believes there
Japan Securities Finance Co.,Ltd
 Japan Securities Finance Co.,Ltd \ mil ( )ratio of OR Mar-13 Mar-14 Securities Finance Bussiness 14,093 16,363 Margin Loan Business 6,625 9,240 (37.5%) (47.2%) Interest on Loans 1,760 4,012 Interest
Water and Wastewater Utility Rates
 Water and Wastewater Utility Rates March 1, 2016 Presented By: Diana Langley Public Works Director 1 OVERVIEW 2 Uses of Funds Capital Investment Debt Service Operating Cost = Revenue Requirement 3 Source
Buad 195 Chapter 4 Example Solutions, Pre-Midterm Page 1 of 9
 Buad 195 Chapter 4 Example Solutions, Pre-Midterm Page 1 of 9 Example 1 4-5 page 116 Ross Pro s Sports Equipment + Projected sales... 4,800 units + Desired ending inventory... 480 (10% 4,800) Beginning
Traffic Municipal Manager Traffic
 Municipal Manager Data Safety Signals TRF - 1 Description The Department promotes and ensures safe and efficient transportation. Responsibilities encompass the day-to-day operation of Anchorage's traffic
Development of Economy and Financial Markets of Kazakhstan
 Development of Economy and Financial Markets of Kazakhstan National Bank of Kazakhstan Macroeconomic development GDP, real growth, % 116 112 18 14 1 113,5 11,7 216,7223,8226,5 19,8 19,8 19,3 19,619,7 199,
Historical Pricing PJM PSEG, Around the Clock. Cal '15 Cal '16 Cal '17 Cal '18 Cal '19 Cal '20 Cal '21 Cal '22
 $70 Historical Pricing PJM PSEG, Around the Clock $65 $60 $55 $50 $45 $40 $35 $30 $25 Cal '15 Cal '16 Cal '17 Cal '18 Cal '19 Cal '20 Cal '21 Cal '22 The information presented above was gathered and compiled
Project NEON Interim Finance Committee Rudy Malfabon Director
 Project NEON Interim Finance Committee Rudy Malfabon Director October 22, 2014 1 Project Benefits Safety & Congestion 1,000 crashes per year! Connectivity /Mobility for City Redevelopment Efforts Congestion:
QUARTERLY FINANCIAL REPORT March 31, 2018
 California Independent System Operator QUARTERLY FINANCIAL REPORT March 31, 2018 250 Outcropping Way Folsom, CA 95630 (916) 351-4000 CALIFORNIA INDEPENDENT SYSTEM OPERATOR CORPORATION QUARTERLY FINANCIAL
Large Commercial Rate Simplification
 Large Commercial Rate Simplification Presented to: Key Account Luncheon Red Lion Hotel Presented by: Mark Haddad Assistant Director/CFO October 19, 2017 Most Important Information First There is no rate
Ontario s Endangered Species Act, Latornell Symposium November 14, 2007 Alliston
 Ontario s Endangered Species Act, 2007 Latornell Symposium November 14, 2007 Alliston Why a new ESA? * Outdated Legislation * External Drivers UN Convention on Biological Diversity (1992) Canadian Biodiversity
MIAMI PARKING AUTHORITY
 Revenue & Expenses Summary For the Five Months Ending February 28, 2019 Page 1 Adopted FY 2018 Actual Actual Actual Budget Actual Versus FY 2018 Versus 2019 Budget Year-To-Date $ $ $ $ % $ % Operating
Board of Directors October 2018 and YTD Financial Report
 Board of Directors October 2018 and YTD Financial Report Consolidated Financial Results Operating Margin October ($30,262) $129,301 ($159,563) Year-to-date $292,283 $931,358 ($639,076) Excess of Revenue
Work Program Integration Initiative (WPII)
") Florida Department of TRANSPORTATION Work Program Integration Initiative (WPII) Florida PALM Executive Steering Committee Meeting February 27, 2019 Florida Department of Transportation Agenda Overview
Florida Department of TRANSPORTATION Work Program Integration Initiative (WPII) Florida PALM Executive Steering Committee Meeting February 27, 2019 Florida Department of Transportation Agenda Overview
Factor Leave Accruals. Accruing Vacation and Sick Leave
 Factor Leave Accruals Accruing Vacation and Sick Leave Factor Leave Accruals As part of the transition of non-exempt employees to biweekly pay, the UC Office of the President also requires standardization
CFO Report Six Months Ended June 30, 2014
 CFO Report Six Months Ended June 30, 2014 The attached unaudited financial statements and supplemental financial information reflect the cumulative results from operations for the six months ending June
JANUARY Lorem ipsum. Water Use Report
 JANUARY 2018 Lorem ipsum Report Reductions Background Purpose This report provides monthly supply and use reduction data. The report originated in 2014 as part of the Santa Clara Valley District s (district)
FOR - ARRA Financial and Operational Review Report Investigations
 Program Description 96-3133 Investigations This appropriation funds studies to determine the need, engineering feasibility, and economic and environmental return to the Nation of potential solutions to
Kirkwood Meadows Public Utility District Finance Committee REGULAR MEETING NOTICE
 Kirkwood Meadows Public Utility District Finance Committee REGULAR MEETING NOTICE NOTICE IS HEREBY GIVEN that the Finance Committee of the Kirkwood Meadows Public Utility District has called a Special
2011 Budget vs. Actual Status
 2011 Budget vs. Actual Status (unaudited d results) ($ in millions, unless otherwise noted) Draft - For Discussion Purposes Only Cheryl Hussey Controller & Asst. Treasurer Budget & Priorities Working Group
Mar 31, 2018 Cash Balance
 Staff Report To: Mayor Muhlfeld and City Councilors From: Dana Smith, Finance Director Date: April 28, 2018 Re: 3rd Quarter Financial Report for Fiscal Year 2018 This quarterly financial report provides
Executive Summary. July 17, 2015
 Executive Summary July 17, 2015 The Revenue Estimating Conference adopted interest rates for use in the state budgeting process. The adopted interest rates take into consideration current benchmark rates
SCHEDULE 10 INDEX FACTOR
 DRAFT SCHEDULE 10 INDEX FACTOR SCHEDULE 10 INDEX FACTOR 1. GENERAL 1.1 Capitalized Terms Capitalized terms used in this Schedule have the definitions as set out in the Agreement to Design, Build, Finance
Forecast Position. Detailed financial statements are included in the Appendix attached to this report. March 2018 $Ms Year to Date $Ms Full Year $Ms
 MEMO To: Board Members From: Eric Sinclair, GM Finance & Performance Date: 18 April 2018 Subject: Financial Report for February 2018 Status This report contains: For decision Update Regular report For
Review of Membership Developments
 RIPE Network Coordination Centre Review of Membership Developments 7 October 2009/ GM / Lisbon http://www.ripe.net 1 Applications development RIPE Network Coordination Centre 140 120 100 80 60 2007 2008