Managing Revenue in Water Systems
|
|
|
- Piers Cole
- 5 years ago
- Views:
Transcription


1 Managing Revenue in Water Systems Monday, June 1, :40 3: CPE Moderator: Speakers: Rodney Greek, San Diego County Water Authority Debby Cherney, Eastern Municipal Water District Jeffrey Hughes, University of North Carolina Chapel Hill

2 Jeff Hughes Environmental Finance Center, UNC School of Government Debby Cherney Eastern Municipal Water District
3 Presentation Outline 1. Overview of revenue challenges and trends 2. Strategies that work, sort of work, and may work in the future. 3. Communicating difficult financial realities 4. Resources


4 Supporting the fair, effective, and financially sustainable delivery of environmental programs through: Applied Research Teaching and Outreach Program Design and Evaluation How you pay for it matters 4


5 Our partner water and wastewater utilities Acknowledgements


6 and REPORT TOOLS SLIDES BLOG POSTS 6


7 Revenue Variability at 3 Water Utilities Assessed and compared revenue risk of 3 utilities with different rate structures, climates, customer water use patterns, customer types. Applied each other s rates on own customer base to identify relationships between revenue risk, rates and use. Listed mitigation strategies.
8 REVENUE CHALLENGES AND TRENDS

9 Sales Trends? What are you seeing in your region?
10 Need a New Business Model? ,000 Water Sales (million gallons per day average) Conservation Pricing Changes in 2002 and ,000 18,000 16,000 14,000 Reclaimed Water Use Begins 12,000 Customer Accounts ,000 Actual Water Sales Accounts Source: Orange Water and Sewer Authority

11 Projections Don t Generate Revenue 11
12 Industry Revenue Growth Roller Coaster Annual Change to the Total Operating Revenues Between Years 18% 16% 14% 12% 10% 8% 6% 4% 2% 0% 2% 4% 2004 to 2005 High revenue growth 2005 to to to 2008 Low revenue growth 2008 to to to 2011 Revenues increased Revenues decreased Interquartile range (25th to 75th percentiles) Median Data analyzed by the Environmental Finance Center at the University of North Carolina, Chapel Hill and Raftelis Financial Consultants, Inc. Data Source: Moody's Water and Sewer Municipal Financial Ratio Analysis. The cohort of 485 utilities is consistent across all years. Annual change in total operating revenues among the same 485 utilities nationwide
13 Revenue vs. rate adjustments (2004 to 2010) 1 to 1 Line Data analysis by the Environmental Finance Center at the University of North Carolina. Data sources: 2010 and 2004 RFC/AWWA Water and Wastewater Rates Survey Data for 82 Utilities 13
14 STRATEGIES FOR OVERCOMING REVENUE CHALLENGES

15 ALLOCATION BASED CONSERVATION RATES EASTERN MUNICIPAL WATER DISTRICT RIVERSIDE COUNTY, CALIFORNIA
16 About EMWD Established in 1950 Southwest Riverside County, California High-growth, arid climate, limited water 555 square mile service area Population: ~785,000 Services: Water / Sewer / Recycled 2014 Water Supplies 51% imported water 16% local groundwater and desalters 33% recycled water EMWD has a long history of having a strong Conservation Ethic it matters all the time, not just in times of drought.

 restricting water diversions o Colorado River watershed snowpack average in 2014, 63% of")
17 California Drought o 2014 was 7th driest and the 9th hottest year on record (137 years) o 94% of state in severe, extreme or exceptional drought o Snowpack is now only 6% of average o Major reservoirs throughout California are at or below normal o California Department of Water Resources (DWR) restricting water diversions o Colorado River watershed snowpack average in 2014, 63% of average in 2015
 o Jul 29, 2014: State Water Resources Control Board (SWRCB) implements Emergency Water Conservation Regulations (mandatory) o Mar 27, 2015: SWRCB expands Emergency Water")
18 California Regulatory Actions o Jan 17, 2014: Governor Brown declares a drought emergency (calls for voluntary conservation) o Apr 25, 2014: Second executive order asking for redoubling conservation efforts (voluntary) o Jul 29, 2014: State Water Resources Control Board (SWRCB) implements Emergency Water Conservation Regulations (mandatory) o Mar 27, 2015: SWRCB expands Emergency Water Conservation Regulations o Apr 1, 2015: Governor s Executive Order mandating 25% statewide reduction in potable water use


19 California Regulatory Actions (con t) o Apr 7, 2015: State Board releases initial regulatory framework to implement the Executive Order. o Apr 28, 2015: State Board releases an update to the framework incorporating the following: o o o Simplistic sorting of agencies using a three-month July - September 2014 self-reported GPCD Agencies assigned into groups ranging from 4% to 36% required reductions Failure to meet targets by February 2016 can result in fines of up to $10,000 per day Regulations provided no acknowledgment of climate, housing density or conservation achievements prior to 2013.
20 Tools and Strategies EMWD is mandated to cut potable water use by 28% ohow? Mandatory use restrictions Customer incentives Active outreach Partnering with building industry and county to introduce new landscape ordinances Allocation Based Rate Structure
21 Allocation Based Rates o Individualized Budgets Encourages efficiency through sharply tiered pricing system Fair Identified Over Use Customers for Targeted Outreach Appropriate cost nexus by reinvesting in water use efficiency programs and higher cost supplies Over Allocation Within Allocation Indoor Usage Budget Persons x 60 GPD Outdoor Usage Budget Irrigated Area x ET Factor Excessive Use Up to 50% over budget Wasteful Use More than 50% over budget Price/CCF Tier 1: $1.793 Tier 2: $3.280 Tier 3: $5.879 Tier 4: $10.755
22 Fixed v. Variable o Variable rates capture 100% of variable costs o Fixed service charges capture most of fixed costs, plus include separate line items on the bill for water supply reliability capital charges and sewer system capital charge (R&R) o When we sell less water, we actually drive down our melded cost of water because we buy less of our most expensive supply $300 $250 $200 $150 $100 $50 $ $151 $133 Revenue Volumetric Revenue Fixed Revenue FY 2014 Revenue and Expense Water & Sewer ($ million) $91 $149 Expense Volumetric Expense Fixed Expense
23 Water Use Efficiency Results Gallons per Capita per Dat (GPCD) EMWD GPCD Statewide Average: 198 GPCD Baseline Average = % 2020 Compliance Target = 175 GPCD 152 GPCD Actual GPCD Baseline GPCD Target GPCD
24 EMWD Net Revenue Monthly Water Revenues, Expenses and Percent of Customers in Highest Tiers (12-month Rolling Average) $12,000, % $10,000, % 18.0% $8,000, % $6,000, % $4,000, % 14.0% $2,000, % $- 12.0% Water Revenue Water Expense % Customers in Tier 3 & 4
25 Water Shortage Contingency Plan Stage Date Approved Description Actions Stage 1 April 2011 Supply Watch Voluntary reduction up to 10% Stage 2 April 2014 Supply Alert Voluntary reduction up to 25% Stage 3 August 2014 (3a) Stage 4 Stage 5 Mandatory Waste Reduction Mandatory Outdoor Reduction Mandatory Indoor Reductions 3a: No variance adjustments; observation based penalties 3b: Tier 3 budgets decreased by 50% 3c: Tier 3 budgets decreased by 100% Watering schedules limited (1-2 days/week) 4a: Tier 2 budgets decreased by 10% 4b: Tier 2 budgets decreased by 50% 4c: Tier 2 budgets decreased by 100% Catastrophic stage (50% reduction in demand) 5a: Tier 1 budgets decreased by 10% 5b: Tier 1 budgets decreased by 30% 5c: Tier 1 budgets decreased by 50%
26 Hypothetical Impact of a Stage 4b o o At Stage 3a, District projects 68,000 AF of tiered water sales per year. At Stage 4b, District could see acre-foot sales decrease by 20% or more Stage 4b projected to increase revenue over the near-term (5-8 months). District projects FY 2016 revenue increase of approximately $5 million. $140 Commodity Sales($) / Tier Customer Base case (WSCP Stage 3a) relative to WSCP Stage 4b 100% Commodity Sales/Customer $120 $100 $80 $60 $40 $20 90% 80% 70% 60% 50% 40% 30% 20% 10% Reduction in Tier 4 AF Sales $- Jul Aug Sep Oct Nov Dec Jan Feb Mar Apr May Jun Base case 4b Tier 4 Sales Reduction 0% o Notes: Base case sales using FY15 actual monthly sales per tier. Stage 4b effective July 1 assuming no Tier 3 sales; 50% of tier 2 sales become Tier 4; monthly reduction in Tier 4 sales until 90% reduction achieved. FY 2016 revenue projection assumes some form of revenue adjustment during July through September.


27 Evolving Pricing: Water Utility 2.0?
28 Source: Fayetteville Observer 2/6/04

29 Fixed vs. Variable Revenues and Expenses
30 Rethinking Rate Models, Projections, and omore conservative Cash Flow Plans orate models with less (or no) dependence on revenues from high volume or high block sales o Excess revenues transferred to reserve funds or used for increased pay as you go cash capital funding


31 Conservative Pricing Paired with Rebates or Dividends o Dividends linked to sales, cost of service, and/or policy goals ACE 2012: Skepticism Among the Judges
32 PeakSet Base Base charges generate much higher portion of revenues Base charges are customized to match customer s impact Historic consumption patterns replace meter size as dominant determent of base charge. Comparison of BJWSA existing residential rates to a revenue neutral PeakSet Base model (2012 EFC analysis) Existing BJWSA residential rate structure PeakSet base residential rate structure % fixed revenue 18% 57% Monthly base rate $6.00/meter for water $1.85 x rolling 3 yr. avg. of peak month sales (kgal) Variable rate $3.46/kgal $0.52/kgal

 Water")
33 Matt Williams, Water Advisory Committee Member to the City of Davis (CA) Water Division
34 Feedback from Expert Panel 8: This model is intriguing. 8: This model provides a steady stream of revenue for the utility, which makes it very attractive to me. 7: I like that the base rate is set based on use.
35 CustomerSelect Rate Model
36 COMMUNICATING DIFFICULT REVENUE TRUTHS
37 The Future? orevenue needs are outpacing inflation oprice increases often have to outpace revenue requirements increase needs oprice levels should not be the only financial metric a board focuses on
38 Comprehensive Revenue Metric? $1,200 $1,000 $800 $ $669 $643 $753 $1,032 $600 $563 $414 $582 $497 $524 $400 $298 $282 $200 $0 38
39


40 Water Research Foundation Rate Approval Process Communication Strategy and Toolkit (#4455) Principal Investigators Other Team Members
41 Which statement below best describes the water rate increase that was proposed to the local government governing body for approval? (n=1,349) *Summary Statistics Analysis Conducted by UNC Environmental Finance Center 2015 Water Research Foundation. ALL RIGHTS RESERVED.
42 Utilities where rate adjustment requests were more likely to cover essential costs tended to: obe overseen by more experienced staff member ohave a more trusting staff board relationship oinclude capital information with request oinclude alignment with a master plan ohave less of an existing affordability challenge obe in a larger city Analysis Conducted by UNC Environmental Finance Center 2015 Water Research Foundation. ALL RIGHTS RESERVED.

43 2015 Water Research Foundation. ALL RIGHTS RESERVED.

44 Where Can You Find More? Or subscribe to the Environmental Finance blog!
 o Focus on residential revenues o Utility inputs own: Rate structure details (can compare 2) Residential customer water use profile Weather patterns Assumptions on price")
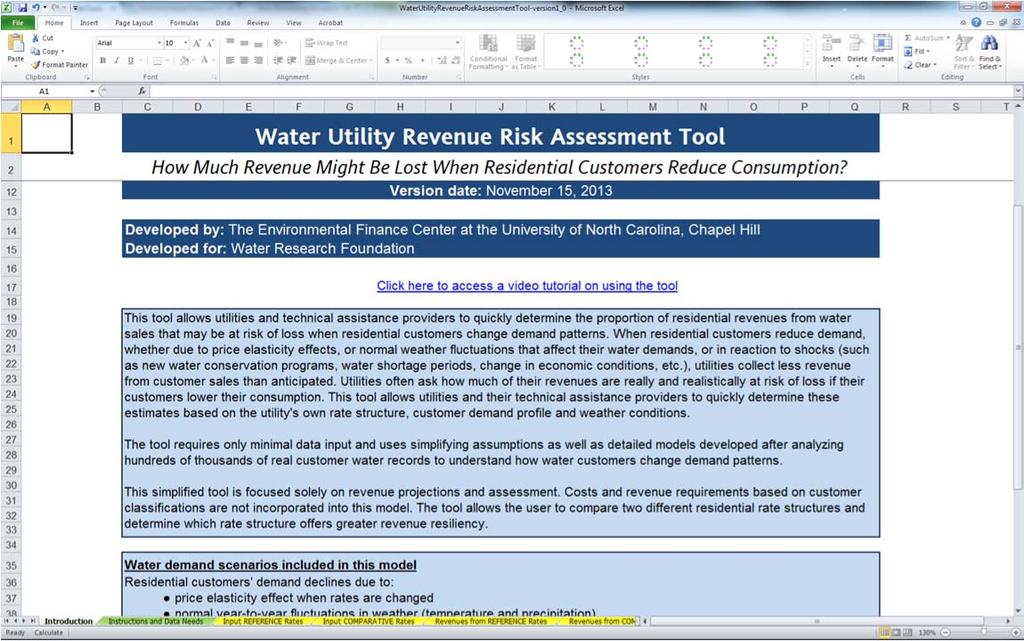
45 Water Utility Revenue Risk Assessment Tool Free to download and use at o Excel tool (simplified) o Focus on residential revenues o Utility inputs own: Rate structure details (can compare 2) Residential customer water use profile Weather patterns Assumptions on price elasticity o Tool estimates the proportion of revenues that may be lost due to changes in water use patterns due to: Rate increase, alone or plus: Normal weather pattern changes, or One time, significant and sudden conservation effort

46 Whiteboard Video Intro Draft version available temporarily at
Water Shortage Contingency Plan During the California Drought and the Use of Allocation Based Tiered Rates
 Water Shortage Contingency Plan During the California Drought and the Use of Allocation Based Tiered Rates Paul D. Jones II, P.E Multi-State Salinity Coalition February 2018 1 emwd.org Presentation Outline
Central Texas Water Efficiency Network Water Rates and Revenue Workshop
 Central Texas Water Efficiency Network Water Rates and Revenue Workshop Jeff Hughes, UNC Environmental Finance Center jhughes@sog.unc.edu www.efc.sog.unc.edu Austin, Texas November 13, 2013 http://efc.sog.unc.edu
Jeff Hughes, Environmental Finance Center at UNC
 Moving Beyond Dollars Per Gallons Sold (#38983) Defining a Resilient Business Model for Water Utilities Water Research Foundation #4366 ACE 2013 DENVER Wednesday; 3:30 5:00PM Jeff Hughes, Environmental
Defining a Resilient Business Model for Water Utilities Water Research Foundation #4366 Presentation to Louisville Water Company 10/14/2013
 Defining a Resilient Business Model for Water Utilities Water Research Foundation #4366 Presentation to Louisville Water Company 10/14/2013 Jeff Hughes, jhughes@sog.unc.edu Shadi Eskaf, eskaf@sog.unc.edu
Defining a Resilient Business Model for Water Utilities
 Defining a Resilient Business Model for Water Utilities Water Research Foundation Project #4366 Shadi Eskaf, Environmental Finance Center at UNC eskaf@sog.unc.edu www.efc.unc.edu National Water & Wastewater
Capital Finance Overview: Dealing with the New Normal
 Capital Finance Overview: Dealing with the New Normal Jeff Hughes Director Environmental Finance Center at the University of North Carolina efc.unc.edu jhughes@sog.unc.edu (919) 843-4956 www.efc.unc.edu
Rates, Rates and More Rates
 Rates, Rates and More Rates Jeff Hughes David Tucker February 5-6, 2013 Chapel Hill, NC www.efc.unc.edu Session Objectives 1. Provide update on state of rates 2. Provide strategies for dealing with rate
Ask the Experts. Jeff Hughes John Wright David Graff
 Ask the Experts Jeff Hughes John Wright David Graff Enter your question into the question pane at the lower right hand side of the screen. Please include your name and specify to whom you are addressing
Raising Revenue for Capital Infrastructure
 Raising Revenue for Capital Infrastructure Jeff Hughes Environmental Finance Center jhughes@sog.unc.edu Shadi Eskaf Environmental Finance Center eskaf@sog.unc.edu www.efc.unc.edu How satisfied are you
Water Research Foundation #4366 Defining a Resilient Business Model for Water Utilities Part 1
 Water Research Foundation #4366 Defining a Resilient Business Model for Water Utilities Part 1 Blog Posts Appendix B Presenters Mary Tiger University of North Carolina Environmental Finance Center
2016 Water and Recycled Water Rate Study PUBLIC HEARING DECEMBER 12, 2016
 2016 Water and Recycled Water Rate Study PUBLIC HEARING DECEMBER 12, 2016 Agenda Rate Study Overview Financial Plan Water Rate Design Recycled Water Rate Design Drought Rates Capacity Fees 12/12/2016 Public
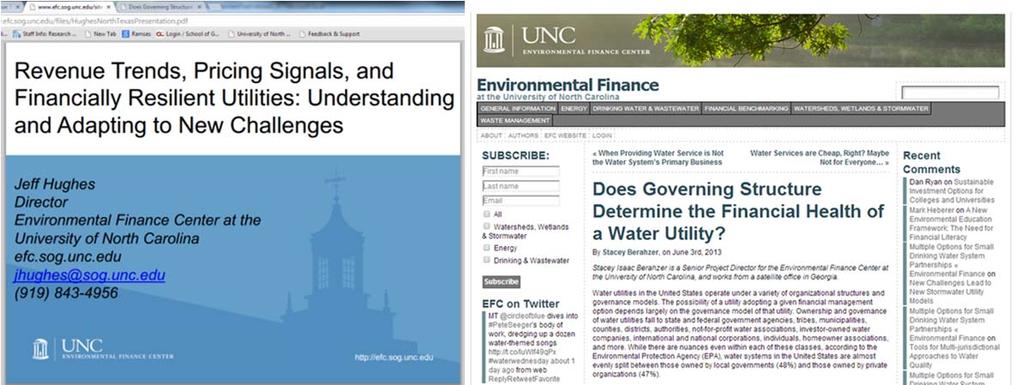
Revenue Trends, Pricing Signals, and Financially Resilient Utilities: Understanding and Adapting to New Challenges
 Revenue Trends, Pricing Signals, and Financially Resilient Utilities: Understanding and Adapting to New Challenges Jeff Hughes Director Environmental Finance Center at the University of North Carolina
Budgeting for Municipal Enterprises
 Budgeting for Municipal Enterprises Glenn Barnes & Shadi Eskaf Senior Project Directors Environmental Finance Center at UNC School of Government SOG Course: Budgeting in Local Government Chapel Hill, NC
System Fiscal Sustainability
 System Fiscal Sustainability Jeff Hughes UNC Environmental Finance Center UNC School of Government jhughes@unc.edu www.efc.sog.unc.edu www.efc.unc.edu Agenda 1. Fiscal sustainability challenges 2. Strategies
Rates, Rates, and More Rates
 Rates, Rates, and More Rates Jeff Hughes David Tucker February 10-11, 2016 Chapel Hill, NC www.efc.unc.edu TOPICS - Headline stories? - Summary of rates and rate trends in N.C. - Rate increases, etc. -
Pricing Water to Achieve Full Cost Recovery
 Pricing Water to Achieve Full Cost Recovery Glenn Barnes Environmental Finance Center The University of North Carolina at Chapel Hill 919-962-2789 glennbarnes@sog.unc.edu Webinar Objectives Understand
Roadmap to Financial Health
 Roadmap to Financial Health Jeff Hughes Shadi Eskaf March 5-6, 2012 Chapel Hill, NC www.efc.unc.edu Session Objectives 1. Improve ability to assess financial health 2. Improve understanding of strategies
Budgeting for Municipal Enterprises
 Budgeting for Municipal Enterprises Glenn Barnes & Shadi Eskaf Senior Project Directors Environmental Finance Center at UNC School of Government SOG Course: Budgeting in Local Government Chapel Hill, NC
YORK COUNTY, SOUTH CAROLINA
 YORK COUNTY, SOUTH CAROLINA Water and Sewer Financial Planning and Rate Study Report October 25, 2017 1031 S. Caldwell Street Suite 100 Charlotte, NC 28203 Phone 704.373.1199 Fax 704.373.1113 www.raftelis.com
Rainbow Municipal Water District
 Rainbow Municipal Water District Potable Water Cost of Service Study November 10, 2015 201 S Lake Ave. Suite 301 Pasadena CA 91101 Phone 626.583.1894 Fax 626.583.1411 www.raftelis.com November 10, 2015
Long-Term Financial Stability Workshop #4. Capital Investment & Financing. Board of Directors September 23, 2014
 Long-Term Financial Stability Workshop #4 Capital Investment & Financing Board of Directors September 23, 2014 Agenda Introduction Capital Investment & Financing Seismic Surcharge 2 Workshop Topics Workshop
Temescal Valley Water District
 Temescal Valley Water District Comprehensive Water, Recycled Water, and Wastewater Cost of Service Study Draft Report / December 7, 2016 24640 Jefferson Avenue Suite 207 Murrieta, CA 92562 Phone 951.698.0145
LONG BEACH WATER DEPARTMENT COST OF SERVICE AND RATE STUDY
 LONG BEACH WATER DEPARTMENT COST OF SERVICE AND RATE STUDY Final Report / February 1, 2017 445 S. Figueroa Street Suite 2270 Los Angeles, CA 90071 Phone Fax 213. 262. 9300 213. 262. 9303 www.raftelis.com
Benchmarking and Rate Setting in Water and Wastewater Management
 Benchmarking and Rate Setting in Water and Wastewater Management Stacey Isaac Berahzer Senior Project Director Environmental Finance Center at the University of North Carolina Georgia Association of Water
WATER AND SEWER UTILITIES RATE STUDY
 WATER AND SEWER UTILITIES RATE STUDY RATE DESIGN WORKSHOP WITHCITYCOUNCIL / UTILITIES COMMISSION March 6, 2014 Agenda Overview of Rate Study Process Water / Sewer Developer Impact Fees Sewer Rates Water
JANUARY Lorem ipsum. Water Use Report
 JANUARY 2018 Lorem ipsum Report Reductions Background Purpose This report provides monthly supply and use reduction data. The report originated in 2014 as part of the Santa Clara Valley District s (district)
July 1, Tier Percent of Allocation Cost per ccf $0.91 $1.27 $2.86 $4.80 $ % % % % 201+%
 1 CHART EXAMPLES OF WATER RATES AND CHARGES OF MWD MEMBER AGENCIES AND THEIR SUBAGENCIES MWD Member Agencies shown: MWDOC, SDCWA, Calleguas, Las Virgenes, West Basin, LADWP, Eastern and Foothill Member
Study Workshops are designed to be both educational and to seek broad direction from the Board
 Study Workshops are designed to be both educational and to seek broad direction from the Board Workshop #1 Financial Forecast & Cost of Service Water, recycled water, & sewer services Revenue requirement
WATER USER RATES & FEE STUDY
 WATER USER RATES & FEE STUDY FINAL REPORT February 2016 BARTLE WELLS ASSOCIATES Independent Public Finance Consultants 1889 Alcatraz Avenue Berkeley, California 94703 www.bartlewells.com Tel: 510/653-3399
CITY MANAGER S OFFICE ADMINISTRATIVE REPORT May 17, La Palma City Council. Laurie Murray, City Manager. In This Week s Report
 CITY MANAGER S OFFICE ADMINISTRATIVE REPORT 2018-19 May 17, 2018 TO: FROM: La Palma City Council Laurie Murray, City Manager In This Week s Report GFOA Certificate of Excellence in Financial Reporting
CITY OF ANN ARBOR WATER & SEWER COST OF SERVICE STUDY
 1 CITY OF ANN ARBOR WATER & SEWER COST OF SERVICE STUDY 12.20.2017 Overview 1. Sufficiency 2. Rate Classification 3. to Serve 4. Rate Structures 5. Customer Impacts 6. Affordability Program Foundation
The City of Sierra Madre
 The City of Sierra Madre Comprehensive Water and Wastewater Cost of Service Study Report / December 24, 2018 24640 Jefferson Avenue Suite 207 Murrieta, CA 92562 Phone 951.698.0145 www.raftelis.com December
April 6, Katherine Godbey Director of Finance, Coachella Valley Water District Hovley Lane East Palm Desert, CA 92260
 April 6, 2016 Katherine Godbey Director of Finance, Coachella Valley Water District 75515 Hovley Lane East Palm Desert, CA 92260 Dear Ms. Godbey: Hawksley Consulting (a subsidiary of MWH Global) is pleased
Comprehensive Monthly Financial Report July 2013
 Comprehensive Monthly Financial Report July 2013 MONTHLY FINANCIAL REPORT PERFORMANCE AT A GLANCE ALL FUNDS SUMMARY GENERAL FUND REV VS EXP PROPERTY TAXES SALES TAXES FRANCHISE FEES UTILITY FUND REV VS
7/25/2012. July 25, Rate Refinement Workgroup Page 1 July 25, 2012
 July 25, 2012 Rate Refinement Workgroup Page 1 July 25, 2012 Linking rate structure and water management actions: Tier 1 Baseline alternatives Timing to implement sales year type Defining the conditions
SAN ANTONIO WATER SYSTEM (SAWS) RATE ADVISORY COMMITTEE: MEETING 3
 RATE ADVISORY COMMITTEE: MEETING 3") 01 April, 2014 SAN ANTONIO WATER SYSTEM (SAWS) RATE ADVISORY COMMITTEE: MEETING 3 Bill Zieburtz Richard Campbell Robert Chambers RATE SETTING PROCESS STUDY APPROACH RATE SETTING OBJECTIVES FINANCIAL PLAN
01 April, 2014 SAN ANTONIO WATER SYSTEM (SAWS) RATE ADVISORY COMMITTEE: MEETING 3 Bill Zieburtz Richard Campbell Robert Chambers RATE SETTING PROCESS STUDY APPROACH RATE SETTING OBJECTIVES FINANCIAL PLAN
Metropolitan s Water Supply Allocation Plan (WSAP)
") Exhibit A EASTERN MUNICIPAL WATER DISTRICT Metropolitan s Water Supply Allocation Plan (WSAP) Elizabeth Lovsted Senior Civil Engineer October 22, 2014 www.emwd.org 1 Review of Current WSAP Policy www.emwd.org
Exhibit A EASTERN MUNICIPAL WATER DISTRICT Metropolitan s Water Supply Allocation Plan (WSAP) Elizabeth Lovsted Senior Civil Engineer October 22, 2014 www.emwd.org 1 Review of Current WSAP Policy www.emwd.org
Rate Structure Administrative Procedures Handbook FY 2018/19
 FY 2018/19 Page i Table of Contents 1 OVERVIEW... 1 2 RATE STRUCTURE AT-A-GLANCE... 2 2.1 CURRENT RATES... 2 2.2 TWO-YEAR RATE CYCLE & BILLING CYCLE MILESTONES... 3 2.3 WATER SERVICES AND PROGRAMS AND
Resilient Business Models for Water and Wastewater Utilities
 Resilient Business Models for Water and Wastewater Utilities Jeff Hughes Director, Environmental Finance Center Faculty, Water and Wastewater Leadership Program University of North Carolina at Chapel Hill
Third Quarter Financial Report Fiscal Year and. Mid-Term Budget Update - Fiscal Year June 15, 2015
 Third Quarter Financial Report Fiscal Year 2014-15 and Mid-Term Budget Update - Fiscal Year 2015-16 June 15, 2015 1 Overview Economic Environment Fiscal Year 2014-2015 Third Quarter Financial Report Fiscal
Final COST OF SERVICE STUDY SEPTEMBER City of San Clemente
 Final COST OF SERVICE STUDY SEPTEMBER 2017 City of San Clemente Contents CONTENTS Executive Summary... 1 Study Goals and Drivers... 1 Water Rate Analysis & Adoption... 2 Recycled Water Rate Analysis &
Rate Structure Administrative Procedures Handbook FY 2017/18
 FY 2017/18 Page i Table of Contents 1 OVERVIEW... 1 2 RATE STRUCTURE AT-A-GLANCE... 2 2.1 CURRENT RATES... 2 2.2 TWO-YEAR RATE CYCLE & BILLING CYCLE MILESTONES... 3 2.3 WATER SERVICES AND PROGRAMS AND
SANTA MONICA RENT CONTROL BOARD ADMINISTRATION MEMORANDUM
 SANTA MONICA RENT CONTROL BOARD ADMINISTRATION MEMORANDUM DATE: May 10, 2005 TO: FROM: Santa Monica Rent Control Board Mary Ann Yurkonis, Administrator FOR MEETING OF: May 12, 2005 RE: Annual General Adjustment
Maurice Kaufman, Director of Public Works / City Engineer Bartle Wells Associates DATE: September 7, 2016 MEMORANDUM
 TO: FROM: Maurice Kaufman, Director of Public Works / City Engineer Bartle Wells Associates DATE: September 7, 2016 SUBJECT: - MEMORANDUM Introduction The (City) provides sewer sanitary collection services
Water Rates Rate Restructure and Rate Adjustments
 Water Rates Rate Restructure and Rate Adjustments Community Outreach Meeting Questions We Will Address Why are water rates changing? Where does the water come from? Did the rain from last winter help?
February 14, Attention: Administrative and Finance Committee. Controller s Report on Monthly Financial Reports.
 February 14, 2018 Attention: Administrative and Finance Committee Controller s Report on Monthly Financial Reports. (Information) Purpose The purpose of the Controller s Report is to provide monthly financial
BODEGA BAY PUBLIC UTILITY DISTRICT Water and Wastewater Rate Study
 BODEGA BAY PUBLIC UTILITY DISTRICT Water and Wastewater Rate Study FINAL REPORT March 22, 2018 BARTLE WELLS ASSOCIATES Independent Public Finance Advisors 1889 Alcatraz Avenue Berkeley, CA 94703-2714 Tel.
NALDRAFT SEPTEMBER2015 WASTEWATE
 FI NALDRAFT SEPTEMBER2015 Cos tof S e r v i c e s S T UDY WATE R WASTEWATE R RE CY CL E DWATE R ST ORMWATE R E NVI RONME NT ALRE SOURCE S CITY OF OXNARD PUBLIC WORKS INTEGRATED MASTER PLAN COST OF SERVICE
WESTWOOD LUTHERAN CHURCH Summary Financial Statement YEAR TO DATE - February 28, Over(Under) Budget WECC Fund Actual Budget
 Budget WECC Fund Actual Budget") WESTWOOD LUTHERAN CHURCH Summary Financial Statement YEAR TO DATE - February 28, 2018 General Fund Actual A B C D E F WECC Fund Actual Revenue Revenue - Faith Giving 1 $ 213 $ 234 $ (22) - Tuition $ 226
WESTWOOD LUTHERAN CHURCH Summary Financial Statement YEAR TO DATE - February 28, 2018 General Fund Actual A B C D E F WECC Fund Actual Revenue Revenue - Faith Giving 1 $ 213 $ 234 $ (22) - Tuition $ 226
Strategic Business Plan Department of Water Resources. Gwinnett County Department of Water Resources
 g w i n n e t t c o u n t y Strategic Business Plan Department of Water Resources Gwinnett County Department of Water Resources A Message from the Director The Department of Water Resources Strategic Business
Comprehensive Water Rate Study
 Final Report Dublin San Ramon Services District Comprehensive Water Rate Study January 213 Prepared by: HDR Engineering, Inc. January 1, 213 Ms. Lori Rose Financial Services Manager Dublin San Ramon Services
COMPREHENSIVE COST OF SERVICE AND RATE DESIGN ANALYSIS
 Black & Veatch Holding Company 2011. All rights reserved. COMPREHENSIVE COST OF SERVICE AND RATE DESIGN ANALYSIS San Antonio Water System PREPARED FOR San Antonio Water System 26 MAY 2015 B&V PROJECT NO.
Public Hearing FY15 Proposed Non-Prop 218 Rates, Charges & Regulations. June 10, 2014
 Public Hearing FY15 Proposed Non-Prop 218 Rates, Charges & Regulations June 10, 2014 Key Dates FY15 Adopted Prop 218 Rates, Fees June 11, 2013 & Charges FY15 GM Report on Recommended May 13, 2014 Non-Prop
Unfunded Pension Liability Accelerated Funding Options
 Unfunded Pension Liability Accelerated Funding Options 131253 May 29, 2018 DISTRICT S CURRENT PENSION FUNDING STATUS $2,000,000 $1,800,000 $1,600,000 $1,400,000 $1,200,000 Annual UAL Payments Status Quo
YORBA LINDA WATER DISTRICT
 YORBA LINDA WATER DISTRICT 2015 Water and Sewer Rate Study Report FINAL August 25, 2015 City of Thousand Oaks Water and Wastewater Financial Plan Study Report 445 S. Figueroa Street Suite #227 Los Angeles,
DRAFT COMPREHENSIVE COST OF SERVICE AND RATE DESIGN ANALYSIS. San Antonio Water System. San Antonio Water System 21 MAY 2015 PREPARED FOR
 Black & Veatch Holding Company 2011. All rights reserved. DRAFT COMPREHENSIVE COST OF SERVICE AND RATE DESIGN ANALYSIS San Antonio Water System PREPARED FOR San Antonio Water System 21 MAY 2015 B&V PROJECT
Glacial Lakes Sanitary Sewer & Water District Utility Rate Study. Shelly Eldridge Ehlers Jeanne Vogt - Ehlers
 Glacial Lakes Sanitary Sewer & Water District Utility Rate Study Shelly Eldridge Ehlers Jeanne Vogt - Ehlers 05/30/2017 1 Background What are Utility Funds Utility funds are used to pay for operations,
2017 WATER, RECYCLED WATER, AND WASTEWATER RATE STUDY REPORT
 2017 WATER, RECYCLED WATER, AND WASTEWATER RATE STUDY REPORT Rancho California Water District [Type here] Table of Contents 1 Introduction... 5 1.1 About Rancho California Water District... 5 1.2 Background
RANCHO CALIFORNIA WATER DISTRICT
 RANCHO CALIFORNIA WATER DISTRICT Two-Year Rate Study Final Report / June 4, 2018 June 4, 2018 Mr. Richard Aragon Assistant General Manager CFO/Treasurer Rancho California Water District 42135 Winchester
WATER VALIDATION, COST OF SERVICE & RATE DESIGN ANALYSIS WASTEWATER VALIDATION & RATE ANALYSIS MISCELLANEOUS FEES & OVERHEAD RATE ANALYSIS
 WATER VALIDATION, COST OF SERVICE & RATE DESIGN ANALYSIS WASTEWATER VALIDATION & RATE ANALYSIS MISCELLANEOUS FEES & OVERHEAD RATE ANALYSIS B&V PROJECT NO. 179801.0100 PREPARED FOR Vallecitos Water District,
Foundations of Finance
 Foundations of Finance March 8, 2018 International Woman s Day National Peanut Cluster Day Jeff Hughes Environmental Finance Center UNC School of Government 919.843.4956 jhughes@unc.edu www.efc.sog.unc.edu
EASTERN MUNICIPAL WATER DISTRICT BIENNIAL BUDGET FISCAL YEARS AND
 EASTERN MUNICIPAL WATER DISTRICT BIENNIAL BUDGET FISCAL YEARS 2017-18 AND 2018-19 ADOPTED JUNE 7, 2017 STRATEGIC PLAN... 10 MISSION, VISION, AND GUIDING PRINCIPLES... 10 Mission... 10 Vision... 10 Guiding
Managing Financial Risk and Declining Demand. Presentation Outline
 Managing Financial Risk and Declining Demand Washington Association of Sewer & Water Districts Spring Conference April 13, 2012 John Ghilarducci Presentation Outline 1. Why Consumption is Declining Potential
Power Accountants Association Annual Meeting Potential Impacts from Oct 2015 Rate Change
 Power Accountants Association Annual Meeting Potential Impacts from Oct 2015 Rate Change Material Provided by: Chris Mitchell Chris Mitchell Management Consultants (CMMC) mail@chrismitchellmc.com 5/14/2015
Meeting #1 June 29, 2012
 Meeting #1 June 28, 2012 Rate Refinement Workgroup Meeting 1 Key Issues Overview Existing Purchase OrderReview Existing Rate Structure Review Replenishment Rate Options Ad Valorem Tax Rate Treatment Cost
Historical Pricing PJM COMED, Around the Clock. Cal '15 Cal '16 Cal '17 Cal '18 Cal '19 Cal '20 Cal '21 Cal '22
 $50 Historical Pricing PJM COMED, Around the Clock $48 $46 $44 $42 $40 $38 $36 $34 $32 $30 $28 $26 Cal '15 Cal '16 Cal '17 Cal '18 Cal '19 Cal '20 Cal '21 Cal '22 The information presented above was gathered
Santa Clarita Water Division
 Santa Clarita Water Division Retail Water Rate Cost of Service Study Report September 2017 445 S Figueroa St Suite 2270 Los Angeles, CA 90039 Phone 213.262.9300 www.raftelis.com September 11, 2017 Mr.
2016 Water and Recycled Water Rate Study WEBINAR WITH DISTRICT STAFF JUNE 29, 2016
 2016 Water and Recycled Water Rate Study WEBINAR WITH DISTRICT STAFF JUNE 29, 2016 Agenda Financial Policy & Financial Plan Capacity Fees Preliminary Results Tier Definitions Next Steps 2016 Water & RW
Water Rate Study FINAL January 31, 2018
 Water Rate Study FINAL January 31, 2018 1889 Alcatraz Avenue Berkeley, CA 94703 Tel: 510 653 3399 www.bartlewells.com January 31, 2018 Joshua Basin Water District P.O. Box 675 / 61750 Chollita Road Joshua
Introduction to Water and Sewer Fund Needs August 11, 2017
 Introduction to Water and Sewer Fund Needs August 11, 2017 A lot of good things are happening in Buffalo and we hope to make some exciting announcements in the months to come, especially about possible
PARADISE IRRIGATION DISTRICT
 PARADISE IRRIGATION DISTRICT 6332 Clark Rel I P.O. Box 2409 I Paradise, California 95967 I 530.$77.4971 I Fax 530.$76.04$3 1. Cash position At 5/31/2017 the Districts total cash position was $2,337,027.46.
Navigating Today s Water Finance and Governance Challenges
 Navigating Today s Water Finance and Governance Challenges Jeff Hughes Environmental Finance Center, School of Government University of North Carolina at Chapel Hill jhughes@unc.edu www.efc.sog.unc.edu
PETERS TOWNSHIP SANITARY AUTHORITY 2011 BUDGET WORKSHOP. November 30, 2010
 PETERS TOWNSHIP SANITARY AUTHORITY 2011 BUDGET WORKSHOP November 30, 2010 Agenda A. 2010 Budget Performance Summary B. 2011 Budget Request C. 2011 Capital Plan D. Consulting Engineer s Annual Report Preliminary
Historical Pricing PJM PSEG, Around the Clock. Cal '15 Cal '16 Cal '17 Cal '18 Cal '19 Cal '20 Cal '21 Cal '22
 $70 Historical Pricing PJM PSEG, Around the Clock $65 $60 $55 $50 $45 $40 $35 $30 $25 Cal '15 Cal '16 Cal '17 Cal '18 Cal '19 Cal '20 Cal '21 Cal '22 The information presented above was gathered and compiled
GENERAL FUND AT A GLANCE Category Budget YTD Actual % % Year Passed Resources 8.33% Uses 8.33% $0 $1,330,750
 City of Edmond Monthly Financial Report FY 2008/2009 Through the Month Ended Unaudited - Intended for Management Purposes Only The following is a summary of the City's financial results for operating funds.
City of Fridley Water and Sewer Rate Study. Jessica Cook 9/25/17
 City of Fridley Water and Sewer Rate Study Jessica Cook 9/25/17 1 Utility Funds They are Enterprise Funds 1. Should pay for Capital Outlays Operations Replacement Reserves Debt 2. Should be flush with
5. CONSIDER APPROVAL OF THE MINUTES OF THE NOVEMBER 14, 2018 REGULAR FINANCE COMMITTEE MEETING
 NOTICE OF A SPECIAL MEETING OF THE OLIVENHAIN MUNICIPAL WATER DISTRICT S FINANCE COMMITTEE 1966 Olivenhain Road, Encinitas, CA 92024 Tel: (760) 753-6466 Fax: (760) 753-1578 Pursuant to AB 3035, effective
SELF-FUNDED PPO HEALTH PLAN RATE REQUIREMENTS RETIREES JANUARY 1, 2018 DECEMBER 31, 2018 COUNTY OF ORANGE JUNE 2017
 SELF-FUNDED PPO HEALTH PLAN RATE REQUIREMENTS RETIREES JANUARY 1, 2018 DECEMBER 31, 2018 COUNTY OF ORANGE JUNE 2017 Page 1 of 12 COUNTY OF ORANGE CONTENTS 1. Introduction...3 2. Rate Adjustment...4 3.
Accountant s Compilation Report
 Tel: 817-738-2400 Fax: 817-738-1995 www.bdo.com 6050 Southwest Blvd, Suite 300 Fort Worth, TX 76109 Accountant s Compilation Report Joseph Portugal Town Administrator Town of Westover Hills, Texas Management
Purpose of this Framework. Financial Management. Guiding Principles and Definitions
 STRATEGIC PLAN 2016-2018 Financial Framework, Updated for 2016 Purpose of this Framework This Financial Framework is intended to serve as a bridge between the Williamsburg Regional Library s (WRL) Strategic
Gallons per Capita - v2.05
 Gallons per Capita - v2.5 This spreadsheet-based GPCD calculator is designed to help quantify and track water uses associated with water distribution systems. The spreadsheet contains several separate
Setting Rates to Support a Capital Improvement Plan
 Setting Rates to Support a Capital Improvement Plan Stacey Isaac Berahzer 18th Alabama Annual Surface Water Meeting October 29, 2015 http://efc.sog.unc.edu @EFCatUNC Dedicated to enhancing the ability
1. Accept staff report on the updated study of cost of service to provide potable water to San Jose Municipal Water System (SJMWS) customers; and
 customers; and") CITY OF Cr SAN IPSE CAPITAL OF SILICON VALLEY TO: HONORABLE MAYOR AND CITY COUNCIL SUBJECT: MUNICIPAL WATER SYSTEM COST OF SERVICE STUDY COUNCIL AGENDA: 05/09/17 ITEM: 7.2 Memorandum FROM: Kerrie Romanow
CITY OF Cr SAN IPSE CAPITAL OF SILICON VALLEY TO: HONORABLE MAYOR AND CITY COUNCIL SUBJECT: MUNICIPAL WATER SYSTEM COST OF SERVICE STUDY COUNCIL AGENDA: 05/09/17 ITEM: 7.2 Memorandum FROM: Kerrie Romanow
SANTA FE IRRIGATION DISTRICT
 SANTA FE IRRIGATION DISTRICT Water Rate Study FINAL Report/March 2016 445 S Figueroa Street Suite 2270 Los Angeles, CA 90071 Phone 213 262 9300 Fax 213 262 9303 www.raftelis.com March 21, 2016 Ms. Jeanne
City of Modesto Economic Indicators December 2014 Edition
 City of Modesto Economic Indicators December 2014 Edition Steve Christensen City of Modesto Economic Outlook: City of Modesto The City of Modesto continues to slowly recover from the Great Recession. Some
The series 2008 Water & Sewer Revenue Bonds Feasibility Report recommended the City perform and implement a rate study for the following reasons:
 Additional Background Information Water and Wastewater The City of Fort Lauderdale supplies water and sewer services on a regional basis to over 250,000 residents of central Broward County. The areas serviced
TEN YEAR FINANCIAL FORECAST
 TEN YEAR FINANCIAL FORECAST The ability to ensure a reliable supply of high quality water for Metropolitan s 26 member agencies depends on Metropolitan s ongoing ability to fund operations and maintenance,
Village of Baltimore Water & Wastewater Analysis. July 2018
 Village of Baltimore Water & Wastewater Analysis July 2018 Table of Contents Introductory Summary... 1 Data... 1 Water Treatment Plant (WTP)... 1 Production... 2 Costs & Debts... 2 Wastewater Treatment
Large Commercial Rate Simplification
 Large Commercial Rate Simplification Presented to: Key Account Luncheon Red Lion Hotel Presented by: Mark Haddad Assistant Director/CFO October 19, 2017 Most Important Information First There is no rate
Purpose The purpose of the Controller s Report is to provide summarized financial information on a monthly basis to the Board of Directors.
 November 28, 2018 Attention: Administrative and Finance Committee Controller s Report on Monthly Financial Activity. (Information) Purpose The purpose of the Controller s Report is to provide summarized
Department of Public Welfare (DPW)
") Department of Public Welfare (DPW) Office of Income Maintenance Electronic Benefits Transfer Card Risk Management Report Out-of-State Residency Review FISCAL YEAR 2014-2015 September 2014 (June, July and
Department of Public Welfare (DPW) Office of Income Maintenance Electronic Benefits Transfer Card Risk Management Report Out-of-State Residency Review FISCAL YEAR 2014-2015 September 2014 (June, July and
Pricing Objectives Exercise Worksheet
 201 S. Lake Avenue Suite 301 Pasadena, CA 91101 Phone 626. 583. 1894 www.raftelis.com Fax 626 583. 1411 IINMl CI/. l to/os Uilt.N TS I... I.' Pricing Objectives Exercise Worksheet 1. BACKGROUND The below
a b c d (c-b) Sept 30, 2015 Cash Balance
 Sept 30, 2015 Cash Balance") Staff Report To: From: Mayor John Muhlfeld and City Councilors Dana Smith, Finance Director Date: October 29, 2017 Re: 1st Quarter Financial Report for Fiscal Year 2018 This quarterly financial report
Staff Report To: From: Mayor John Muhlfeld and City Councilors Dana Smith, Finance Director Date: October 29, 2017 Re: 1st Quarter Financial Report for Fiscal Year 2018 This quarterly financial report
Purpose The purpose of the Controller s Report is to provide summarized financial information on a monthly basis to the Board of Directors.
 May 16, 2018 Attention: Administrative and Finance Committee Controller s Report on Monthly Financial Activity. (Information) Purpose The purpose of the Controller s Report is to provide summarized financial
WATER AND SEWER RATE STUDY
 FINAL WATER AND SEWER RATE STUDY B&V PROJECT NO. 179322.0100 PREPARED FOR City of Lynwood, CA JANUARY 11, 2017 Black & Veatch Holding Company 2011. All rights reserved. City of Lynwood, CA WATER AND SEWER
Utility Rates. October 13, 2015
 Utility Rates October 13, 2015 Agenda Summary Process Background Policy Rates Next Steps 2 Financial Needs Driving Rates 1. Bond coverage 2. Reserves Policy 3. Infrastructure - Asset management 3 Rate
TOWN OF HILLSBOROUGH. Water Rate Cost-of-Service Study
 TOWN OF HILLSBOROUGH December 12, 2016 TOWN OF HILLSBOROUGH 1600 Floribunda Avenue Hillsborough, CA 94010 WATER RATE COST-OF-SERVICE STUDY December 12, 2016 HF&H CONSULTANTS, LLC 201 North Civic Drive,
Logistics. At the top right corner of your screen: Control Panel: Attendee List
 Logistics At the top right corner of your screen: Show your control panel to submit questions and see answers All phones/microphones are muted for the duration of the webinar. Toggle between full screen/window
THE B E A CH TO WN S O F P ALM B EA CH
 THE B E A CH TO WN S O F P ALM B EA CH C OU N T Y F LO R I D A August www.luxuryhomemarketing.com PALM BEACH TOWNS SINGLE-FAMILY HOMES LUXURY INVENTORY VS. SALES JULY Sales Luxury Benchmark Price : 7,
Quarterly Financial Report. Reporting financial results for the first quarter ended September 30, 2014
 Quarterly Financial Report Reporting financial results for the first quarter ended September 30, 2014 Woodburn Finance Department 10/27/2014 Executive Summary The Finance Department is pleased to offer