Table of Contents. Week in review. What we ll be watching... p. 5 Calendar of upcoming releases... p. 6 Annex Economic tables... A1.
|
|
|
- Blake Chad Hood
- 5 years ago
- Views:
Transcription
 in April in seasonally adjusted terms causing the year-on-year inflation rate to decline one tick to 2.2%.")
1 May 18, 2018 Table of Contents What we ll be watching... p. 5 Calendar of upcoming releases... p. 6 Annex Economic tables... A1 Week in review CANADA: Canada s rose 0.1% (m/m) in April in seasonally adjusted terms causing the year-on-year inflation rate to decline one tick to 2.2%. On a month-tomonth basis, in five categories prices were rising with alcohol/tobacco, clothing, and household operations experiencing the strongest increases while recreation, healthcare and transportation posted declines. CPI excluding food and energy was flat in seasonally adjusted terms and the year-on-year inflation rate declined one tick to 1.8%. On an annual basis, the CPI-trim stood at 2.1% (up one tick from 2.0%), CPI-Median at 2.1% (up one tick from 2.0%) and CPI- Common at 1.9% (unchanged). This is essentially the pace we expect this year in a context of full-employment that has already generated the strongest wage inflation since 2012 (3.6%, y/y). All in all, inflation has accelerated since the last Bank of Canada s rate hike in January, meaning that real policy rate has turned more accommodative. We continue to think that a next rate hike will occur in July as we see the economy accelerating in Q2. Canada: Underlying inflation running on target Consumer price index: Total and average of the three core measures preferred by the Bank of Canada 4.0 y/y % chg April NBF Economics and Strategy (data via Statistics Canada) BoC mid-point target Total (+2.2%) Average core (2.0%) increased 0.6% m/m in March to C$50.2 billion. That result came after an upwardly revised +0.5% reading the prior month (initially reported at +0.4%). In March, sales were up in 6 of the 11 categories surveyed including a 3.0% gain in the motor vehicles/parts segment. Excluding autos sales actually fell 0.2% on a monthly basis as increased outlays on furniture (+3.9%) and clothing (+2.5%) were more than offset by drawbacks for electronics (-2.4%), food (-1.2%) and gasoline stations (-1.9%). Discretionary sales, i.e. sales excluding gasoline, groceries and health products, rose for a third consecutive month, climbing 1.6% m/m. In real term, retail spending countrywide was up a healthy 0.8% in March. The good monthly showing Canada-wide will not be sufficient to salvage Q1 s performance. Indeed, real retail sales are on pace to decline 4.0% in annualized terms in the quarter, a result which could translate into the first negative contribution to GDP from consumption spending on goods since 2015Q1. Several elements can explain that poor showing notably the moderation of job creation in the first three month of the year and particularly poor weather early in Canada: Consumption spending could have acted as a drag on growth in Q1 Real consumption spending on goods versus real retail sales q/q % chg. saar Last negative contribution to growth 2015Q1 2015Q4 2016Q3 2017Q2 2018Q1 NBF Economics and Strategy (data via Statistics Canada) Real consumption spending on goods (from national accounts) Retail volumes In March, rose 1.4% m/m to C$57.1 billion. Sales were up in 13 of the 21 broad industries surveyed, including transportation equipment (+1.5%), primary metal manufacturing (+4.2%), and fabricated metal products (+4.6%). Alternatively, shipments of machinery (- 1.7%), chemicals (-0.9%), and petroleum/coal products (- 0.3%) declined. If the effect of price changes is removed, total factory sales increased 0.6% on a monthly basis. Although economic growth in Canada probably slowed down in the first quarter, the manufacturing sector likely still provided some lift. In addition to inventories growing, real manufacturing shipments jumped 4.0% annualized in Q1. This followed a +4.2% reading in 2017Q4 and, if confirmed, will represent a ninth consecutive quarterly advance (longest such stretch on record).
2 Canada: Factory output will add to growth in Q1 Real manufacturing shipments and inventories 9 q/q % chg. saar 8 Inventories Shipments Q1 2016Q3 2017Q1 2017Q3 2018Q1 NBF Economics and Strategy (data via Statistics Canada) In April, the rose 0.2% m/m. Eight of the 11 constituent metropolitan areas swung upward, led by Quebec City (+1.5%), Hamilton (+0.8%), and Halifax (+0.6%). Alternatively, the index slid 0.1% in Ottawa-Gatineau and 0.8% in Winnipeg. On a y/y basis, the Composite Index climbed 5.6%, its smallest gain since September Vancouver (+15.9%) and Victoria (+11.0%) lifted the national average, while growth was more subdued in other metropolitan areas: Halifax (+5.3%), Hamilton (+4.5%), Montreal (+3.9%), Ottawa/Gatineau (+3.0%), Quebec City (+2.4%), Toronto (+1.9%), Winnipeg (+1.2%), Edmonton (+0.4%), and Calgary (+0.2%). Moderate increases will likely continue to characterize the Composite Index over the coming months as conditions in the two major constituent home resale markets, Toronto and Vancouver, are now balanced (current active-listings to-sales ratios close to their long-term average). The Composite Index has stabilized in recent months Teranet-National Bank National Composite House Price Index TM Index June 2005 = 100 Jul 16 Oct 16 Jan 17 Apr 17 Jul 17 Oct 17 Jan 18 Apr 18 NBF Economics and Strategy (data via Teranet-National Bank House Price Index) According to the Canadian Real Estate Association (CREA), fell 2.9% m/m in April, marking a fourth consecutive monthly decline. Year on year, sales tumbled 19.7%, their steepest fall since October All of the provinces saw sales drop except for New Brunswick, Prince Edward Island, and Saskatchewan. The active-listings-to-sales ratio rose two ticks to 5.6, which is slightly above its longterm average but well within the parameters for a balanced market. By our calculations, the resale market is favourable to buyers in Alberta, Saskatchewan, Manitoba, and Newfoundland and Labrador. Alternatively, the PEI and Ontario markets look tight. Canada: Active-listings-to-sales ratio, April 2018 Seasonally adjusted data Number of standard deviations from mean CA NL PE NS NB QC ON MB SK AB BC NBF Economics and Strategy (data from CREA) data showed foreign investors increasing their holdings of Canadian securities by C$18.3 bn in the first quarter of 2018 as inflows in money market instruments (+C$15.4 bn) and equities (+C$6.1 bn) dwarfed net divestment from bonds (-C$3.1 bn). The bond net outflows during Q1 the first time that happens since 2013Q2 were largely due to federal government bonds (-$C27.6 bn) which offset net purchases of corporates (+C$22.5 bn, including C$3.2 bn in government enterprise bonds) and provis (+C$2.4 bn). The bonds from which foreigners divested were largely denominated in Canadian dollars. UNITED STATES: In April, rose 0.3% m/m after springing an upwardly revised 0.8% (from 0.6%) the prior month. Sales of motor vehicles and parts inched up 0.1%. Excluding this category, sales still advanced 0.3% thanks to gains for clothing (+1.4%), furniture (+0.8%), gasoline stations (+0.8%), and miscellaneous items (+0.9%). Sales increased in 9 of the 13 categories surveyed. Core sales, which are used to calculate GDP and exclude food services, auto dealers, building materials, and gasoline stations, jumped 0.4% after increasing an upwardly revised 0.5% the month before. Though still a bit early to make projections for Q2, retail sales certainly look set to rebound after a lacklustre Q1 that saw consumption s contribution to growth sink to just 0.7 point from 2.8 points in 2017Q4. To be sure, the strong handoff from March and April s decent results bode well for an acceleration of household consumption in Q2. fell 3.7% m/m in April to 1.287K in annualized terms after reaching their highest level since the recession the previous month (an upwardly revised 1,336K). While single-family starts were generally unchanged (+0.1% to 894K), multi-unit starts fell sharply (-11.3% to 393K). Buyers market Balanced market Sellers market 2
3 Apartment construction appears to be slowing as the vacancy rate in major markets are leading to increases in leasing concessions. Furthermore, the moderation of residential construction in the first month of Q2 might reflect challenges for builders, who are reportedly struggling to keep costs down in the face of a labour shortage and high lumber costs (in part due to import duties imposed by the U.S. government). Even without these difficulties, a slowdown was foreseeable after starts expanded 31.8% and 21.3% in annualized terms in Q4 and Q1, respectively. These recent increases mean that, despite the lackluster April results, housing starts remained 10.5% above their level 12 months earlier., for their part, retreated 1.8% m/m in April (March was upwardly revised from +2.5% to +4.1%), coming in at 1,352K on an annualized basis. The contraction was due above all to a 6.3% drop in the multifamily segment (to 493K). Permits for single-family dwellings, meanwhile, climbed 0.9% (to 859K). Still in April, progressed 0.7% m/m for a second month in a row. Manufacturing output, which represents 74.6% of total industrial production, expanded 0.5% on gains for computer/electronics (+1.2%) and machinery (+2.3%). Meanwhile, output in the utilities sector expanded 1.9% after swelling 6.1% in March, which was its strongest push in a year. Finally, mining output grew 1.1% and was up a healthy 10.6% on its level a year earlier, hoisted by higher oil prices. On a quarterly basis, if we assume no change in May and June, industrial production is still on track to grow more than 5% annualized in Q2 (i.e., more than twice the prior quarter s pace). The in the industrial sector as a whole went from 77.6% in March to a three-year high of 78.0% in April. In the mining sector, utilization reached 90.6%, its highest level since the drop in oil prices. Such levels of capacity utilization should continue to spur business investment in United States: Capacity pressures should spur investment in 2018 Capacity utilization. Last observation: April % Industrial sector as a whole (L) NBF Economics and Strategy (data via Datastream) Mining (R) The of general business conditions rebounded 4.3 points to 20.1 in May after dropping 6.7 points in April. Both the new orders sub-index (16.0 from 9.0 the prior month) and the shipments sub-index (19.1 from 17.5) rose and surpassed their respective six-month moving average. The number of employees gauge bounced back as well (from 6.0 to 8.7) but remained far below the levels reached at the end of last year (22.9 in December). As trade war talks abated somewhat, businesses reported a significantly improved outlook on the future, as evidenced by the 12.8-point spike registered by the index tracking firms expectations of general business conditions over the next six months (though the index did plunge 25.8 points the prior month). Interestingly, the input prices paid by New York manufacturing businesses continued to rise at a vigorous clip, with the prices paid tracker climbing 6.6 points to a sevenyear high of Rising energy prices and the weakness of the U.S. dollar at the beginning of the year are to blame at least in part for that surge in manufacturing prices. United States: Manufacturing input prices rising at fastest pace in years Prices paid indices: Empire Manufacturing Survey vs. ISM Manufacturing PMI Index NBF Economics and Strategy (data via Datastream) Empire (L) ISM (R) 110 Index 100 The was also up in May, rising 11.2 points to The shipments index went from 23.9 to 25.8 while the new orders tracker rocketed from 18.4 to 40.6 points. Employment was running strong with both the average workweek (21.6 to 34.4) and number of employees (27.1 to 30.2) sub-indices making gains. In April, the (LEI) extended its streak of non-negative prints to 23 months, as it gained 0.4 point to an all-time high of Meanwhile, the diffusion index rose from 60% to 80%, with most of the underlying economic indicators still contributing to lift the overall index. The interest rate spread and average workweek, which added 0.13 percentage point to the LEI respectively, were the principal drivers. Alternatively, stock prices (-0.07 pp) and building permits (-0.05 pp) acted as a drag on the headline index. WORLD: In, shrank 0.6% in annualized terms in Q1, breaking the streak of eight consecutive positive quarterly readings, the longest in 30 years. The decline was
4 driven primarily by inventory rundown, which shaved 0.6 point from growth. Residential investment also bore down on the headline figure. On the other hand, trade lifted GDP 0.3 percentage point as exports expanded faster than imports did. Meanwhile private consumption, business investment, and government spending were roughly flat. Though Q1 results were certainly not encouraging, they need to be contextualized. As the Japanese economy expanded at a pace well above potential in 2017, a slowdown was to be expected. As far as monetary policy is concerned, the poor showing in the quarter should reinforce the Bank of Japan s current stance in favour of continued stimulus. Japan: GDP shrank for first time in more than two years in Q1 Quarterly GDP growth Contributions to Q1 real GDP growth 5 %, saar 4 Final domestic demand Inventories Trade GDP Q Q GDP Consumption Business Investment Residential Investment Government Final Domestic Demand Exports Imports Trade Q1 2016Q3 2017Q1 2017Q3 2018Q1 Inventories NBF Economics and Strategy (data via Datastream) Still in, the national headline (CPI) rose 0.6% in April, down five ticks from 1.1% in March. The downswing was in part caused by a slowdown in fresh food (-1.5% vs. +6.3%) and energy prices (+5.3% y/y vs. +5.7% y/y the prior month). Excluding the price effects from those two categories, CPI rose just 0.4% in the twelve months to March. CPI excluding fresh food, the core measure preferred by the Bank of Japan, edged down two ticks to 0.7%, still far below the BoJ target of 2.0%. Jocelyn Paquet et al. 4

 5600K 5500K Durable goods orders (April, m/m chg.) 2.6% -1.9% U.S.")
5 What We ll Be Watching In the U.S., the week will provide important information about the housing market in April. To start with, may have retreated slightly in April, hampered by extremely low inventory levels. may also have cooled following a healthy 7.8% cumulative increase between January and March. In other news, probably retreated in April based on falling civilian plane orders. We ll also keep an eye on the release of for May and on the publication of the that took place on May 2 nd. In Canada, a relatively light data week will feature for March. Previous NBF forecasts Existing home sales (April, saar) 5600K 5500K Durable goods orders (April, m/m chg.) 2.6% -1.9% U.S.: Orders of durable goods probably weakened in April Durable goods orders m/m % chg. Elsewhere in the world, we ll get preliminary s readings in both the Eurozone and Japan. Still in Japan, April s numbers will be released % M M M M M M04 NBF Economics and Strategy (data via Datastream) NBF Forecast 5


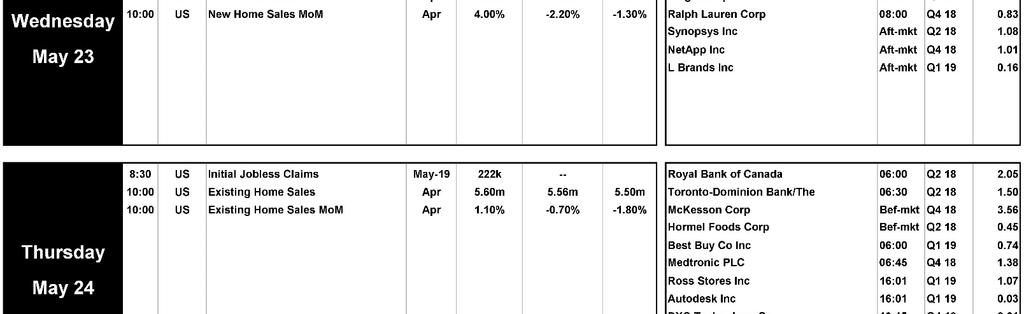
6 Economic Calendar Canada & U.S. 6

7 Annex Economic Tables A1

8 Annex Economic Tables A2

9 Annex Economic Tables A3

10 Annex Economic Tables A4
11 Annex Economic Tables A5
12 Annex Economic Tables A6

13 Annex Economic Tables A7

14 Annex Economic Tables A8
15 Economics and Strategy Montreal Office Toronto Office Stéfane Marion Marc Pinsonneault Kyle Dahms Warren Lovely Chief Economist and Strategist Senior Economist Economist MD & Head of Public Sector Strategy Paul-André Pinsonnault Matthieu Arseneau Jocelyn Paquet Senior Fixed Income Economist Senior Economist Economist Krishen Rangasamy Senior Economist Angelo Katsoras Geopolitical Analyst General This Report was prepared by National Bank Financial, Inc. (NBF), (a Canadian investment dealer, member of IIROC), an indirect wholly owned subsidiary of National Bank of Canada. National Bank of Canada is a public company listed on the Toronto Stock Exchange. The particulars contained herein were obtained from sources which we believe to be reliable but are not guaranteed by us and may be incomplete and may be subject to change without notice. The information is current as of the date of this document. Neither the author nor NBF assumes any obligation to update the information or advise on further developments relating to the topics or securities discussed. The opinions expressed are based upon the author(s) analysis and interpretation of these particulars and are not to be construed as a solicitation or offer to buy or sell the securities mentioned herein, and nothing in this Report constitutes a representation that any investment strategy or recommendation contained herein is suitable or appropriate to a recipient s individual circumstances. In all cases, investors should conduct their own investigation and analysis of such information before taking or omitting to take any action in relation to securities or markets that are analyzed in this Report. The Report alone is not intended to form the basis for an investment decision, or to replace any due diligence or analytical work required by you in making an investment decision. This Report is for distribution only under such circumstances as may be permitted by applicable law. This Report is not directed at you if NBF or any affiliate distributing this Report is prohibited or restricted by any legislation or regulation in any jurisdiction from making it available to you. You should satisfy yourself before reading it that NBF is permitted to provide this Report to you under relevant legislation and regulations. National Bank of Canada Financial Markets is a trade name used by National Bank Financial and National Bank of Canada Financial Inc. National Bank Financial Inc. or an affiliate thereof, owns or controls an equity interest in TMX Group Limited ( TMX Group ) and has a nominee director serving on the TMX Group s board of directors. As such, each such investment dealer may be considered to have an economic interest in the listing of securities on any exchange owned or operated by TMX Group, including the Toronto Stock Exchange, the TSX Venture Exchange and the Alpha Exchange. No person or company is required to obtain products or services from TMX Group or its affiliates as a condition of any such dealer supplying or continuing to supply a product or service. Canadian Residents NBF or its affiliates may engage in any trading strategies described herein for their own account or on a discretionary basis on behalf of certain clients and as market conditions change, may amend or change investment strategy including full and complete divestment. The trading interests of NBF and its affiliates may also be contrary to any opinions expressed in this Report. NBF or its affiliates often act as financial advisor, agent or underwriter for certain issuers mentioned herein and may receive remuneration for its services. As well NBF and its affiliates and/or their officers, directors, representatives, associates, may have a position in the securities mentioned herein and may make purchases and/or sales of these securities from time to time in the open market or otherwise. NBF and its affiliates may make a market in securities mentioned in this Report. This Report may not be independent of the proprietary interests of NBF and its affiliates. This Report is not considered a research product under Canadian law and regulation, and consequently is not governed by Canadian rules applicable to the publication and distribution of research Reports, including relevant restrictions or disclosures required to be included in research Reports.
16 UK Residents This Report is a marketing document. This Report has not been prepared in accordance with EU legal requirements designed to promote the independence of investment research and it is not subject to any prohibition on dealing ahead of the dissemination of investment research. In respect of the distribution of this Report to UK residents, NBF has approved the contents (including, where necessary, for the purposes of Section 21(1) of the Financial Services and Markets Act 2000). This Report is for information purposes only and does not constitute a personal recommendation, or investment, legal or tax advice. NBF and/or its parent and/or any companies within or affiliates of the National Bank of Canada group and/or any of their directors, officers and employees may have or may have had interests or long or short positions in, and may at any time make purchases and/or sales as principal or agent, or may act or may have acted as market maker in the relevant investments or related investments discussed in this Report, or may act or have acted as investment and/or commercial banker with respect hereto. The value of investments, and the income derived from them, can go down as well as up and you may not get back the amount invested. Past performance is not a guide to future performance. If an investment is denominated in a foreign currency, rates of exchange may have an adverse effect on the value of the investment. Investments which are illiquid may be difficult to sell or realise; it may also be difficult to obtain reliable information about their value or the extent of the risks to which they are exposed. Certain transactions, including those involving futures, swaps, and other derivatives, give rise to substantial risk and are not suitable for all investors. The investments contained in this Report are not available to retail customers and this Report is not for distribution to retail clients (within the meaning of the rules of the Financial Conduct Authority). Persons who are retail clients should not act or rely upon the information in this Report. This Report does not constitute or form part of any offer for sale or subscription of or solicitation of any offer to buy or subscribe for the securities described herein nor shall it or any part of it form the basis of or be relied on in connection with any contract or commitment whatsoever. This information is only for distribution to Eligible Counterparties and Professional Clients in the United Kingdom within the meaning of the rules of the Financial Conduct Authority. NBF is authorised and regulated by the Financial Conduct Authority and has its registered office at 71 Fenchurch Street, London, EC3M 4HD. NBF is not authorised by the Prudential Regulation Authority and the Financial Conduct Authority to accept deposits in the United Kingdom. U.S. Residents National Bank of Canada Financial Inc. (NBCFI), a broker-dealer registered with the U.S. Securities and Exchange Commission and a member of the Financial Industry Regulatory Authority (FINRA), and a member of the Securities Investor Protection Corporation (SIPC), is distributing this Report in the United States. NBCFI operates pursuant to a 15 a-6 Agreement with its Canadian affiliate, NBF Inc. This Report has been prepared in whole or in part by personnel employed by non-us affiliates of NBCFI that are not registered as broker/dealers in the US. These non-us personnel are not registered as associated persons of NBCFI and are not licensed or qualified as research analysts with FINRA or any other US regulatory authority and, accordingly, may not be subject (among other things) to FINRA restrictions regarding communications by a research analyst with the subject company, public appearances by research analysts and trading securities held in a research analyst account. The author(s) who prepared these Reports certify that this Report accurately reflects his or her personal opinions and views about the subject company or companies and its or their securities, and that no part of his/her compensation was, is, or will be directly or indirectly related to the specific recommendations or views expressed in this Report as to the securities or companies. NBF compensates the authors of this Report from a variety of sources, and such compensation is funded by the business activities of NBF including, Institutional Equity and Fixed Income Sales and Trading, Retail Sales, the correspondent clearing business and Corporate and Investment Banking. Because the views of its personnel may differ, members of the National Bank Financial Group may have or may in the future issue Reports that are inconsistent with this Report, or that reach conclusions different from those in this Report. To make further inquiry related to this Report, United States residents should contact their NBCFI registered representative. This document is intended for institutional investors and is not subject to all of the independence and disclosure standards under FINRA rules applicable to debt research Reports prepared for retail investors. This Report may not be independent of the proprietary interests of NBF, NBCFI, or their affiliates. NBF, NBCFI, or their affiliates may trade the securities covered in this Report for their own account and on a discretionary basis on behalf of certain clients. Such trading interests may be contrary to the recommendation(s) offered in this Report. HK Residents With respect to the distribution of this report in Hong Kong by NBC Financial Markets Asia Limited ( NBCFMA )which is licensed by the Securities and Futures Commission ( SFC ) to conduct Type 1 (dealing in securities) and Type 3 (leveraged foreign exchange trading) regulated activities, the contents of this report are solely for informational purposes. It has not been approved by, reviewed by, verified by or filed with any regulator in Hong Kong. Nothing herein is a recommendation, advice, offer or solicitation to buy or sell a product or service, nor an official confirmation of any transaction. None of the products issuers, NBCFMA or its affiliates or other persons or entities named herein are obliged to notify you of changes to any information and none of the foregoing assume any loss suffered by you in reliance of such information. The content of this report may contain information about investment products which are not authorized by SFC for offering to the public in Hong Kong and such information will only be available to, those persons who are Professional Investors (as defined in the Securities and Futures Ordinance of Hong Kong ( SFO )). If you are in any doubt as to your status you should consult a financial adviser or contact us. This material is not meant to be marketing materials and is not intended for public distribution. Please note that neither this material nor the product referred to is authorized for sale by SFC. Please refer to product prospectus for full details. There may be conflicts of interest relating to NBCFMA or its affiliates businesses. These activities and interests include potential multiple advisory, transactional and financial and other interests in securities and instruments that may be purchased or sold by NBCFMA or its affiliates, or in other investment vehicles which are managed by NBCFMA or its affiliates that may purchase or sell such securities and instruments. No other entity within the National Bank of Canada group, including National Bank of Canada and National Bank Financial Inc, is licensed or registered with the SFC. Accordingly, such entities and their employees are not permitted and do not intend to: (i) carry on a business in any regulated activity in Hong Kong; (ii) hold themselves out as carrying on a business in any regulated activity in Hong Kong; or (iii) actively market their services to the Hong Kong public. Copyright This Report may not be reproduced in whole or in part, or further distributed or published or referred to in any manner whatsoever, nor may the information, opinions or conclusions contained in it be referred to without in each case the prior express written consent of NBF.
Halifax, Vancouver and St.Catharines on the podium
 April 23, 2018 Halifax, Vancouver and St.Catharines on the podium According to our proprietary Metropolitan Economic Momentum Index (see page 3 for methodology), Halifax enjoyed the largest economic upswing
A budget kept in balance by a draw from the stabilization reserve
 March 27, 2018 A budget kept in balance by a draw from the stabilization reserve Highlights Quebec 2018 Budget Economics and Strategy Despite $848 million in additional spending in fiscal 2017-18, the
Table of Contents. Week in review. What we ll be watching... p. 4 Calendar of upcoming releases... p. 5 Annex Economic tables...
 January 12, 2018 Table of Contents What we ll be watching... p. 4 Calendar of upcoming releases... p. 5 Annex Economic tables... A1 Week in review CANADA: decreased for the first time in three months in
Saskatchewan 2018 Budget
 Sticking to the plan: On track for a surplus in 2019-20 Highlights Saskatchewan 2018 Budget Economics and Strategy April 10, 2018 Saskatchewan s 2017-18 deficit is now estimated at $595 million (0.8% of
Special Report. Reality check: Are Canadian households perched over a sinkhole?
 Reality check: Are Canadian households perched over a sinkhole? May 10, 2018 Reality check: Are Canadian households perched over a sinkhole? By Matthieu Arseneau There are widespread concerns about the
Table of Contents. Week in review. What we ll be watching... p. 4 Calendar of upcoming releases... p. 5 Annex Economic tables...
 May 11, 2018 Table of Contents What we ll be watching... p. 4 Calendar of upcoming releases... p. 5 Annex Economic tables... A1 Week in review CANADA: Canadian employment fell 1.1K in April according to
New Brunswick 2018 Budget
 New investments mean one year delay in return to balance Highlights New Brunswick 2018 Budget Economics and Strategy January 30, 2018 New Brunswick bettered its key fiscal targets in 2017-18 and by a non-trivial
Job creation surges in Canada By Stéfane Marion
 February 11, 19 Job creation surges in Canada By Stéfane Marion Canadian economic reports have now bettered expectations for almost eight consecutive weeks. As the chart below shows, Citi s index of economic
Special Report. Minimum wage: How much is too much? Economics and Strategy. Summary. Ontario goes for it
 Economics and Strategy September 27, 2017 Minimum wage: How much is too much? Summary In June the Ontario government announced its intention to raise the province s minimum wage by the most in 50 years:
Ontario Economic Outlook & Fiscal Review
 Ontario Economic Outlook & Fiscal Review Economics and Strategy November 15, 2018 First steps towards fiscal recovery with long-term plan to come 10 highlights from Ontario s 2018 Economic Outlook and
Table of Contents. Week in review. What we ll be watching... p. 3 Calendar of upcoming releases... p. 5 Annex Economic tables...
 February 10, 2017 Table of Contents What we ll be watching... p. 3 Calendar of upcoming releases... p. 5 Annex Economic tables... A1 annualized as gains in energy, metal ores, mineral products, forestry,
Highlights. Forecast dated January 5, United States. Canada. Paul-André Pinsonnault. January 2018
 Highlights January 1 Given our expectation of above-potential GDP growth in the U.S. and its already-low unemployment rate, we see CPI inflation ex food and energy accelerating to.3 in Q4 1. In our view,
Trade war = slower earnings growth
 Trade war = slower earnings growth June 18, 2018 China announced last Saturday that it would retaliate tit-for-tat (same amounts and same dates) if the U.S. follows through on its decision to impose tariffs
Public Sector Debt. Quick Hit Record net portfolio investment in January. FICC Strategy. Chart 2: Cheaper loonie attracts foreign buying
 1999 1 3 7 9 11 13 1 17 19 FICC Strategy Quick Hit Record net portfolio investment in January March 18, 19 - (Vol. III, No. 36) Foreign net buying of Canadian securities returned in January with a vengeance.
Table of Contents. Week in review. What we ll be watching... p. 5 Calendar of upcoming releases... p. 6 Annex Economic tables...
 June 1, 2018 Table of Contents What we ll be watching... p. 5 Calendar of upcoming releases... p. 6 Annex Economic tables... A1 Week in review CANADA: Real expanded at an annualized pace of just 1.3% in
Special Report. Where are we in the cycle? Economics and Strategy. What does the yield curve say? Summary. What are the probabilities of recession?
 Economics and Strategy May 18, 017 Where are we in the cycle? Summary The odds of a recession in Canada or the U.S. in the years ahead is a contentious question in the economic community and the media.
Highlights. Stéfane Marion Matthieu Arseneau December 2017
 December 217 Highlights The MSCI AC is on track to return more than 15% this year, the best showing in four years. Importantly, the equity rally remains fuelled by better-than-expected profits. As long
Earnings diffusion at a 2-year low
 Earnings diffusion at a 2-year low October 9, 2018 Global equities ended the first week of Q4 2018 on a negative note with the MSCI AC retreating 1.5%. Emerging markets were hit particularly hard with
What s next in the seemingly never-ending Brexit Saga? By Angelo Katsoras
 What s next in the seemingly never-ending Brexit Saga? By Angelo Katsoras March 11, 2019 Introduction When it comes to Brexit, the only certainty, it appears, is that there will be more uncertainty. Political
Quick Hit International securities transactions: A currency story
 Nov-16 Jan-17 Mar-17 May-17 Jul-17 Sep-17 Nov-17 Jan-18 Mar-18 May-18 Jul-18 Sep-18 Nov-18 22 23 24 25 26 27 28 29 21 211 212 213 214 215 216 217 218 FICC Strategy January 18, 219 - (Vol. III, No. 9) Quick
The behind the scenes struggle to choose the ECB's next leader By Angelo Katsoras
 The behind the scenes struggle to choose the ECB's next leader By Angelo Katsoras March 13, 2019 Europe s faltering economy and fractious politics, which limit the capacity of members to agree on important
Highlights. Stéfane Marion Matthieu Arseneau December 2018
 December 218 Highlights After a promising rebound in November, global equity markets fell back early in December. The outlook for earnings growth remains uncertain. The good news is that at the G2 meeting
Stock-bond correlations: Are we at an inflection point?
 Stock-bond correlations: Are we at an inflection point? Historical perspective December 4, 2018 The correlation between U.S. equity prices and U.S. Treasury yields has fluctuated significantly over the
Top Charts. Top Charts. Canada: Top charts to think about going into December 22, 2017
 Top Charts Canada: Top charts to think about going into 218 December 22, 21 1 Canada: Top charts to think about going into 218 The holiday season is upon us, promising, as every year, to bring its share
Q1/19
 Highlights May 2018 With the U.S. economic expansion still on track, we think the 10-year yield will drift to a new trading range slightly above 3. Though we recognize that the risks are skewed toward
Can the loonie make a comeback?
 Can the loonie make a comeback? December 217 Even considering the low rate of U.S. inflation, monetary policy in the world s largest economy is arguably too loose. It s the first time since the 197 s that
Public Sector Research
 Fixed Income Trading Desk Research Domestic Bond Tracker: Issuance patterns ever more entrenched Another month is in the books and when it comes to domestic supply patterns at least, certain themes are
Special Report. Reality check: Canadian exposure to U.S. protectionism
 Reality check: Canadian exposure to U.S. protectionism March 28, 2018 Reality check: Canadian exposure to U.S. protectionism Since his inauguration in January 2016, President Donald Trump has brought his
Public Sector Research
 Fixed Income Trading Desk Research Quick Hit GoC T-bills the ultimate fiscal shock absorber PLEASE SEE END OF DOCUMENT FOR IMPORTANT DISCLOSURES October 17, 17 - (Vol. 1, No. 53) The Government of Canada
IS IT TIME TO PULL BACK STIMULUS?
 August 1, 17 IS IT TIME TO PULL BACK STIMULUS? Summary Central bankers have shown over the years that there can indeed be too much of a good thing. Ultra-loose monetary policy stimulus may have been warranted
Public Sector Strategy
 KOR FRA Fixed Income Trading Desk Strategy Quick Hit The 2018 sovereign fiscal report card - (Vol. II, No. 33) The recently released IMF Fiscal Monitor provides a fresh set of metrics to gauge cross-country
Highlights. April 2016
 Highlights April 216 We are relieved that Beijing has veered away from currency devaluation in its effort to spur growth. The authorities announced a fiscal deficit of 3% of GDP for 216, up from 2.5% last
Rising EU-US trade tensions only add to Europe s challenges
 Rising EU-US trade tensions only add to Europe s challenges July 3, 2018 The EU is the latest region to be accused of unfair trade practices by the Trump administration. It is estimated that the EU has
Public Sector Strategy
 Fixed Income Trading Desk Strategy Quick Hit Refi recon PLEASE SEE END OF DOCUMENT FOR IMPORTANT DISCLOSURES January 23, 218 - (Vol. 2, No. 5) My strategy colleague, Connor Sedgewick, offered up some nice
Savaria Corporation. Q2/17 Results. Span contribution begins; guidance revised (unsurprisingly) upwards HIGHLIGHTS. The NBF Daily Bulletin
 upwards HIGHLIGHTS. The NBF Daily Bulletin") SIS (T) $15.06 Stock Rating: Outperform Target: $17.00 Risk Rating: Above Average Est. Total Return 14.6% Stock Data: 52-w eek High-Low $17.55 - $7.74 Bloomberg/Reuters SIS CN / SIS.TO Shares Outstanding
SIS (T) $15.06 Stock Rating: Outperform Target: $17.00 Risk Rating: Above Average Est. Total Return 14.6% Stock Data: 52-w eek High-Low $17.55 - $7.74 Bloomberg/Reuters SIS CN / SIS.TO Shares Outstanding
Dollarama Inc. Q4 F2017 Results. A straight-forward beat and other notable business updates HIGHLIGHTS. The NBF Daily Bulletin.
 DOL (T) $110.88 Stock Rating: Outperform (Unchanged) Target: $122.00 (Was $113.00) Risk Rating: Below Average (Unchanged) Est. Total Return: 10.4% Stock Data: 52-week High-Low (Canada) Bloomberg $104.94
Budget deficits and the U.S. dollar
 Budget deficits and the U.S. dollar March 218 The February announcement by Congress that it would increase government spending this year and next will prompt a temporary growth spurt in the U.S. but have
Economic outlook: Manitoba in the middle
 Economic outlook: Manitoba in the middle May 17, 2016 Douglas Porter, CFA Chief Economist, BMO Financial Group douglas.porter@bmo.com 416-359-4887 Please refer to the next page for Important Disclosures
Highlights. Change from Previous Forecast
 Highlights December 217 While not a blockbuster year, 217 was nonetheless encouraging on many fronts. The world s largest economy, the U.S., seemingly got back its mojo, while export powerhouses such as
Cyclical USD weakness
 May 215 Cyclical USD weakness The trade-weighted US dollar s impressive run ended with a nearly 2% decline in April, the worst monthly performance since September 213. Weaker than expected US economic
Highlights. Stéfane Marion Matthieu Arseneau January/February 2018
 January/February 218 Highlights After a spectacular 217 that saw global equities return more than 17.5, the MSCI All Country index has continued to do extremely well early in 218 with a gain of 5.7 year
Optimistic Fed supportive of USD
 Optimistic Fed supportive of USD August 218 The U.S. dollar s near term prospects remain good amidst a hot economy that is prompting the Fed to tighten monetary policy. The return of risk aversion in the
Ontario Economic Accounts
 SECOND QUARTER OF 2017 April, May, June Ontario Economic Accounts ONTARIO MINISTRY OF FINANCE Table of Contents ECONOMIC ACCOUNTS Highlights 1 Ontario s Economy Continues to Grow Expenditure Details 2
A rate hike for Christmas
 December 215 A rate hike for Christmas A December interest rate hike isn t fully priced-in by markets and as such there is upside potential for the USD if the FOMC delivers on its repeated warnings that
Canada s never-ending pipeline saga
 May 14, 2018 Canada s never-ending pipeline saga While the global media focuses on the mounting trade tensions between China and the United States, Canada is mired in its very own domestic trade war. This
2018Q1 2018Q2 2018Q3 2018Q4
 Feeding the beast November 2017 The U.S. economy is doing well enough to prompt the Federal Reserve to consider further tightening of monetary policy. A December rate hike is in the cards, assuming of
Q1/16
 Highlights May 1 We see U.S. economic growth accelerating to -plus in the second half of the year. Given that outlook, we continue to believe that by mid-september the FOMC will be confident enough of
Consumer Price Index report
 MBS Reports C o n s u m e r P r i c e I n d e x R e p o r t, J u l y 2 0 1 8 1 Consumer Price Index report J u l y 2 0 1 8 Highlights The Manitoba all-items Consumer Price Index (CPI) increased 3.3% on
Back in black and aiming to stay there
 Back in black and aiming to stay there By Catherine Maltais / Warren Lovely March 20, 2019 Highlights The summary deficit for the year ending March 31 is now estimated at $380 million (0.5% of GDP), a
Consumer Price Index. Highlights. Manitoba fourth highest among provinces. Consumer Price Index (CPI), Manitoba and Canada, November 2018
, Manitoba and Canada, November 2018") MBS Reports C o n s u m e r P r i c e I n d e x, N o v e m b e r 2 0 1 8 1 Consumer Price Index N o v e m b e r 2 0 1 8 Highlights The Manitoba all-items Consumer Price Index (CPI) increased 1.7% on a
MBS Reports C o n s u m e r P r i c e I n d e x, N o v e m b e r 2 0 1 8 1 Consumer Price Index N o v e m b e r 2 0 1 8 Highlights The Manitoba all-items Consumer Price Index (CPI) increased 1.7% on a
Crius Energy Trust. Resuming Coverage. USGE Provides Enhanced Footprint, Diversification & Cross-Sell Potential
 KWH.un (T) Stock Rating: Target: Risk Rating: Cdn$10.14 Outperform Cdn$13.00 Average Est. Total Return 35.9% Stock Data: Cash Yield 7.7% Implied Price Return 28.2% 52-w eek High-Low $11.32-$7.76 Bloomberg/Reuters:
May Highlights
 Highlights May 215 Global equities rose to another all-time high in April. Encouragingly, the gains have been widespread. All major regions show positive returns so far in 215. Markets where central banks
($000s) 1. (3rd quarter, 000s)
 1. (3rd quarter, 000s)") THE METRO BEAT TD Economics 213 ECONOMIC DEVELOPMENTS AT THE METRO LEVEL In this edition of the Metrobeat, we review the economic performance of Canada s main metros in 213. The big stories at the national
THE METRO BEAT TD Economics 213 ECONOMIC DEVELOPMENTS AT THE METRO LEVEL In this edition of the Metrobeat, we review the economic performance of Canada s main metros in 213. The big stories at the national
Consumer Price Index. Highlights. Manitoba third highest among provinces. Consumer Price Index (CPI), Manitoba and Canada, December 2018
, Manitoba and Canada, December 2018") MBS Reports C o n s u m e r P r i c e I n d e x, D e c e m b e r 2 0 1 8 1 Consumer Price Index D e c e m b e r 2 0 1 8 Highlights The Manitoba all-items Consumer Price Index (CPI) increased 2.1% on a
MBS Reports C o n s u m e r P r i c e I n d e x, D e c e m b e r 2 0 1 8 1 Consumer Price Index D e c e m b e r 2 0 1 8 Highlights The Manitoba all-items Consumer Price Index (CPI) increased 2.1% on a
Consumer Price Index. Highlights. Manitoba third highest among provinces. Consumer Price Index (CPI), Manitoba and Canada, September 2018
, Manitoba and Canada, September 2018") MBS Reports C o n s u m e r P r i c e I n d e x, S e p t e m b e r 2 0 1 8 1 Consumer Price Index S e p t e m b e r 2 0 1 8 Highlights The Manitoba all-items Consumer Price Index (CPI) increased 2.4% on
MBS Reports C o n s u m e r P r i c e I n d e x, S e p t e m b e r 2 0 1 8 1 Consumer Price Index S e p t e m b e r 2 0 1 8 Highlights The Manitoba all-items Consumer Price Index (CPI) increased 2.4% on
Highlights. Change from Previous Forecast
 Highlights February 18 A flying start to 18 puts the world economy on track to top last year s growth print of 3.7. Buoyed by tax cuts, the U.S. will be among the growth leaders within the OECD, while
Consumer Price Index. Highlights. Manitoba second highest among provinces. Consumer Price Index (CPI), Manitoba and Canada, February 2019
, Manitoba and Canada, February 2019") MBS Reports C o n s u m e r P r i c e I n d e x, F e b r u a r y 2 0 1 9 1 Consumer Price Index F e b r u a r y 2 0 1 9 Highlights The Manitoba all-items Consumer Price Index (CPI) increased % on a year-overyear
MBS Reports C o n s u m e r P r i c e I n d e x, F e b r u a r y 2 0 1 9 1 Consumer Price Index F e b r u a r y 2 0 1 9 Highlights The Manitoba all-items Consumer Price Index (CPI) increased % on a year-overyear
Highlights. Change from Previous Forecast
 Highlights January 19 The global economy s loss of momentum in the last quarter of 18 represents a poor handoff. That will penalize 19, the latter s GDP growth likely to be just below last year s estimated.
Consumer Price Index report
 MBS Reports C o n s u m e r P r i c e I n d e x R e p o r t, J u n e 2 0 1 8 1 Consumer Price Index report J u n e 2 0 1 8 Highlights The Manitoba all-items Consumer Price Index (CPI) rose 2.7% on a year-over-year
Consumer Price Index. Highlights. Manitoba second highest among provinces. MBS Reports C o n s u m e r P r i c e I n d e x, M a r c h
 MBS Reports C o n s u m e r P r i c e I n d e x, M a r c h 2 0 1 9 1 Consumer Price Index M a r c h 2 0 1 9 Highlights The Manitoba all-items Consumer Price Index (CPI) increased 2.3% on a year-overyear
World trade rises 5.3% in Q1 2010
 June 2010 TABLE OF CONTENTS World trade rises 5.3% in Q1 2010 1 Highlights 2 The Canadian economy 2 The U.S. economy 3 Oil prices tumble after US jobs report 4 Flight to quality hits Canadian dollar 4
Look to both coasts for the fastest growth in 2019
 Look to both coasts for the fastest growth in 2019 PROVINCIAL OUTLOOK March 2019 Canada s economy ended 2018 on a weak note, posting the slowest quarterly growth rate since mid-2016 and providing a soft
Highlights. Change from Previous Forecast
 Highlights May 18 The global economy continued to expand in the first quarter, albeit at a more moderate pace. The persistence of low inflation should limit the extent of monetary policy tightening by
Economic Spotlight June 20, 2009
 Economic Spotlight June 2, 29 Summary: Consumer Bankruptcy Deteriorating economic conditions, combined with rising unemployment and declining asset values, have caused a significant increase in consumer
Highlights By Krishen Rangasamy
 February 219 Highlights By Krishen Rangasamy With China and the Eurozone seemingly on the ropes, it s difficult to be optimistic about the global economy s performance this year. Fortunately, the persistence
Consumer Perspective: Industry Insights and Lending Dynamics. Matt Fabian Director, Research & Industry Analysis
 Consumer Perspective: Industry Insights and Lending Dynamics Matt Fabian Director, Research & Industry Analysis Agenda 1 Context A summary of economic trends 2 An overall perspective on the Canadian consumer
MLS Sales vs. Listings (seasonaly adjusted)
") QUARTER 4: Canada Guaranty Housing Market Review OCTOBER - DECEMBER 21 The Canadian economy posted positive indicators of growth in early 21; however, the optimistic sentiment deteriorated in the latter
QUARTER 4: Canada Guaranty Housing Market Review OCTOBER - DECEMBER 21 The Canadian economy posted positive indicators of growth in early 21; however, the optimistic sentiment deteriorated in the latter
CANADIAN MANUFACTURERS & EXPORTERS BUSINESS CONDITIONS SURVEY
 CANADIAN MANUFACTURERS & EXPORTERS BUSINESS CONDITIONS SURVEY August 2009 CME Business Conditions Survey August 2009 CME, in partnership with member associations of the Canadian Manufacturing Coalition,
Week in review. What we ll be watching (p. 3) Calendar of upcoming releases (p. 5) Annex Economic tables (A1) January 13, 2017
 Calendar of upcoming releases (p. 5) Annex Economic tables (A1) January 13, 2017") What we ll be watching (p. 3) Calendar of upcoming releases (p. 5) Annex Economic tables (A1) Week in review Canada In December, the Teranet National Bank National Composite House Price Index rose 0.3%
What we ll be watching (p. 3) Calendar of upcoming releases (p. 5) Annex Economic tables (A1) Week in review Canada In December, the Teranet National Bank National Composite House Price Index rose 0.3%
Economic diversification & long-term deficit reduction in focus
 March 22, 2018 Economic diversification & long-term deficit reduction in focus Highlights Alberta 2018 Budget Economics and Strategy After a couple of very tough years, Alberta s economy regained important
Public Sector Strategy
 Fixed Income Trading Desk Strategy August 15, 218 - (Vol. II, No. 6) Quick Hit The government sector s heavy economic footprint If Friday s jobs report is to be believed, Canada has become increasing reliant
LETTER. economic. Slowdown in international trade: has interprovincial trade made up for it? DECEMBER bdc.ca
 economic LETTER DECEMBER Slowdown in international trade: has interprovincial trade made up for it? Canada has always been a country open to the world, but it has become increasingly so over the years.
LETTER. economic. Canada and the global financial crisis SEPTEMBER bdc.ca
 economic LETTER SEPTEMBER Canada and the global financial crisis In the wake of the financial crisis that shook the world in and and triggered a serious global recession, the G-2 countries put forward
Some provinces now face the downside of tight labour markets
 PROVINCIAL OUTLOOK September 12, 218 Some provinces now face the downside of tight labour markets When it comes to the labour market, things haven t been any better for a generation in Canada. This is
GLOBAL ECONOMICS GLOBAL AUTO REPORT
 Rising Gasoline Prices A Minor Setback For Consumer Spending GLOBAL PURCHASES ACCELERATE IN APRIL Global auto sales gained significant momentum in April. Volume growth accelerated in most regions and sales
GLOBAL ECONOMICS GLOBAL AUTO REPORT
 North American Auto Production Begins To Rebound CONTACTS Global sales gains moderate as purchases decline temporarily in Asia. US inventories fall below a year earlier, setting the stage for a rebound
Federal 2018 Fall Economic Statement
 November 21, 2018 Business tax relief delivered, resulting in a bit of extra red ink Highlights Federal 2018 Fall Economic Statement Economics and Strategy Ottawa s fall fiscal update took some non-trivial
The story behind China s crackdown on outbound investments
 October 4, 2017 The story behind China s crackdown on outbound investments Introduction China considers its foreign exchange reserves to be a vital shield against potential economic headwinds. This is
January 11, Special Report. Is Canada s household leverage too high or on the low side? Economics and Strategy
 January 11, 2018 Special Report Is Canada s household leverage too high or on the low side? Economics and Strategy Is Canada s household leverage too high or on the low side? Household debt in Canada is
Business Barometer Newfoundland & Labrador
 Newfoundland & Labrador July Business optimism in Newfoundland & Labrador has bounced up slightly. The July Business Barometer gained almost three points and reached 2.9 still below the national average
It s fun to stay in the USMCA
 It s fun to stay in the USMCA October 2018 After months of negotiations, Canada finally agreed to a revamped trade deal with the U.S. and Mexico. The United States-Mexico-Canada Agreement (USMCA for short)
The impossible trinity
 February 216 The impossible trinity China is learning, the hard way, about the impossible trinity. You just cannot have free capital flows, a fixed exchange rate and independent monetary policy all at
North American Economic Outlook: Will the Recovery Be Sustained? U.S. Economic Outlook:
 ECONOMICS I RESEARCH North American Economic Outlook: Will the Recovery Be Sustained? Presentation to the Canadian Association of Movers 11 Annual Conference Paul Ferley(1) 97-71 Assistant Chief Economist
In-Depth Housing Analysis for Canada, the Provinces, and Nine Metropolitan Areas. Metropolitan Housing Outlook Spring 2012
 Metropolitan Housing Outlook Spring 212 In-Depth Housing Analysis for Canada, the Provinces, and Nine Metropolitan Areas ECONOMIC PERFORMANCE AND TRENDS Metropolitan Housing Outlook: In-Depth Housing Analysis
2. Full-time staffing intentions, next 3 months 3. General state of business health. * 12-month moving averages. * 12-month moving averages.
 Newfoundland & Labrador March After two months of improved optimism, Newfoundland & Labrador's small businesses have seen a less confident month of March. The Business Barometer lost almost 4 points to
GLOBAL ECONOMICS GLOBAL AUTO REPORT
 Canadian Auto Sales Expected to Total Million Units in 1 BEST BACK-TO-BACK ANNUAL TOTAL ON RECORD, EVEN AS SALES IN ONTARIO DECLINE 3% Canadian passenger vehicle sales exceeded mn units for the first time
GLOBAL ECONOMICS INSIGHTS & VIEWS
 May, 1 Tracking the Early Impact of the Minimum Wage Increase in Ontario (May 1 Update) EMPLOYMENT IMPACT APPEARS MODEST SO FAR, BUT EMPLOYEE EARNINGS AND WAGES RISING QUICKLY CONTACTS Juan Manuel Herrera
Canada s Economy Strengthens
 Dr. Sherry Cooper Chief Economist Dominion Lending Centres The Title of the presentation Second line if needed Third line if needed Canada s Economy Strengthens Today s date Location of presentation June
What s Hot & What s Not
 What s Hot & What s Not Warren Jestin SVP & Chief Economist Vancouver Real Estate Forum April 25, 27 The Economic Landscape is Shifting Global Growth Moves East 11 1 9 8 7 6 5 4 3 2 1 annual average %
HOUSING MARKET OUTLOOK Canada Edition
 H o u s i n g M a r k e t I n f o r m a t i o n HOUSING MARKET OUTLOOK Canada Edition C a n a d a M o r t g a g e a n d H o u s i n g C o r p o r a t i o n Date Released: Fourth Quarter 2010 Canada s Housing
British Columbia 2018 Budget
 February 20, 2018 BC stays in balance with ample padding, focuses on affordability Highlights British Columbia 2018 Budget Economics and Strategy British Columbia s minority NDP government has been plenty
The Economic & Financial Outlook
 The Economic & Financial Outlook Beata Caranci SVP & Chief Economist TD Economics September 217 Key Themes Synchronized global economic acceleration has put monetary policy normalization in focus Canada
GLOBAL ECONOMICS INSIGHTS & VIEWS
 Tracking the Early Impact of the Minimum Wage Increase in Ontario (April 18 Update) MIXED EVIDENCE OF MINIMUM WAGE MARK ON EMPLOYMENT SO FAR, BUT WAGES AND PRICES REACT CONTACTS Juan Manuel Herrera 16.866.6781
Household Credit Analysis
 Household Credit Analysis March 26, 28 Economics & Strategy Jeffrey Rubin (416) 594-7357 jeff.rubin@cibc.ca Avery Shenfeld (416) 594-7356 avery.shenfeld@cibc.ca Benjamin Tal (416) 956-3698 benjamin.tal@cibc.ca
HOUSING MARKET OUTLOOK Canada Edition
 H o u s i n g M a r k e t I n f o r m a t i o n HOUSING MARKET OUTLOOK Canada Edition C a n a d a M o r t g a g e a n d H o u s i n g C o r p o r a t i o n Date Released: Third Quarter 2011 Canada s Housing
Trends in Labour Productivity in Alberta
 Trends in Labour Productivity in Alberta July 2012 -2- Introduction Labour productivity is the single most important determinant in maintaining and enhancing sustained prosperity 1. Higher productivity
The real change in private inventories added 0.22 percentage points to the second quarter GDP growth, after subtracting 0.65% in the first quarter.
 QIRGRETA Monthly Macroeconomic Commentary United States The U.S. economy bounced back in the second quarter of 2007, growing at the fastest pace in more than a year. According the final estimates released
Global PMI. Global economy buoyed by rising US strength. June 12 th IHS Markit. All Rights Reserved.
 Global PMI Global economy buoyed by rising US strength June 12 th 2018 2 Global PMI rises but also brings signs of slower future growth At 54.0 in May, the headline JPMorgan Global Composite PMI, compiled
GLOBAL ECONOMICS GLOBAL AUTO REPORT
 Ninth Consecutive Global Sales Record Expected in 1 Stronger economic growth and replacement demand are expected to drive sales higher in North America and Western Europe. CONTACTS Carlos Gomes 1..73 Scotiabank
GLOBAL ECONOMICS GLOBAL AUTO REPORT
 Improving US Household and Business Fundamentals Point to Higher Sales Ahead Emerging markets drive global sales gains, amid temporary US weakness. CONTACTS Carlos Gomes 1..73 Scotiabank Economics carlos.gomes@scotiabank.com