Honda Information Meeting 2012 Autumn. Honda FY2011 Rating Review
|
|
|
- Anissa Oliver
- 6 years ago
- Views:
Transcription


1 Honda Information Meeting 212 Autumn Honda FY211 Rating Review 1 1
2 Honda Information Meeting Honda FY211 Rating Review Current Honda Business Business Strategy Automobile Business Motorcycle Business FY13b Q2 Financial Highlights 2
3 Profit Structure and Strong Recoveries including FY13 Forecast 14 Despite the Profit continued structure negative and Strong impact Recovery of the strong in FY13 yen, Honda forecasts a strong recovery in FY ,2 7 (billion) USD/JPY O/P margin 12% 1, % 6.2% 9.% 9.1% 7.4% 7.3% 8.8% 7.7% 7.9% 4.2% 6.5% Earthquake Flood 5.3% 1% 8% 6% Automobile Motorcycle FY FY1 FY2 FY3 FY4 FY5 FY6 FY7 FY8 FY9 FY1 FY11 FY12 FY13 1.9% Finance FY12 2.9% 4% 2% % -2% 3


4 Honda Business Update Strong recovery of operating profit for FY13 Yen (billions) Top-line growth and cost reduction Unit Sales mil (33% increase) Operating income 231 FOREX impact approx. -45 R&D cost increase approx. -35 approx. 369 Operating income 52 FY12 FY13 (as of Oct. 29) 4
5 Honda Information Meeting Honda FY211 Rating Review Current Honda Business Business Strategy Automobile Business Motorcycle business FY13 Q2 Financial Highlights 5
6 Honda Automobile Business Global 4 pillar models form core of competitiveness and efficiency Unit: thousands Unit Sales of Honda s Global 4 Pillar Models CY Global 4 ratio % 535 Total 3,95 thousand units Others Fit/Jazz/City CR-V 1 Civic 5 Accord
")

 Thailand (May) Jan 212 1.")
 Annual Civic Sales in Asia 211 approx.")
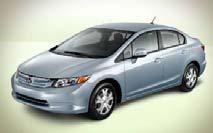
7 Civic U.S. 4, Civic MMC within 212 to Improve Marketability 3, ( Sales unit s) Earthquake Big MMC 212 2, 1, May Jun Jul Aug Sep Oct Nov Dec Jan 12 Feb Mar April May Jun July Aug Sep Oct Nov Dec Europe Introduce New Diesel engine Asia New Civic launch in Asia including China China (Oct ) Thailand (May) Jan L New Diesel from 213 Lightweight (industry top-class) Reduces CO2 output by over 15% (95g/km) Annual Civic Sales in Asia 211 approx. approx. 17K 17K units units Indonesia (Jun) Taiwan (Jun) Vietnam (Jul) Malaysia (Jul) Pakistan (Sep) 212 7


 Annual CR-V Sales in Asia approx.")
8 CR-V がすごいという絵 CR-V 4, U.S. 3, CR-V Production increase in Canada from 213 Monthly record sales continue despite low inventory ( Sales unit ) 2, 6 days 1, Inventory 213 Model Jan 11 Feb Mar Apr May Jun Jul Aug Sep Oct Nov Dec Jan 12 Feb Mar April May Jun July Aug Sep Oct Nov Dec Europe Asia New CR-V and New Diesel in Europe New CR-V launch in Asia including China Sep 212 Autumn 213 New 1.6L Diesel China (March) Annual CR-V Sales in Asia approx. approx. 24K 24K units units Thailand (Sep) Indonesia (Sep) Australia (Oct) Vietnam Malaysia The Philippines 212 8


9 Accord 9 th generation Accord Debut in Sep, 212 Class-leading fuel economy and innovative safety technology Innovative safety technology Forward Collision Warning (FCW) Lane Departure Warning (LDW) LaneWatch blind spot display Four all-new power trains -Earth Dreams 2.4L DOHC L4 DI engine with new CVT or 6MT 27 city /36 highway from $21,68-3.5L SOHC V6 engine with VCM (Variable Cylinder Management system), 6AT 21 city /34 highway from $3,7 -Two-motor gasoline-electric plug-in hybrid system from Beginning of 213 -Two-motor gasoline-electric hybrid system within 213 Accord PHEV 9


10 Fit / Jazz / City Fit / Jazz / City historical sales by region 1,, 8, 1st generation 2nd generation 6, 4, Overseas 2, Japan Next generation Fit FY2 FY3 FY4 FY5 FY6 FY7 FY8 FY9 FY1 FY11 FY12 FY13 All-new Fit series will be introduced starting in 213 Fit City SUV Roll-out of Fit (Jazz), City and a new small SUV model within 2 years 1
11 Global Operation Reform Concurrent development in all six regions Japan, North America, South America, Europe, China, Asia Introduction of the same model in all regions Simultaneous large volume production Significant cost reduction through global sourcing Adoption of locally optimized design Improvement of production efficiency Respond to the voice of local customers Utilize more local suppliers Dedicating new plants to small-sized vehicles Yorii Plant in Japan ( July 213 ) Mexico factory ( Spring 214 ) Global operation reform to be implemented beginning with all-new Fit series 11
12 Honda Information Meeting Honda FY211 Rating Review Current Honda Business Business Strategy Automobile Business - Business expansion Motorcycle business FY13 Q2 Financial Highlights 12
13 Global Automobile Production Capacity (Unit : 1,) +44 5,85 5, +1 4, , , Other 4, k Increase capacity in in Dongfeng Honda, China k Increase capacity in in Dongfeng Honda, China k Increase capacity in in Guanqi Honda, China 1,1 75 China Asia 3, k In Malaysia k In Indonesia 3 Europe 2, +9k 1,63 1,63 1,72 Increase capacity at Alabama and Indiana plant +2k New plant in in Mexico starts-up in in 214 1,92 North America 1, End of Start-up 1, 1, of Yorii Plant 1, 1, +α +α +α +α Japan Capacity increase to 5 mil 13
 Ohio Ohio")


 Mexico Total Production Capacity")


14 Automobile Production in North America Capacity: 68k (MAP 44k / ELP 24k) Ohio Ohio Model Allocation New CR-V production from 212 MDX to shift to Alabama in 213 Canada Capacity: 39k Capacity Expansion New plant start-up in the spring of 214 with capacity of 2k units Capacity: Existing 6k / New 2k (Total 26k) Mexico Total Production Capacity Current 1.63mil 1.92mil in 214 More than 9% of the vehicles sold in the U.S. will be produced in North America in the coming years Production Increase Indiana Increase annual capacity by 5k in early 213 Model Allocation Capacity: 2k 25k Alabama MDX to be shifted from Canada in 213 Capacity: 3k 34k 14


 ( Jul 212 )")
 ( Nov 212 )")


")
15 Small vehicle strategy in Japan New Models Launch derivative models from 1 platform to enhance product lineup efficiency 1Platform N Box N Box+ 5 derivative models planned by 215 Sports model N Box Custom ( Dec 211 ) ( Jul 212 ) N One 214 ( Dec 211 ) ( Nov 212 ) Launch all-new Fit Series from 213 Fit City SUV 118 thousand cumulative sales in 1H FY13 N Box Custom No.1 sales in mini vehicle segment N Box N Box+ Total Sales of Mini vehicles Unit (thousands) % 356 FY12 FY13 15


 Taiwan 3k Diesel Engine India (213~)")


 between their respective countries.")
16 Asia Grow through introduction of Fit series / Brio series Launch of diesel engine in India market (213~) Strengthen mutually complementary production structure Pakistan 5k Production Capacity 575K 765K (214~) Taiwan 3k Diesel Engine India (213~) India 12K MPV (213~) 1K Jazz (IMA) 24K 5KI Malaysia Thailand Indonesia Vietnam 1k Philippines 15k Civic Accord Fit Fit series Fit Brio series City SUV Freed 6K Thailand, Indonesia, India and Malaysia to efficiently produce and mutually complement lineups of unique products (such as IMA and MPV) between their respective countries. 2K (214~) Brio Sedan MPV 16
17 Honda Information Meeting Honda FY211 Rating Review Current Honda Business Business Strategy Automobile Business - Core technologies Motorcycle business FY13 Q2 Financial Highlights 17


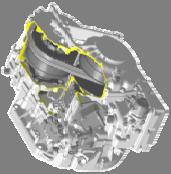
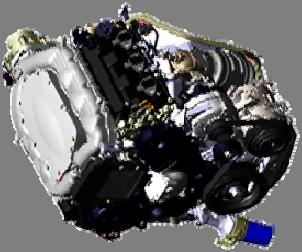
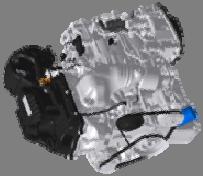

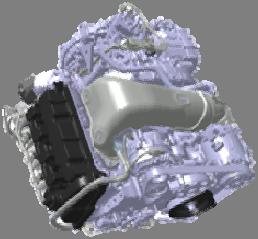


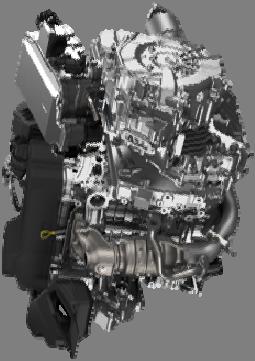
18 Earth Dreams Technology Honda will introduce new engines and new transmissions into all categories Wide range of new gasoline engines New CVT transmissions 1.5L class engine 1.8L class engine 2.4L class engine 3.5L class V6 engine Minivehicle Minivehicle Compact vehicle Mid-sized vehicle New 2.4L Direct Injection + CVT New 66cc New 3.5L DI New L New L N Box Accord RLX CY ~ 18


19 Earth Dreams Technology Enhance Hybrid Line-up Next-generation IMA INTEGRATED MOTOR ASSIST One-Motor Hybrid system Fit 213~ Civic Hybrid CR-Z Fit/Jazz Hybrid Freed / Spike Hybrid Acura ILX Hybrid Two-Motor hybrid system for mid-to-large sized vehicles Plug-in Hybrid Beg of 212 Fit Shuttle Hybrid Accord Hybrid Honda Hybrid ratio in Japan Three-Motor Sports Hybrid SH-AWD system for Acura models RLX (concept) NSX (concept) FY11 Q1 Q2 Q3 Q4 FY12 Q1 Q2 Q3 Q4 FY13 Q1 Q
20 Honda Information Meeting Honda FY211 Rating Review Current Honda Business Business Strategy Automobile business Motorcycle Business FY13 Q2 Financial Highlights 2
21 Production Capacity Capacity in Asia to reach approx. 15 mil as of 213 from current 12.1 mil Total Capacity in ASEAN countries, India and Pakistan Unit (millions) % approx. 15. Current 213 India Vietnam Indonesia +26% % % Current 213 Current 213 Current
22 Honda s Current Share and Market Size Thailand 2 million 69% Vietnam 3 million 61% India 13 million Indonesia 52% 8 14% million Brazil 2 million 22% (for month of Sep 212) 59% (for month of Sep 212) 82% 22
23 Motorcycle Demand in India 25 Forecast of Significant Increase in Demand Unit (millions) 2 15 India 1 5 CY Motorcycle India Market Penetration Ratio India 6.% Significant Growth Expected 1,18 Indonesia 2.8% 231 Brazil Vietnam Thailand Taiw an 7.6% 29.6% 25.4% Number of motorcycles Population India -Population continues to increase -Current penetration: ONLY 6% Huge Potential 62.4% 22 (millions) 23


 214(P) Product Line-up Expand")


24 Motorcycle Production Capacity Expansion in India Rajasthan 2 nd plant Bangalore 3 rd plant Manesar 1 st plant Expansion Plan Annual Capacity : 2.2 mil 2 nd 1 st 3 rd 4.mil Over 4 mil 2.8mil mil Future Honda Growth (P) 213(P) 214(P) Product Line-up Expand capacity to meet growing demand Introduce new 11cc models Starting with Dream Yuga, Honda will introduce new 11cc models Improve fuel economy of scooter models 11cc AT-Scooter Activa Launch New 11cc Motorcycles Dream Yuga 213 ~ 24
")


25 Mid-term Plan Unit (thousands) 4, Expand the joy of ownership to more than 39 million customers worldwide annually 39 mil 8 mil 3, 25.9 mil 6.2 mil 2, Power Products 25 mil 11.5 mil 1, 3.8 mil Motorcycle 15.6 mil 5.1 mil 2.5 mil Automobile 4.1 mil FY1 FY2 FY3 FY4 FY5 FY6 FY7 FY8 FY9 FY1 FY11 FY12 FY13 6 mil FY17 25
26 Honda Information Meeting Honda FY211 Rating Review Current Honda Business Business strategy Automobile business Motorcycle business FY13 Q2 Financial Highlights 26
27 Outline of FY13 2nd Quarter Financial Results (Consolidated) Honda Group Unit Sales (Consolidated Unit Sales) (thousand) Motorcycles Automobiles Power Products EPS attributable to Honda Motor Co., Ltd. (Yen) 2Q Results (Three Months) FY12 FY13 Change 3,811 (2,187) 678 (571) 1,276 (1,276) 3,879 (2,377) 996 (816) 1,288 (1,288) + 1.8% (+ 8.7%) % (+ 42.9%) +.9% (+.9%) Financial 2Q Results (Three Months) results Yen (billion) FY12 FY13 Change Net sales & other operating revenue 1, , % Operating income % Income before income taxes % Equity in income of affiliates Net income attributable to Honda Motor Co., Ltd. Note : Shares which are based on calculation of EPS Average Rates (Yen) approx. 1,82,3, shares (weighted average number of shares outstanding ) % % approx. 1,82,299, shares (weighted average number of shares outstanding ) US Dollar Euro Yen down by 1 yen Yen up by 11 yen Financial Summary Since the earthquake, a recovery led by N.A. and Japan along with new model offerings resulted in an increase in auto sales; an increase in India brought higher motorcycle sales. Year on year operating income rose 92.1%, to 1.8 billion. Financial Highlights Honda Group Unit Sales Motorcycle: Increased in Asia Automobiles: Increased in all regions Power Products: Increased in Asia and Other regions Net Sales and Operating Revenue -Recovery from the earthquake and new model introductions led to an increase for automobile business operations -Currency fluctuations had a negative impact Operating Income Positive Factors - Positive change in sales volume and model mix - Cost reduction efforts Negative Factors - Increased SG&A expenses - Increase in R&D expenses - Currency fluctuation impact 27
28 Change in Income before Income Taxes <FY13 2nd Quarter> Income before Income taxes ( % ) Operating Income ( % ) Other Income & Expenses Yen (billion) Cost Reduction, etc. Increase in SG&A Increase in R&D Currency Effects Unrealized gains and losses related to derivative instruments (Exhibit 2) Others Revenue, model mix, etc. <Decrease Factors> - Increased sales promotion and advertisement expenses, - Increased quality-related expenses, etc.. <Increase Factors> - Decreased fixed cost per unit due to increased production - Cost reduction effort, etc. Operating Income 52.5 FY12 2Q <Increase Factors> -Increase in unit sales and model mix, etc. <Decrease Factors> - Increased sales incentives, etc. - Currency effect due to difference between average sales rates and transaction rates: -.8 -Others +2.6 Operating Income 1.8 FY13 2Q *Please refer to Exhibit 1 regarding currency effects 28
29 Operations by Business Segment 7 Yen (billions) Motorcycle Business =Operating Income =Operating Margin 22% % 13.6% 17% 3 1.5% 9.7% 8.5% 11.9% 11.6% 8.3% 7.9% 7.4% 9.8% 9.6% 9.6% 8.4% 5.8% 1.9% 8.5% 1.6% 9.2% 8.2% 12% 7% 1 3.7% 2.2% 3.4% % -1 FY7 3Q 4Q FY8 2Q 3Q 4Q FY9 2Q 3Q -1.% 4Q FY1 2Q 3Q 4Q FY11 2Q 3Q 4Q FY12 2Q 3Q 4Q FY13 2Q -3% Yen (billions) Automobile Business =Operating Income 3 =Operating Margin 25% 2 15% 1 9.%9.% 7.1% 6.5% 6.4% 6.7% 3.6% 3.4% 3.6% % -1.4% 6.3% % % 5.% 4.2% 5.3% 2.4% 2.1% % -1.2% -2.2% 5% -5% % -2-15% -21.2% -3 FY7 3Q 4Q FY8 2Q 3Q 4Q FY9 2Q 3Q 4Q FY1 2Q 3Q 4Q FY11 2Q 3Q 4Q FY12 2Q 3Q 4Q FY13 2Q -25% 29
30 Operations by Business Segment 2 Yen (billions) Power Product & Other Businesses =Operating Income =Operating Margin 15% 9.9% 1% 6.9% 5.8% 6.6% 4.2% 2.3% 5% % -.9% -3.5% -8.1% -6.4% -4.% % -.4% -3.7% -2.8%-2.8% % -.2% -2.7% -3.2% -3.3%.1% % -5% -1% -2 FY7 3Q 4Q FY8 2Q 3Q 4Q FY9-15.% 2Q 3Q 4Q FY1 2Q 3Q 4Q FY11 2Q 3Q 4Q FY12 2Q 3Q 4Q FY13 2Q -15% *Honda Trading related out-of-period adjustment is not included 8 Yen (billions) Financial Services Business 38.7% 4% % 34.6% 26.4% 21.3% 22.1% 34.8% 29.4% 29.8% 32.% 35.8% 32.9% 32.% 28.8% 33.2% 29.5% 27.4% 3.5% 28.7% 3% % 19.2% 14.9% 13.1% 2% 2 6.5% 1% FY7 3Q Q FY8 2Q 3Q 4Q FY9 2Q 3Q 4Q FY1 2Q 3Q 4Q FY11 2Q 3Q 4Q FY12 2Q 3Q 4Q FY13 2Q % 3
31 Operations by Region Yen (billions) 6.1% 7.5% 9.5% 4.3% North America 6.3% 1.6% 5.7% % 1.8% 9.7% 8.9% 7.4% 5.3% % =Operating Income =Operating Margin 2.5% 2.5% 6.% 7.6% 6.8% 6.8% 2.5% % 1% 6% 2% -2% % -6% -1% -14% -15 FY8 2Q 3Q 4Q FY9 2Q 3Q 4Q FY1 2Q 3Q 4Q FY11 2Q 3Q 4Q FY12 2Q 3Q 4Q FY13 2Q -18% 1 Yen (billions) Japan =Operating Income =Operating Margin 12% % 6.% 4.5% 3.4% 3.3% 1.2% % % % -3.2% -6.% 5.8% % 1.7% % -7.3% % -4.8% 1.2% 6.1% 3.2% % % -6% -1-12% % -23.8% -2 FY8 2Q 3Q 4Q FY9 2Q 3Q 4Q FY1 2Q 3Q 4Q FY11 2Q 3Q 4Q FY12 2Q 3Q 4Q FY13 2Q -24% 31
32 Operations by Region 25 Yen (billions) Europe =Operating Income 1% =Operating Margin % 3.1% 4.3% 2.4% 5% % 1.6% % %.8% 1.7.9% 2.1% % -3.7% -1.9% % % % -2.8% -3.2% -1.% % -6.% % -5% -15 FY8 2Q 3Q 4Q FY9 2Q 3Q 4Q FY1 2Q 3Q 4Q FY11 2Q 3Q 4Q FY12 2Q 3Q 4Q FY13 2Q -1% % Yen (billions) 9.3% 8.% 5.3% Asia excluding Japan 8.6% 8.4% 7.4% 6.5% 6.3% 8.8% 7.% 9.4% 8.5% 8.% =Operating Income =Operating Margin 6.7% 6.8% 5.4% 4.2% 4.2% 6.7% 6.2% 1% 8% 6% 3 4% 2 2% 1 1.3% FY8 2Q 3Q 4Q FY9 2Q 3Q 4Q FY Q 3Q 4Q FY Q 3Q 4Q FY12 2Q 3Q 4Q FY13 2Q % 32
33 Operations by Region Yen (billions) Other Regions =Operating Income =Operating Margin % 14.% 13.8% 15% % 11.3% 11.2% 1.4% 4.1% 4.4% 7.5% 7.2% 8.6% 8.4% 6.6% 6.8% 5.% 9.4% 6.1% 5.6% 4.6% 12% 9% 6% 2 3% % % % -1 FY8 2Q 3Q 4Q FY9 2Q 3Q 4Q FY1 2Q 3Q 4Q FY11 2Q 3Q 4Q FY12 2Q 3Q 4Q FY13 2Q -3% 33
34 FY13 Financial Forecasts (Consolidated) Yen (billion) FY12 Results FY13 Forecasts Change amount % Change from previous forecasts as of Apr. 27 Net sales & other operating revenue 7,948. 9,8. + 1, % Operating income % Income before income taxes % Equity in income of affiliates % Net income attributable to Honda Motor Co., Ltd % EPS attributable to Honda Motor Co., Ltd. (Yen) Note : Shares which are based on calculation of EPS approx. 1,82,3, shares (weighted average number of shares outstanding ) approx. 1,82,299, shares (weighted average number of shares outstanding ) Average Rates (Yen) US Dollar 79 8 (1H 79 / 2H 8) Yen down by 1 yen - Euro (1H 11 / 2H 15) Yen up by 5 yen Yen up by 2 yen 34
35 Guidance: Units Sales by Business Segment Motorcycles Automobiles Power Products Unit (thousand) 2, -1,4 ( % ) 5, -18 ( % ) 8, -8 ( % ) "Honda Group Unit Sales" 15, 1, 15,61 2,31 16,6 2,8 15,56 1,84 4, 3, 3, ,3 31 1, , , , 4, 5, ,472 6,3 65 1,67 6,22 55 Other Regions Asia 1,67 12,412 13,82 13,55 2, 158 1,121 1,15 1,45 Europe 1,74 1,74 5, 1, 1,323 2, 2,314 2,52 North 2,63 America FY FY13 Previous Forecasts FY13 Revised Forecasts 588 FY12 71 FY13 Previous Forecasts 71 FY13 Revised Forecasts 392 FY FY13 Previous Forecasts 325 Japan FY13 Revised Forecasts Motorcycles Automobiles Power Products Unit (thousand) 12, -28 ( % ) 4, -5 ( % ) 8, -8 ( % ) "Consolidated Unit Sales" 9, 6, 8,65 2,31 9,9 2,8 9,62 1,84 3,5 3, 2,5 2, 2, , , , 6, 5, 4, 5, ,472 6,3 65 1,67 6,22 55 Other Regions 1,67 Asia 6,1 7,12 7,115 1,5 1,323 1,74 1,74 3, 1,121 1,15 1,45 Europe 3, 1, 2, 2,314 2,52 2,63North America FY FY13 Previous Forecasts FY13 Revised Forecasts 5 58 FY12 7 FY13 Previous Forecasts 7 FY13 Revised Forecasts 1, 392 FY FY13 Previous Forecasts Japan 325 FY13 Revised Forecasts 35
36 Forecast: Change in Income before Income Taxes Income before Income taxes ( % ) Yen (billions) Operating Income ( % ) * * Other Income & Expenses Cost Reduction, etc. increase in SG&A * -45. Increase in R&D Currency Effect Unrealized gains and losses related to derivative instruments Others 54. Revenue, model mix, etc. * The impact of the change in depreciation method which is anticipated to cause a decrease in depreciation expense by approximately JPY 4. billion in total, is included. Operating Income Operating Income 52. FY12 FY13 Revised Forecasts 36
37 Forecast: Change in Income before Income Taxes Income before Income taxes ( % ) Yen (billions) Operating Income - 1. ( % ) Other Income & Expenses Revenue, model mix, etc Cost Reduction, etc ± -45. Decrease in SG&A R&D Currency Effect Unrealized gains and losses related to derivative instruments Others 54. Operating Income 62. Operating Income 52. FY13 Previous Forecast FY13 Revised Forecasts 37
38 Forecast: Capital Expenditures, Depreciation, R&D Expenses Yen (billions) FY12 Results FY13 Revised Forecasts Change Change from previous forecast Capital expenditures Depreciation and Amortization * * ** R&D expenses * Capital expenditures in results and the forecast aforementioned exclude investment in operating leases and acquisition of intangible assets. * Depreciation and amortization in results and the forecast aforementioned exclude depreciation of investment in operating leases and amortization of intangible assets. ** Honda changed to the straight line method effective from April 212 for the depreciation method. 38
39 Dividend (Yen) Dividend per share FY12 Results FY13 Results & Projection Increase / Decrease from FY12 1 st quarter End nd quarter End rd quarter End 15 ( 19 ) ( + 4 ) 4 th quarter End 15 ( 19 ) ( + 4 ) Fiscal Year 6 ( 76 ) ( + 16 ) 39
40 Caution with Respect to Forward-Looking Statements: This slide contains forward-looking statements about the performance of Honda, which are based on management s assumptions and beliefs taking into account information currently available to it. Therefore, please be advised that Honda s actual results could differ materially from those described in these forward-looking statements as a result of numerous factors, including general economic conditions in Honda s principal markets and foreign exchange rates between the Japanese yen and the U.S. dollar, the Euro and other major currencies, as well as other factors detailed from time to time. Accounting standards: Our consolidated financial standards are prepared in conformity with U.S. generally accepted accounting principles. Notice on the Factors for Increases and Decreases in Income: With respect to the discussion above of the change in operating income, management has identified the factors set forth below and used what it believes to be a reasonable method to analyze the respective changes in such factors. Each of these factors is explained below. Management has analyzed changes in these factors at the levels of the Company and its material consolidated subsidiaries. (1) Foreign currency effects consist of translation adjustments, which come from the translation of the currency of foreign subsidiaries financial statements into Japanese Yen, and foreign currency adjustments, which result from foreign-currency-denominated sales, which, at the levels of the Company and those consolidated subsidiaries which have been analyzed, primarily relate to the following currencies: U.S. dollar, Canada dollar, Euro, GBP, BRL and Japanese Yen. (2) With respect to cost reduction and effects of raw material cost fluctuations, management has analyzed cost reduction and effects of raw material cost fluctuations at the levels of the Company and its material foreign manufacturing subsidiaries in North America, Europe and other regions. (3) With respect to changes in net sales and model mix, management has analyzed changes in sales volume and in the mix of product models sold in major markets which have resulted in increases/decreases in profit, as well as certain other reasons for increases/decreases in net sales and cost of sales. (4) With respect to selling, general and administrative expenses, management has analyzed reasons for an increase/decrease in selling, general and administrative expenses from the previous fiscal year net of currency translation effects. 4


41 41
Honda Motor Co., Ltd.
 3rd Quarter Financial Results 3rd Quarter Financial Results Honda Motor Co., Ltd. January 31, 2014 VEZEL HYBRID (JAPAN) 1 Topics 3rd Quarter Financial Results - 3rd Quarter Financial Results - Financial
FY13 2nd Quarter Financial Results
 Insight 2nd Quarter Financial Results Honda Motor Co., Ltd. October 29, 2012 Accord EX-L V-6 (U.S. specification model) 1 2nd Quarter Financial Results & Financial Forecasts Fumihiko Ike Senior Managing
FY13 Financial Results
 Financial Results Honda Motor Co., Ltd. April 26, 213 ACURA RLX (North America) 1 Financial Results & FY14 Financial Forecasts Tetsuo Iwamura Executive Vice President - Financial Results - FY14 Financial
FY13 3rd Quarter Financial Results
 Insight 3rd Quarter Financial Results Honda Motor Co., Ltd. January 31, 2013 Urban SUV concept 1 3rd Quarter Financial Results & Financial Forecasts Fumihiko Ike Senior Managing Officer and Director Chief
FY15 1st Quarter Financial Results
 1st Quarter Financial Results Honda Motor Co., Ltd. July 29, 2014 ACURA TLX (North America) 1 Topics - 1st Quarter Financial Results - Financial Forecasts - Dividend Tetsuo Iwamura Executive Vice President
FY14 Financial Results
 Financial Results Honda Motor Co., Ltd. April 25, 2014 FIT (North America) 1 Topics - Financial Results - FY15 Financial Forecasts - Dividend Tetsuo Iwamura Executive Vice President 2 Outline of Results
Honda Motor Co., Ltd.
 2014 2nd 年度 Quarter 第 2 四半期 Financial 決算説明会 Results Honda Motor Co., Ltd. October 28, 2014 CR-V (North America) 1 Topics - 2nd Quarter Financial Results - Financial - Dividend Tetsuo Iwamura Executive
FY18 2nd Quarter Financial Results
 2nd Quarter Financial Results Honda Motor Co., Ltd. November 1, 2017 Accord (U.S.) 1 Topics -Outline of Results Summary - Honda Group Unit Sales - Main Markets - News Topics - Financial Results - Financial
FY19 3rd Quarter Financial Results
 3rd Quarter Financial Results Honda Motor Co., Ltd. February 1, 2019 Passport (To be launched in U.S.) 1 Contents Outline of 3rd Quarter Financial Results and Financial s 3rd Quarter Financial Results
FY19 2nd Quarter Financial Results
 2nd Quarter Financial Results CR-V (Japan) Honda Motor Co., Ltd. October 30, 2018 1 Topics Outline of 2nd Quarter Financial Results and Financial s 2nd Quarter Financial Results and Financial s 2 Outline
FY18 1st Quarter Financial Results
 1st Quarter Financial Results Honda Motor Co., Ltd. August 1, 217 Odyssey (North America) 1 Topics - News Topics - 1st Quarter Financial Results - Financial - Dividend 2 News Topics Takuma Sato became
FY18 3rd Quarter Financial Results
 3rd Quarter Financial Results Honda Motor Co., Ltd. February 2, 2018 Clarity Plug-In Hybrid (U.S.) 1 Topics -Outline of Results Summary - Honda Group Unit Sales - Main Markets - News Topics - Financial
Honda Corporate Update 2015 Autumn. CIVIC (North America)
") Honda Corporate Update 215 Autumn CIVIC (North America) 1 Honda Corporate Update Honda Business Status Business Strategy Automobile Business Operations Motorcycle Business Operations Other Operations FY16
Honda Corporate Update 215 Autumn CIVIC (North America) 1 Honda Corporate Update Honda Business Status Business Strategy Automobile Business Operations Motorcycle Business Operations Other Operations FY16
FY18 Financial Results
 Financial Results N-BOX N-BOX Custom (Japan) Honda Motor Co., Ltd. April 27, 2018 1 Topics Highlights of Outline of Financial Results and FY19 Financial Forecasts Financial Results and FY19 Financial Forecasts
Financial Results for FY2014
 Financial Results for FY2014 Mitsubishi Motors Corporation April 24, 2015 FY2014 Financial Results NEW 2016 MITSUBISHI OUTLANDER 1 FY2014 Results Summary (vs. FY2013 and Feb. 3 FY2014 Forecast) Achieved
Operating and Financial Review
 Financial Operating and Financial Review Sales Revenue s consolidated sales revenue for the fiscal year ended March, 0, increased by,.9 billion, or 9.%, to,. billion from the fiscal year ended March, 0,
Honda Corporate Update Summer. Acura RDX (North America)
") Honda Corporate Update - 218 Summer Acura RDX (North America) Honda Corporate Update Business Status Business Strategy Automobile Business Operations Motorcycle Business Operations 23 Vision Other Topics
Honda Corporate Update - 218 Summer Acura RDX (North America) Honda Corporate Update Business Status Business Strategy Automobile Business Operations Motorcycle Business Operations 23 Vision Other Topics
FY2018 Second Quarter Financial Results. New Ciaz (India) SUZUKI MOTOR CORPORATION 1 November 2018
 SUZUKI MOTOR CORPORATION 1 November 2018") Second Quarter Financial Results New Ciaz (India) SUZUKI MOTOR CORPORATION 1 November 2018 July Sept. period: Lower net sales and operating income mainly owing to the depreciation of the Indian Rupee Apr.-Sept.
Second Quarter Financial Results New Ciaz (India) SUZUKI MOTOR CORPORATION 1 November 2018 July Sept. period: Lower net sales and operating income mainly owing to the depreciation of the Indian Rupee Apr.-Sept.
Financial Results of FY2014 Third Quarter
 Financial Results of FY2014 Third Quarter Mitsubishi Motors Corporation February 3, 2015 FY2014 Third Quarter Financial Results All-new Triton 1 FY2014 1-3Q Results Summary (vs. 1-3Q) Increased Year-on-year
FY2015 Financial Results. SUZUKI MOTOR CORPORATION 10 May 2016
 Financial Results SUZUKI MOTOR CORPORATION 10 May 2016 Full-Year Highlights Page2 Worldwide Sales Volume of Automobile 2,861 thousand units, 6 thousand units year-on-year Decrease of sales in Japan, China
Business Segment Motorcycle Business For the three months June 30, 2015 and 2016 Unit (Thousands) Honda Group Unit Sales Consolidated Unit Sale Change
 Honda Group Unit Sales Consolidated Unit Sale Change") August 2, 2016 HONDA MOTOR CO., LTD. REPORTS CONSOLIDATED FINANCIAL RESULTS FOR THE FISCAL FIRST QUARTER ENDED JUNE 30, 2016 Tokyo, August 2, 2016--- Honda Motor Co., Ltd. today announced its consolidated
August 2, 2016 HONDA MOTOR CO., LTD. REPORTS CONSOLIDATED FINANCIAL RESULTS FOR THE FISCAL FIRST QUARTER ENDED JUNE 30, 2016 Tokyo, August 2, 2016--- Honda Motor Co., Ltd. today announced its consolidated
Honda Corporate Update Autumn. Accord
 Honda Corporate Update - 217 Autumn Accord Honda Corporate Update Business Status 23 Vision Business Strategy Automobile Business Operations Motorcycle Business Operations Other Topics Financial Highlights
Financial Results for FY2014 First Half
 Financial Results for FY2014 First Half Mitsubishi Motors Corporation October 29, 2014 FY2014 First Half Financial Results Outlander PHEV Concept-S 1 FY2014 Results Summary (vs. FY2013 ) Increased Year-on-year
FY2016 Financial Results
 FY2016 Financial Results Mitsubishi Motors Corporation May 9, 2017 FY2016 Financial Results Outlander PHEV 1 FY2016 Results Summary (vs. FY2015 and Jan. 31 FY2016 Forecast) FY15 (Apr 2015- Mar 2016) (Apr
FY2015 First Half Financial Results
 FY2015 First Half Financial Results Mitsubishi Motors Corporation October 27, 2015 FY2015 First Half Financial Results All-new Pajero Sport 1 FY2015 Results Summary (vs. FY2014 ) Increase in Net Sales
Keihin Corporation FY2017 1st half Financial Results Nov 8, 2016
 Keihin Corporation Financial Results Nov 8, 2016 2 Consolidated Financial Results for and Financial Forecast President and CEO Chitoshi Yokota Topics for 1st Half [Products] Our developed power control
FY Third Quarter Financial Results - The First Nine Months - SUZUKI MOTOR CORPORATION 7 February 2011
 0 Third Quarter Financial Results - The First Nine Months - SUZUKI MOTOR CORPORATION 7 February 2011 Consolidated: Financial Summary Page2 (Billion Yen) ( ) ( ) Change Rate Net sales 1,927.7 1,778.8 +148.9
Honda Corporate Update Spring Acura RDX (Prototype)
") Honda Corporate Update - 2018 Spring 2019 Acura RDX (Prototype) Honda Corporate Update Business Status Business Strategy Automobile Business Operations Motorcycle Business Operations 2030 Vision Other
Honda Corporate Update - 2018 Spring 2019 Acura RDX (Prototype) Honda Corporate Update Business Status Business Strategy Automobile Business Operations Motorcycle Business Operations 2030 Vision Other
Consolidated Financial Results for the 1 st Half of FYE 2019
 Consolidated Financial Results for the 1 st Half of SUBARU CORPORATION Toshiaki Okada Corporate Executive Vice President & CFO November 5 th, 2018 1 Summary Consolidated Financial Results for the 1 st
FY rd Quarter Business Results
 FY2011 3 rd Quarter Business Results Nozza (Vietnam) Launched in Sep. Yamaha Motor Co., Ltd. November 4, 2011 1 Agenda Consolidated Financial Results for the 3 rd Quarter and Nine months of the FY2011
1Q of FY ending December 31, (0.2) (1.9) 11.3 (0.2) (0.2) (0.2) (0.2) (1.2) (89.2) 0.1
 (1.9) 11.3 (0.2) (0.2) (0.2) (0.2) (1.2) (89.2) 0.1") August 6, ISEKI & CO., LTD. Supplementary Information to Consolidated Financial Results (April 1, June 30, ) I. Consolidated business results for the three months ended June 30, (Billions of yen, %) Year-on
August 6, ISEKI & CO., LTD. Supplementary Information to Consolidated Financial Results (April 1, June 30, ) I. Consolidated business results for the three months ended June 30, (Billions of yen, %) Year-on
FY2008 Third Quarter Financial Results. Mitsubishi Motors Corporation February 4, 2009
 0 FY2008 Third Quarter Financial Results Mitsubishi Motors Corporation February 4, 2009 Shuichi Aoto Director In Charge of Corporate Planning, Controlling & Accounting Group Headquarters 1 FY2008 Third
FY2016 First Half Financial Results
 FY2016 First Half Financial Results Mitsubishi Motors Corporation October 28, 2016 We again express our deep apologies to all of our customers and all involved for the trouble caused by the improper conduct
FY2010 Second Quarter Financial Results. SUZUKI MOTOR CORPORATION 2 November 2010
 FY2010 Second Quarter Financial Results SUZUKI MOTOR CORPORATION 2 November 2010 Consolidated: Financial Summary Page 1 FY2010 1H FY2009 1H ( 10/4-9) ( 09/4-9) Change Net sales 1,318.8 1,181.6 +137.2 +
Consolidated profit before income taxes for the period totaled JPY billion, an increase of 11.0% from the same period last year.
 October 30, 2018 HONDA MOTOR CO., LTD. REPORTS CONSOLIDATED FINANCIAL RESULTS FOR THE FISCAL SECOND QUARTER AND THE FISCAL FIRST HALF YEAR ENDED SEPTEMBER 30, 2018 Tokyo, October 30, 2018--- Honda Motor
FY rd Quarter Business Results
 FY 3rd Quarter Business Results The 45 th Tokyo Motor Show MOTOROiD (Reference vehicle) Yamaha Motor Co., Ltd. November 2, (Ticker Symbol:7272) Agenda FY Business Results for Third Quarter Motofumi Shitara
Six months of FY ending December 31, (0.4) (1.9) 22.5 (0.4) (0.3) (0.4) (0.1) (0.4) (0.7) (2.0) 0.9 (1.
 (1.9) 22.5 (0.4) (0.3) (0.4) (0.1) (0.4) (0.7) (2.0) 0.9 (1.") November 11, ISEKI & CO., LTD. Supplementary Information to Consolidated Financial Results (April 1, September 30, ) I. Consolidated business results for the six months ended September 30, (Billions of
November 11, ISEKI & CO., LTD. Supplementary Information to Consolidated Financial Results (April 1, September 30, ) I. Consolidated business results for the six months ended September 30, (Billions of
FY2017 Financial Results. SUZUKI MOTOR CORPORATION 10 May 2018
 Financial Results SUZUKI MOTOR CORPORATION 10 May 2018 Full-Year Highlights P2 Full-Year Results Consolidated Financial Results Higher earnings and sales, record-high sales and each income *1 Net Sales:
Financial Results for the First Quarter Fiscal Year Ending December 2015 Investor Relations Presentation Materials
 Financial Results for the First Quarter Fiscal Year Ending December 2015 Investor Relations Presentation Materials ISEKI & CO., LTD. Susumu Tada, Director & Senior managing executive officer August 7,
FY2017 Financial. Results. May 9, 2018 MITSUBISHI MOTORS CORPORATION OUTLANDER PHEV
 FY2017 Financial Results May 9, 2018 MITSUBISHI MOTORS CORPORATION OUTLANDER PHEV 0 1. FY2017 Full-Year Financial Results Summary 2. FY2017 Full-Year Financial Results Details 3. FY2018 Financial Forecast
April 27, 2018 HONDA MOTOR CO., LTD. REPORTS CONSOLIDATED FINANCIAL RESULTS FOR THE FISCAL FOURTH QUARTER AND THE FISCAL YEAR ENDED MARCH 31, 2018
 April 27, 2018 HONDA MOTOR CO., LTD. REPORTS CONSOLIDATED FINANCIAL RESULTS FOR THE FISCAL FOURTH QUARTER AND THE FISCAL YEAR ENDED MARCH 31, 2018 Tokyo, April 27, 2018--- Honda Motor Co., Ltd. today announced
FY ended March 31, 2015 Restated *1. Year-on year change. Difference (forecast/ actual) FY ended December 31, December 31, 2015 Forecast *2
 FY ended December 31, December 31, 2015 Forecast *2") February 12, 2016 ISEKI & CO., LTD. Supplementary Information to Consolidated Financial Results (April 1, ) I. Consolidated business results for the fiscal year ended (Billions of yen, %) March 31, Restated
February 12, 2016 ISEKI & CO., LTD. Supplementary Information to Consolidated Financial Results (April 1, ) I. Consolidated business results for the fiscal year ended (Billions of yen, %) March 31, Restated
FY2012 first-half financial results
 FY2012 first-half financial results Nissan Motor Co., LTD. November 6, 2012 Key performance indicators: financial results Net revenue 4,546.8 4,367.4 Operating profit 309.7 287.0 Net income Free cash flow
Business Segment Motorcycle Business For the three months ended March 31, 2015 and 2016 Unit (Thousands) Honda Group Unit Sales Consolidated Unit Sale
 Honda Group Unit Sales Consolidated Unit Sale") May 13, 2016 HONDA MOTOR CO., LTD. REPORTS CONSOLIDATED FINANCIAL RESULTS FOR THE FISCAL FOURTH QUARTER AND THE FISCAL YEAR ENDED MARCH 31, 2016 Tokyo, May 13, 2016--- Honda Motor Co., Ltd. today announced
May 13, 2016 HONDA MOTOR CO., LTD. REPORTS CONSOLIDATED FINANCIAL RESULTS FOR THE FISCAL FOURTH QUARTER AND THE FISCAL YEAR ENDED MARCH 31, 2016 Tokyo, May 13, 2016--- Honda Motor Co., Ltd. today announced
Million Yen Million Yen % FY 2011 First quarter 2,243,765 1,128, FY ,224,344 1,106,
 This document is an English translation of the original Japanese document. If there are any discrepancies between this document and the original Japanese document, the original Japanese document prevails.
Mazda Motor Corporation FY2003 RESULTS & FY2004 PROJECTIONS
 Mazda Motor Corporation FY2003 RESULTS & FY2004 PROJECTIONS May 13, 2004 1 FY2003 Results & FY2004 Projections OUTLINE Highlights FY2003 Results FY2004 Projections U.S. Market Actions Close 2 FY2003 Results
Consolidated Financial Results for FYE 2018
 Consolidated Financial Results for SUBARU CORPORATION Toshiaki Okada Corporate Executive Vice President & CFO May 11 th, 20180 0 Summary Consolidated Financial Results for Net sales and global unit sales
1. FY2017 1H Results Summary. 2. FY2017 1H Results Detail. 3. Progress on Growth Strategy
 0 1 1. FY2017 1H Results Summary 2. FY2017 1H Results Detail 3. Progress on Growth Strategy FY2017 1H Results Summary (vs. FY2016 1H) (Apr-Sep 2016) (Apr-Sep 2017) (billion yen, thousand units) Variance
Fiscal year 2012 financial results
 Fiscal year 2012 financial results Nissan Motor Co., Ltd May 10, 2013 Key performance indicators: financial results Net revenue Operating profit Net income Free cash flow (Auto) Net cash (Auto) 9,409.0
Fuji Heavy Industries Ltd.
 President & CEO, Yasuyuki Yoshinaga Fuji Heavy Industries Ltd. May 9, 2014 0 Business Results for the FYE2014 ( 100M) Consolidated automobile sales FYE2013 FYE2014 YoY 724,000 825,000 High +13.9 % Net
All Rights Reserved. Copyright TS TECH CO.,LTD.
 0 Honda FIT HYBRID seat Securities code: 7313 First Section, Tokyo Stock Exchange http://www.tstech.co.jp 1 Introduction Consolidated forecast for FY2012 (April 1, 2011- March 31, 2012) Producing a fair
Consolidated: Financial Summary
 FY2009 Financial Results SUZUKI MOTOR CORPORATION 10 May 2010 Consolidated: Financial Summary Page2 FY2009 FY2008 FY2009 Cumulative Cumulative Change 4th Quarter 4th Quarter FY2008 4th Quarter 09/4-10/3
FY2012 third-quarter financial results
 FY2012 third-quarter financial results Nissan Motor Co., LTD. February 8, 2013 Key performance indicators: financial results Net revenue 6,698.4 6,755.2 Operating profit 427.8 Net income Free cash flow
First Quarter of the Fiscal Year Ending December 31, 2015 Unicharm Presentation Materials for Investor Meeting
 First Quarter of the Fiscal Year Ending December 31, 2015 Unicharm Presentation Materials for Investor Meeting May 8, 2015 Takahisa Takahara President and CEO Unicharm Corporation Projections stated herein
FY2017 Third Quarter Financial Results
 FY2017 Third Quarter Financial Results Mitsubishi Motors Corporation February 5, 2018 Eclipse Cross 0 1. FY2017 3Q (Apr-Dec 2017) Results Summary 2. FY2017 3Q (Apr-Dec 2017) Results by Region 3. FY2017
FISCAL YEAR MARCH 2019 THIRD QUARTER FINANCIAL RESULTS
 FISCAL YEAR MARCH 2019 THIRD QUARTER FINANCIAL RESULTS PRESENTATION OUTLINE Highlights Fiscal Year March 2019 Nine Month Results Fiscal Year March 2019 Full Year Forecast Progress of Key Initiatives 1
Business Results for Full Fiscal year ended 31 December 2017
 Business Results for Full Fiscal year ended 31 December 2017 PAS With DX Yamaha Motor Co., Ltd. February 13, 2018 (Ticker symbol:7272) Agenda FY2017 Business Results President, CEO and Representative Director
Financial Results for the Second Quarter Fiscal Year Ending March 2015 Investor Relations Presentation Materials ISEKI & CO., LTD.
 Financial Results for the Second Quarter Fiscal Year Ending March 2015 Investor Relations Presentation Materials ISEKI & CO., LTD. Noriyuki Kimura, President November 14, 2014 Index 1. Outline of Financial
2. FY2018 First-Quarter Financial Results Details. 3. FY2018 Financial Forecast. 4. Business Highlights
 July 24, 2018 2. FY2018 First-Quarter Financial Results Details 3. FY2018 Financial Forecast 4. Business Highlights 2 FY2018 First-Quarter Financial Results Summary (vs. 1Q/FY2017) (Billion yen, 000 units)
Financial Results for FY2014 First Quarter. Mitsubishi Motors Corporation
 Financial Results for FY2014 First Quarter Mitsubishi Motors Corporation July 30, 2014 FY 2014 First Quarter Financial Results Pikes Peak International Hill Climb 2014 MiEV Evolution III Wins Electric
FY2016 2nd Quarter Business Results
 FY 2nd Quarter Business Results SR320FB - equipped with Helm Master YAMAHA MOTOR CO., Ltd. August 4, (Ticker symbol:7272) Agenda FY 2nd Quarter Business Results Hiroyuki Yanagi President, CEO and Representative
HONDA MOTOR CO., LTD. AND SUBSIDIARIES. Consolidated Financial Statements. September 30, 2007
 HONDA MOTOR CO., LTD. AND SUBSIDIARIES Consolidated Financial Statements HONDA MOTOR CO., LTD. AND SUBSIDIARIES Consolidated Balance Sheets 2006 and and March 31, Assets September* 30, March* 31, 2006
GS Yuasa Corporation Consolidated Earnings Report for the. (Japanese GAAP)
") GS Yuasa Corporation Consolidated Earnings Report for the (Japanese GAAP) August 9, 2018 Stock listing: Tokyo Stock Exchange Securities code: 6674 URL: http://www.gs-yuasa.com/en/ Representative: Osamu
GS Yuasa Corporation Consolidated Earnings Report for the (Japanese GAAP) August 9, 2018 Stock listing: Tokyo Stock Exchange Securities code: 6674 URL: http://www.gs-yuasa.com/en/ Representative: Osamu
Consolidated Business Results For the Fiscal Year Ending March 31, 2012 Bando Chemical Industries, Ltd.
 Consolidated Business Results For the Fiscal Year Ending March 31, 2012 Bando Chemical Industries, Ltd. Financial Summary Fiscal Year Ending March 31, 2012 (1)Settlement of Accounts The production rates
Financial Report. (January 1 ~ December 31, 2016)
") Financial Report (January 1 ~ December 31, ) February 14, 2017 Key Subjects Annual Financial Results Summary Changes in Scope of Consolidation, Affiliated Companies Financial Results Summary Impact from
Financial Report (January 1 ~ December 31, ) February 14, 2017 Key Subjects Annual Financial Results Summary Changes in Scope of Consolidation, Affiliated Companies Financial Results Summary Impact from
Advanced and Emerging Economies Two speed Recovery
 Advanced and Emerging Economies Two speed Recovery 23 November 2 Bauhinia Foundation Research Centre Masaaki Shirakawa Governor of the Bank of Japan Slide 1 Japan s Silver Yen and Hong Kong s Silver Yuan
FY rd Quarter Financial Results ended December 31, 2005
 FY25 3 rd Quarter Financial Results ended December 31, 25 February 2, 26 1/19 Overview of FY25 3 rd Quarter Financial Results 1. 1. Increase in in Sales for for 17.1% -Increase in in domestic and and overseas
Highlights of Consolidated Results for the First Half and the Second Quarter of Fiscal Year ending March 31, 2016
 Highlights of Consolidated Results for the First Half and the Second Quarter of Fiscal Year ending March 31, 2016 (except for per share amounts) November 2, Six months ended Six months ended September
FY FY FY2014 (Forecast)
") [English translation from the original Japanese language document] Consolidated Financial Summary for the First nine months Ended 31 December 2014 [Japanese GAAP] 5 February 2015 Company name : SUZUKI
[English translation from the original Japanese language document] Consolidated Financial Summary for the First nine months Ended 31 December 2014 [Japanese GAAP] 5 February 2015 Company name : SUZUKI
Presentation for Institutional Investors (FY16 1 st Half)
") Nippon Paint Holdings Co., Ltd. Presentation for Institutional Investors (FY16 1 st Half) November 17, 2016 Nippon Paint Holdings Co., Ltd. Tetsushi Tado, President & CEO Table of Contents 1.Financial
Nippon Paint Holdings Co., Ltd. Presentation for Institutional Investors (FY16 1 st Half) November 17, 2016 Nippon Paint Holdings Co., Ltd. Tetsushi Tado, President & CEO Table of Contents 1.Financial
Financial Results for the First Half of the Fiscal Year Ending March 31, 2015
 Financial Results for the First Half of the Fiscal Year Ending March 31, 2015 NOK CORPORATION (7240 / TSE1) November 2014 Disclaimer Any plans, targets, forecasts, strategies, policies and opinions relating
Financial Results for the First Half of the Fiscal Year Ending March 31, 2017
 Second Quarter Financial Results for the First Half of the Fiscal Year Ending March 31, 2017 NOK CORPORATION (7240 / TSE1) November 9, 2016 Disclaimer Any plans, targets, forecasts, strategies, policies
Consolidated Financial Results For the Third Quarter of the Fiscal Year Ending March 31, 2018 (For the First Nine Months Ended December 31, 2017)
") Consolidated Financial Results For the Third Quarter of the Fiscal Year Ending March 31, 2018 (For the First Nine Months Ended December 31, 2017) Prepared in Conformity with Generally Accepted Accounting
Consolidated Financial Results For the Third Quarter of the Fiscal Year Ending March 31, 2018 (For the First Nine Months Ended December 31, 2017) Prepared in Conformity with Generally Accepted Accounting
SUMIDA CORPORATION. - Consolidated Results of the 1 st Quarter FY th May, Shigeyuki Yawata, CEO Saburo Matsuda, CFO
 SUMIDA CORPORATION Consolidated Results of the 1 st Quarter FY2009 14 th May, 2009 Shigeyuki Yawata, CEO Saburo Matsuda, CFO 1. Forex Volatility (Unit:yen) Average.1Q.2Q.3Q.4Q 09.1Q 2009 in 20 (Assumption)
Presentation of Business Results for the 1st Quarter of FYE 2014
 Presentation of Business Results for the 1st Quarter of FYE 2014 Director of the Boards & CFO, Mitsuru Takahashi July 31, 2013 0 0 Summary Financial results for the 1st quarter of FYE March 2014 Propelled
Consolidated Financial Results for FY2018. Keihin Corporation May 11, 2018
 Consolidated Financial Results for FY2018 Keihin Corporation May 11, 2018 Summary of FY2018 Consolidated Financial Results and FY2019 Financial Forecasts President and CEO Chitoshi Yokota 1 Topics for
Highlights of Consolidated Results for Fiscal Year ended March 31, 2016
 May 9, 2016 Highlights of Consolidated Results for Fiscal Year ended March 31, 2016 (except for per share amounts) Year ended Year ended March 31, March 31, 2016 2015 Change Y 745,888 Y 707,237 5.5 Operating
Briefing on Financial Statements for the First Half of the Year Ending March 2016
 Briefing on Financial Statements for the First Half of the Year Ending March 216 November 12, 215 http://www.tsugami.co.jp Copyright 215 TSUGAMI CORPORATION All rights reserved. 1. Business performance
Consolidated Financial Results For the Third Quarter of the Fiscal Year Ending March 31, 2019 (For the First Nine Months Ended December 31, 2018)
") Consolidated Financial Results For the Third Quarter of the Fiscal Year Ending March 31, 2019 (For the First Nine Months Ended December 31, 2018) Prepared in Conformity with Generally Accepted Accounting
Consolidated Financial Results For the Third Quarter of the Fiscal Year Ending March 31, 2019 (For the First Nine Months Ended December 31, 2018) Prepared in Conformity with Generally Accepted Accounting
Financial Report for 3 rd Quarter of FY (April 2010 December 2010)
") Financial Report for 3 rd Quarter of FY2011.3 (April 2010 December 2010) January 2011 Osaka Gas Co., Ltd. 1 1 I. Business Results for 3 rd Quarter of FY2011.3 Management information is available on Osaka
Financial Report for 3 rd Quarter of FY2011.3 (April 2010 December 2010) January 2011 Osaka Gas Co., Ltd. 1 1 I. Business Results for 3 rd Quarter of FY2011.3 Management information is available on Osaka
XML Publisher Balance Sheet Vision Operations (USA) Feb-02
 Feb-02") Page:1 Apr-01 May-01 Jun-01 Jul-01 ASSETS Current Assets Cash and Short Term Investments 15,862,304 51,998,607 9,198,226 Accounts Receivable - Net of Allowance 2,560,786
Page:1 Apr-01 May-01 Jun-01 Jul-01 ASSETS Current Assets Cash and Short Term Investments 15,862,304 51,998,607 9,198,226 Accounts Receivable - Net of Allowance 2,560,786
Financial Highlights Yamaha Motor Co., Ltd. and Consolidated Subsidiaries Years ended December 31
 Financial Highlights Yamaha Motor Co., Ltd. and Consolidated Subsidiaries Years ended December 31 Motorcycle sales by market Motorcycle unit sales by market Marine product sales by market POINT Industrial
HONDA MOTOR CO., LTD. AND SUBSIDIARIES. Condensed Consolidated Interim Financial Statements. September 30, 2018
 Condensed Consolidated Interim Financial Statements September 30, 2018 Consolidated Financial Results Overview of Operating Performance Honda s consolidated sales revenue for the six months ended September
Consolidated Financial Results For the First Half of the Fiscal Year Ending March 31, 2018 (For the Six Months Ended September 30, 2017)
") Consolidated Financial Results For the First Half of the Fiscal Year Ending March 31, 2018 (For the Six Months Ended September 30, 2017) Prepared in Conformity with Generally Accepted Accounting Principles
Consolidated Financial Results For the First Half of the Fiscal Year Ending March 31, 2018 (For the Six Months Ended September 30, 2017) Prepared in Conformity with Generally Accepted Accounting Principles
Presentation on Business Results for the 1st-Half of Fiscal Year Ending March 31, 2019
 Presentation on Business Results for the 1st-Half of Fiscal Year Ending March 31, 2019 November 16, 2018 This presentation contains forward-looking statements relating to expected future performance as
Summary of Financial Results for the First Quarter (1Q) of the Fiscal Year Ending March 2011 [Japan GAAP]
![Summary of Financial Results for the First Quarter (1Q) of the Fiscal Year Ending March 2011 [Japan GAAP]](/thumbs/80/82491321.jpg "Summary of Financial Results for the First Quarter (1Q) of the Fiscal Year Ending March 2011 [Japan GAAP]") August 5, 2010 Summary of Financial Results for the First Quarter (1Q) of the Fiscal Year Ending March 2011 [Japan GAAP] Name of Company: SHIROKI CORPORATION Stock Code: 7243 Stock Exchange Listing: Tokyo
August 5, 2010 Summary of Financial Results for the First Quarter (1Q) of the Fiscal Year Ending March 2011 [Japan GAAP] Name of Company: SHIROKI CORPORATION Stock Code: 7243 Stock Exchange Listing: Tokyo
Consolidated Financial Results For the Third Quarter of the Fiscal Year Ending March 31, 2017
 Consolidated Financial Results For the Third Quarter of the Fiscal Year Ending March 31, 2017 (For the First Nine Months Ended December 31, 2016) Prepared in Conformity with Generally Accepted Accounting
Executive Summary of Consolidated Financial Results for the year ended March 31,2018. Yakult Honsha Co., Ltd.
 Executive Summary of Consolidated Financial Results for the year ended March 31,2018 Yakult Honsha Co., Ltd. May 10 th 2018 General outline of Consolidated financial results Total Increase in sales and
Real Effective Exchange Rate based on CPI as Price Index for India*
 Real Effective Exchange Rate based on CPI as Price Index for India ARTICLE Real Effective Exchange Rate based on CPI as Price Index for India* Effective exchange rates are summary indicators of movements
FY2011 first-quarter financial results
 FY2011 first-quarter financial results Nissan Motor Co., LTD. July 27, 2011 Key performance indicators: financial results Net revenue Operating profit Net income Free cash flow (Auto) Net debt (Auto) 2,050.1
FY2016 Financial Results
 Financial Results SWIFT (European specification) SUZUKI MOTOR CORPORATION 12 May 2017 Full-Year Highlights Page2 Full-Year Results Consolidated Financial Results Higher earnings on lower sales, the highest
(4) Number of outstanding shares (common stock) (Shares) 1) Number of outstanding shares at end of period (including treasury stock)
 Number of outstanding shares (common stock) (Shares) 1) Number of outstanding shares at end of period (including treasury stock)") * Notes (1) Changes in significant subsidiaries during the period (Changes in specified subsidiaries that accompany with a change in the scope of consolidation) : None New - (Name) Exclusion - (Name) (2)
* Notes (1) Changes in significant subsidiaries during the period (Changes in specified subsidiaries that accompany with a change in the scope of consolidation) : None New - (Name) Exclusion - (Name) (2)
Net sales Operating income Ordinary income
 [English translation from the original Japanese language document] Consolidated Financial Summary for the First Six Months Ended 30 September 2015 [Japanese GAAP] 4 November 2015 Company name : SUZUKI
Consolidated Financial Results for the 1st Quarter of the Fiscal Year Ending March 31, 2009
 NIHON KOHDEN CORPORATION (6849) August 6, 2008 Consolidated Financial Results for the 1st Quarter of the Fiscal Year Ending March 31, 2009 Stock Exchange Listing: Head Office: Representative: Contact:
GS Yuasa Corporation Consolidated Earnings Report for the Nine Months ended December 31, 2018 (Japanese GAAP)
") GS Yuasa Corporation Consolidated Earnings Report for the (Japanese GAAP) February 12, 2019 Stock listing: Tokyo Stock Exchange Securities code: 6674 URL: http://www.gs-yuasa.com/en/ Representative: Osamu
GS Yuasa Corporation Consolidated Earnings Report for the (Japanese GAAP) February 12, 2019 Stock listing: Tokyo Stock Exchange Securities code: 6674 URL: http://www.gs-yuasa.com/en/ Representative: Osamu
Suzuka 8-Hours Endurance Race Achieved Unprecedented Four Successive Victories by One Team
 Business Results for -Year Fiscal Year Ended December 31, Business Information Session Yamaha Motor Co., Ltd. August 8, (Ticker symbol:7272) Suzuka 8-Hours Endurance Race Achieved Unprecedented Four Successive
Financial Results. for the year ended December 31, Masato Yoshikawa
 Financial Results for the year ended December 31, 2018 Masato Yoshikawa Director and Senior Managing Executive Officer, General Manager of Planning & Control Headquarters February 20, 2019 Voluntary Adoption
FY ending. 3Q of FY ended December 31, 2015 Restated basis *1. Year-on-year change (Restated basis) 3Q of FY ending
 3Q of FY ending") November 11, 2016 ISEKI & CO., LTD. Supplementary Information to Consolidated Financial Results (January 1, 2016 September 30, 2016) I. Consolidated business results for the nine months ended September
November 11, 2016 ISEKI & CO., LTD. Supplementary Information to Consolidated Financial Results (January 1, 2016 September 30, 2016) I. Consolidated business results for the nine months ended September
2. 3Q YTD/FY2018 Financial Results Details. 3. FY2018 Financial Forecast. 4. Business Highlights
 February 1, 2019 2. 3Q YTD/FY2018 Financial Results Details 3. FY2018 Financial Forecast 4. Business Highlights 2 3Q YTD/FY2018 Financial Results Summary (vs. 3Q YTD/FY2017) (Billion yen, 000 units) 1,518.1
DMG MORI CO., LTD. CY 2016 (Jan.- Dec.) 3Q Result. IR Conference 0/28. IR Conference 2016/11/7
 3Q Result. IR Conference 0/28. IR Conference 2016/11/7") DMG MORI CO., LTD. CY 2016 (Jan.- Dec.) 3Q Result 0/28 Agenda 1) Full integration with DMG MORI AG 2) Financials 3) Business Environment 4) Topics from DMG MORI Group 1/28 Full integration with DMG MORI
DMG MORI CO., LTD. CY 2016 (Jan.- Dec.) 3Q Result 0/28 Agenda 1) Full integration with DMG MORI AG 2) Financials 3) Business Environment 4) Topics from DMG MORI Group 1/28 Full integration with DMG MORI