DMG MORI CO., LTD. CY 2016 (Jan.- Dec.) 3Q Result. IR Conference 0/28. IR Conference 2016/11/7
|
|
|
- Rosanna Jenkins
- 5 years ago
- Views:
Transcription

1 DMG MORI CO., LTD. CY 2016 (Jan.- Dec.) 3Q Result 0/28
2 Agenda 1) Full integration with DMG MORI AG 2) Financials 3) Business Environment 4) Topics from DMG MORI Group 1/28
3 Full integration with DMG MORI AG Aug 2016, Domination and Profit & Loss Transfer Agreement settled GLOBAL ONE ~2020 Domination Agreement DMG MORI brand Start cooperation with DMG 2020~ Accelerate Operational Efficiency Accelerated growth Shift to Manufacturing of Next generation 1) Digital factory (Technology Cycles, IoT) 2) Human resources development 3) Healthy margin, robust B/S Apr 2016: 76.03% stake *Cumulative investment in AG: JPY 216.7bn Aug 2016: Domination Agreement came into effect 2/28
4 CY2016 Summary of negative legacy expenses (JPY bn) 3Q 4Q 2016 Total Effect from 2017 Closure of factories Exit from Energy Solution Business Optimization of excess marketing expenses Reduction of excess middlemanagements/ redundant subsidiaries Subtotal Improvement in US subsidiary +3.5 Total /28
5 Turn around to black figure of the US subsidiary (Million USD) left axis : Sales left axis : EBIT Order Backlog /28 Q3 Q4 Q1 Q2 Q3 Q4 CY2015 CY2016 * incl. Marketing expenses(imts) 7.5 Million USD
6 Agenda 1) Full integration with DMG MORI AG 2) Financials 3) Business Environment 4) Topics from DMG MORI Group 5/28
7 Income statement(3 rd quarter) (Jan Sep) (Jan Sep) (JPY bn) Proforma Actual Changes Sales Revenue Operating profit before one-off expenses Operating margin (%) 7.5% 1.2% One-off gain /expenses Operating profit Operating margin (%) 15.9% 1.0% Net financial cost (thereof, economic compensation associated with DA) Net profit for the period 0.09 attributable to: (-0.2) - Shareholders Non-controlling interest USD/JPY EUR/JPY /28
8 Major accounting issues in the 3 rd quarter (1) Effect from Domination Agreement P/L Economic compensation to non-controlling interests of AG as finance cost (non-operating item) / tax non-deductible 3Q, 2016 : JPY 0.20bn 4Q, 2016 on : JPY 0.45bn/qtr (EUR 4.1mm/ EUR/JPY=110) B/S Deemed acquisition of non-controlling interests stake of AG (on August 24, Domination Agreement became effective) Obligation to purchase AG shares Deduction from shareholders equity the difference between acquisition cost and remaining net worth of AG (Dr) Non-controlling interest JPY 39.1bn (Cr) Obligation to- JPY 85.4bn Shareholders equity JPY 46.3bn purchase AG shares (2) Effect from perpetual subordinated loan/bonds P/L Net profit attributable to hybrid equity owners is included in the net profit attributable to shareholders (JPY 41mm in the 3 rd quarter) For EPS calculation, the net profit attributable to hybrid equity owners is excluded B/S Hybrid equity in equity portion JPY 49.5bn 7/28
9 Financial Position (vs. Dec 2015) Assets Liabilities & Equities Cash & cash equivalents Receivables Inventories Tangible Fixed Assets JPY 598bn JPY 511bn JPY 598bn JPY 511bn Payables Interest-bearing Debt Other liabilities Net Debt Sep.30, 2016 JPY bn JPY 20.0 bn Dec 31, 2016.E Less than JPY bn Goodwill Intangibles Equity accounted investments Other assets Dec 31, 2015 Sep NCI Dec 31, Sep 30 Obligation of AG share purchase Shareholders Equity Hybrid Equity Paid-in-capital 51.1 Retained earnings 39.9 Treasury stock Other equity items Net debt (JPY) 133bn 169bn Shareholders equity ratio 26.0% 19.6% 8/28
10 Reduction of shareholders equity associated with additional acquisition of AG shares after initial consolidation 2015 April 1 26% increase 2016 April August 24 Consolidation of DMG MORI AG 50% stake *voting rights basis 76% stake Domination Agreement became effective (deemed acquisition of 24% stake) (April 1, 2015) JPY (After initial consolidation) JPY Recognition of share purchase obligation JPY Fair value of AG shares Net worth of AG x 50% Difference Elimination 170.9bn 98.2bn 72.7bn 0.5bn Additional acquisition cost Net worth of AG (additionally acquired) Difference Deduction of equity 90.2bn 42.8bn 47.4bn 45.5bn Acquisition cost 85.4bn Present value of total offering price + future economic compensation Net worth AG(24.0%) Diff. = Deduction of equity 39.1bn 46.3bn Goodwill 72.2bn Treasury shares 1.9bn Cumulative deduction of equity JPY 91.8bn 9/28
11 Cash Flow CY2015 CY2016 (100 Million JPY) Jul-Sep Oct-Dec 1H Jan-Jun 3Q Jul-Sep 4Q Oct-Dec Full-year Jan-Dec Cash Flow from operationg activities Amount for earnings before taxes (42) (-82) (23) (-16) Amount for depreciation (40) (68) (84) (39) Amount for changes of working capital (-58) (326) (-187) (-34) Amount for income tax paid (-17) (-28) (-26) (-21) - - Cash Flow from investment activities Amount paid out for acquisition of fixed assets (-78) (-98) (-71) (-25) - Cash Flow from financing activities Payments for acquisition of minority shares (-225) (-64) (-613) (-1) - - Cash and cash equivalents at the end of the period /28
12 Financial forecast full-year Jan - Dec (JPY bn) Proforma Previous forcast Forecast Sales Revenue Operating Profit before one-off items % to revenue 8.4% 4.1% One-off gain/ expenses Operating Profit Operating margin 9.6% 0.5% Net finance expenses (thereof, compensation associated with Domination Agreement) - (-0.7) Net Profit attributable to shareholders USD/JPY EUR/JPY Q: USD/JPY EUR/JPY /28
13 CY2016 Profit & Loss analysis - Original vs. Revised (JPY bn) Cost savings +2.5 Forex factors 8.0 Original Revised Forex: USD/JPY EUR/JPY Exit of ECOLINE 4.5 Closure of factories Energy Solution CY2015 (1-12) Marketing exp.,etc. 428 (Original) 36.0 (Normal) Expats (Revised) 12/28
14 CY2017 Profit improvement factors (JPY bn) Reduction of Marketing expenses Exit from Energy Biz Reduction of Middle management Closure of factories +2.1 Improvement in US (Full-year effect) 13/28
15 Agenda 1) Full integration with DMG MORI AG 2) Financials 3) Business Environment 4) Topics from DMG MORI Group 14/28
16 (JPY bn) 10,000 9,000 8,000 7,000 6,000 5,000 4,000 3,000 2,000 Machine tool industry worldwide (VDW / Oxford Economics) 4, , ,756 left axis: 46.0 Consumption in JPY bn right axis: Consumption in EUR bn (EUR bn) 8,326 8, , , , , CY2016 forecast (EUR basis) As of Oct, % As of Oct, % 7, , ,166 7,953 7, % +16.9% +10.8% +11.7% +5.6% -30.8% +29.3% +30.9% +10.5% -13.2% +4.9% +7.2% -1.7% +2.1% +13.2% +19.4% +18.6% +23.2% -0.9% -40.5% +14.0% +26.7% +2.6% +9.5% +12.8% +2.1% -13.2% -4.8% , CY Exchange Rate EUR (JPY) 15/ E 2017.E * Source: VDW / Oxford Economics, Oct. 2016; 2016 without exchange rate effects; Total market (cutting and forming); DMG MORI AKTIENGESELLSCHAFT relevant: cutting
17 JMTBA Order (JMTBA=Japan Machine Tool Builders Association) (JPY bn) 1,600 1,400 1,200 : Domestic 国内 (Japan) :Overseas 1,590 1,437 1,363 1,301 1, 海外 1,326 1,212 1,117 1,510 1, E 1,300 1, , CY 16/ (Jan-Sep)
18 AG&CO Quarterly Consolidated Order Intake (JPY bn) *AG&CO consolidated order intake: Including machine body (Taiyo Koki and Wasino) and Service & Parts. left axis :JPY Basis right axis :EUR Basis Y on Y (Jan Sep) JPY Basis 8.4% EUR Basis + 1.9% (EUR Mil) 1,200 1, Exchange Rate USD (JPY) EUR Jan-Mar CY12 Apr-Jun Jul-Sep Oct-Dec Jan-Mar CY13 Apr-Jun Jul-Sep Oct-Dec Jan-Mar CY14 Apr-Jun Jul-Sep Oct-Dec Jan-Mar CY15 Apr-Jun Jul-Sep Oct-Dec Jan-Mar CY16 Apr-Jun Jul-Sep /28
19 Overview (by Geography & by Industry) Geography Down Flat UP Industry Down Flat UP Japan 日本 CY2015 CY2016 Automotive CY2015 CY2016 Europe 欧州 Aircraft North America 北米 Machinery South America 南米 Medical China 中国 Die & Mold Asia アジア (excl. ( 除 中国 China) ) Energy Construction Machinery Electronics 18/28
20 Production (unit) (pcs) 3,000 2,000 1, Q 2Q 3Q 4Q 1Q 2Q 3Q 4Q 1Q 2Q 3Q 4Q 1Q 2Q 3Q 4Q 1Q 2Q 3Q CY2012 CY2013 CY2014 CY2015 CY /28
 *AG&CO Consolidated order intakes :machine body only left axis :JPY Basis right axis :EUR Basis (K EUR)")

21 Consolidated Order Intakes - Average Price (Mil. JPY) *AG&CO Consolidated order intakes :machine body only left axis :JPY Basis right axis :EUR Basis (K EUR) ECOLINE Vertical Machining Center Turning Center Advanced Technologies 5-axis Machine CMX V series Vertical Machining Center Turning Center Advanced Technologies 5-axis Machine Millturn Center Horizontal Machining Center Millturn Center Horizontal Machining Center Exchange Rate (JPY) USD EUR 20/28
 52% Europe Others Asia China Japan Jan Sep 2016 Europe (Incl.")
22 Order Trend by Geography (AG+CO Consolidated Machine Order Intake) Asia China Japan Jan Dec 2015 Europe (Incl. Germany) 52% Europe Others Asia China Japan Jan Sep 2016 Europe (Incl. Germany) 55% Europe Others USA (Americas) Germany USA (Americas) Germany * Value basis * Machine body only 21/28


23 Order Composition (by Industry) Jul Dec 2015 Jan Sep 2016 Medical Energy/ Power generation Electricity/ Precision parts/ Semi conductor Construction machinery Others Machinery Energy/Power generation Electricity/ Precision parts/ Semi conductor Construction machinery Medical Others Machinery Die & Mold Die & Mold Aerospace Metal Machining Automotive/ Motor Cycle Aerospace Metal Machining Automotive/ Motor Cycle * Value basis * Machine body only 22/28
24 Order Composition (by Product type) Jan Dec 2015 Jan Sep 2016 ECOLINE Advanced Technologies Vertical Machining Center Turning Center 5-axis Machine Vertical Machining Center Turning Center From Sep 2016 CMX V series Advanced Technologies 5-axis Machine Millturn Center Horizontal Machining Center Millturn Center Horizontal Machining Center * Value basis * Machine body only 23/28
25 Agenda 1) Full integration with DMG MORI AG 2) Financials 3) Business Environment 4) Topics from DMG MORI Group 24/28


 Oct 4-8 BIMU (Milano,")
26 Major exhibitions in 2nd half of Strong Introduction to global markets Technology Cycles, CELOS + Industry 4.0, Systems solution Sep (Stuttgart, Germany) Sep (Chicago, USA) Oct 4-8 BIMU (Milano, Italy) Nov JIMTOF (Tokyo, Japan) 25/28


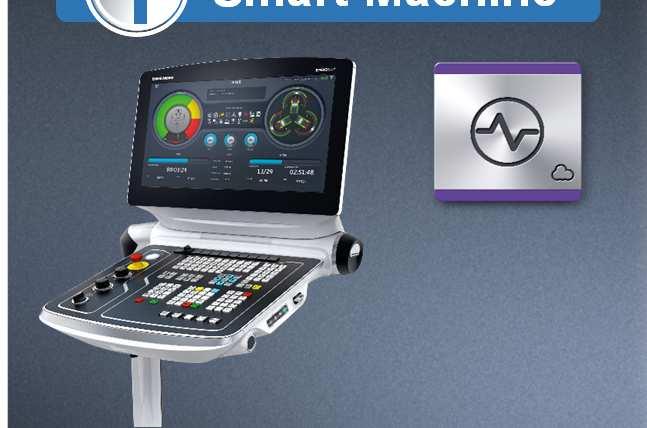
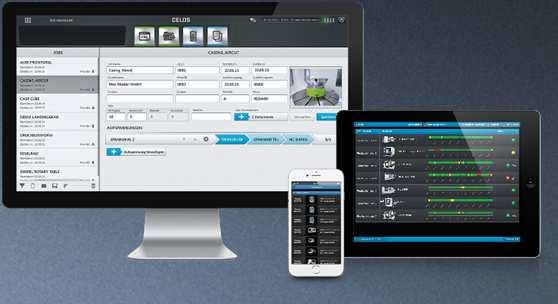

27 Cooperation with Microsoft Japan - Make the infrastructure for IoT era with Cloud technology 1 Smart Machine 2 Smart Factory 3 Smart Company CONDITION ANALYZER Smart Data スマートデータ Factory Server Machine Server Factory Server Factory No. 1 Factory No. 2 Expansion of Data Volume 26/28


28 Challenge to Motor Racing - Partnership with TOYOTA Motors Leading companies in Automotive Industry 2017 onwards Since 2014 Technological Support Data collected under tough conditions Software solutions Strong tie with automotive industry Know-how of critical components for auto Data Accumulation 27/28
29 Disclaimer This material contains targets, plans, etc. concerning the future of DMG MORI CO., LTD. and the DMG MORI Group. All predictions concerning the future are judgments and assumptions based on information available to DMG MORI at the time of writing. There is a possibility that the actual future results may differ significantly from these forecasts, due to changes in management policy or changes in external factors. There are many factors which contain elements of uncertainty or the possibility of fluctuation including the following: Fluctuations in exchange rates Changes to the laws, regulations and government policies in the markets where DMG MORI CO., LTD. conducts its business DMG MORI CO., LTD. s ability to develop and sell new products in a timely fashion Instability of governments in the markets where DMG MORI CO., LTD. conducts its business Operational changes by the competent authorities or regulations related to anti-trust, etc. 28/28
Dear Investors. We published our financial results for FY2016 on February 10 th, This material summarized selected questions & answers on them.
 Dear Investors We published our financial results for FY2016 on February 10 th, 2017. This material summarized selected questions & answers on them. Agenda Management analysis Selected questions & answers
FY rd Quarter Financial Results ended December 31, 2005
 FY25 3 rd Quarter Financial Results ended December 31, 25 February 2, 26 1/19 Overview of FY25 3 rd Quarter Financial Results 1. 1. Increase in in Sales for for 17.1% -Increase in in domestic and and overseas
(1) Consolidated business results (% of change from same period in the previous year)
 Consolidated business results (% of change from same period in the previous year)") Date: November 7, 2016 Summary of Consolidated Financial Statements for the third quarter of Fiscal Year 2016 ended September 30, 2016 (IFRS basis) (All financial information has been prepared based on
Date: November 7, 2016 Summary of Consolidated Financial Statements for the third quarter of Fiscal Year 2016 ended September 30, 2016 (IFRS basis) (All financial information has been prepared based on
(1) Consolidated business results (% of change from same period in the previous year)
 Consolidated business results (% of change from same period in the previous year)") Date: February 13, 2018 Summary of Consolidated Financial Statements for the Fiscal Year 2017 ended December 31, 2017 (IFRS basis) (All financial information has been prepared based on the original Japanese-language
Date: February 13, 2018 Summary of Consolidated Financial Statements for the Fiscal Year 2017 ended December 31, 2017 (IFRS basis) (All financial information has been prepared based on the original Japanese-language
Explanatory Material of Group Company for the Second Quarter of the Fiscal Year Ending March 31, 2019
 -- Explanatory Material of Group Company for the Second uarter of the Fiscal Year Ending March, 9 Makino Milling Machine Co., Ltd October, 8 8.. Copyright @ 5 Makino Milling Machine Co.,Ltd. All Rights
Presentation on Business Results for the 1st-Half of Fiscal Year Ending March 31, 2019
 Presentation on Business Results for the 1st-Half of Fiscal Year Ending March 31, 2019 November 16, 2018 This presentation contains forward-looking statements relating to expected future performance as
Briefing on Financial Statements for the First Half of the Year Ending March 2016
 Briefing on Financial Statements for the First Half of the Year Ending March 216 November 12, 215 http://www.tsugami.co.jp Copyright 215 TSUGAMI CORPORATION All rights reserved. 1. Business performance
Presentation of Consolidated Financial Results for the 1st Quarter of the FY Ended March 31, 2019 (from Apr to Jun. 2018)
") Presentation of Consolidated Financial Results for the 1st Quarter of the FY Ended March 31, 2019 (from Apr. 2018 to Jun. 2018) 1 Highlights of Consolidated Results Summary of P/L (3M) (3M) Amount % Order
Presentation of Consolidated Financial Results for the 1st Quarter of the FY Ended March 31, 2019 (from Apr. 2018 to Jun. 2018) 1 Highlights of Consolidated Results Summary of P/L (3M) (3M) Amount % Order
Results Presentation for the 2 nd Quarter ended June 30, 2018 EBARA (6361) August 9, 2018
 August 9, 2018") Presentation for the 2 nd Quarter ended June 30, 2018 EBARA (6361) August 9, 2018 Contents 1. Summary of Executive Officer, Responsible for Finance & Accounting Akihiko Nagamine 2. Projection and Management
Presentation for the 2 nd Quarter ended June 30, 2018 EBARA (6361) August 9, 2018 Contents 1. Summary of Executive Officer, Responsible for Finance & Accounting Akihiko Nagamine 2. Projection and Management
Third Quarter Results (ended December 31, 2016) Brother Industries, Ltd.
 Brother Industries, Ltd.") Fiscal Year 2016 (ending March 31, 2017) Third Quarter Results (ended December 31, 2016) Brother Industries, Ltd. February 8, 2017 Information on this report, other than historical facts, refers to future
Fiscal Year 2016 (ending March 31, 2017) Third Quarter Results (ended December 31, 2016) Brother Industries, Ltd. February 8, 2017 Information on this report, other than historical facts, refers to future
Financial Results for the First Half of the Fiscal Year Ending March 31, 2015
 Financial Results for the First Half of the Fiscal Year Ending March 31, 2015 NOK CORPORATION (7240 / TSE1) November 2014 Disclaimer Any plans, targets, forecasts, strategies, policies and opinions relating
Highlights of Consolidated Results for the First Half and the Second Quarter of Fiscal Year ending March 31, 2016
 Highlights of Consolidated Results for the First Half and the Second Quarter of Fiscal Year ending March 31, 2016 (except for per share amounts) November 2, Six months ended Six months ended September
3rd Quarter 2016 INTERIM REPORT 2016
 3 rd Quarter 2016 INTERIM REPORT 2016 Dear Shareholders, In the third quarter 2016, dmg mori aktiengesellschaft saw a positive development with 601.4 million or +12% in its order intake (previous year:
CONSOLIDATED BUSINESS RESULTS
 CONSOLIDATED BUSINESS RESULTS FOR THE THIRD QUARTER ENDED DECEMBER 31, 2017 February 2, 2018 NSK Ltd. Cautionary Statements with Respect to Forward-Looking Statements Statements made in this report with
FY2018 Financial Results
 FY2018 Financial Results UX200 (Geneva s International Motor Show 2018 exhibition car) Toyota Motor Corporation May 9, 2018 Cautionary Statement with Respect to Forward-Looking Statements This presentation
Performance Summary. Copyright 2018 Harmonic Drive Systems Inc.
 Performance Summary 2 1st-half consolidated results (versus original forecasts for the period) Original forecasts (announced May 11) 1st-half FY ending Mar.31,2019 Vs. original forecasts for the period
FY rd Quarter Results and Outlook
 FY2010 3 rd Quarter Results and Outlook February 4 th,2011 1/23 About Future Projections This material contains targets, plans, etc, concerning the future of Mori Seiki and the Mori Seiki Group. All predictions
SUMIDA CORPORATION. - Consolidated Results of the 1 st Quarter FY th May, Shigeyuki Yawata, CEO Saburo Matsuda, CFO
 SUMIDA CORPORATION Consolidated Results of the 1 st Quarter FY2009 14 th May, 2009 Shigeyuki Yawata, CEO Saburo Matsuda, CFO 1. Forex Volatility (Unit:yen) Average.1Q.2Q.3Q.4Q 09.1Q 2009 in 20 (Assumption)
Highlights of Consolidated Results for Fiscal Year ended March 31, 2016
 May 9, 2016 Highlights of Consolidated Results for Fiscal Year ended March 31, 2016 (except for per share amounts) Year ended Year ended March 31, March 31, 2016 2015 Change Y 745,888 Y 707,237 5.5 Operating
Financial Results for the First Half of the Fiscal Year Ending March 31, 2017
 Second Quarter Financial Results for the First Half of the Fiscal Year Ending March 31, 2017 NOK CORPORATION (7240 / TSE1) November 9, 2016 Disclaimer Any plans, targets, forecasts, strategies, policies
- Check against delivery - Speech for the Balance Sheet Press Conference of DMG MORI SEIKI AKTIENGESELLSCHAFT for the financial year 2014
 - Check against delivery - Speech for the Balance Sheet Press Conference of DMG MORI SEIKI AKTIENGESELLSCHAFT for the financial year 2014 on 12 March 2015, 11:00 a.m. in Düsseldorf, at the Intercontinental
NKT Holding. Interim Report Q Audiocast presentation 8 November 2012 at 10:00 am CET
 NKT Holding Interim Report Q3 2012 Audiocast presentation 8 November 2012 at 10:00 am CET Agenda Page Page 2 2 NKT Group Highlights Q3 2012 Financial results Q3 2012 Companies NKT Cables Nilfisk-Advance
CONSOLIDATED BUSINESS RESULTS
 CONSOLIDATED BUSINESS RESULTS FOR THE THIRD QUARTER ENDED DECEMBER 31, 2018 February 1, 2019 NSK Ltd. Cautionary Statements with Respect to Forward-Looking Statements Statements made in this report with
Consolidated financial results for 2Q 2017
 Citi Handlowy Strategy and Investor Relations Department Consolidated financial results for 2Q 2017 August 22 nd, 2017 2Q 2017 summary Consistent growth of customer business: Loan volume growth in institutional
Results Presentation for Fiscal Year Ended December 31, 2017 EBARA (6361) February 15, 2018
 February 15, 2018") Presentation for Fiscal Year Ended EBARA (6361) February 15, 2018 1. Summary of Change in Accounting Period Changed our accounting period from the end of March to the end of December The fiscal year ended
Presentation for Fiscal Year Ended EBARA (6361) February 15, 2018 1. Summary of Change in Accounting Period Changed our accounting period from the end of March to the end of December The fiscal year ended
INTERIM REPORT Q2-2011
 INTERIM REPORT Q2-2011 Live presentation 23 August 2011 at 11:00 am NKT Holding A/S / IR presentation / Interim Report 2, 2011 1 Agenda Highlights Q2 Financial results Q2 2011 Companies - NKT Cables -
Financial Results for the Fiscal Year Ended March 31, 2018
 Fiscal Year Financial Results for the Fiscal Year Ended March 31, 2018 NOK CORPORATION (7240 / TSE1) May 10, 2018 Disclaimer Any plans, targets, forecasts, strategies, policies and opinions relating to
Honda Information Meeting 2012 Autumn. Honda FY2011 Rating Review
 Honda Information Meeting 212 Autumn Honda FY211 Rating Review 1 1 Honda Information Meeting Honda FY211 Rating Review Current Honda Business Business Strategy Automobile Business Motorcycle Business FY13b
Solid performance in a mixed environment
 2014 Full Year Solid performance in a mixed environment Paris, 2014 Full Year Paris, Solid performance and sustained shareholder return in a mixed environment Sales growth, enhanced competitiveness Strong
Presentation of Business Results for the 1st Quarter of FYE 2014
 Presentation of Business Results for the 1st Quarter of FYE 2014 Director of the Boards & CFO, Mitsuru Takahashi July 31, 2013 0 0 Summary Financial results for the 1st quarter of FYE March 2014 Propelled
Consolidated Financial Results for the 1 st Half of FYE 2019
 Consolidated Financial Results for the 1 st Half of SUBARU CORPORATION Toshiaki Okada Corporate Executive Vice President & CFO November 5 th, 2018 1 Summary Consolidated Financial Results for the 1 st
Presentation on Business Results for the 1st-Half of Fiscal Year Ending March 31, 2017
 Presentation on Business Results for the 1st-Half of Fiscal Year Ending March 31, 2017 November 17, 2016 This presentation contains forward-looking statements relating to expected future performance as
Nordex AG. Nordex AG. Conference Call Q Nordex AG Conference Call Q May 26, May 26, Page 1
 Nordex AG Nordex AG Conference Call Q1 2008 Nordex AG Conference Call Q1 2008 May 26, 2008 May 26, 2008 Page 1 Highlights in Q1/2008 Financial highlights Total revenue up 50% in Q1/08 compared to Q1/07
XML Publisher Balance Sheet Vision Operations (USA) Feb-02
 Feb-02") Page:1 Apr-01 May-01 Jun-01 Jul-01 ASSETS Current Assets Cash and Short Term Investments 15,862,304 51,998,607 9,198,226 Accounts Receivable - Net of Allowance 2,560,786
Page:1 Apr-01 May-01 Jun-01 Jul-01 ASSETS Current Assets Cash and Short Term Investments 15,862,304 51,998,607 9,198,226 Accounts Receivable - Net of Allowance 2,560,786
INVESTOR PRESENTATION Q2 and H RESULTS JULY 26, 2018
 INVESTOR PRESENTATION Q2 and H1-2018 RESULTS JULY 26, 2018 Safe Harbor Statement This presentation contains statements about management's future expectations, plans and prospects of our business that constitute
INVESTOR PRESENTATION 2016 ANNUAL AND Q4 RESULTS FEBRUARY 23, February 23, 2017 Page 1
 INVESTOR PRESENTATION 2016 ANNUAL AND Q4 RESULTS FEBRUARY 23, 2017 February 23, 2017 Page 1 Safe Harbor Statement This presentation contains statements about management's future expectations, plans and
Financial Results for Third Quarter FY2018. SHIMA SEIKI MFG., LTD. February, 2019
 Financial Results for Third Quarter FY2018 SHIMA SEIKI MFG., LTD. February, 2019 Summary of Operating Results for 3Q of the Fiscal Year Ending March 31, 2019 (Terms: Millions of yen) FY2018 3Q FY2017 3Q
FULL YEAR REPORT, 2017 TELEPHONE/AUDIO CONFERENCE 8 FEBRUARY 2018, AT CET TOMMY ANDERSSON, PRESIDENT AND CEO HELENA WENNERSTRÖM, EVP AND CFO
 TELEPHONE/AUDIO CONFERENCE 8 FEBRUARY 2018, AT 15.30 CET TOMMY ANDERSSON, PRESIDENT AND CEO HELENA WENNERSTRÖM, EVP AND CFO DIRECT LINK AUDIOCAST: HTTPS://TV.STREAMFABRIKEN.COM/BULTEN Q4 2017 TELECONFERENCE:
SIX MONTHS REPORT, JAN JUN 2018
 SIX MONTHS REPORT, JAN JUN 2018 TELEPHONE/AUDIO CONFERENCE 11 JULY 2018, AT 11.00 CET TOMMY ANDERSSON, PRESIDENT AND CEO HELENA WENNERSTRÖM, EVP AND CFO DIRECT LINK AUDIOCAST: HTTPS://TV.STREAMFABRIKEN.COM/BULTEN
Financial Results for the First Quarter Fiscal Year Ending December 2015 Investor Relations Presentation Materials
 Financial Results for the First Quarter Fiscal Year Ending December 2015 Investor Relations Presentation Materials ISEKI & CO., LTD. Susumu Tada, Director & Senior managing executive officer August 7,
FY2009 First Quarter Financial Results
 FY2009 First Quarter Financial Results Three months ended June 30, 2008 -prepared in accordance with U.S.GAAP- Toyota Motor Corporation August 7, 2008 Cautionary Statement with Respect to Forward-Looking
Investor Presentation HY2018. Maître Chocolatier Suisse Depuis 1845
 Investor Presentation HY2018 Agenda 1. Performance Highlights HY2018 2. P&L and B/S Details HY2018 3. Outlook 2018 July 24, 2018 HY 2018 Investor Presentation 2 Performance Highlights HY2018 P&L Statement
ASMI ANNUAL MEETING OF SHAREHOLDERS 2015
 ASMI ANNUAL MEETING OF SHAREHOLDERS 2015 Chuck del Prado, President & CEO May 21, 2015 ASMI annual meeting of shareholders 2015 ASMI SAFE HARBOR STATEMENTS Safe Harbor Statement under the U.S. Private
Q Earnings Financial Results for the First Quarter Ended June 30, July 30, 2015 OMRON Corporation
 Q1 2015 Earnings Financial Results for the First Quarter Ended June 30, 2015 July 30, 2015 OMRON Corporation Summary FY2015 Q1 Results Sales & operating income in line with internal guidance (sales up
Millions of yen. (except for per share amounts) Change (%) Millions of yen (except for per share amounts)
 Change (%) Millions of yen (except for per share amounts)") August 3, Highlights of Consolidated Results for the 1st Quarter of Fiscal Year ending 2016 (except for per share amounts) 2014 Y 177,050 Y 160,436 10.4 Operating income 15,273 16,490-7.4 Current profits
August 3, Highlights of Consolidated Results for the 1st Quarter of Fiscal Year ending 2016 (except for per share amounts) 2014 Y 177,050 Y 160,436 10.4 Operating income 15,273 16,490-7.4 Current profits
1Q of FY ending December 31, (0.2) (1.9) 11.3 (0.2) (0.2) (0.2) (0.2) (1.2) (89.2) 0.1
 (1.9) 11.3 (0.2) (0.2) (0.2) (0.2) (1.2) (89.2) 0.1") August 6, ISEKI & CO., LTD. Supplementary Information to Consolidated Financial Results (April 1, June 30, ) I. Consolidated business results for the three months ended June 30, (Billions of yen, %) Year-on
August 6, ISEKI & CO., LTD. Supplementary Information to Consolidated Financial Results (April 1, June 30, ) I. Consolidated business results for the three months ended June 30, (Billions of yen, %) Year-on
Interim Report. Automotive industry. creating the future. forming real value. 1st quarter 2012
 creating the future. forming real value. Interim Report Automotive industry 1st quarter 2012 World premiere in the 1st quarter 2012: The dmc 60 h linear. Engine block, machined by dmc 60 h linear Dear
Business Results for Nine Months (April-December, 2018) of FY2018 Telephone conference
 of FY2018 Telephone conference") 1 Business Results for Nine Months (April-December, 218) of FY218 Telephone conference January 31, 219 Presented by Takeshi Horikoshi Takuya Imayoshi Executive Officer and CFO Executive Officer and General
1 Business Results for Nine Months (April-December, 218) of FY218 Telephone conference January 31, 219 Presented by Takeshi Horikoshi Takuya Imayoshi Executive Officer and CFO Executive Officer and General
Financial Results Presentation
 Financial Results Presentation Consolidated Results For Fiscal Year 2016 AMADA HOLDINGS CO., LTD. May 12, 2017 Consolidated Income Statement Results Consolidated Results Net sales Operating income Orders
(1) Consolidated business results (% of change from same period in the previous year)
 Consolidated business results (% of change from same period in the previous year)") Date: February 12, 2019 Summary of Consolidated Financial Statements for the Fiscal Year 2018 ended December 31, 2018 (IFRS basis) (All financial information has been prepared based on the original Japanese-language
Date: February 12, 2019 Summary of Consolidated Financial Statements for the Fiscal Year 2018 ended December 31, 2018 (IFRS basis) (All financial information has been prepared based on the original Japanese-language
Consolidated Financial Results for the Fiscal Year Ended March 31, 2018 [Japanese GAAP]
![Consolidated Financial Results for the Fiscal Year Ended March 31, 2018 [Japanese GAAP]](/thumbs/87/97109926.jpg "Consolidated Financial Results for the Fiscal Year Ended March 31, 2018 [Japanese GAAP]") This is an abridged translation of the original document in Japanese and is intended for reference purposes only. In the event of any discrepancy between this translated document and the Japanese original,
This is an abridged translation of the original document in Japanese and is intended for reference purposes only. In the event of any discrepancy between this translated document and the Japanese original,
Business Report for Q1 FY ending March 31, 2019 (April-June 2018)
") Business Report for Q1 FY ending March 31, 2019 (April-June 2018) Wacom Chapter 2 Wacom Co., Ltd. (TSE 1st Sec. Code: 6727) Q1 FY 03/19 Results Overview Consolidated net sales of JPY 17.9 bn (YOY +12%)
Business Report for Q1 FY ending March 31, 2019 (April-June 2018) Wacom Chapter 2 Wacom Co., Ltd. (TSE 1st Sec. Code: 6727) Q1 FY 03/19 Results Overview Consolidated net sales of JPY 17.9 bn (YOY +12%)
Highlights of Consolidated Results for the Nine Months and the Third Quarter of Fiscal Year ending March 31, 2017
 February 8, 2017 Highlights of Consolidated Results for the Nine Months and the Third Quarter of Fiscal Year ending March 31, 2017 (except for per share amounts) Nine months ended Nine months ended December
PERFORMANCE. 48 Financial
 PERFORMANCE 48 Financial 48 Segment Information 5 Financial and Non-Financial Highlights 52 1-Year Financial Data 54 Operating and Financial Review 6 Consolidated Statement of Financial Position 62 Consolidated
Half Year Results. for the six months ended 30 November January Chairman Chris Stone CEO Adam Palser CFO Brian Tenner
 Half Year Results for the six months ended 30 November 2017 16 January 2018 Chairman Chris Stone CEO Adam Palser CFO Brian Tenner Agenda Overview and strategy update Financial highlights Financial performance
3 rd Quarter FY2018. Financial Results. ended Dec. 31, 2017
 3 rd Quarter FY2018 Financial Results ended Dec. 31, 2017 1. 3 rd Quarter FY2018 Financial Results 2. FY2018 Financial Forecasts 1-1) Overview of 3 rd Quarter Financial Results
Q Earnings Financial Results for the First Quarter Ended June 30, July 29, 2014 OMRON Corporation
 Q1 2014 Earnings Financial Results for the First Quarter Ended June 30, 2014 July 29, 2014 OMRON Corporation Contents 1. FY14 Overview P. 2 2. Q1 Results P. 4 3. H1 Forecast P. 11 4. Full-Year Forecast
Fuji Heavy Industries Ltd.
 President & CEO, Yasuyuki Yoshinaga Fuji Heavy Industries Ltd. May 9, 2014 0 Business Results for the FYE2014 ( 100M) Consolidated automobile sales FYE2013 FYE2014 YoY 724,000 825,000 High +13.9 % Net
November 16th, 2009 GMO HOSTING & SECURITY, INC. (Mothers of the Tokyo Stock Exchange 3788)
") Theme: Managed Hosting Services: Active Even in Recession Security Services (Electronic Authentication Services) have begun generating results, as a result of global business development Presentation:
Theme: Managed Hosting Services: Active Even in Recession Security Services (Electronic Authentication Services) have begun generating results, as a result of global business development Presentation:
PRESS RELEASE Q1- Δ
 PRESS RELEASE Besi Reports Q1-16 Revenue and Net Income of 79.0 Million and 8.0 Million, Respectively. Q1-16 Orders Increase by 34.4% Sequentially vs. Q4-15. Net Cash Position Increases to 148.4 Million
Dear Investors. We announced our financial results for the first quarter of 2017 on May 10. This document is a summary of Q & A on that.
 Dear Investors We announced our financial results for the first quarter of 2017 on May 10. This document is a summary of Q & A on that. Agenda Management analysis Questions (including assumed ones) and
Six months of FY ending December 31, (0.4) (1.9) 22.5 (0.4) (0.3) (0.4) (0.1) (0.4) (0.7) (2.0) 0.9 (1.
 (1.9) 22.5 (0.4) (0.3) (0.4) (0.1) (0.4) (0.7) (2.0) 0.9 (1.") November 11, ISEKI & CO., LTD. Supplementary Information to Consolidated Financial Results (April 1, September 30, ) I. Consolidated business results for the six months ended September 30, (Billions of
November 11, ISEKI & CO., LTD. Supplementary Information to Consolidated Financial Results (April 1, September 30, ) I. Consolidated business results for the six months ended September 30, (Billions of
MPI Corporation (6223.TT)
") MPI Corporation (6223.TT) Credit Suisse 17th Annual Asian Technology Conference Presentation Disclaimer The information herein contains forward-looking statements. We have based these forward-looking statements
MPI Corporation (6223.TT) Credit Suisse 17th Annual Asian Technology Conference Presentation Disclaimer The information herein contains forward-looking statements. We have based these forward-looking statements
Forward-Looking Statements. Consolidated Financial Results for the 3rd Quarter of Fiscal Year François-Xavier Roger Chief Financial Officer
 Consolidated Financial Results for the 3rd Quarter of Fiscal Year 2014 François-Xavier Roger Chief Financial Officer February 5, 2015 Forward-Looking Statements This presentation contains forward-looking
Consolidated Financial Results FY2015 Q2
 Consolidated Financial Results FY2015 Q2 October 30, 2015 Rudolf van Houten Acting CFO & Group Financial Controller Important Notice Forward-Looking Statements This presentation contains forward-looking
PRESS RELEASE. 26 April
 PRESS RELEASE BE Semiconductor Industries Announces Q1-18 Results Solid Performance as Revenue and Net Income Up 40.5% and 52.7%, Respectively, vs. Q1-17 Duiven, the Netherlands, April 26, 2018 - BE Semiconductor
FINANCIAL SUMMARY FOR THE FIRST QUARTER ENDED JUNE 30, 2009
 Company Name: ANRITSU CORPORATION (Code Number:6754) Listed at : Tokyo Stock Exchange URL http://www.anritsu.co.jp/ Representative: Hiromichi Toda ; President and Director Contact Person: Tetsuo Kawabe
Financial & Business Highlights For the Year Ended June 30, 2017
 Financial & Business Highlights For the Year Ended June, 17 17 16 15 14 13 12 Profit and Loss Account Operating Revenue 858 590 648 415 172 174 Investment gains net 5 162 909 825 322 516 Other 262 146
Financial Results for the Second Quarter Ended September 30, 2013 (FY13 Q1-Q2)
") Financial Results for the Second Quarter Ended September 30, 2013 (FY13 Q1-Q2) October 29, 2013 OMRON Corporation Omron Corporation Contents 1. FY13 1H (Q1-Q2) Results & Full-Year Forecast FY13 1H Results
Financial Results for the Second Quarter Ended September 30, 2013 (FY13 Q1-Q2) October 29, 2013 OMRON Corporation Omron Corporation Contents 1. FY13 1H (Q1-Q2) Results & Full-Year Forecast FY13 1H Results
First Quarter Results (3-month results ended June 30, 2013)
") Fiscal Year 213 (ending March 31, 214) First Quarter Results (3-month results ended June 3, 213) Brother Industries, Ltd. August 6, 213 Information on this report, other than historical facts, refers to
Fiscal Year 213 (ending March 31, 214) First Quarter Results (3-month results ended June 3, 213) Brother Industries, Ltd. August 6, 213 Information on this report, other than historical facts, refers to
FY2018 Financial Result <Supplement>
 FY2018 Financial Result February 13, 2019 Round off to the first decimal place (the same shall apply hereafter) Summary Higher net sales but lower net income Net sales: Steady expansion of
Financial Results for FY2014
 Financial Results for FY2014 Mitsubishi Motors Corporation April 24, 2015 FY2014 Financial Results NEW 2016 MITSUBISHI OUTLANDER 1 FY2014 Results Summary (vs. FY2013 and Feb. 3 FY2014 Forecast) Achieved
Press Conference. Annual Results Hannover, 7 March 2019
 Press Conference Annual Results 2018 Hannover, 7 March 2019 Agenda 1 2 3 4 5 6 7 Group overview Property & Casualty reinsurance Life & Health reinsurance Investments Solvency II reporting as at 31 December
Driving profitable growth
 Mid-Year Report 2017 Driving profitable growth Key figures as of 30 June 2017 Sales in CHF million 1 992 EBIT in CHF million Net profit in CHF million 1 863 1 802 168 42% GF Piping Systems 826 CHF million
Interim Results for the 6 months to 30 September NOVEMBER 2010
 Interim Results for the 6 months to 30 September 2010 8 NOVEMBER 2010 Nick Robertson Introduction Strong H1 Retail sales up 50%, group revenues up 45% Strong UK and international retail sales, up 26% and
HALF-YEAR 2016 INVESTOR PRESENTATION
 HALF-YEAR 2016 INVESTOR PRESENTATION AGENDA 1. Performance Highlights HY2016 2. P&L and B/S Details HY2016 3. Outlook Environment 2016 Investor Presentation HY2016 July 22, 2016 2 PERFORMANCE HIGHLIGHTS
GS Yuasa Corporation Consolidated Earnings Report for the. (Japanese GAAP)
") GS Yuasa Corporation Consolidated Earnings Report for the December 31, 2017 (Japanese GAAP) February 2, 2018 Stock listing: Tokyo Stock Exchange Securities code: 6674 URL: http://www.gs-yuasa.com/en Representative:
GS Yuasa Corporation Consolidated Earnings Report for the December 31, 2017 (Japanese GAAP) February 2, 2018 Stock listing: Tokyo Stock Exchange Securities code: 6674 URL: http://www.gs-yuasa.com/en Representative:
Investor Teleconference Presentation Third Quarter October 25, 2006
 Investor Teleconference Presentation October 25, 10/25/06 2 Earnings Teleconference Forward Looking Statements This document contains forward-looking statements within the meaning of the Private Securities
Financial Results for the Quarter ended June 30, 2017
 Financial Results for the Quarter ended June 30, 2017 KITO CORPORATION TSE 1st Section: 6409 August 9, 2017 1 FY2017 Q1 Summary 1. Market Environment There remains uncertainty due to current political
Positive trend in earnings and strong cash flow
 Positive trend in earnings and strong cash flow Presentation of the Q3/2017 result Martin Lindqvist, President & CEO Håkan Folin, CFO October 25, 2017 Agenda Q3/2017 and performance by division Financials
GS Yuasa Corporation Consolidated Earnings Report for the Nine Months ended December 31, 2018 (Japanese GAAP)
") GS Yuasa Corporation Consolidated Earnings Report for the (Japanese GAAP) February 12, 2019 Stock listing: Tokyo Stock Exchange Securities code: 6674 URL: http://www.gs-yuasa.com/en/ Representative: Osamu
GS Yuasa Corporation Consolidated Earnings Report for the (Japanese GAAP) February 12, 2019 Stock listing: Tokyo Stock Exchange Securities code: 6674 URL: http://www.gs-yuasa.com/en/ Representative: Osamu
Financial Results for the Second Quarter Fiscal Year Ending March 2015 Investor Relations Presentation Materials ISEKI & CO., LTD.
 Financial Results for the Second Quarter Fiscal Year Ending March 2015 Investor Relations Presentation Materials ISEKI & CO., LTD. Noriyuki Kimura, President November 14, 2014 Index 1. Outline of Financial
Financial Results for the Third Quarter Ended December 31, 2012 (FY12 Q3)
") Financial Results for the Third Quarter Ended December 31, 2012 (FY12 Q3) January 30, 2013 OMRON Corporation Omron Corporation Contents 1. FY12 Q3 & Full-Year Overview P.2 2. FY12 Q3 Results & Full-Year
Financial Results for the Third Quarter Ended December 31, 2012 (FY12 Q3) January 30, 2013 OMRON Corporation Omron Corporation Contents 1. FY12 Q3 & Full-Year Overview P.2 2. FY12 Q3 Results & Full-Year
HARALD WILHELM Chief Financial Officer AIRBUS GROUP Q1 RESULTS 2016
 HARALD WILHELM Chief Financial Officer AIRBUS GROUP Q1 RESULTS 2016 SAFE HARBOUR STATEMENT 2 DISCLAIMER This presentation includes forward-looking statements. Words such as anticipates, believes, estimates,
Consolidated Results Presentation for FY2018 Ended December 31, 2018 EBARA (6361) February 14, 2019
 February 14, 2019") Consolidated Presentation for Ended December 31, 2018 EBARA (6361) February 14, 2019 1. Summary of Executive Officer Responsible for Finance & Accounting Akihiko Nagamine 2.Projection for 3.Progress of
Consolidated Presentation for Ended December 31, 2018 EBARA (6361) February 14, 2019 1. Summary of Executive Officer Responsible for Finance & Accounting Akihiko Nagamine 2.Projection for 3.Progress of
INVESTOR PRESENTATION
 INVESTOR PRESENTATION Q1 2018 RESULTS April 19, 2018 October 26, 2016 ASM proprietary information 2018 ASM CAUTIONARY NOTE REGARDING FORWARD-LOOKING STATEMENTS Cautionary Note Regarding Forward-Looking
Overview of 1H, FY3/2013 performance. Sumitomo Mitsui Financial Group, Inc. November 14, 2012
 Overview of FY3/213 performance Sumitomo Mitsui Financial Group, Inc. November 14, 212 Overview of FY3/213 performance SMFG consolidated net income: 1H results exceeded May forecast; revised full year
FY18 3rd Quarter Financial Results
 3rd Quarter Financial Results Honda Motor Co., Ltd. February 2, 2018 Clarity Plug-In Hybrid (U.S.) 1 Topics -Outline of Results Summary - Honda Group Unit Sales - Main Markets - News Topics - Financial
FY19 2nd Quarter Financial Results
 2nd Quarter Financial Results CR-V (Japan) Honda Motor Co., Ltd. October 30, 2018 1 Topics Outline of 2nd Quarter Financial Results and Financial s 2nd Quarter Financial Results and Financial s 2 Outline
First Quarter of the Fiscal Year Ending December 31, 2015 Unicharm Presentation Materials for Investor Meeting
 First Quarter of the Fiscal Year Ending December 31, 2015 Unicharm Presentation Materials for Investor Meeting May 8, 2015 Takahisa Takahara President and CEO Unicharm Corporation Projections stated herein
PRESS RELEASE. BE Semiconductor Industries N.V. Announces Q3-18 Results
 PRESS RELEASE BE Semiconductor Industries N.V. Announces Q3-18 Results Revenue and Net Income of 116.7 Million and 29.3 Million, Respectively Operating Profit Exceeds Expectations. Orders Up 25.0% vs.
FY2016 First Half Financial Results
 FY2016 First Half Financial Results Mitsubishi Motors Corporation October 28, 2016 We again express our deep apologies to all of our customers and all involved for the trouble caused by the improper conduct
Government Pension Fund Global
 Government Pension Fund Global Annual report 218 Oslo, 27 February 219 8,256 billion kroner in the fund Market value as at 31.12.218. Billions of kroner 9, Value Percentage share 8,256 9, 8, Equity investments
Q2 FY2014 Earnings Presentation November 8, 2013
 Q2 FY2014 Earnings Presentation November 8, 2013 Important Notice Forward Looking Statements This presentation contains statements that contain forward looking statements including, but without limitation,
H1/2017 Results u-blox Holding AG
 H1/2017 Results u-blox Holding AG August 24, 2017 Thomas Seiler, CEO Roland Jud, CFO locate, communicate, accelerate Disclaimer This presentation contains certain forward-looking statements. Such forward-looking
GS Yuasa Corporation Consolidated Earnings Report for the. (Japanese GAAP)
") GS Yuasa Corporation Consolidated Earnings Report for the (Japanese GAAP) August 9, 2018 Stock listing: Tokyo Stock Exchange Securities code: 6674 URL: http://www.gs-yuasa.com/en/ Representative: Osamu
GS Yuasa Corporation Consolidated Earnings Report for the (Japanese GAAP) August 9, 2018 Stock listing: Tokyo Stock Exchange Securities code: 6674 URL: http://www.gs-yuasa.com/en/ Representative: Osamu
Third Quarter Results (ended December 31, 2015) Brother Industries, Ltd.
 Brother Industries, Ltd.") Fiscal Year 2015 (ending March 31, 2016) Third Quarter Results (ended December 31, 2015) Brother Industries, Ltd. February 2, 2016 Information on this report, other than historical facts, refers to future
Fiscal Year 2015 (ending March 31, 2016) Third Quarter Results (ended December 31, 2015) Brother Industries, Ltd. February 2, 2016 Information on this report, other than historical facts, refers to future
FY2017 Q1 Earnings. Financial Results for the First Quarter Ended June 30, July 27, 2017 OMRON Corporation
 FY2017 Q1 Earnings Financial Results for the First Quarter Ended June 30, 2017 July 27, 2017 OMRON Corporation Summary Q1 Results VG2.0 got off to a good start, achieving a significant sales and profit
Eurozone Economic Watch. November 2017
 Eurozone Economic Watch November 2017 Eurozone: improved outlook, still subdued inflation Our MICA-BBVA model for growth estimates for the moment a quarterly GDP figure of around -0.7% in, after % QoQ
FY 2017 Presentation
 FY 2017 Presentation 1 2 At a glance Overview FY 2017 YoY revenue growth of 2.2% to EUR 82.5 mn (FY 2016: EUR 80.7 mn) in a challenging year after 13.5% decline at the end of H1/17 (compared YoY) New order