(4) Number of outstanding shares (common stock) (Shares) 1) Number of outstanding shares at end of period (including treasury stock)
|
|
|
- Anissa Bertha Manning
- 5 years ago
- Views:
Transcription
1
2 * Notes (1) Changes in significant subsidiaries during the period (Changes in specified subsidiaries that accompany with a change in the scope of consolidation) : None New - (Name) Exclusion - (Name) (2) Application of accounting treatment specific to preparation of quarterly consolidated financial statements: Yes (3) Changes in Accounting Principles, Changes in Accounting Estimates, and Retrospective Restatements 1) Changes in accounting principles due to the revision of the accounting standards : None 2) Changes in accounting principles other than 1) : None 3) Changes in accounting estimates : None 4) Retrospective restatement : None (4) Number of outstanding shares (common stock) (Shares) 1) Number of outstanding shares at end of period (including treasury stock) FY2016 Q3 491,000,000 FY ,000,000 2) Number of treasury stock at end of period FY2016 Q3 49,781,820 FY ,812,829 3) Average number of outstanding shares during period (First nine months) FY2016 Q3 441,205,920 FY2015 Q3 513,060,294 * Indication regarding the status of the implementation of quarterly review procedure This quarterly financial report is exempt from the quarterly review procedure under the Financial Instruments and Exchange Act of Japan. At the time of disclosure of this report, the quarterly review procedure is in progress. * Explanation regarding the appropriate use of forecasts for operating results, other information (Caution with respect to forward-looking statement) The forward-looking statements are based on currently available information and assumptions, contain risks and uncertainty, and do not constitute guarantees of future achievement. Please note that the future results may greatly vary by the changes of various factors. Those factors, which may influence the future results, include economic conditions and the trend of demand in major markets and the fluctuations of foreign exchange rates (mainly US dollar/yen rate, Euro/Yen rate and Indian Rupee/Yen rate). Please refer to the 1. (3) Explanation of Information on Forecasts for Future Including Those for Consolidated Operating Results on page 3 of the [Attachment] for detail such as precondition of the above-mentioned forecast. (Quarterly Results Supplementary Explanatory Materials) Quarterly Results Supplementary Explanatory Materials will be available on our website ( on 6 February 2017.
3 [Attachment] Table of Contents 1. Qualitative Information on Consolidated Results for the Quarterly Period... 2 (1) Explanation of Consolidated Management Results... 2 (2) Explanation of Consolidated Financial Positions... 3 (3) Explanation of Information on Forecasts for Future Including Those for Consolidated Operating Results Summary Information (Notes)... 4 (1) Application of Accounting Treatment Specific to Preparation of Quarterly Consolidated Financial Statements.. 4 (2) Additional Information Quarterly Consolidated Financial Statements (1) Quarterly Consolidated Balance Sheets... 5 (2) Quarterly Consolidated Statements of Income and Quarterly Consolidated Statements of Comprehensive Income (3) Quarterly Consolidated Statements of Cash Flows... 9 (4) Notes to Quarterly Consolidated Financial Statements (Assumption for Going Concern) (Significant Changes in the Amount of Shareholders Equity) (Segment Information) Others Breakdown of Consolidated Net Sales
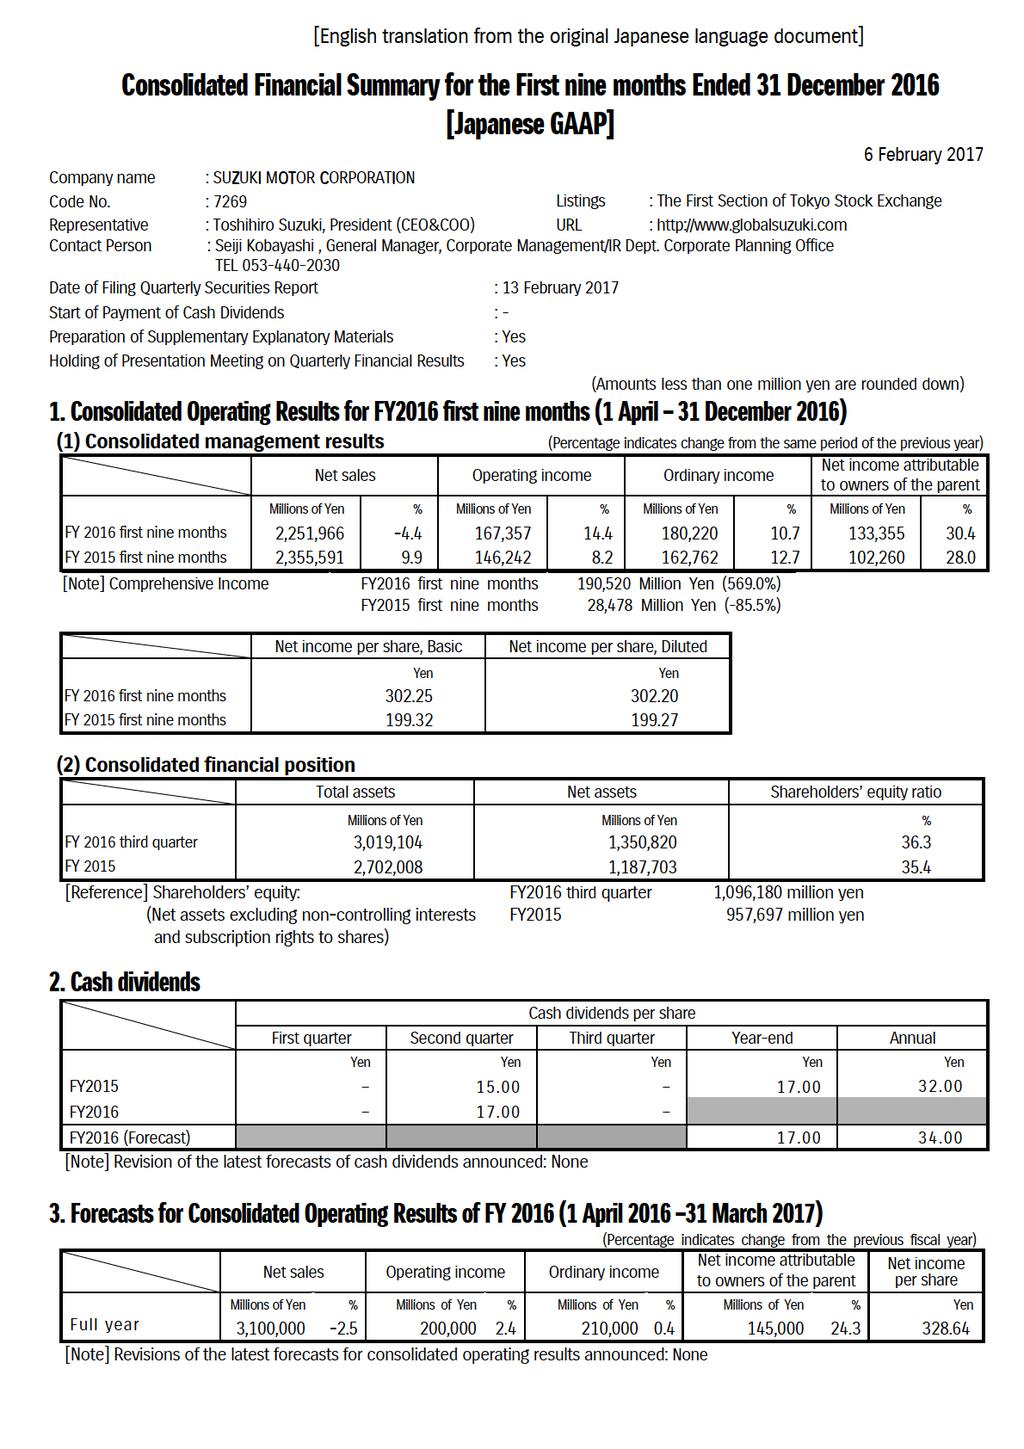
4 1. Qualitative Information on Consolidated Results for the Quarterly Period (1) Explanation of Consolidated Management Results - Management results for FY2016 first nine months The consolidated net sales of this third quarter (April 2016 to December 2016) decreased by billion (4.4%) to 2,252.0 billion compared to the corresponding period of the previous fiscal year. The Japanese domestic net sales decreased by 28.2 billion (3.8%) to billion year-on-year mainly owing to decrease in minivehicle and OEM sales, despite increase in sub-compact and standard-sized vehicle sales. The overseas net sales decreased by 75.4 billion (4.7%) to 1,526.7 billion year-on-year mainly owing to decrease in automobile sales in Indonesia and Pakistan, and the impact of the exchange rate, despite increase in automobile sales in areas including India and Europe. In terms of the consolidated income, the operating income increased by 21.2 billion (14.4%) to billion year-on-year mainly owing to increase in automobile sales in India and Europe, despite the impact of the exchange rate. The ordinary income increased by 17.4 billion (10.7%) to billion year-on-year. The net income attributable to owners of the parent increased by 31.1 billion (30.4%) to billion year-on-year partly owing to increase in gain on sales of investment securities, in addition to increase in the ordinary income. <The operating results by business segmentation> (Automobile) The Japanese domestic automobile net sales decreased year-on-year mainly owing to decrease in minivehicle and OEM sales, despite making efforts to expand sales and strengthen products such as by adding variants installed with newly-developed hybrid system to the SOLIO and SOLIO Bandit sub-compact and standard-sized vehicle and introducing new model, the SPACIA Custom Z to the SPACIA minicar. The overseas automobile net sales decreased year-on-year mainly owing to decrease in sales in Indonesia and Pakistan, and the impact of the exchange rate, despite increase in sales in areas including India and Europe. Consequently, the net sales of the automobile business decreased by 71.6 billion (3.4%) to 2,059.1 billion year-on-year. The operating income increased by 15.7 billion (10.7%) to billion year-on-year mainly owing to increase in sales in India and Europe, despite the impact of the exchange rate. (Motorcycle) The net sales decreased by 29.7 billion (17.2%) to billion year-on-year mainly owing to decrease in sales in Europe, North America, and Asia, and the impact of the exchange rate. The operating loss of 10.1 billion in the corresponding period of the previous fiscal year became an operating loss of 3.6 billion. (Marine and Power products, etc.) The net sales decreased by 2.3 billion (4.5%) to 49.7 billion year-on-year mainly owing to the impact of the exchange rate, despite increase in the sales of the outboard motors in the North America. The operating income decreased by 1.0 billion (10.1%) to 8.9 billion year-on-year. <The operating results by geographical areas > (Japan) The net sales were flat year-on-year at 1,325.4 billion year-on-year mainly owing to expansion of triangle trade via Japan. The operating income increased by 1.5 billion (2.5%) to 61.3 billion year-on-year mainly owing to the effect of improving sales mix of sub-compact and standard-sized vehicle sales, despite the impact of the exchange rate. (Europe) The net sales increased by 2.0 billion (0.5%) to billion year-on-year partly owing to great sales of the VITARA compact SUV and the sales contribution of the BALENO, and the IGNIS the all-new cars. The operating income increased by 4.2 billion (66.7%) to 10.5 billion year-on-year. 2
5 (Asia) The net sales decreased by 47.1 billion (4.2%) to 1,083.9 billion year-on-year mainly owing to the decrease in sales in Indonesia and Pakistan, and the impact of the exchange rate, despite the increase in the automobile sales in India. The operating income increased by 9.2 billion (11.2%) to 91.5 billion year-on-year owing to increase in income in India and other areas, despite the impact of the exchange rate. (Other areas) The net sales decreased by 13.4 billion (12.0%) to 98.9 billion year-on-year mainly owing to decrease in the motorcycle sales in North America. The operating income increased by 1.4 billion (132.3%) to 2.5 billion year-on-year owing to the improvement of income in the US, Latin America, and other areas. (2) Explanation of Consolidated Financial Positions 1) Assets, liabilities and net assets With respect to the financial positions at the end of this consolidated third quarter, total assets were 3,019.1 billion (increased by billion from the end of previous consolidated fiscal year), total liabilities were 1,668.3 billion (increased by billion from the end of previous consolidated fiscal year) mainly owing to issuance of billion of convertible bond for strategic investment to strengthen the Group s competitive position which is representing Gujarat project in India. Consequently, total net assets were 1,350.8 billion (increased by billion from the end of previous consolidated fiscal year). 2) Cash flows Cash flow provided by operating activities for this first nine months of the consolidated fiscal year amounted to billion ( billion was provided in the same period of the previous fiscal year). In investing activities, billion was used for the acquisition of securities, property, plant and equipment, etc. ( billion was used in the same period of the previous fiscal year). As a result, free cash flow amounted to 11.4 billion of positive ( 18.1 billion of negative in the same period of the previous fiscal year). In financing activities, billion was provided by proceeds from issuance of billion of convertible bond, despite repayment of loans payable to bank ( billion was used for purchase of treasury stock and other purposes in the same period of the previous fiscal year). As a result, the balance of cash and cash equivalents at the end of this consolidated third quarter was billion, which increased by billion from the end of the previous consolidated fiscal year. (3) Explanation of Information on Forecasts for Future including Those for Consolidated Operating Results With respect to the forecasts for the consolidated operating results, since the future outlook such as the exchange rate is unclear, they remain unchanged from the previous forecasts. The Group will work as one to reform in every field and pursue the business activity to accomplish more than the below forecasts for the consolidated operating results. (Forecasts for The Consolidated Operating Results Full Year) Net Sales Operating income Ordinary income Net income attributable to owners of the parent Foreign exchange rates 3,100.0 billion (down 2.5% year-on-year) billion (up 2.4% year-on-year) billion (up 0.4% year-on-year) billion (up 24.3% year-on-year) 106 yen/us$, 117 yen/euro, 1.59 yen/indian Rupee 0.80 yen/100 Indonesian Rupiah, 3.02 yen/thai Baht * The forecasts for consolidated operating results mentioned above are based on currently available information and assumptions, contain risks and uncertainty, and do not constitute guarantees of future achievement. Please note that the actual results may greatly vary by the changes of various factors. Those factors, which may influence the actual results, include economic conditions and the trend of demand in major markets and the fluctuation of foreign exchange rate (mainly US dollar/yen rate, Euro/Yen rate and Indian Rupee/Yen rate). 3
6 2. Summary Information (Notes) (1) Application of Accounting Treatment Specific to Preparation of Quarterly Consolidated Financial Statements [Calculation of income taxes] With respect to income taxes, the effective tax rates were reasonably estimated after applying the tax effect accounting to the income before income taxes of the consolidated fiscal year. And income tax was calculated by multiplying the income before income taxes by this estimated effective tax rate. (2) Additional Information [Application of Implementation Guidance on Recoverability of Deferred Tax Assets] The Implementation Guidance on Recoverability of Deferred Tax Assets (Accounting Standards Board of Japan (ASBJ) Statement No.26, 28 March 2016) has been applied from the first quarter of this consolidated fiscal year. 4
7 3. Quarterly Consolidated Financial Statements (1) Quarterly r l Consolidated o d Balance Sheets et FY2015 (As of 31 March 2016) FY2016 third quarter (As of 31 December 2016) Assets Current assets Cash and deposits 497, ,052 Notes and accounts receivables-trade 335, ,808 Short-term investment securities 279, ,838 Merchandise and finished goods 190, ,909 Work in process 34,311 49,386 Raw materials and supplies 61,921 58,377 Other 240, ,924 Allowance for doubtful accounts (6,188) (5,144) Total current assets 1,632,630 1,868,153 Noncurrent assets Property, plant and equipment 757, ,334 Intangible assets 4,368 3,159 Investments and other assets Investment securities 244, ,614 Other 64,138 63,654 Allowance for doubtful accounts (500) (434) Allowance for investment loss (280) (377) Total investments and other assets 307, ,456 Total noncurrent assets 1,069,377 1,150,950 Total assets 2,702,008 3,019,104 Liabilities Current liabilities Accounts payable-trade 402, ,320 Electronically recorded obligations 64,055 70,503 Short-term loans payable 266, ,027 Income taxes payable 29,486 24,971 Provision for product warranties 66,032 73,343 Other 317, ,461 Total current liabilities 1,145,956 1,079,628 Noncurrent liabilities Bonds with subscription rights to shares - 200,425 Long-term loans payable 262, ,827 Provision for disaster 3,056 2,000 Other provision 9,529 10,591 Liabilities for retirement benefits 56,346 61,863 Other 36,618 26,946 Total noncurrent liabilities 368, ,655 Total liabilities 1,514,305 1,668,283 5
8 FY2015 (As of 31 March 2016) FY2016 third quarter (As of 31 December 2016) Net assets Shareholders equity Capital stock 138, ,014 Capital surplus 144, ,035 Retained earnings 913,656 1,031,949 Treasury stock (191,169) (191,049) Total shareholders equity 1,004,668 1,122,949 Accumulated other comprehensive income Valuation difference on available-for-sale securities 77,624 95,233 Deferred gains or losses on hedges Foreign currency translation adjustment (115,551) (113,641) Accumulated adjustment for retirement benefits (9,580) (8,919) Total accumulated other comprehensive income (46,970) (26,769) Subscription rights to shares Non-controlling interests 229, ,513 Total net assets 1,187,703 1,350,820 Total liabilities and net assets 2,702,008 3,019,104 6
9 (2) Quarterly Consolidated Statements of Income and Quarterly Consolidated Statements of Comprehensive Income (First nine months ended 31 December 2016) Quarterly Consolidated Statements of Income FY2015 first nine months (1 April 31 December 2015) FY2016 first nine months (1 April 31 December 2016) Net sales 2,355,591 2,251,966 Cost of sales 1,715,871 1,605,924 Gross profit 639, ,042 Selling, general and administrative expenses 493, ,684 Operating income 146, ,357 Non-operating income Interest income 9,565 7,596 Dividends income 6,944 3,487 Foreign exchange gains Equity in earnings of affiliates 87 1,585 Other 12,518 6,820 Total non-operating income 29,116 20,161 Non-operating expenses Interest expenses 4,876 3,495 Foreign exchange losses Other 7,447 3,803 Total non-operating expenses 12,596 7,298 Ordinary income 162, ,220 Extraordinary income Gain on sales of noncurrent assets Gain on sales of investment securities 36,760 46,761 Total extraordinary income 37,202 47,545 Extraordinary loss Loss on sales of noncurrent assets Impairment loss 61 6,819 Total extraordinary loss 877 6,973 Income before income taxes 199, ,792 Income taxes 66,736 58,935 Net income 132, ,856 Net income attributable to non-controlling interests 30,091 28,501 Net income attributable to owners of the parent 102, ,355 7
10 Quarterly Consolidated Statements of Comprehensive Income FY2015 first nine months (1 April 31 December 2015) FY2016 first nine months (1 April 31 December 2016) Net income 132, ,856 Other comprehensive income Valuation difference on available-for-sale securities (58,861) 22,511 Deferred gains or losses on hedges Foreign currency translation adjustment (44,770) 9,643 Adjustment for retirement benefits Share of other comprehensive income of associates accounted for using equity method (1,175) (4,211) Total other comprehensive income (103,873) 28,664 Comprehensive income 28, ,520 Comprehensive income attributable to: Comprehensive income attributable to owners of the parent Comprehensive income attributable to non-controlling interests 9, ,615 19,202 36,904 8
11 (3) Quarterly Consolidated Statements of Cash Flows FY2015 first nine months (1 April 31 December 2015) FY2016 first nine months (1 April 31 December 2016) Net cash provided by (used in) operating activities Income before income taxes 199, ,792 Depreciation and amortization 119, ,070 Impairment loss 61 6,819 Increase (decrease) in allowance for doubtful accounts (1,163) (1,005) Interest and dividends income (16,509) (11,084) Interest expenses 4,876 3,495 Foreign exchange losses (gains) 3, Equity in (earnings) losses of affiliates (87) (1,585) Loss (gain) on sales of property, plant and equipment 374 (629) Loss (gain) on sales of investment securities (36,760) (46,761) Decrease (increase) in notes and accounts receivable-trade 23,990 23,398 Decrease (increase) in inventories (27,586) (39,905) Increase (decrease) in notes and accounts payable-trade (16,285) 25,499 Increase (decrease) in accrued expenses (10,695) (22,532) Other, net (45,086) 21,542 Subtotal 196, ,069 Interest and dividends income received 16,340 10,610 Interest expenses paid (5,818) (3,370) Income taxes paid (57,323) (68,085) Net cash provided by (used in) operating activities 149, ,224 Net cash provided by (used in) investing activities Purchase of short-term investment securities (232,095) (194,352) Proceeds from Sale of securities and stock redemption 147, ,543 Purchases of property, plant and equipment (112,230) (133,865) Other, net 28,700 (60,121) Net cash provided by (used in) investing activities (167,889) (223,795) Net cash provided by (used in) financing activities Net increase (decrease) in short-term loans payable 48,921 (84,893) Proceeds from long-term loans payable 33,400 61,000 Repayment of long-term loans payable (38,052) (32,256) Proceeds from issuance of bonds with subscription rights to shares - 200,500 Purchase of treasury stock (460,478) (2) Cash dividends paid (16,156) (15,004) Dividends paid to non-controlling interests (7,695) (9,244) Other, net (337) (3,150) Net cash provided by (used in) financing activities (440,399) 116,947 Effect of exchange rate changes on cash and cash equivalents (6,734) (1,837) Net increase (decrease) in cash and cash equivalents (465,184) 126,538 Cash and cash equivalents at beginning of period 932, ,088 Cash and cash equivalents at end of period 467, ,627 9
12 (4) Notes to Quarterly Consolidated Financial Statements (Assumption for Going Concern) None (Significant Changes in the Amount of Shareholders Equity) None (Segment Information) 1. Net sales and Profit (Loss) of Each Reportable Segment FY2015 first nine months (1 April 31 December 2015) Automobile Motorcycle Reportable Segments Marine & Power products, etc. Net Sales 2,130, ,883 52,019 2,355,591 Segment profit (loss) *1 146,379 (10,074) 9, ,242 Total FY2016 first nine months (1 April 31 December 2016) Automobile Motorcycle Reportable Segments Marine & Power products, etc. Net Sales 2,059, ,174 49,693 2,251,966 Segment profit (loss) *1 162,072 (3,651) 8, ,357 Total [Notes] *1. Segment profit (loss) is an operating income in the quarterly consolidated statements of income. 2. Main products and services of each segment are as follows. Segment Automobile Motorcycle Marine and Power products, etc. Main products and services Minivehicles, Sub-compact vehicles, Standard-sized vehicles Motorcycles, All terrain vehicles Outboard motors, Engines for snowmobiles, etc., Motorized wheelchairs, Electro senior vehicles, Houses 2. Impairment Losses on Noncurrent Assets or Goodwill of Each Segment FY2016 first nine months (1 April 31 December 2016) (Significant Impairment Losses on Noncurrent Assets) Impairment losses were recognized by 6,237 million in Automobile segment, by 224 million in Motorcycle segment, and by 357 million in Marine and Power products, etc. segment respectively. The amount of the relevant impairment losses recognized were 6,819 million in this first nine months of consolidated fiscal year. 10
13 (Reference) As reference information, operating results by geographical areas are as follows; [O perating p a n Results by b Geographical G h Areas] FY2015 first nine months (1 April 31 December 2015) Japan Europe Asia Other areas Total Eliminations Consolidated Net Sales 1) Net sales to external customers 941, ,813 1,066, ,954 2,355,591-2,355,591 2) Internal net sales or transfer among geographical areas 384, ,481 64, ,379 (620,379) - Total 1,326, ,295 1,130, ,315 2,975,970 (620,379) 2,355,591 Operating income 59,786 6,281 82,318 1, ,452 (3,209) 146,242 FY2016 first nine months (1 April 31 December 2016) Japan Europe Asia Other areas Total Eliminations Consolidated Net Sales 1) Net sales to external customers 909, , ,428 98,482 2, 251,966-2,251,966 2) Internal net sales or transfer among geographical areas 415, ,141 84, ,439 (664,439) - Total 1,325, ,328 1,083,853 98,867 2,916,406 (664,439) 2,251,966 Operating income 61,259 10,472 91,498 2, ,707 1, ,357 [Notes] 1. Classification of countries or areas is based on a geographical adjacency. 2. The major countries or areas belonging to classifications other than Japan: (1) Europe... Hungary, Germany,United Kingdom and France (2) Asia... India, Indonesia, Thailand and Pakistan (3) Other Areas... United States, Australia, Mexico and Colombia 3. Classification is based on the location of the Company and its consolidated subsidiaries. 11
14 4. Others [Breakdown of Consolidated Net Sales] FY2015 first nine months (1 April 31 December 2015) FY2016 first nine months (1 April 31 December 2016) (Unit: Thousand) Change Unit Amount Unit Amount Unit Amount Japan , ,980 (15) (26,557) Overseas 1,530 1,405,149 1,589 1,360, (45,031) Automobile Europe , , ,663 North America - 3,377-1,698 - (1,678) Asia 1, ,610 1, , (46,066) [Of which India] [972] [716,621] [1,061] [708,479] [89] [(8,142)] Other areas , ,547 (2) (9,950) Total 2,040 2,130,687 2,083 2,059, (71,589) Japan 46 15, ,603 (0) (1,365) Overseas , ,571 (11) (28,343) Motorcycle Europe 34 31, ,473 (3) (6,718) North America 23 24, ,494 (4) (7,975) Asia , , (7,156) Other areas , ,878 (18) (6,493) Total , ,174 (12) (29,708) Marine & Power products, etc. Japan - 12,025-11,664 - (360) Overseas - 39,994-38,028 - (1,965) Europe - 11,111-9,582 - (1,528) North America - 18,071-17,837 - (233) Asia - 3,410-3, Other areas - 7,401-6,898 - (502) Total - 52,019-49,693 - (2,326) Japan 753, ,247 (28,283) Overseas 1,602,059 1,526,718 (75,340) Europe 293, ,384 4,416 Total North America 45,917 36,030 (9,887) Asia 1,054,902 1,001,978 (52,923) Other areas 207, ,324 (16,946) Total 2,355,591 2,251,966 (103,624) [Notes] Classification is based on the location of external customers. 12
Net sales Operating income Ordinary income
 [English translation from the original Japanese language document] Consolidated Financial Summary for the First Six Months Ended 30 September 2015 [Japanese GAAP] 4 November 2015 Company name : SUZUKI
Net sales Operating income Ordinary income. FY FY2015 (Forecast)
") [English translation from the original Japanese language document] Consolidated Financial Summary for the First nine months Ended 31 December 2015 [Japanese GAAP] 8 February 2016 Company name : SUZUKI
[English translation from the original Japanese language document] Consolidated Financial Summary for the First nine months Ended 31 December 2015 [Japanese GAAP] 8 February 2016 Company name : SUZUKI
FY FY FY2014 (Forecast)
") [English translation from the original Japanese language document] Consolidated Financial Summary for the First nine months Ended 31 December 2014 [Japanese GAAP] 5 February 2015 Company name : SUZUKI
[English translation from the original Japanese language document] Consolidated Financial Summary for the First nine months Ended 31 December 2014 [Japanese GAAP] 5 February 2015 Company name : SUZUKI
Net sales Operating income Ordinary income
 [English translation from the original Japanese language document] Consolidated Financial Summary for the First nine months Ended 31 December 2017 [Japanese GAAP] 5 February 2018 Company name : SUZUKI
[English translation from the original Japanese language document]
![[English translation from the original Japanese language document]](/thumbs/92/109311911.jpg "[English translation from the original Japanese language document]") [English translation from the original Japanese language document] Consolidated Financial Summary for the First Three Months Ended 30 June 2014 [Japanese GAAP] 1 August 2014 Company name : SUZUKI MOTOR
[English translation from the original Japanese language document] Consolidated Financial Summary for the First Three Months Ended 30 June 2014 [Japanese GAAP] 1 August 2014 Company name : SUZUKI MOTOR
[English translation from the original Japanese language document] FY2012 first six months 8,277 Million Yen ( %)
![[English translation from the original Japanese language document] FY2012 first six months 8,277 Million Yen ( %)](/thumbs/92/110846951.jpg "[English translation from the original Japanese language document] FY2012 first six months 8,277 Million Yen ( %)") [English translation from the original Japanese language document] Consolidated Financial Summary for the First six months Ended September 30, 2013 [Japanese GAAP] November 1, 2013 Company name : SUZUKI
[English translation from the original Japanese language document] Consolidated Financial Summary for the First six months Ended September 30, 2013 [Japanese GAAP] November 1, 2013 Company name : SUZUKI
Million Yen Million Yen % FY 2011 First quarter 2,243,765 1,128, FY ,224,344 1,106,
 This document is an English translation of the original Japanese document. If there are any discrepancies between this document and the original Japanese document, the original Japanese document prevails.
Net sales Operating income Ordinary income
 [English translation from the original Japanese language document] Consolidated Financial Summary for FY2014 (1 April 2014 31 March 2015) [Japanese GAAP] 11 May 2015 Company Name : SUZUKI MOTOR CORPORATION
Net sales Operating income Ordinary income Net income
 This document is an English translation of the original Japanese document. If there are any discrepancies between this document and the original Japanese document, the original Japanese document prevails.
3. Forecast of consolidated results for FY 2013 (April 1, 2013 March 31, 2014) (Percentage indicates change from the previous term) Net income
 (Percentage indicates change from the previous term) Net income") [English translation from the original Japanese language document] Financial Results for (April 1, 2012 March 31, 2013) [All financial information has been prepared in accordance with G.A.A.P. in Japan]
[English translation from the original Japanese language document] Financial Results for (April 1, 2012 March 31, 2013) [All financial information has been prepared in accordance with G.A.A.P. in Japan]
FY2015 Financial Results. SUZUKI MOTOR CORPORATION 10 May 2016
 Financial Results SUZUKI MOTOR CORPORATION 10 May 2016 Full-Year Highlights Page2 Worldwide Sales Volume of Automobile 2,861 thousand units, 6 thousand units year-on-year Decrease of sales in Japan, China
FY2017 Financial Results. SUZUKI MOTOR CORPORATION 10 May 2018
 Financial Results SUZUKI MOTOR CORPORATION 10 May 2018 Full-Year Highlights P2 Full-Year Results Consolidated Financial Results Higher earnings and sales, record-high sales and each income *1 Net Sales:
: Yes. Net sales Operating income Ordinary income Net income. Million Yen % Million Yen % Million Yen % Million Yen %
 This document is an English translation of the original Japanese document. If there are any discrepancies between this document and the original Japanese document, the original Japanese document prevails.
Net sales Operating income Ordinary income (27.6)
") Financial Results for the December 31, 2017 (Japanese Accounting Standards) (Consolidated) February 8, 2018 Company name : Nissan Motor Co., Ltd. Code no : 7201 (URL http://www.nissan-global.com/en/ir/)
Financial Results for the December 31, 2017 (Japanese Accounting Standards) (Consolidated) February 8, 2018 Company name : Nissan Motor Co., Ltd. Code no : 7201 (URL http://www.nissan-global.com/en/ir/)
: Yes. Million Yen % Million Yen % Million Yen % Million Yen %
 [English translation from the original Japanese language document] Financial Results for (1 April 2011-31 March 2012) [All financial information has been prepared in accordance with G.A.A.P. in Japan]
Consolidated Financial Statements and Primary Notes
 Consolidated Financial Statements and Primary Notes (1) Consolidated Balance Sheet (As of March 31, 2017) Second Quarter of (As of Assets Current assets Cash and deposits 344,093 401,566 Notes and accounts
FY2018 Second Quarter Financial Results. New Ciaz (India) SUZUKI MOTOR CORPORATION 1 November 2018
 SUZUKI MOTOR CORPORATION 1 November 2018") Second Quarter Financial Results New Ciaz (India) SUZUKI MOTOR CORPORATION 1 November 2018 July Sept. period: Lower net sales and operating income mainly owing to the depreciation of the Indian Rupee Apr.-Sept.
Second Quarter Financial Results New Ciaz (India) SUZUKI MOTOR CORPORATION 1 November 2018 July Sept. period: Lower net sales and operating income mainly owing to the depreciation of the Indian Rupee Apr.-Sept.
Financial Results for the Three Months Ended June 30, 2017 (Japanese Accounting Standards) (Consolidated) July 27, 2017
 (Consolidated) July 27, 2017") Financial Results for the Three Months Ended June 30, 2017 (Japanese Accounting Standards) (Consolidated) July 27, 2017 Company name : Nissan Motor Co., Ltd. Code no : 7201
Financial Results for the Three Months Ended June 30, 2017 (Japanese Accounting Standards) (Consolidated) July 27, 2017 Company name : Nissan Motor Co., Ltd. Code no : 7201
Summary Report of Consolidated Financial Results
 Summary Report of Consolidated Financial Results for the third quarter ended September 30, 2012 October 23,2012 Registered company name: Canon Marketing Japan Inc. Stock listing: Tokyo Stock Exchange,
Financial Results for the First Quarter Ended June 30, 2015
 July 29, 2015 Company name : Nissan Motor Co., Ltd. Code no : 7201 (URL http://www.nissan-global.com/en/ir/) Representative : Carlos Ghosn, President Contact person : Joji
Consolidated Financial Statements Consolidated Balance Sheet
 Consolidated Financial Statements Consolidated Balance Sheet (Ended March 31, 2012) (Ended March 31, 2013) Assets Current assets Cash and deposits 34,440 64,372 Notes and accounts receivable-trade 3,595
Consolidated Financial Statements and Primary Notes
 Consolidated Financial Statements and Primary Notes (1) Consolidated Balance Sheet (As of March 31, 2017) (As of March 31, 2018) Assets Current assets Cash and deposits 344,093 357,027 Notes and accounts
Stock exchange on which the shares are listed : Tokyo Stock Exchange in Japan Code number : 7202 :
 FY2019 Second Quarter Consolidated Financial Results (Japan GAAP) (April 1, 2018 through September 30, 2018) English Translation of the Original Japanese-Language Document November 2, 2018 Company name
FY2016 Financial Results
 Financial Results SWIFT (European specification) SUZUKI MOTOR CORPORATION 12 May 2017 Full-Year Highlights Page2 Full-Year Results Consolidated Financial Results Higher earnings on lower sales, the highest
1. Consolidated performance for the second quarter of fiscal year 2015 (from April 1, 2015 to September 30, 2015)
") Translation October 27, 2015 Consolidated Financial Results for the Second Quarter of the Fiscal Year Ending March 31, 2016 [Japan GAAP] Company name: Mitsubishi Motors Corporation Listing: First Section,
Translation October 27, 2015 Consolidated Financial Results for the Second Quarter of the Fiscal Year Ending March 31, 2016 [Japan GAAP] Company name: Mitsubishi Motors Corporation Listing: First Section,
Stock exchange on which the shares are listed : Tokyo Stock Exchange in Japan Code number : 7202 :
 FY2017 Second Quarter Consolidated Financial Results (Japan GAAP) (April 1, 2016 through September 30, 2016) English Translation of the Original Japanese-Language Document November 7, 2016 Company name
Summary of Consolidated Financial Statements for Second Quarter of Fiscal Year Ending March 31, 2019(Japan GAAP)
") Summary of Consolidated Financial Statements for Second Quarter of Fiscal Year Ending March 31, 2019(Japan GAAP) November 9, 2018 Listed Exchanges: TSE Name of Listed Company: Ishihara Sangyo Kaisha, Ltd.
Summary of Consolidated Financial Statements for Second Quarter of Fiscal Year Ending March 31, 2019(Japan GAAP) November 9, 2018 Listed Exchanges: TSE Name of Listed Company: Ishihara Sangyo Kaisha, Ltd.
FY2011 Consolidated Financial Results (Japan GAAP)
") Consolidated Financial Results (Japan GAAP) (April 1, 2010 through March 31, 2011) English Translation of the Original Japanese-Language Document May 11, 2011 Company name : ISUZU MOTORS LIMITED Stock
Consolidated Financial Results (Japan GAAP) (April 1, 2010 through March 31, 2011) English Translation of the Original Japanese-Language Document May 11, 2011 Company name : ISUZU MOTORS LIMITED Stock
Code number : 7202 :
 FY2014 Second Quarter Consolidated Financial Results (Japan GAAP) (April 1, 2013 through September 30, 2013) English Translation of the Original Japanese-Language Document November 12, 2013 Company name
Consolidated Financial Results For the First Half of the Fiscal Year Ending March 31, 2018 (For the Six Months Ended September 30, 2017)
") Consolidated Financial Results For the First Half of the Fiscal Year Ending March 31, 2018 (For the Six Months Ended September 30, 2017) Prepared in Conformity with Generally Accepted Accounting Principles
Consolidated Financial Results For the First Half of the Fiscal Year Ending March 31, 2018 (For the Six Months Ended September 30, 2017) Prepared in Conformity with Generally Accepted Accounting Principles
Consolidated Financial Results For the Third Quarter of the Fiscal Year Ending March 31, 2019 (For the First Nine Months Ended December 31, 2018)
") Consolidated Financial Results For the Third Quarter of the Fiscal Year Ending March 31, 2019 (For the First Nine Months Ended December 31, 2018) Prepared in Conformity with Generally Accepted Accounting
Consolidated Financial Results For the Third Quarter of the Fiscal Year Ending March 31, 2019 (For the First Nine Months Ended December 31, 2018) Prepared in Conformity with Generally Accepted Accounting
Consolidated Financial Results For the Third Quarter of the Fiscal Year Ending March 31, 2018 (For the First Nine Months Ended December 31, 2017)
") Consolidated Financial Results For the Third Quarter of the Fiscal Year Ending March 31, 2018 (For the First Nine Months Ended December 31, 2017) Prepared in Conformity with Generally Accepted Accounting
Consolidated Financial Results For the Third Quarter of the Fiscal Year Ending March 31, 2018 (For the First Nine Months Ended December 31, 2017) Prepared in Conformity with Generally Accepted Accounting
Consolidated Financial Results For the Third Quarter of the Fiscal Year Ending March 31, 2017
 Consolidated Financial Results For the Third Quarter of the Fiscal Year Ending March 31, 2017 (For the First Nine Months Ended December 31, 2016) Prepared in Conformity with Generally Accepted Accounting
FY2017 Consolidated Financial Results (Japanese Accounting Standards) May 14, 2018
 May 14, 2018") Consolidated Financial Results (Japanese Accounting Standards) May 14, 2018 Company name : Nissan Motor Co., Ltd. Code no : 7201 (URL https://www.nissan-global.com/en/ir/)
Consolidated Financial Results (Japanese Accounting Standards) May 14, 2018 Company name : Nissan Motor Co., Ltd. Code no : 7201 (URL https://www.nissan-global.com/en/ir/)
1. Consolidated performance for the first quarter of fiscal year 2014 (from April 1, 2014 to June 30, 2014)
") Translation July 30, 2014 Consolidated Financial Results for the First Quarter of the Fiscal Year Ending March 31, 2015 [Japan GAAP] Company name: Mitsubishi Motors Corporation Listing: First Section,
Translation July 30, 2014 Consolidated Financial Results for the First Quarter of the Fiscal Year Ending March 31, 2015 [Japan GAAP] Company name: Mitsubishi Motors Corporation Listing: First Section,
Million yen % Million yen % Million yen % Million yen % Six months ended September 30, 2018
 Consolidated Quarterly Financial Results for the Six Months Ended [Japanese GAAP] November 12, 2018 Company: Hokuetsu Corporation Stock Exchange Listing: Tokyo Stock Code: 3865 URL: http://www.hokuetsucorp.com
Net sales Operating profit Ordinary profit. Million yen Million yen Million yen Million yen Six months ended
 Consolidated Financial Statements Summary November 6, 2018 (For the six months ended ) English translation from the original Japanese-language document (All financial information has been prepared in accordance
Consolidated Financial Results (Japanese GAAP) FY2017 ending March 2018 TOPCON CORPORATION Release Date: October 27, 2017
 FY2017 ending March 2018 TOPCON CORPORATION Release Date: October 27, 2017") Consolidated Financial Results (Japanese GAAP) ending March 2018 TOPCON CORPORATION Release Date: October 27, 2017 1. Summary of Second Quarter Results for ending March 2018 (April 1, 2017 - September
Consolidated Financial Results (Japanese GAAP) ending March 2018 TOPCON CORPORATION Release Date: October 27, 2017 1. Summary of Second Quarter Results for ending March 2018 (April 1, 2017 - September
4. Consolidated Financial Statements (1) Consolidated Balance Sheets As of December 31, 2015 ASSETS Current assets: 107, , ,066 54,075
 Consolidated Balance Sheets As of December 31, 2015 ASSETS Current assets: 107, , ,066 54,075") 4. Consolidated Financial Statements (1) Consolidated Balance Sheets As of and 2015 ASSETS Current assets: As of As of Cash and deposits 137,082 107,617 Notes and accounts receivable trade 265,818 290,897
4. Consolidated Financial Statements (1) Consolidated Balance Sheets As of and 2015 ASSETS Current assets: As of As of Cash and deposits 137,082 107,617 Notes and accounts receivable trade 265,818 290,897
Summary of Consolidated Financial Statements for Second Quarter of Fiscal Year Ending March 31, 2018(Japan GAAP)
") Summary of Consolidated Financial Statements for Second Quarter of Fiscal Year Ending March 31, 2018(Japan GAAP) November 10, 2017 Listed Exchanges: TSE Name of Listed Company: Ishihara Sangyo Kaisha,
Summary of Consolidated Financial Statements for Second Quarter of Fiscal Year Ending March 31, 2018(Japan GAAP) November 10, 2017 Listed Exchanges: TSE Name of Listed Company: Ishihara Sangyo Kaisha,
Code number : 7202 :
 FY2013 First Quarter Consolidated Financial Results (Japan GAAP) (April 1, 2012 through June 30, 2012) English Translation of the Original Japanese-Language Document August 3, 2012 Company name : ISUZU
Net income attributable to owners of parent 3rd Quarter of FY2018. Net sales Operating income Ordinary income
 Consolidated Financial Results For the Third Quarter of the Fiscal Year Ending March 31, 2018 (Japan GAAP) February 8, 2018 Company Name : SUBARU CORPORATION. (Tokyo Stock Exchange First Section, Code
1. Consolidated performance for the third quarter of fiscal year 2015 (from April 1, 2015 to December 31, 2015)
") Translation February 3, 2016 Consolidated Financial Results for the Third Quarter of the Fiscal Year Ending March 31, 2016 [Japan GAAP] Company name: Mitsubishi Motors Corporation Listing: First Section,
Translation February 3, 2016 Consolidated Financial Results for the Third Quarter of the Fiscal Year Ending March 31, 2016 [Japan GAAP] Company name: Mitsubishi Motors Corporation Listing: First Section,
Consolidated Financial Results for the First Two Quarters of the Fiscal Year Ending March 31, 2019 (Japan GAAP)
") Consolidated Financial Results for the First Two Quarters of the Fiscal Year Ending March 31, 2019 (Japan GAAP) Name of Listed Company: Yokogawa Electric Corporation (the Company herein) Stock Exchanges
Consolidated Financial Results for the First Two Quarters of the Fiscal Year Ending March 31, 2019 (Japan GAAP) Name of Listed Company: Yokogawa Electric Corporation (the Company herein) Stock Exchanges
Consolidated Financial Summary Second Quarter of FY2015
 Consolidated Financial Summary Second Quarter of FY2015 (April 1, 2014 September 30, 2014) This document is an English translation of the Japanese language version of the consolidated financial summary
Net sales Operating income Ordinary income. Net income per Net income per share Return on equity share after full dilution
 Summary of Consolidated Financial Statements for Fiscal Year Ended March 31, 2018 (Japan GAAP) June 2, 2018 Listed Exchanges: TSE Name of Listed Company: Ishihara Sangyo Kaisha, Ltd. Code: 4028 URL http://www.iskweb.co.jp
Pioneer Announces Business Results for 3Q Fiscal 2018
 For Immediate Release February 9, 2018 Pioneer Announces Business Results for 3Q Fiscal 2018 Pioneer Corporation today announced its consolidated third-quarter and nine-month business results for the period
Consolidated Earnings Report for the Third Quarter of Fiscal 2019 [Japanese GAAP]
![Consolidated Earnings Report for the Third Quarter of Fiscal 2019 [Japanese GAAP]](/thumbs/88/115273736.jpg "Consolidated Earnings Report for the Third Quarter of Fiscal 2019 [Japanese GAAP]") Consolidated Earnings Report for the Third Quarter of Fiscal 2019 [Japanese GAAP] January 25, 2019 Company Name: KOITO MANUFACTURING CO., LTD. Stock Listing: First Section, Tokyo Stock Exchange Code Number:
Consolidated Earnings Report for the Third Quarter of Fiscal 2019 [Japanese GAAP] January 25, 2019 Company Name: KOITO MANUFACTURING CO., LTD. Stock Listing: First Section, Tokyo Stock Exchange Code Number:
Business Results for the Fiscal Year Ended December 31, 2017 (January 1, 2017 through December 31, 2017)
") Business Results for the Fiscal Year Ended (January 1, 2017 through ) (Japanese GAAP) February 13, 2018 This document has been translated from the Japanese original, Kessan Tanshin (Flash Report), for
Business Results for the Fiscal Year Ended (January 1, 2017 through ) (Japanese GAAP) February 13, 2018 This document has been translated from the Japanese original, Kessan Tanshin (Flash Report), for
Code number : 7202 :
 FY2015 Third Quarter Consolidated Financial Results (Japan GAAP) (April 1, 2014 through December 31, 2014) English Translation of the Original Japanese-Language Document February 6, 2015 Company name :
:
 Financial Results for (April 1, 2008 through March 31, 2009) English Translation of the Original Japanese-Language Document May 11, 2009 Company name : ISUZU MOTORS LIMITED Stock exchange on which the
Consolidated Financial Results For the First Half of the Fiscal Year Ending March 31, 2016
 Consolidated Financial Results For the First Half of the Fiscal Year Ending March 31, 2016 (For the Six Months Ended September 30, 2015) Prepared in Conformity with Generally Accepted Accounting Principles
Consolidated Financial Summary Second Quarter of FY2014
 Consolidated Financial Summary Second Quarter of FY2014 (April 1, 2013 September 30, 2013) This document is an English translation of the Japanese language version of the consolidated financial summary
(2) Consolidated Financial Position Total assets Net assets Equity ratio
 Consolidated Financial Position Total assets Net assets Equity ratio") Financial Results for the Third Quarter of the Fiscal Year Ending March 31, 2018 [Japanese GAAP] (Consolidated) English translation from the original Japanese-language document January 31, 2018 Name of
Financial Results for the Third Quarter of the Fiscal Year Ending March 31, 2018 [Japanese GAAP] (Consolidated) English translation from the original Japanese-language document January 31, 2018 Name of
Code number : 7202 :
 FY2009 Second Quarter Financial Results (April 1, 2008 through September 30, 2008) English Translation of the Original JapaneseLanguage Document November 5, 2008 Company name : ISUZU MOTORS LIMITED Stock
1. Consolidated performance for the Second quarter of the fiscal year 2016 (from April 1, 2016 to September 30, 2016)
") Translation October 28, 2016 Consolidated Financial Results for the Second Quarter of the Fiscal Year Ending March 31, 2017 [Japan GAAP] Company name: Mitsubishi Motors Corporation Listing: First Section,
Translation October 28, 2016 Consolidated Financial Results for the Second Quarter of the Fiscal Year Ending March 31, 2017 [Japan GAAP] Company name: Mitsubishi Motors Corporation Listing: First Section,
Consolidated Financial Statements (1) Consolidated Balance Sheet (Unit: Million yen) Previous Consolidated Fiscal Year (Ended March 31, 2011)
 Consolidated Balance Sheet (Unit: Million yen) Previous Consolidated Fiscal Year (Ended March 31, 2011)") Consolidated Financial Statements (1) Consolidated Balance Sheet (Ended (Ended Assets Current assets Cash and deposits 27,057 34,440 Notes and accounts receivable-trade 4,538 3,595 Securities 3,654 11,967
Consolidated Financial Statements (1) Consolidated Balance Sheet (Ended (Ended Assets Current assets Cash and deposits 27,057 34,440 Notes and accounts receivable-trade 4,538 3,595 Securities 3,654 11,967
FY2010 Second Quarter Financial Results. SUZUKI MOTOR CORPORATION 2 November 2010
 FY2010 Second Quarter Financial Results SUZUKI MOTOR CORPORATION 2 November 2010 Consolidated: Financial Summary Page 1 FY2010 1H FY2009 1H ( 10/4-9) ( 09/4-9) Change Net sales 1,318.8 1,181.6 +137.2 +
Period Ending: 03/31/ /31/2015
 Balance Sheet Assets Current assets Cash and deposits 1,798,992 1,989,414 Notes and accounts receivable - trade 871,418 1,052,104 Electronically recorded monetary claims - operating 25,052 58,320 Securities
(1) Consolidated Balance Sheets As of December 31, 2013 and 2014 ( ) represents negative figures. Millions of yen
 Consolidated Balance Sheets As of December 31, 2013 and 2014 ( ) represents negative figures. Millions of yen") 3. Consolidated Financial Statements (1) Consolidated Balance Sheets As of and 2014 As of As of ASSETS Current assets: Cash and deposits 119,859 137,082 Notes and accounts receivable trade 238,102 265,818
3. Consolidated Financial Statements (1) Consolidated Balance Sheets As of and 2014 As of As of ASSETS Current assets: Cash and deposits 119,859 137,082 Notes and accounts receivable trade 238,102 265,818
Consolidated Financial Results For the Second Quarter of the Fiscal Year Ending March 31, 2019 (For the First Six Months Ended September 30, 2018)
") Consolidated Financial Results For the Second Quarter of the Fiscal Year Ending March 31, 2019 (For the First Six Months Ended September 30, 2018) Prepared in Conformity with Generally Accepted Accounting
Consolidated Financial Results For the Second Quarter of the Fiscal Year Ending March 31, 2019 (For the First Six Months Ended September 30, 2018) Prepared in Conformity with Generally Accepted Accounting
Code number : 7202 :
 FY2009 Third Quarter Financial Results (April 1, 2008 through December 31, 2008) English Translation of the Original JapaneseLanguage Document February 6, 2009 Company name : ISUZU MOTORS LIMITED Stock
Gun Ei Chemical Industry Co., Ltd.
 Gun Ei Chemical Industry Co., Ltd. Consolidated Financial Statements Consolidated balance sheets As of 2015 and 2016 2015 2016 Assets Current assets Cash and deposits 7,524 10,648 Notes and accounts receivable-trade
Consolidated Results for the First Three Quarters of the Fiscal Year Ending March 20, 2014
 Consolidated Results for the First Three Quarters of the Fiscal Year Ending March 20, 2014 [Japan GAAP] January 23, 2014 Listed company name: YASKAWA Electric Corporation http://www.yaskawa.co.jp/en/ Representative
CONSOLIDATED FINANCIAL STATEMENTS These Consolidated Financial Statements were publicly released in the Japanese language on November 9, 2016.
 CONSOLIDATED FINANCIAL STATEMENTS These Consolidated Financial Statements were publicly released in the Japanese language on November 9, 2016. (1)Consolidated balance sheet 2016/3/31 2016/9/30 Assets Current
Consolidated Financial Results for the 2nd Quarter of Fiscal Year Ending March 31, 2019 (J-GAAP)
") Consolidated Financial Results for the 2nd Quarter of Fiscal Year Ending March 31, 2019 (J-GAAP) November 5, 2018 Company name: T.RAD Co., Ltd. Listing: Tokyo Stock Exchange, First Section Code No.: 7236
Consolidated Financial Results for the 2nd Quarter of Fiscal Year Ending March 31, 2019 (J-GAAP) November 5, 2018 Company name: T.RAD Co., Ltd. Listing: Tokyo Stock Exchange, First Section Code No.: 7236
February 7, 2018 CONSOLIDATED FINANCIAL RESULTS for the First Nine Months of the Fiscal Year Ending March 31, 2018 <under Japanese GAAP>
 Translation Notice: This English version is a translation of the original Japanese document and is only for reference purposes. In the case where any differences occur between the English version and the
(2) Consolidated Financial Position Total assets Net assets Equity ratio
 Consolidated Financial Position Total assets Net assets Equity ratio") Financial Results for the Second Quarter of the Fiscal Year Ending March 31, 2019 [Japanese GAAP] (Consolidated) English translation from the original Japanese-language document October 30, 2018 Name of
Financial Results for the Second Quarter of the Fiscal Year Ending March 31, 2019 [Japanese GAAP] (Consolidated) English translation from the original Japanese-language document October 30, 2018 Name of
Financial Results for the Three Months Ended June 30, 2018 (Japanese Accounting Standards) (Consolidated)
 (Consolidated)") Financial Results for the Three Months Ended June 30, 2018 (Japanese Accounting Standards) (Consolidated) 1. Consolidated Financial Results for the Three Months Ended June 30, 2018 (April 1, 2018 through
Financial Results for the Three Months Ended June 30, 2018 (Japanese Accounting Standards) (Consolidated) 1. Consolidated Financial Results for the Three Months Ended June 30, 2018 (April 1, 2018 through
Consolidated Financial Results For the Year Ended March 31, 2018
 April 26, 2018 Consolidated Financial Results For the Year Ended Company name: IBIDEN CO., LTD. Stock exchange listings: Tokyo and Nagoya Stock Exchange (First Section) Stock code number: 4062 URL: http://www.ibiden.com/
1. Consolidated performance for the Full Year 2017 (April 1, 2017 to March 31, 2018)
") Translation May 9, 2018 Consolidated Financial Results for FY 2017 Full Year (April 1, 2017 through March 31, 2018) [Japan GAAP] Company name: Mitsubishi Motors Corporation Listing: First Section, the
Translation May 9, 2018 Consolidated Financial Results for FY 2017 Full Year (April 1, 2017 through March 31, 2018) [Japan GAAP] Company name: Mitsubishi Motors Corporation Listing: First Section, the
Financial Results for the Second Quarter of the Fiscal Year Ending March 31, 2014 [Japanese GAAP] (Consolidated)
![Financial Results for the Second Quarter of the Fiscal Year Ending March 31, 2014 [Japanese GAAP] (Consolidated)](/thumbs/93/111330278.jpg "Financial Results for the Second Quarter of the Fiscal Year Ending March 31, 2014 [Japanese GAAP] (Consolidated)") Financial Results for the Second Quarter of the Fiscal Year Ending March 31, 2014 [Japanese GAAP] (Consolidated) October 29, 2013 Name of Listed Company: Hino Motors, Ltd. Stock Listing: Tokyo and Nagoya
Financial Results for the Second Quarter of the Fiscal Year Ending March 31, 2014 [Japanese GAAP] (Consolidated) October 29, 2013 Name of Listed Company: Hino Motors, Ltd. Stock Listing: Tokyo and Nagoya
Consolidated Financial Results for the Six Months Ended June 30, 2018 [Japanese GAAP]
![Consolidated Financial Results for the Six Months Ended June 30, 2018 [Japanese GAAP]](/thumbs/90/102822270.jpg "Consolidated Financial Results for the Six Months Ended June 30, 2018 [Japanese GAAP]") NOTICE: For the convenience of capital market participants, NIPPON PAINT HOLDINGS CO., LTD. makes efforts to provide English translations of the information disclosed in Japanese, provided that the original
NOTICE: For the convenience of capital market participants, NIPPON PAINT HOLDINGS CO., LTD. makes efforts to provide English translations of the information disclosed in Japanese, provided that the original
of dividends payment:
 Financial Results Summary for the Second Quarter of the Fiscal Year Ended March 31, 2017 [Japan GAAP] (Consolidated) October 28, 2016 Company Name Tabuchi Electric Co., Ltd. Exchange listed on: Tokyo Stock
Consolidated Financial Results for the First Three Quarters of the Fiscal Year Ending March 31, 2018 (Japan GAAP)
") Consolidated Financial Results for the First Three Quarters of the Fiscal Year Ending March 31, 2018 (Japan GAAP) Name of Listed Company: Yokogawa Electric Corporation (the Company herein) Stock Exchanges
Consolidated Financial Results for the First Three Quarters of the Fiscal Year Ending March 31, 2018 (Japan GAAP) Name of Listed Company: Yokogawa Electric Corporation (the Company herein) Stock Exchanges
Net sales Operating profit Ordinary profit
 Consolidated Financial Statements Summary May 8, 2018 (For the year ended March 31, 2018) English translation from the original Japanese-language document (All financial information has been prepared in
Business Results for the First Three Months of the Fiscal Year Ending December 31, 2018 (January 1, 2018 through March 31, 2018)
") Business Results for the First Three Months of the Fiscal Year Ending December 31, 2018 (January 1, 2018 through ) (Japanese GAAP) May 10, 2018 This document has been translated from the Japanese original,
Business Results for the First Three Months of the Fiscal Year Ending December 31, 2018 (January 1, 2018 through ) (Japanese GAAP) May 10, 2018 This document has been translated from the Japanese original,
Balance Sheets (Quarterly)
") Balance Sheets (Quarterly) Assets SHOWA DENKO K.K. (Unit:millions of yen) 2017 2018 2018 2018 Q3 Q1 Q2 Q3 Current assets Cash and deposits 89,291 82,745 89,278 138,208 Notes and accounts receivable - trade
Balance Sheets (Quarterly) Assets SHOWA DENKO K.K. (Unit:millions of yen) 2017 2018 2018 2018 Q3 Q1 Q2 Q3 Current assets Cash and deposits 89,291 82,745 89,278 138,208 Notes and accounts receivable - trade
CONSOLIDATED FINANCIAL STATEMENTS
 CONSOLIDATED FINANCIAL STATEMENTS (for the fiscal year 2014.12 ended December 31, 2014) Name of Company: SUMIDA CORPORATION Stock Listing: Tokyo Security Code No.: 6817 (URL http://www.sumida.com) Representative:
Consolidated: Financial Summary
 FY2009 Financial Results SUZUKI MOTOR CORPORATION 10 May 2010 Consolidated: Financial Summary Page2 FY2009 FY2008 FY2009 Cumulative Cumulative Change 4th Quarter 4th Quarter FY2008 4th Quarter 09/4-10/3
Consolidated Financial Results for the Third Quarter Ended December 31, 2010 Asahi Holdings, Inc.
 Consolidated Financial Results for the Third Quarter Ended December 31, 2010 Asahi Holdings, Inc. February 1, 2011 Stock code: 5857 Shares listed: Tokyo Stock Exchange (First Section) U R L: http://www.asahiholdings.com
CONSOLIDATED FINANCIAL STATEMENTS
 CONSOLIDATED FINANCIAL STATEMENTS (for the fiscal year 2016.12 ended December 31, 2016) Name of Company: SUMIDA CORPORATION Stock Listing: Tokyo Security Code No.: 6817 (URL http://www.sumida.com) Representative:
YAMAHA CORPORATION. Tokyo Stock Exchange (First Section) Address of headquarters:
 Address of headquarters:") YAMAHA CORPORATION Flash Report Consolidated Basis (Japanese GAAP) Results for the First Quarter of the Fiscal Year Ending March 31, 2017 (April 1, 2016 June 30, 2016) August 2, 2016 Company name: YAMAHA
YAMAHA CORPORATION Flash Report Consolidated Basis (Japanese GAAP) Results for the First Quarter of the Fiscal Year Ending March 31, 2017 (April 1, 2016 June 30, 2016) August 2, 2016 Company name: YAMAHA
Consolidated Financial Results for the Second Quarter of FY2019 Ending March 31, 2019 (J-GAAP)
") Consolidated Financial Results for the Second Quarter of FY2019 Ending March 31, 2019 (J-GAAP) November 8, 2018 Listed company name: Ariake Japan Co., Ltd. Code number: 2815 URL: http://www.ariakejapan.com/
Consolidated Financial Results for the Second Quarter of FY2019 Ending March 31, 2019 (J-GAAP) November 8, 2018 Listed company name: Ariake Japan Co., Ltd. Code number: 2815 URL: http://www.ariakejapan.com/
1. Consolidated performance for the first quarter of fiscal year ending March 31,2019 (April 1, 2018 to June 30, 2018)
") Translation July 24, 2018 Consolidated Financial Results for the First Quarter of the Fiscal Year Ending March 31, 2019[Japan GAAP] Company name: Mitsubishi Motors Corporation Listing: First Section, the
Translation July 24, 2018 Consolidated Financial Results for the First Quarter of the Fiscal Year Ending March 31, 2019[Japan GAAP] Company name: Mitsubishi Motors Corporation Listing: First Section, the
FY Third Quarter Financial Results - The First Nine Months - SUZUKI MOTOR CORPORATION 7 February 2011
 0 Third Quarter Financial Results - The First Nine Months - SUZUKI MOTOR CORPORATION 7 February 2011 Consolidated: Financial Summary Page2 (Billion Yen) ( ) ( ) Change Rate Net sales 1,927.7 1,778.8 +148.9
Business Results for the First Six Months of the Fiscal Year Ending December 31, 2018
 Business Results for the First Six Months of the Fiscal Year Ending December 31, 2018 (January 1, 2018 through ) (Japanese GAAP) August 8, 2018 This document has been translated from the Japanese original,
Consolidated Earnings Report for the Second Quarter of Fiscal 2019 [Japanese GAAP]
![Consolidated Earnings Report for the Second Quarter of Fiscal 2019 [Japanese GAAP]](/thumbs/95/123927145.jpg "Consolidated Earnings Report for the Second Quarter of Fiscal 2019 [Japanese GAAP]") Consolidated Earnings Report for the Second Quarter of Fiscal 2019 [Japanese GAAP] October 26, 2018 Company Name: KOITO MANUFACTURING CO., LTD. Stock Listing: First Section, Tokyo Stock Exchange Code Number:
Consolidated Earnings Report for the Second Quarter of Fiscal 2019 [Japanese GAAP] October 26, 2018 Company Name: KOITO MANUFACTURING CO., LTD. Stock Listing: First Section, Tokyo Stock Exchange Code Number:
Consolidated Financial Statements (For the First Quarter of FY2013)
") Consolidated Financial Statements (For the First Quarter of FY2013) Consolidated Balance Sheets Assets Current assets: Cash and deposits Notes receivable, accounts receivable from completed contracts and
Consolidated Financial Statements (For the First Quarter of FY2013) Consolidated Balance Sheets Assets Current assets: Cash and deposits Notes receivable, accounts receivable from completed contracts and
Consolidated Financial Statements for the First Quarter of the Fiscal Year Ending December 31, 2018 [Japanese GAAP]
![Consolidated Financial Statements for the First Quarter of the Fiscal Year Ending December 31, 2018 [Japanese GAAP]](/thumbs/86/94742649.jpg "Consolidated Financial Statements for the First Quarter of the Fiscal Year Ending December 31, 2018 [Japanese GAAP]") Consolidated Financial Statements for the First Quarter of the Fiscal Year Ending December 31, 2018 [Japanese GAAP] May 15, 2018 Company name: AUCNET INC. Stock exchange listing: Tokyo Stock Exchange Code
Consolidated Financial Statements for the First Quarter of the Fiscal Year Ending December 31, 2018 [Japanese GAAP] May 15, 2018 Company name: AUCNET INC. Stock exchange listing: Tokyo Stock Exchange Code
1. Consolidated performance for the second quarter of fiscal year 2011 (from April 1, 2011 to September 30, 2011)
") Translation October 28, 2011 Consolidated Financial Results for the Second Quarter of the Fiscal Year Ending March 31, 2012 [Japan GAAP] Company name: Mitsubishi Motors Corporation Listing: First Section,
Translation October 28, 2011 Consolidated Financial Results for the Second Quarter of the Fiscal Year Ending March 31, 2012 [Japan GAAP] Company name: Mitsubishi Motors Corporation Listing: First Section,
Financial Results for FY2010 (April 1, 2009 through March 31, 2010) English Translation of the Original Japanese-Language Document May 11, 2010
 English Translation of the Original Japanese-Language Document May 11, 2010") Financial Results for (April 1, 2009 through March 31, 2010) English Translation of the Original Japanese-Language Document May 11, 2010 Company name : ISUZU MOTORS LIMITED Stock exchange on which the
Financial Results for (April 1, 2009 through March 31, 2010) English Translation of the Original Japanese-Language Document May 11, 2010 Company name : ISUZU MOTORS LIMITED Stock exchange on which the
Code number : 7202 :
 FY2015 First Quarter Consolidated Financial Results (Japan GAAP) (April 1, 2014 through June 30, 2014) English Translation of the Original Japanese-Language Document August 4, 2014 Company name : ISUZU
Asahi Group Holdings, Ltd.
 Asahi Group Holdings, Ltd. FY2014 Financial Results NOTE: All information has been prepared in accordance with generally accepted accounting principles in Japan. Amounts shown in this accounting report
YAMAHA CORPORATION. YAMAHA CORPORATION (URL
 YAMAHA CORPORATION Flash Report Consolidated Basis (Japanese GAAP) Results through the Third Quarter of the Fiscal Year Ending March 31, 2019 (April 1, 2018 December 31, 2018) Company name: Code number:
Consolidated Financial Results for the Six Months of the Fiscal Year Ending March 31, 2014 <under Japanese GAAP>
 Consolidated Financial Results for the Six Months of the Fiscal Year Ending March 31, 2014 November 8, 2013 Company Name: Olympus Corporation Code Number: 7733 (URL: http://www.olympus.co.jp/)
Shindengen Electric Manufacturing Co., Ltd.
 Consolidated Financial Highlights FY2013 FY2014 FY2015 FY2016 FY2017 Net sales 104,564 108,255 98,110 92,688 92,177 Operating profit 11,313 7,673 799 5,238 6,853 Ordinary profit 10,960 7,861 405 4,739
Consolidated Financial Statements for the Nine Months Ended December 31, 2008
 Consolidated Financial Statements for the Nine Months Ended December 31, 2008 February 3, 2009 Listed Company Name: Alpine Electronics, Inc. Security Code: 6816 (First Section, Tokyo Stock Exchange) URL:
Asahi Group Holdings, Ltd.
 Asahi Group Holdings, Ltd. FY2015 Financial Results NOTE: All information has been prepared in accordance with generally accepted accounting principles in Japan. Amounts shown in this accounting report
Financial Results for the First Six Months of the Fiscal Year Ending March 31, 2019 [J-GAAP] (Consolidated)
![Financial Results for the First Six Months of the Fiscal Year Ending March 31, 2019 [J-GAAP] (Consolidated)](/thumbs/93/113324390.jpg "Financial Results for the First Six Months of the Fiscal Year Ending March 31, 2019 [J-GAAP] (Consolidated)") Company Name: Stock exchange listed on: Financial Results for the First Six Months of the Fiscal Year Ending March 31, 2019 [J-GAAP] (Consolidated) Kintetsu World Express, Inc. (KWE) Tokyo Stock Exchange
Company Name: Stock exchange listed on: Financial Results for the First Six Months of the Fiscal Year Ending March 31, 2019 [J-GAAP] (Consolidated) Kintetsu World Express, Inc. (KWE) Tokyo Stock Exchange