Lesson 4: Foreign Trade, Exchange Rates, and Competitiveness
|
|
|
- Joseph Gibson
- 6 years ago
- Views:
Transcription
1 Lesson 4: Foreign Trade, Exchange Rates, and Competitiveness 1. Stylized Facts of Spanish Foreign Trade 1.1 Geographic Distribution 1.2 Foreign Trade Evolution 2. Exchange Rates 2.1 Interest Rate Parity Condition 2.2 Evolution of the Euro exchange rate 3. Competitiveness 3.1 Competitiveness Indicators 3.2 Sectoral Specialization
2 1 Stylized Facts of Spanish Foreign Trade 1.1 Geographic Distribution of Spanish Foreign Trade Foreign Trade: Main Aggregates mill euros Exports Exports-EU Imports Imports-EU
3 Distribution of Exports by area of destination OECD 70,2 64,4 70,2 82,6 82,5 83,5 83,5 EU12 41,1 44,2 44,3 58,7 61,0 61,3 60,1 EU15 (non-euro) 6,9 7,4 7,4 9,8 10,2 10,3 11,0 Rest of Europe 5,5 5,2 5,4 2,0 3,1 4,4 5,9 Latin America 7,0 8,5 5,1 3,4 5,6 6,2 4,7 USA 13,9 5,3 9,9 5,8 4,1 4,4 4,1 China 1,0 0,4 0,8 Japan 1,0 1,4 1,3 1,1 1,4 1,1 0,8 Rest of the World 24,6 28,0 26,6 19,1 14,5 12,4 13,5 Total 100,0 100,0 100,0 100,0 100,0 100,0 100,0
4 Main Features 1. Europe has always been the main destination of Spanish exports. Most exports go to the euro area. After entry in the EU, this trend has increased. In the last years, Eastern Europe has emerged as a new destination (and Spain is a net exporter to the area). 2. Nevertheless, Latin America during the 1970s and also at the end of the period in the 1990s has more weight in the Spanish exports than what would be expected from the importance of the Latin American economy. 3. The importance of the US economy as a destination of Spanish exports has declined from over 10% to less than half that number. 4. Japan s share is stable and very small, taking into account the importance of Japan in the world economy. The share of exports to China is not increasing, in spite of the rise of the Chinese economy.
5 Distributions of Imports by area of origin OECD 70,4 52,3 66,8 78,7 81,2 81,9 77,8 EU12 36,6 26,6 31,2 50,1 55,7 57,5 55,7 EU15 (non-euro) 6,6 4,8 5,6 9,0 10,0 10,2 8,7 OPEC 11,8 27,6 10,1 7,4 5,5 5,1 6,3 Rest of Europe 2,6 2,3 2,4 2,1 2,6 2,4 4,4 Latin America 7,3 8,5 10,6 4,2 4,2 3,9 4,0 USA 16,1 13,1 10,9 8,4 5,4 5,4 3,6 China 2,0 2,7 3,6 Japan 2,5 3,4 4,4 3,3 3,2 2,6 Rest of the World 19,0 14,6 25,8 14,4 11,3 9,6 11,0 Total 100,0 100,0 100,0 100,0 100,0 100,0 100,0
6 Main Features THE SPANISH ECONOMY UNIVERSIDAD CARLOS III MADRID 1. Europe has always been the main origin of Spanish imports. Most of them come from the euro area. This trend, again, was reinforced by entry in the EU. In the last years, Eastern Europe has emerged as a new source of imports. 2. The OPEC countries are consistently among the three largest exporters to Spain. 3. The share of Latin American goods over total imports decreases in the 1980s and never recovers. 4. There is a secular decline in the importance of US products. In 1973, the US was the second main origin of Spanish imports with more than 16% of Spanish imports. The figure now is lower than 4%. 5. Japan s share is stable around 3%. China s share is increasing and now the value of imports from China equals that of the US.
7 1.2 Foreign Trade Evolution Intra-EU trade (% over total) Imports Exports Austria 69,5 76,5 64,1 72,3 Belgium-Lux. 73,4 72,5 78,1 76,6 Denmark 49,8 70,1 62,2 66,7 Finland 47,4 65,3 50,5 54,6 France 67,6 67,6 57,1 62,2 Germany 58,1 59,0 60,2 56,4 Greece 62,2 62,5 68,6 49,8 Ireland 75,9 66,1 73,9 70,6 Italy 59,9 60,9 55,2 55,2 Netherlands 64,7 61,2 81,3 80,6 Portugal 62,8 75,6 75,5 80,0 Spain 54,4 67,9 63,7 66,8 Sweden 72,3 68,2 57,4 57,2 UK 55,3 54,9 52,2 58,3 EU 61,8 63,3 62,2 63,0 Source: Martín (1997)
8 Main Features: THE SPANISH ECONOMY UNIVERSIDAD CARLOS III MADRID Intra-EU trade flows are the most important trade flows for all EU15 member countries in both periods (only exception is Greece s exports). Increase in intra-eu flows at aggregate level. For some countries, intra- EU imports decreased (UK, Sw, N). For some, intra-eu exports decreased (Ger, N, Gr). For Spain, intra-eu flows have increased (in 1996, around 2/3 of X and M) (Not shown) Main EU export markets for Spain: France (28.5%), Germany (20.4%), Italy, Portugal, and UK (12% each). (Not shown) Main EU import origins: France (27%), Germany (23%), Italy and UK (13% each). Spain as an important partner: Portugal (M:30%, X:19%) and France.
9 Revealed Comparative Advantage Index and Grubel and Lloyd Index: The index of revealed comparative advantage is the trade balance within each industry i: scaled by the total balance in the industry: RCA i = X X i i + M M i i x100 Industries with revealed comparative advantage have values closer to 100. Industries with no comparative advantage have values closer to 100. The Grubel and Lloyd Index measure for any industry the level of intraindustry trade (0<B i <100: nothing/everything is intraindustry trade): B i Xi Mi = 1 x100 Xi + Mi
10 Intra-industry trade may result from: vertical product differentiation (distinct countries/industries produce different qualities) or from horizontal product differentiation (distinct countries/industries produce different varieties, e.g. distinct preferences for characteristics that are not ranked) Unfortunately, there does not exist direct quality indices. Proxies must be used instead. 1. The Unit Value Index is the ratio between the value and the volume of exports (imports): UVI X i = N j = 1 P N j = 1 X ij Q iq X ij X ij
11 It is thus possible to compute the ratio between the IVUs of exports and imports. A threshold, close to unity, is defined (e.g. 15%). Exports varieties are of lower quality as compared to imports if: UVI UVI X i M i < There is horizontal differentiation if: X UVIi M UVI Exports varieties are of higher quality as compared to imports if: i UVI UVI X i M i >
12 Revealed Comparative Advantage Indices in Manufacturing EU Rest of the World High technology -38,2-30,6-36,4-19,5 Electrical equipment -30,4-24,6-49,1-15,1 Data Processing -35,3-37,8-77,9-56,9 Chemicals -44,1-32,9-7,5-1,4 Medium technology 0,8 1,9 21,8 12,4 Plastics -1,7-8,4 38 4,2 Transport equipment 18,8 13,6 28,9 24,0 Machinery -34,4-33,2 16,2 10,2 Other manufacturing 17,3 3,8 3,7-17,9 Low Technology -1,6-3 19,3-0,6 Textiles 27,9 5,2 28,7-6,9 Iron -21, ,8-10,7 Other mining 6,6 26,6 32,7 47,0 Paper -16,6-23,3 34,7 24,0 Food and Tobacco 11,4 2,8-5,1-22,1 Metals -15,9-10,4 43,0 39,7 Total -10,4-7,8 3,1-2,1 Source: Martín (1997)
13 Main Features THE SPANISH ECONOMY UNIVERSIDAD CARLOS III MADRID Both with respect to the EU and to the rest of the world, Spain does not have comparative advantage in sectors with high technological content Comparative advantage with respect to the EU is concentrated in sector which are intensive in blue collar labour (textiles) and physical capital (transport equipment, natural resources) Comparative advantage with respect to the rest of the world is mainly in natural resources, transport equipment, iron products, and paper derivatives.
14 Growth of intra-industry trade in sectors with initial revealed comparative advantage (transport equipment, textiles, and food processing): Índexes of Intra-Industry Trade UE Resto del Mundo High technology Electrical equipment 54,0 53,8 30,7 55,5 Data Processing 63,7 42,7 23,0 36,3 Chemicals 42,6 52,1 37,5 43,0 Medium technology Rubber & Plastics 54,2 70,8 28,4 51,2 Transport equipment 57,3 66,5 38,9 53,3 Machinery 53,4 54,7 54,2 45,7 Other manufacturing 39,3 55,7 27,6 32,7 Low Technology Textiles 34,6 56,1 26,4 35,6 Iron 67,5 72,6 37,0 44,0 Other mining 44,6 50,8 11,9 27,2 Paper 60,2 52,1 23,4 26,5 Food and Tobacco 23,9 39,5 20,9 26,4 Metals 34,8 52,2 14,4 19,9 Total Manufacturas 48,7 57,8 28,2 39,9 Fuente: Martín (1997)
15 Characteristics of intra-industry trade 1996 EU Rest of the World Vertical Horiz. Total Vertical Horiz. Total High Low High Low Electrical equipment 17,8 20,2 15,8 53,8 15,1 22,8 17,6 55,5 Data Processing 18 7,2 17,5 42,7 23,9 8,9 3,5 36,3 Chemicals 10,1 31,1 10,7 52,1 11,8 22,5 8,7 43 Plastics 10,4 12,7 47,7 70, , ,2 Transport equipment 6, ,7 66,5 9, ,9 53,3 Machinery 15,2 24,4 15,1 54,7 7,8 30,9 7 45,7 Other manufacturing 26,5 17,8 11,4 55,7 24,4 2,9 5,4 32,7 Textiles 17, ,8 56,1 24,5 2,6 8,5 35,6 Iron 23,8 34,5 14,3 72,6 29,3 9, Other mining 14,9 23,4 12,5 50,8 7,8 16,9 2,5 27,2 Paper 6 27, ,1 4,5 18,2 3,9 26,5 Food and Tobacco 9,1 13,6 16,8 39,5 13,9 4,9 7,6 26,4 Metals 4 18,4 29,8 52,2 8,5 5,5 5,9 19,9 Total 11,5 29,2 17,1 57,8 14,4 13,6 11,9 39,9 Source: Martín (1997)
16 Characteristics of intra-industry trade: evolution 1986:1996 EU Rest of the World Vertical Horiz. Total Vertical Horiz. Total High Low High Low Electrical equipment -8,6-0,7 9,1-0,2 2,4 9 13,4 24,8 Data Processing -23,2 1,7 0, ,1-5,8 13,3 Chemicals -5,2 10,3 4,2 9,5-4,1 5,2 4,4 5,5 Plastics 3,2-29, ,6 2,3-9,2 22,3 22,8 Transport equipment 1,5 2,3 5,4 9,2-11,2 8,7 16,9 14,4 Machinery 8,8-14,5 15,1 1,3-3,6-7,9 3-8,5 Other manufacturing 18,8-7,3 4,9 16,4 15,9-15 4,1 5,1 Textiles 7,2-7,8 22,1 21,5 9,6-3,7 3,3 9,2 Iron 8,9-3,8 0 5,1 13,6-6,3-0,2 7 Other mining 8,7-4,1 1,6 6,2 5,1 8,5 1,7 15,3 Paper -4,6 0,3-3,8-8,1 1,6 10,3-8,7 3,1 Food and Tobacco 1,3 2,8 11,5 15,6 2,2-0,5 3,8 5,5 Metals 0,7 4, ,4 5,2 0 0,3 5,5 Total 0 1 8,1 9,1 3,7 1,6 6,4 11,7 Source: Martín (1997)
17 Main Features THE SPANISH ECONOMY UNIVERSIDAD CARLOS III MADRID Vertical intra-industry trade (15% difference in unit value indices) is predominant in most industries. Quality of exports to the EU is smaller than quality of imports from EU in vertical intra-industry trade. Until 1992, growth in intra-industry trade was taking place mainly because of vertical intra-industry trade (not shown). After 1992, growth in intra-industry trade of goods of the same quality (unit value index) has been more important than exchange of goods of different quality.

18 2 Exchange Rates THE SPANISH ECONOMY UNIVERSIDAD CARLOS III MADRID Why?
19 2.1 Interest Rate Parity Condition THE SPANISH ECONOMY UNIVERSIDAD CARLOS III MADRID The exchange rate between the Euro ( ) and the Dollar ($) is determined by actions of those agents who sell and buy in the currency markets in order to carry out international payments with these currencies. Participants in the currency markets: exporters and importers of goods and services, banks, bureaus de change, tourists, and speculators Financial institutions such as commercial banks are by far the most important participants, both in terms of their numbers and the volume of their operations. How are exchange rates determined in the currency markets? As in most markets, by the interaction of supply and demand.
20 Foreign currencies are risky financial assets: the profitability in euros of a bank deposit denominated in dollars will depend both on the interest rate of the deposit account and the evolution of the exchange rate between the dollar and the euro. Define: E $ : euros per dollar R $: annual interest rate of deposit in dollar account E e $ : expected euro/dollar exchange rate after a year TR $ is the expected amount of euros at the end of the year minus the initial euro: TR $ = (1+R $ ) E e $/E $ - 1 = (1+R $ ) (E e $ - E $ )/E $ A simplified version of this formula ignores second order terms and reduces to the following approximation: TR $ R $ + (E e $ - E $ )/E $
21 Interest Parity Condition: TR = TR $ : Currency markets can only be at equilibrium when all deposits, regardless of their currency denominations, yield the same expected profitability (What happens if the euro-deposits have larger profitability than the dollar deposits, R > TR $?) Expected profitability of dollar accounts is inversely related to the current exchange rate euro/dollar: the larger the number of euros needed to buy a dollar, the lower the profitability of the investment. On the other hand, the expected profitability curve of euro-denominated deposits does not depend on current exchange rates. The parity condition determines E $ as the equilibrium exchange rate.
22 Current exchange rate THE SPANISH ECONOMY UNIVERSIDAD CARLOS III MADRID Profitability in eurodenominated deposits: TR Profitability in dollardenominated deposits:: TR $ E $ Profitability
23 What happens if R increases? The curve TR shifts to the right and E $ moves down: making euro-denominated deposits more attractive leads to an appreciation of the euro (?E $ ). What happens if R $ increases? The curve TR $ shifts to the right and E $ goes up: when dollar-denominated deposits are more attractive the dollar appreciates (?E $ ). Finally, what happens if there is an increased expectation of depreciation of the euro in the future (?E e $)? The curve TR $ moves to the right:?tr $ R $ + (?E e $ - E $ )/E $ At equilibrium, E $ goes up: an expected future worsening of the exchange rate leads to a worsening of the current exchange rate.
24 This basic model of exchange rate determination can be easily enlarged by introducing shares and portfolio investment decisions: Portfolio investments in euro shares will increase if expected firm profits in the euro area improve. Portfolio investments in dollar shares will increase when expected profits in the US economy increase. To sum up, the euro/dollar exchange rate is affected by current interest rates, expected future exchange rates and growth expectations in the two economies.
25 2.2 The euro/dollar exchange rate since January 1999: Swift decline until October 2000 of approximately 40% against the dollar (but also against the yen and the pound) Faster US growth: Throughout 1998 pre-euro currencies experienced an appreciation against the dollar that was attributed to the then larger expected growth potential in Europe. As it turned out, average growth in the US was (much) faster than in Europe in the following two years. Positive interest rates differentials between the dollar-deposits and the euro-deposits. Capital outflows from the euro countries to the US (partly offsets the traditional asymmetry between direct and portfolio US investments in Europe against European investments in the US)
26 Appreciation since the end of 2001 (also against the yen and the pound) Positive interest rates differentials between the euro-deposits and the dollar-deposits. European capital withdrawals from the US and also an increase in the international use of the euro by third countries Are these movements in the exchange rates exceptional from a historical perspective? We can obtain a large historical series from 1974 to 2000 by merging the actual euro series from 1999 with the pre-euro synthetic euro: 1. The highest value of the synthetic euro/dollar exchange rate took place in The appreciation trend of the dollar that ended in 1985 started in 1979 and lasted 21 quarters. The last appreciation trend has been shorter in time as it begun in 1996 (16 quarters until the third quarter of 2000).
27 3 Competitiveness THE SPANISH ECONOMY UNIVERSIDAD CARLOS III MADRID What is the competitiveness of an economy? Difficult question, with many candidate answers. One is The sustained capacity to maintain or increase its presence on World markets. This definition encompasses two definitions of competitiveness: 1.- External competitiveness : analysis of comparative advantage 2.- Global or structural competitiveness: ability to achieve sustainable improvements in relative standards of living (i.e., compared to other countries).
28 Thus, we have two alternatives to analyse competitiveness : External competitiveness Global or Structural competitiveness Result indicators (ex-post) Current account (affected by cyclical fluctuations) Export shares Import penetration Per capita GDP and productivity Determinants (ex-ante) Nominal exchange rate Cost, relative prices and relative profitability Factor endowments Innovation potential Productive specialisation Corporate organisation and market efficiency
29 3.1 Competitiveness indicators THE SPANISH ECONOMY UNIVERSIDAD CARLOS III MADRID The trade balance is open to criticism, as it is influenced by cyclical fluctuations: X-M GDP Growth
30 However, it does reflect an increasing imbalance in external trade in the recent past As an alternative, we can normalise by the activity of the country that consumes these tradable goods: Export share of goods from A on B = Import Penetration Rates for A = M PIB A X A B M B A
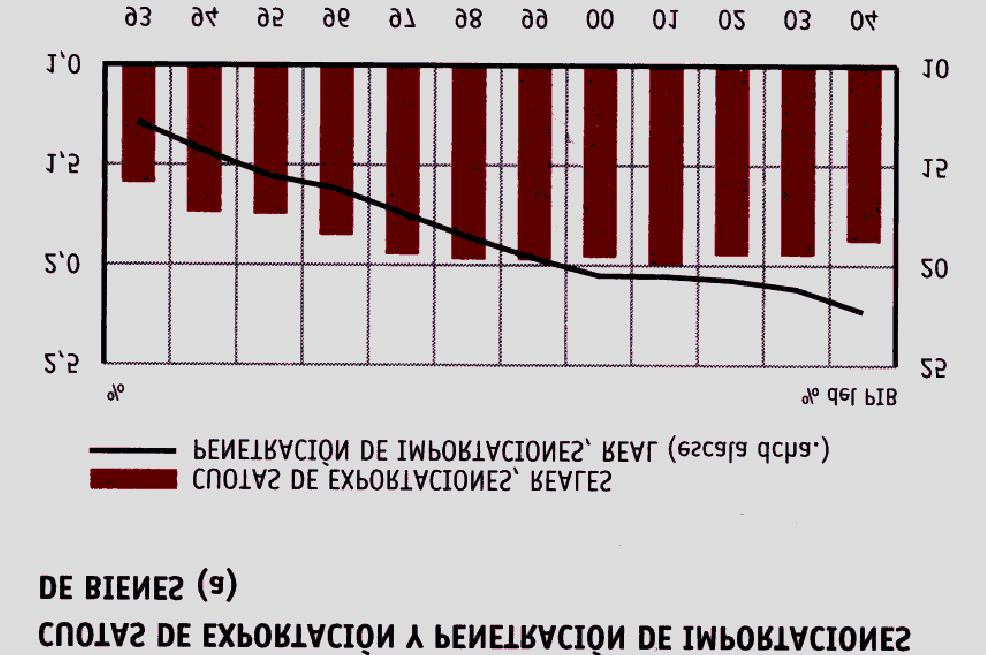
31
32 Main features: THE SPANISH ECONOMY UNIVERSIDAD CARLOS III MADRID Import penetration has approximately doubled over the 10 years. The share of World exports reaches a maximum of 2% in It has fallen slightly since then. In terms of its ability to deliver sustained improvements in standards of living as compared to other countries, the Spanish economy.
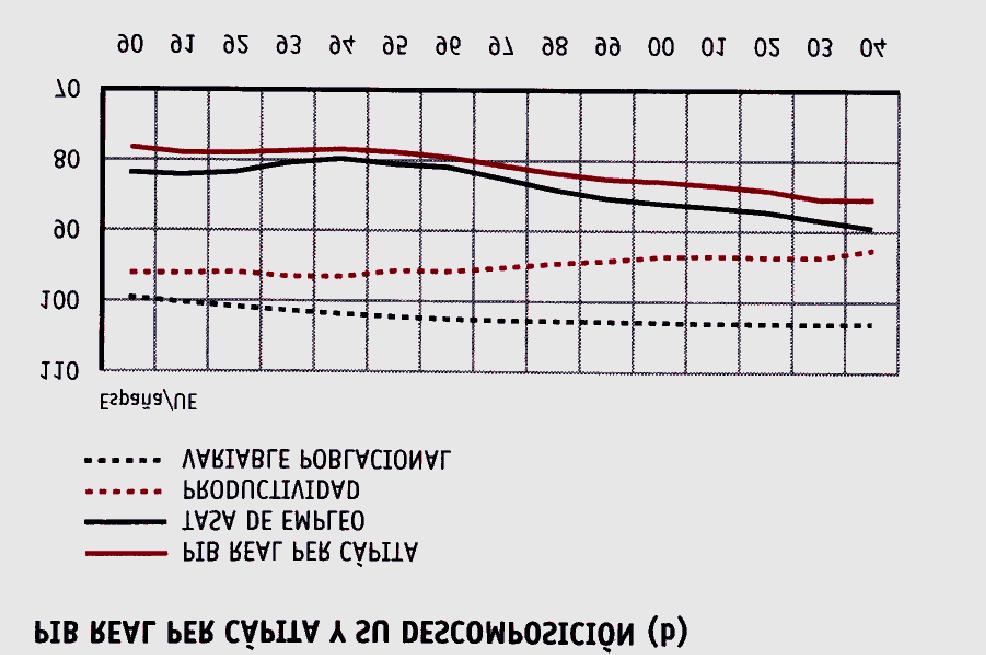
33
34 has experienced positive relative growth which has led to a reduction of the wedge in per capita income.. However, this relative income per capita growth has coincided with a reduction in apparent labour productivity and total factor productivity (not shown). In order to understand the loss of competitiveness, it is useful to compute the Real Effective Exchange Rate. The latter picks up variations in nominal exchange rates as well as inflation differentials. In addition, the ratio between the export deflator and the unit labour cost index is known as the Relative Profitability of Exports.
35 Computing the Real Effective Exchange Rate: Price index of Spanish tradable goods expressed in euros: P Price index of Rest of the World tradable goods expressed in dollars: P* Euro exchange rate with respect to the dollar (euros per dollar): e Þ Dollar price of goods produced in Spain: P/e The ratio 1 e ( ) P P* expresses the dollar price of goods produced in Spain relative to the dollar price of goods produced in the Rest of the World (an increase reflects a relative increase in the dollar price of goods produced in Spain).
36 With t = 0 as base year, we obtain an index of the Real Effective Exchange Rate: 1 P t * P e t t P t e P REER x x 0 t = = * 1 P e 0 t P t e * * 0 P0 P 0 The percentage variation decomposes into: REER P P * t t t e = t REERt Pt P * e t t
37 That is, the relative price of Spanish goods with respect to the Rest of the World increases if: Spanish prices increase: P t > P t 0 Prices in the Rest of the World fall: P * t P * t < 0 The euro appreciates with respect to the dollar (the nominal component) e t > 0 e t
38 Evolution of the REERs and index of the relative profitability of exports average average Relative profitability of exports 0,9-0,8 With respect to developed countries Manufacturing industrial prices -2,4 1,0 Unit Labour costs -3,0 1,7 Nominal Component -3,9 0,1 With respect to Newly Industrialised Countries Manufacturing industrial prices -0,9 1,6 Nominal Component 0,5 1,1 Source: Servicio de Estudios del Banco de España (An increase reflects a relative increase in the price of Spanish goods)
39 Main features: THE SPANISH ECONOMY UNIVERSIDAD CARLOS III MADRID There is an increase in competitiveness until the fixing of euro parities. A deterioration thereafter. The improvements in competitiveness of the first period are particularly marked with respect to developed countries. The main reason is the peseta exchange rate (nominal component) After euro entry, the nominal component negatively affects competitiveness (with respect to Newly Industrialised Countries). However, at the beginning of the 2000 s, the level of prices and costs were lower in Spain as compared to EU-15 and higher than the enlargement countries (not shown).
40 Structural Determinants of Competitiveness Spain/UE15 Spain /US Spain /UE15 Spain /US Capital/Labour (%) 89,4 95,5 91,2 90,9 (R+D)/GDP (%) 45,8 35,2 55,0 40,7 No. of patent requests by million inhabitants (%) 11,5 11,0 16,1 16,5 Years of schooling (%) 97,5 87,5 95,6 100,0 Source: Servicio de Estudios del Banco de España Main features: Marked reduction in the capital intensity wedge with respect to the EU. Nonetheless, there remains a large gap with respect to technological capital
41 3.2 Sectorial specialisation: competitiveness in the tourist sector 11% of GDP, 10% of employment (largest national productive sector). Spain is the second country in terms of international tourist demand. The tourism surplus, that stands above 4% of GDP, covers, on average, 80% of the deficit in the trade in goods balance. At the beginning of the 2000 s, the number of visitors has been equal to the resident population (but average spending has fallen).
42 Determinants of tourism competitiveness: THE SPANISH ECONOMY UNIVERSIDAD CARLOS III MADRID REERs in the tourism sector are characterised by a marked appreciation since However, the level of relative prices of the Spanish economy with respect to the EU-15 average in 2000 were similar to those of The competitive position is weaker with respect to Eastern European countries of the Mediterranean. In the last years, profitability indicators have been moderate. They are below those achieved in France and Italy.
43 With respect to the structural characteristics: High geographical concentration in terms of the origin of the foreign visitors. High concentration in terms of destination. High seasonality. Few foreign visitors motivated by work and business (a higher daily spending is associated with this kind of tourism). Sector dominated by Small and Medium Sized firms.

44 (a) % of Spanish tourism revenue in the World total THE SPANISH ECONOMY UNIVERSIDAD CARLOS III MADRID
45 (b) Increases are associated with losses of competitiveness
46 Main features: Clear positive tendency during the entire period in terms of market share. As of 1998, tourism revenues have not increased as fast as the trade in goods deficit. During the last years, there has been a loss of competitiveness with respect to the competitor countries (Fr, Gr, It, Pt, Austria, Mex) as well as with respect to the origin (client) countries (EU, US, Switzerland, Can, Mex, Jap.).
QUARTERLY REPORT FOURTH QUARTER 1998
 MAIN FEATURES The EU currencies appreciated by 5% against the US dollar but fell by 10.5% against the Japanese yen. These currency movements contributed to a small gain (about 1%) in the Union s average
DEVELOPMENTS IN THE COST COMPETITIVENESS OF THE EUROPEAN UNION, THE UNITED STATES AND JAPAN MAIN FEATURES
 DEVELOPMENTS IN THE COST COMPETITIVENESS OF THE EUROPEAN UNION, THE UNITED STATES AND JAPAN MAIN FEATURES The euro against major international currencies: During the second quarter of 2000, the US dollar,
DEVELOPMENTS IN THE COST COMPETITIVENESS OF THE EUROPEAN UNION, THE UNITED STATES AND JAPAN MAIN FEATURES
 DEVELOPMENTS IN THE COST COMPETITIVENESS OF THE EUROPEAN UNION, THE UNITED STATES AND JAPAN MAIN FEATURES The euro against major international currencies: During the first quarter of 2001, the euro appreciated
ECFIN/C-1 Fourth quarter 2000
 ECFIN/C-1 Fourth quarter 2000 ECFIN/44/4/00-EN This document exists in English only. European Communities, 2001. MAIN FEATURES During the fourth quarter of 2000, the euro appreciated against the US dollar,
Cyclical Convergence and Divergence in the Euro Area
 Cyclical Convergence and Divergence in the Euro Area Presentation by Val Koromzay, Director for Country Studies, OECD to the Brussels Forum, April 2004 1 1 I. Introduction: Why is the issue important?
Euro area competitiveness developments
 Euro area competitiveness developments La competitivité belge. Analyses et enjeux Bureau fédéral du Plan Brussels, 17 November 2009 Reinhard Felke Head of Unit the economy of the euro area and EMU DG ECFIN,
3.5 VERTICAL PRODUCT DIFFERENTIATION IN EU MARKETS: THE RELATIVE POSITION OF EAST EUROPEAN PRODUCERS. Michael A. Landesmann, Johann Burgstaller (WIIW)
") 3.5 VERTICAL PRODUCT DIFFERENTIATION IN EU MARKETS: THE RELATIVE POSITION OF EAST EUROPEAN PRODUCERS Michael A. Landesmann, Johann Burgstaller (WIIW) 3.5.1 Introduction This study reports on a detailed
3.5 VERTICAL PRODUCT DIFFERENTIATION IN EU MARKETS: THE RELATIVE POSITION OF EAST EUROPEAN PRODUCERS Michael A. Landesmann, Johann Burgstaller (WIIW) 3.5.1 Introduction This study reports on a detailed
PORTUGAL E O CAMINHO PARA O FUTURO: A BANCA E O SEU PAPEL
 XV CONFERÊNCIA A CRISE EUROPEIA E AS REFORMAS NECESSÁRIAS PORTUGAL E O CAMINHO PARA O FUTURO: A BANCA E O SEU PAPEL FERNANDO FARIA DE OLIVEIRA AGENDA European Context: From the Actual Crisis to Growth
Spanish economy A spotter s guide to the Spanish economy
 Banco Sabadell Investor Relations Spanish economy A spotter s guide to the Spanish economy This document has been prepared by: Investor Relations at Banco Sabadell - investorrelations@bancsabadell.com
UK trade long-term trends and recent developments
 UK trade long-term trends and recent developments By Andrew Dumble of the Bank s Structural Economic Analysis Division. This article examines why UK trade performance matters; in particular, it considers
: Monetary Economics and the European Union. Lecture 8. Instructor: Prof Robert Hill. The Costs and Benefits of Monetary Union II
 320.326: Monetary Economics and the European Union Lecture 8 Instructor: Prof Robert Hill The Costs and Benefits of Monetary Union II De Grauwe Chapters 3, 4, 5 1 1. Countries in Trouble in the Eurozone
An Overview of World Goods and Services Trade
 Appendix IV An Overview of World Goods and Services Trade An overview of the size and composition of U.S. and world trade is useful to provide perspective for the large U.S. trade and current account deficits
Downstream natural gas in Europe the role of upstream oil and gas companies
 Downstream natural gas in Europe the role of upstream oil and gas companies Presentation at PETROPOL research conference on natural gas Opportunities for Norway in the future European natural gas market
Europe in the World Economy: Economic Recovery and Europe 2020
 Europe in the World Economy: Economic Recovery and Europe 2020 Rafael Doménech Economic recovery and Europe 2020: Towards smart, sustainable and inclusive growth Wilton Park, October 24, 2012 Main messages
NHS Finances The challenge all political parties need to face. Charts and tables. Chart update, May Chart update, May 2015
 NHS Finances The challenge all political parties need to face Charts and tables NHS Finances briefing May 2015 update In January 2015, we published a series of briefings on NHS finances. These included
4 SPAIN S INTERNATIONAL INVESTMENT POSITION IN 2008
 4 SPA S TERNATIONAL VESTMENT POSITION 28 4 Spain s international investment position in 28 41 International investment position in 28: analysis of aggregate data The net debit position of the Spanish economy
January 2014 Euro area international trade in goods surplus 0.9 bn euro 13.0 bn euro deficit for EU28
 STAT/14/41 18 March 2014 January 2014 Euro area international trade in goods surplus 0.9 13.0 deficit for EU28 The first estimate for the euro area 1 (EA18) trade in goods balance with the rest of the
RECENT EVOLUTION AND OUTLOOK OF THE MEXICAN ECONOMY BANCO DE MÉXICO OCTOBER 2003
 OCTOBER 23 RECENT EVOLUTION AND OUTLOOK OF THE MEXICAN ECONOMY BANCO DE MÉXICO 2 RECENT DEVELOPMENTS OUTLOOK MEDIUM-TERM CHALLENGES 3 RECENT DEVELOPMENTS In tandem with the global economic cycle, the Mexican
January 2005 Euro-zone external trade deficit 2.2 bn euro 14.0 bn euro deficit for EU25
 42/2005-23 March 2005 January 2005 Euro-zone external trade deficit 2.2 14.0 deficit for EU25 The first estimate for euro-zone 1 trade with the rest of the world in January 2005 was a 2.2 billion euro
March 2005 Euro-zone external trade surplus 4.2 bn euro 6.5 bn euro deficit for EU25
 STAT/05/67 24 May 2005 March 2005 Euro-zone external trade surplus 4.2 6.5 deficit for EU25 The first estimate for euro-zone 1 trade with the rest of the world in March 2005 was a 4.2 billion euro surplus,
CANADA EUROPEAN UNION
 THE EUROPEAN UNION S PROFILE Economic Indicators Gross domestic product (GDP) at purchasing power parity (PPP): US$20.3 trillion (2016) GDP per capita at PPP: US$39,600 (2016) Population: 511.5 million
On the Structure of EU Financial System. by S. E. G. Lolos. Contents 1
 On the Structure of EU Financial System by S. E. G. Lolos Department of Economic and Regional Development Panteion University Contents 1 1. Introduction...2 2. Banks Balance Sheets...2 2.1 On the asset
August 2005 Euro-zone external trade deficit 2.6 bn euro 14.2 bn euro deficit for EU25
 STAT/05/132 20 October 2005 August 2005 Euro-zone external trade deficit 2.6 14.2 deficit for EU25 The first estimate for euro-zone 1 trade with the rest of the world in August 2005 was a 2.6 billion euro
BULGARIA COMPETITIVENESS REVIEW
 BULGARIA COMPETITIVENESS REVIEW May 11 1 The present report makes an assessment of Bulgaria s stance in terms of competitiveness based on the following OECD definition 1 : Competitiveness is the degree
T5-Europe The Jus Semper Global Alliance 01/09/16 1 6
 Table-T5 Living-Wage-Gap and Equalisation analysis (vis-à-vis the U.S.) for all employed in the manufacturing sector in PPP for private consumption terms 1996-2015 (Europe) Beginning with the 2012 living-wage
Household Balance Sheets and Debt an International Country Study
 47 Household Balance Sheets and Debt an International Country Study Jacob Isaksen, Paul Lassenius Kramp, Louise Funch Sørensen and Søren Vester Sørensen, Economics INTRODUCTION AND SUMMARY What are the
January 2009 Euro area external trade deficit 10.5 bn euro 26.3 bn euro deficit for EU27
 STAT/09/40 23 March 2009 January 2009 Euro area external trade deficit 10.5 26.3 deficit for EU27 The first estimate for the euro area 1 (EA16) trade balance with the rest of the world in January 2009
Preliminary results of International Trade in 2014: in nominal terms exports increased by 1.8% and imports increased by 3.
 International Trade Statistics 7 July, 215 Preliminary results of International Trade in : in nominal terms exports increased by 1.8% and imports increased by 3.2% vis-à-vis 213 In, exports of goods increased
Finland's Balance of Payments. Annual Review 2007
 Finland's Balance of Payments Annual Review 27 Direct investment, stock 1998 27 9 8 7 6 5 4 3 2 1 1998 1999 2 21 22 23 24 25 26 27 In Finland (LHS) Abroad (LHS) In Finland, of GDP (RHS) Abroad, of GDP
ECFIN-C3 (2009) PART 1 MAIN DEVELOPMENTS
 PART 1 MAIN DEVELOPMENTS") ECFIN-C3 (2009) PART 1 MAIN DEVELOPMENTS Methodological note Since the issue for the second quarter of 2004, nominal and real effective exchange rates presented in this report are calculated based on a
ECFIN-C3 (2009) PART 1 MAIN DEVELOPMENTS Methodological note Since the issue for the second quarter of 2004, nominal and real effective exchange rates presented in this report are calculated based on a
STAT/12/ October Household saving rate fell in the euro area and remained stable in the EU27. Household saving rate (seasonally adjusted)
") STAT/12/152 30 October 2012 Quarterly Sector Accounts: second quarter of 2012 Household saving rate down to 12.9% in the euro area and stable at 11. in the EU27 Household real income per capita fell by
STAT/12/152 30 October 2012 Quarterly Sector Accounts: second quarter of 2012 Household saving rate down to 12.9% in the euro area and stable at 11. in the EU27 Household real income per capita fell by
Lecture 1: Intermediate macroeconomics, autumn 2012
 Lecture 1: Intermediate macroeconomics, autumn 2012 Lars Calmfors Literature: Mankiw, Chapters 3 and 5. 1 Topics 1. The relationship between saving, investment and the interest rate in a closed economy
ANNEX 1 CMES: TRADE INDICATORS FOR FIVE MOST IMPORTANT EXPORT SECTORS
 ANNEX 1 CMES: TRADE INDICATORS FOR FIVE MOST IMPORTANT EXPORT SECTORS AND VEHICLES (87), MACHINERY (84) AND ELECTRONIC PRODUCTS (85) Germany Austria The Editor(s) (if applicable) and The Author(s) 2016
May 2009 Euro area external trade surplus 1.9 bn euro 6.8 bn euro deficit for EU27
 STAT/09/106 17 July 2009 May 2009 Euro area external trade surplus 1.9 6.8 deficit for EU27 The first estimate for the euro area 1 (EA16) trade balance with the rest of the world in May 2009 gave a 1.9
Schwerpunkt Außenwirtschaft 2016/17 Austrian economic activity, Austria's price competitiveness and a summary on external trade
 Schwerpunkt Außenwirtschaft /7 Austrian economic activity, Austria's price competitiveness and a summary on external trade Christian Ragacs, Klaus Vondra Abteilung für volkswirtschaftliche Analysen, OeNB
Quarterly Spanish National Accounts. Base 2008 Second quarter of 2013
 29 August 2013 Quarterly Spanish National Accounts. Base 2008 Second quarter of 2013 Quarterly National Accounts (GDP) Latest data Year-on-year growth rate Quarter-on-quarter growth rate Second quarter
May 2012 Euro area international trade in goods surplus of 6.9 bn euro 3.8 bn euro deficit for EU27
 108/2012-16 July 2012 May 2012 Euro area international trade in goods surplus of 6.9 3.8 deficit for EU27 The first estimate for the euro area 1 (EA17) trade in goods balance with the rest of the world
Belgium s foreign trade 2011
 Belgium s Belgium s BELGIAN FOREIGN TRADE IN Analysis of the figures for (Source: nbb community concept*) The following results demonstrate that Belgian did not suffer the negative effects of the crisis
Lecture 1b. The open economy. The international flows of capital and goods, balance of payments and exchange rates.
 Lecture 1b. The open economy. The international flows of capital and goods, balance of payments and exchange rates. Carlos Llano (P) & Nuria Gallego (TA) References: these slides have been developed based
Economic Performance. Lessons from the past and a guide for the future Björn Rúnar Guðmundson, Director
 Economic Performance Lessons from the past and a guide for the future Björn Rúnar Guðmundson, Director Analysis of economic performance Capital and labour: The raw ingredients in economic development However,
First estimate for 2011 Euro area external trade deficit 7.7 bn euro bn euro deficit for EU27
 27/2012-15 February 2012 First estimate for 2011 Euro area external trade deficit 7.7 152.8 deficit for EU27 The first estimate for the euro area 1 (EA17) trade in goods balance with the rest of the world
June 2014 Euro area international trade in goods surplus 16.8 bn 2.9 bn surplus for EU28
 127/2014-18 August 2014 June 2014 Euro area international trade in goods surplus 16.8 bn 2.9 bn surplus for EU28 The first estimate for the euro area 1 (EA18) trade in goods balance with the rest of the
Slovak Competitiveness: Fundamentals, Indicators and Challenges
 Copyright rests with the author Slovak Competitiveness: Fundamentals, Indicators and Challenges Presentation by Mark De Broeck European Department, IMF Seminar Organized by the European Commission November
Quarterly Spanish National Accounts. Base 2000
 17 November 2010 Quarterly Spanish National Accounts. Base 2000 Third quarter of 2010 Quarterly National Accounts (GDP) Latest data Year-on-year growth rate Quarter-on-quarter growth rate Third quarter
June 2012 Euro area international trade in goods surplus of 14.9 bn euro 0.4 bn euro surplus for EU27
 121/2012-17 August 2012 June 2012 Euro area international trade in goods surplus of 14.9 0.4 surplus for EU27 The first estimate for the euro area 1 (EA17) trade in goods balance with the rest of the world
Previsions Macroeconòmiques. Macroeconomic scenario for the Catalan economy 2017 and June 2017
 PM Previsions Macroeconòmiques Macroeconomic scenario for the Catalan economy 2017 and 2018 June 2017 Previsions macroeconòmiques Macroeconomic scenario for the Catalan economy June 2017 ISSN: 2013-2182
Foreign Trade and Capital Exports
 Foreign Trade and Capital Exports Foreign trade Overall figures. For a long time Hungary has been a small, open, yet foreign trade sensitive country and, as a consequence, a vulnerable economy. Its GDP
August 2012 Euro area international trade in goods surplus of 6.6 bn euro 12.6 bn euro deficit for EU27
 146/2012-16 October 2012 August 2012 Euro area international trade in goods surplus of 6.6 12.6 deficit for EU27 The first estimate for the euro area 1 (EA17) trade in goods balance with the rest of the
August 2008 Euro area external trade deficit 9.3 bn euro 27.2 bn euro deficit for EU27
 STAT/08/143 17 October 2008 August 2008 Euro area external trade deficit 9.3 27.2 deficit for EU27 The first estimate for the euro area 1 (EA15) trade balance with the rest of the world in August 2008
The Competitiveness of the Spanish Economy in the Euro Area: some explanations for an ambivalent evolution
 The Competitiveness of the Spanish Economy in the Euro Area: some explanations for an ambivalent evolution Ramon Xifré ESCI Universitat Pompeu Fabra CompNet Workshop, September 2012 (Paris) Introduction
to 4 per cent annual growth in the US.
 A nation s economic growth is determined by the rate of utilisation of the factors of production capital and labour and the efficiency of their use. Traditionally, economic growth in Europe has been characterised
Lithuania: in a wind of change. Robertas Dargis President of the Lithuanian Confederation of Industrialists
 Lithuania: in a wind of change Robertas Dargis President of the Lithuanian Confederation of Industrialists 2017 06 15 Lithuanian Confederation of Industrialists - the largest business organisation in Lithuania
The Analysis of the Situation of Foreign Direct Investments in Romania
 The Analysis of the Situation of Foreign Direct Investments in Romania Camelia Milea 1, Florin Bălăşescu 2 Abstract: Foreign direct investments represent one of the ways of financing any economy. But like
Report on Finnish Technology Industry Exports
 Report on Finnish Technology Industry Exports Last observation October 2018, 2.1.2019 Goods Export of Technology Industry from Finland Goods Export of Technology Industry from Finland by Branches Source:
Growth in OECD Unit Labour Costs slows to 0.4% in the third quarter of 2016
 Growth in OECD Unit Labour Costs slows to.4% in the third quarter of 26 Growth in unit labour costs (ULCs) in the OECD area slowed to.4% in the third quarter of 26 (compared with.6% in the previous quarter)
Flexicurity: Lessons for Spain
 Flexicurity: Lessons for Spain Miguel A. Malo University of Salamanca HIGH-LEVEL SEMINAR ON LABOR MARKET EXPERIENCES: TOWARDS MORE EFFICIENT LABOR MARKETS (2010-05-11, Madrid). Flexibility and security
Quarterly Spanish National Accounts. Base 2008
 28 November 2013 Quarterly Spanish National Accounts. Base 2008 Third quarter of 2013 Quarterly National Accounts (GDP) Latest data Year-on-year growth rate Quarter-on-quarter growth rate Third quarter
Turkey: Recent Developments and Future Prospects. ISBANK Economic Research Division October 2018
 Turkey: Recent Developments and Future Prospects ISBANK Economic Research Division October 2018 Macroeconomic Outlook Strong Economic Growth Cycle GDP of 851 bn USD (2017), 10.6k USD (2017) per capita
The Stability and Growth Pact Status in 2001
 4 The Stability and Growth Pact Status in 200 Tina Winther Frandsen, International Relations INTRODUCTION The EU member states' public finances showed remarkable development during the 990s. In 993, the
Swedish portfolio holdings. Foreign equity securities and debt securities
 Swedish portfolio holdings Foreign equity securities and debt securities 2007 Swedish portfolio holdings Foreign equity securities and debt securities 2007 Statistiska centralbyrån 2008 Swedish portfolio
Israel through the Global Crisis: Do Innovations Help?
 Israel through the Global Crisis: Do Innovations Help? Prof. Zvi Eckstein Dean, School of Economics, IDC Herzliya 24 March 2014 1 Outline The Macro Picture Innovations and Start Ups 2 Growth Rates - Israel,
Global Economy is Expected to Grow by 3.4 % in 2016 GDP growth in 2016, %
 Russia Brazil Mexico Rest of Latin America Rest of Eastern Europe Middle East and Africa Global Economy is Expected to Grow by 3.4 % in 216 GDP growth in 216, % 9 8 7 6 5 4 3 2 1-1 -2-3 -4 North America
EMPLOYMENT RATE IN EU-COUNTRIES 2000 Employed/Working age population (15-64 years)
") EMPLOYMENT RATE IN EU-COUNTRIES 2 Employed/Working age population (15-64 years EU-15 Denmark Netherlands Great Britain Sweden Portugal Finland Austria Germany Ireland Luxembourg France Belgium Greece Spain
EMPLOYMENT RATE IN EU-COUNTRIES 2 Employed/Working age population (15-64 years EU-15 Denmark Netherlands Great Britain Sweden Portugal Finland Austria Germany Ireland Luxembourg France Belgium Greece Spain
FEDERAL RESERVE BULLETIN
 March 9 FEDERAL RESERVE BULLETIN VOLUME 0 March 9 NUMBER The rebuilding of foreign gold and dollar to more adequate levels continued in 9, especially in Continental Western Europe and the Sterling Area.
II.2. Member State vulnerability to changes in the euro exchange rate ( 35 )
") II.2. Member State vulnerability to changes in the euro exchange rate ( 35 ) There have been significant fluctuations in the euro exchange rate since the start of the monetary union. This section assesses
II.2. Member State vulnerability to changes in the euro exchange rate ( 35 ) There have been significant fluctuations in the euro exchange rate since the start of the monetary union. This section assesses
Understanding the Macroeconomic Scenario: Global Demand, Global Supply Chains
 Understanding the Macroeconomic Scenario: Global Demand, Global Supply Chains 12 June 2014 Fabio Sdogati, fabio.sdogati@polimi.it Table of Contents 1. Economic Scenario after the Great Recession 2. Structural
World Economic Outlook Central Europe and Baltic Countries
 World Economic Outlook Central Europe and Baltic Countries Presentation by Susan Schadler and Christoph Rosenberg September 5 World growth returns to trend. (World real GDP growth, annual percent change)
Trade and Development Board Sixty-first session. Geneva, September 2014
 UNITED NATIONS CONFERENCE ON TRADE AND DEVELOPMENT Trade and Development Board Sixty-first session Geneva, 15 26 September 2014 Item 3: High-level segment Tackling inequality through trade and development:
FAQ: Forces in the Global Market
 Question 1: How did the European Union evolve, and how is it evolving now? Answer 1: The evolution of trade agreements within Europe, commencing with the Treaty of Rome, was a methodical process encompassing
Courthouse News Service
 14/2009-30 January 2009 Sector Accounts: Third quarter of 2008 Household saving rate at 14.4% in the euro area and 10.7% in the EU27 Business investment rate at 23.5% in the euro area and 23.6% in the
ECB LTRO Dec Greece program
 International Monetary Fund June 9, 212 Euro Area Crisis: Still in the Danger Zone */ Emil Stavrev Research Department ( */ Views expressed in this presentation are those of the author and do not necessarily
The current state of the Japanese Economy and mid- to long-term challenges it faces
 The current state of the Japanese Economy and mid- to long-term challenges it faces July 2, 2008 Atsushi NAKAJIMA, Chief Economist. 1. Recent developments and outlook on the Japanese economy (1) The rise
No. 1. Key Economic Indicators. Bank Austria Economics & Market Analysis Austria
 No. 00 Key Economic Indicators Bank Austria Economics & Market Analysis Austria Key Economic Indicators Issue /00 Economic Forecasts for Austria Percentage change over previous year 008 009 00 0 GDP (real).0.8..4
European Competitiveness in an Open World EIB Economics Conference, Berlin, 2-3 March, 2015
 European Competitiveness in an Open World EIB Economics Conference, Berlin, 2-3 March, 2015 Boris Vujčić, Governor boris.vujcic@hnb.hr Europe s convergence to the US has stopped a quarter of century ago
II.3. A competitiveness measure based on sector unit labour costs ( 67 )
") II.3. A competitiveness measure based on sector unit labour costs ( 67 ) This section presents a new indicator of competitiveness to complement the real effective exchange rate (REER) ( 68 ). The new indicator
II.3. A competitiveness measure based on sector unit labour costs ( 67 ) This section presents a new indicator of competitiveness to complement the real effective exchange rate (REER) ( 68 ). The new indicator
Quarterly Spanish National Accounts. Base 2000
 May 19 2010 Quarterly Spanish National Accounts. Base 2000 First quarter of 2010 Quarterly National Accounts (GDP) Latest data Year-on-year growth rate Quarter-on-quarter growth rate First quarter of 2010-1.3
EUROPEAN UNION SOUTH KOREA TRADE AND INVESTMENT 5 TH ANNIVERSARY OF THE FTA. Delegation of the European Union to the Republic of Korea
 EUROPEAN UNION SOUTH KOREA TRADE AND INVESTMENT 5 TH ANNIVERSARY OF THE FTA 2016 Delegation of the European Union to the Republic of Korea 16 th Floor, S-tower, 82 Saemunan-ro, Jongno-gu, Seoul, Korea
ANNUAL REPORT 2015 CHAPTER 2 COMPETITIVE ADJUSTMENT AND RECOVERY IN THE SPANISH ECONOMY DIRECTORATE GENERAL ECONOMICS, STATISTICS AND RESEARCH
 ANNUAL REPORT 215 CHAPTER 2 COMPETITIVE ADJUSTMENT AND RECOVERY IN THE SPANISH ECONOMY THE RECOVERY IN COMPETITIVENESS There has been a significant improvement in price/cost competitiveness since 28, although
Main Development Trends of Czech Economy in 2013 and the Perspective for (April 2014)
") Main Development Trends of Czech Economy in 2013 and the Perspective for 2014 (April 2014) The Czech Industry Results in 2013 in the Context of the EU Market and the Perspective for 2014 The Development
Main Development Trends of Czech Economy in 2013 and the Perspective for 2014 (April 2014) The Czech Industry Results in 2013 in the Context of the EU Market and the Perspective for 2014 The Development
Statistics Brief. Inland transport infrastructure investment on the rise. Infrastructure Investment. August
 Statistics Brief Infrastructure Investment August 2017 Inland transport infrastructure investment on the rise After nearly five years of a downward trend in inland transport infrastructure spending, 2015
Inflation Differentials in the Euro Area
 Inflation Differentials in the Euro Area Borka Babic, Economics INTRODUCTION Inflation varies considerably across the euro area member states with low inflation in Germany and inflation significantly above
Atradius Country Report. Main Western European Markets - May 2018
 Atradius Country Report Main Western European Markets - May 8 Contents Austria Belgium Denmark 7 France 9 Germany Ireland Italy The Netherlands 7 Spain 9 Sweden Switzerland United Kingdom Print all Austria
PUBLIC FINANCE IN THE EU: FROM THE MAASTRICHT CONVERGENCE CRITERIA TO THE STABILITY AND GROWTH PACT
 8 : FROM THE MAASTRICHT CONVERGENCE CRITERIA TO THE STABILITY AND GROWTH PACT Ing. Zora Komínková, CSc., National Bank of Slovakia With this contribution, we open up a series of articles on public finance
No. 2. Key Economic Indicators. Bank Austria Economics & Market Analysis Austria
 No. 00 Key Economic Indicators Bank Austria Economics & Market Analysis Austria Key Economic Indicators Issue /00 Economic Forecasts for Austria Percentage change over previous year 008 009 00 0 GDP (real)..9..4
The World of Factoring. VII International Factoring Congress, Warsaw, Poland 22 September 2016 Erik Timmermans, Deputy Secretary General FCI
 The World of Factoring VII International Factoring Congress, Warsaw, Poland 22 September 2016 Erik Timmermans, Deputy Secretary General FCI Global Factoring Volume 1995-2015 2 500 (IN EURO BILLIONS) 2
Eesti Pank ESTONIA S BALANCE OF PAYMENTS FOR 2016
 Eesti Pank ESTONIA S BALANCE OF PAYMENTS FOR 216 217 The Balance of Payments Yearbook is a longer analysis of annual external sector statistics, which includes a number of graphs. In addition, the yearbook
SPANISH EXTERNAL SECTOR AND COMPETITIVENESS: SOME HIGHLIGHTS
 SPANISH EXTERNAL SECTOR AND COMPETITIVENESS: SOME HIGHLIGHTS Summary Spain has significantly increased its trade openness in the last two decades Despite the global crisis and increased competition from
Final Report. Framework Contract Sector Competitiveness (ENTR06/054) Client: DG ENTERPRISE. Framework Contract Consortium Leader: ECORYS Nederland BV
 Client: DG ENTERPRISE. Framework Contract Consortium Leader: ECORYS Nederland BV") Study on the cost competitiveness of European industry in the globalisation era - empirical evidence on the basis of relative unit labour costs (ULC) at sectoral level Final Report Framework Contract Sector
Study on the cost competitiveness of European industry in the globalisation era - empirical evidence on the basis of relative unit labour costs (ULC) at sectoral level Final Report Framework Contract Sector
The Spanish economy in 2014
 The Spanish economy in 2014 April 2014 World growth at differents speeds Forecasted real GDP growth in 2014 Changes in IMF forecasts for 2014 GDP growth since last summer Source: International Monetary
National Income & Business Cycles
 National Income & Business Cycles accounting identities for the open economy the small open economy model what makes it small how the trade balance and exchange rate are determined how policies affect
The labor force participation rate (LFPR) is the ratio of
 is the ratio of") InternationalEconomicTrends August Participation Dynamics: The More, the Merrier The labor force participation rate (LFPR) is the ratio of the labor force, employed and unemployed, to the working-age population.
InternationalEconomicTrends August Participation Dynamics: The More, the Merrier The labor force participation rate (LFPR) is the ratio of the labor force, employed and unemployed, to the working-age population.
International Statistical Release
 International Statistical Release This release and additional tables of international statistics are available on efama s website (www.efama.org). Worldwide Investment Fund Assets and Flows Trends in the
No. 1. Key Economic Indicators. Bank Austria Economics & Market Analysis Austria
 No. 0 Key Economic Indicators Bank Austria Economics & Market Analysis Austria Key Economic Indicators Issue /0 Economic Forecasts for Austria Percentage change over previous year 009 00 0 0 GDP (real).9.9.0.8
The Israeli Economy Strong & Stable, A+
 The Israeli Economy Strong & Stable, A+ But does not leverage its full potential April 23, 2018 Dr. Yacov Sheinin, Dr. Rachel Sheinin Disclaimer This review is intended solely for clients of Economic Models
Finland's Balance of Payments. Preliminary Review 2007
 Finland's Balance of Payments Preliminary Review 27 1 Current account, 198 27 1 Credit Net - -1 198 198 199 199 2 2 Current transfers Income Services Goods Curent account, net Debit Bank of Finland Financial
New in 2013: Greater emphasis on capital flows Refinements to EBA methodology Individual country assessments
 As in 212: Stock-take: multilaterally consistent assessment of external sector policies of the largest economies Feeds into Article IVs Draws on External Balance Assessment (EBA) methodology/other Identifies
A macroeconomic survey of Europe
 A macroeconomic survey of Europe Olivier Blanchard January 2007 Nr. 1 Four themes A broad based (both across countries, across consumption, investment and exports) expansion. Not a boom. Fundamentals in
EU-28 RECOVERED PAPER STATISTICS. Mr. Giampiero MAGNAGHI On behalf of EuRIC
 EU-28 RECOVERED PAPER STATISTICS Mr. Giampiero MAGNAGHI On behalf of EuRIC CONTENTS EU-28 Paper and Board: Consumption and Production EU-28 Recovered Paper: Effective Consumption and Collection EU-28 -
Wages, Productivity and the Paradoxes of Disappearing Mass Unemployment in Europe
 Wages, Productivity and the Paradoxes of Disappearing Mass Unemployment in Europe Tito Boeri XXIII National Conference of Labour Economics Brescia 11-12 September 2008 1994 OECD Jobs Study The labour market
The Economics of European Integration
 The Economics of European Integration Chapter 7 Growth Effects & Factor Market Integration Growth Effects European leaders have long emphasised the pro-growth aspects of European integration. These operate