Lecture 1: Intermediate macroeconomics, autumn 2012
|
|
|
- Kelly Wade
- 5 years ago
- Views:
Transcription

1 Lecture 1: Intermediate macroeconomics, autumn 2012 Lars Calmfors Literature: Mankiw, Chapters 3 and 5.
2 1 Topics 1. The relationship between saving, investment and the interest rate in a closed economy (the world economy) 2. The relationship between fiscal deficits and the interest rate 3. The relationship between saving, investment and the current account in an open economy 4. The relationship between the fiscal balance and the current account in an open economy 5. Trade imbalances in the euro area 6. The current account and the exchange rate 7. Sweden's crisis in the 1990s and the exchange rate depreciation 8. The need for real exchange rate depreciations in the euro area
3 A model of a closed economy 2 Y = F(K, L) K = K L = L Y = C + I + G C = C(Y T) I = I(r) G = G T = T Production function Given capital stock Given labour force Goods market equilibrium Consumption function Investment function Given government expenditure Given lump sum tax Goods market equilibrium Y C( Y T) I( r) G G r I Equilibrium in the market for credit ( loanable funds ) S Y C( Y T) G I( r) Saving = Investment S Y T C( Y T) T G I( r) Private saving + Government saving = Investment G r I
4 Figure 3-6: The consumption function 3
5 Figure 3-7: The investment function 4
6 Figure 3-8: Saving, investment and the interest rate 5
7 Figure 3-9: A reduction in saving 6
8 Figure 3-10: Military spending and the interest rate in the United Kingdom 7
9 8 Current situation Fiscal deficits in many countries - insufficient fiscal restraint in good times - fall in tax revenues in the financial crisis - support to the financial sector - fiscal stimulus programmes High interest rates in countries with solvency problems So far low interest rates in countries without credibility problems
10 General government net lending, per cent of GDP US Japan EU UK Source: European Commission

11 10
12 Statsobligationsräntor i valda länder 11 Procent, dagsvärden, 5-dagars glidande medelvärde Spanien Tyskland Italien Sverige
13 12 Realobligationsräntor Procent, månadsvärden Storbritannien USA
14 Figure 3-11: An Increase in the demand for investment 13

15 Figure 3-12: An increase in investment demand when saving depends on the interest rate 14


16 Figure 5.1 Imports and exports as a percentage of output:
17 16 Equilibrium in the open economy ) Net Exports = Output Domestic Spending
18 BNP-andelar 17 Procent av BNP, löpande priser Hushållens konsumtion Offentlig konsumtion Fasta bruttoinvesteringar Nettoexport (höger)
19 18 Saving-investment balance in an open economy S = Y C G = I + NX Saving can be of two forms: physical accumulation of real capital (I) or accumulation of financial claims on the rest of the world resulting from net exports (NX). S I = NX Net exports are the difference between saving and investment. Net exports = trade balance Saving minus investment = net capital outflow (net foreign investment)
20 19 A model of a small open economy r r* Y Y F( K, L) C I C( Y T) I() r NX ( Y C G) I S I Reduced form NX = Y C(Y T) G I(r*) NX = S I(r*) Net export equals the difference between saving and investment at the given world market real rate of interest
21 Figure 5-2: Saving and investment in a small open economy 20

22 Figure 5-3: A fiscal expansion at home in a small open economy 21
23 Figure 5.4: A fiscal expansion abroad in a small open economy 22
24 Figure 5-5: A shift in the investment schedule in a small open economy 23
25 24 Current account balance = Net exports + net return on foreign assets CA = NX + r NFA CA = current account balance NX = net exports r = interest rate NFA = Net foreign assets = Foreign assets - Foreign debt Mankiw simplifies the analysis by neglecting the net return on foreign assets.
26 US current account %ofgdp %ofgdp Gross investment Gross saving %ofgdp %ofgdp Current account balance Net household lending Net business lending Net government lending Source: Bureau of Economic Analysis; Datastream, last accessed on 19 January 2011.
27 The current account balance of China, per cent of GDP

28 27
29 External balances from a savings and investment perspective % of GDP Germany 40 %ofgdp France %ofgdp Italy 40 %ofgdp Spain %ofgdp Greece 40 %ofgdp Ireland %ofgdp Portugal 40 %ofgdp United Kingdom surplus deficit gross saving gross investment Source: Eurostat, last accessed on 19 January 2011.
30 29 Current account balances % of GDP Luxembourg Netherlands Germany Austria Finland Belgium France Italy Slovenia Ireland Slovakia Malta Estonia Spain Cyprus Portugal Greece Source: Eurostat, Ifo Institute calculations.
31 30 Current account (per cent of GDP) Greece 12,3 11,3 7,8 Ireland 0,5 0,0 1,6 Portugal 9,7 6,5 3,6 Spain 4,5 2,0 1,0 Italy 3,5 1,3 3,0 Cyprus 8,7 7,7 7,2 Germany 5,8 5,3 4,7 Euro area 1,4 0,4 0,6 Sweden 6,8 6,4 5,8
32 31 Qualifications regarding interest rates The interest rate r in Mankiw should be interpreted as a long-term bond interest rate (say on 10-year bonds) In Mankiw there is only one world real interest rate which applies to all countries This is a reasonable assumption when debts of various countries are regarded as perfect substitutes for each other It is not a reasonable assumption when financial markets, as they do now, doubt the solvency (the ability to service the debt) of some countries In such a situation investors demand a risk premium when lending to countries that are regarded as risky - currently large interest rate differentials on government bonds in the eurozone with higher interest rates for countries with large government debt - these interest rate differentials spill over to private sector debt
33 32 Public finances 2011 Government net lending (per cent of GDP) General government consolidated gross debt (per cent of GDP) Greece 9,1 165,3 Ireland 13,1 108,2 Italy 3,9 120,1 Portugal 4,2 107,8 Spain 8,5 69,6 Cyprus 6,3 71,6 Belgium 3,7 98,0 France 5,2 85,8 Germany 1,0 81,2 Sweden 0,3 38,4
34 % Interest rates, ten-year government bonds Irrevocably fixed conversion rates Introduction of virtual euro Greece Introduction of euro cash 15 Portugal Ireland Italy Spain Belgium France Germany Source: Thomson Reuters Datastream.
35 34 The real exchange rate Real exchange rate = the relative price between domestic and foreign goods p = Swedish product price in SEK p* = foreign product price (in $) e = nominal exchange rate (units of foreign currency per unit of domestic currency, $/SEK) = real exchange rate Real exchange rate = nominal exchange rate ($/SEK) x Swedish product price (SEK) / foreign product price ($) = e (p/p*) e p p* e p p Percentage change in real exchange rate percentage change in nominal exchange rate + percentage change in Swedish product price percentage change in foreign product price real appreciation (the relative price of domestic goods increases) real depreciation (the relative price of domestic goods falls) NX = NX( ) NX Net export is negatively related to the real exchange rate (the relative price of domestic goods)
36 Figure 5-7: Net exports and the real exchange rate 35
37 Figure 5-8: How the real exchange rate is determined 36
38 Figure 5-9:The impact of expansionary fiscal policy at home on the real exchange rate 37

39 Figure 5-10: The impact of expansionary fiscal policy abroad on the real exchange rate 38
40 Figure 5-11: The impact of an increase in investment demand on the real exchange rate 39
41 40 Elimination of current account deficits This requires a real exchange rate depreciation Sweden had large current account deficits in the late 1980s before the 1990s crisis These deficits were eliminated through a large nominal - and real - exchange rate depreciation in 1992 when the fixed exchange rate was abandoned and the krona was allowed to float Large increases in net exports in subsequent years Greece, Portugal, Ireland, Spain and Italy all have had current account deficits after large real exchange rate appreciations But real exchange rate depreciations are difficult to achieve within the eurozone where there are no longer any nominal exchange rates between countries Instead lower inflation (price and wage cuts) are required in crisis countries and higher inflation in Germany and other surplus countries
42 Nominal exchange rate and relative unit labour costs vis-à-vis EU-15 for Sweden Index: 1985=100 relative unit labour costs in national currencies relative unit labour costs in common currency Nominal effective exchange rate Sources: Ameco and own calculations.
43 42 5 Fiscal consolidation, GDP growth and change in net exports in Sweden, % Real GDP growth Change in net exports relative to preceding year's GDP Change in general government net lending, in % of GDP Sources: Ameco and own calculations.
44 43 General government net lending in Sweden and the euro area 4 % of GDP Sweden 0 4 EU Note: EU-8 is a weighted average for Austria, Belgium, Finland, France, (West) Germany, Italy, the Netherlands and Portugal. Sources: OECD Economic Outlook No. 89 (Sweden); and Ameco and own calculations (EU-8).
45 44 Slovenia Slovakia Greece Spain Ireland Cyprus Portugal Luxembourg Italy Netherlands Euro area Belgium France Finland Austria Germany % 9 Price developments Real appreciation compared to other euro area countries, trade-weighted: GIIPS: + 30 % Germany: - 22 % Note: Price change and exchange rate realignments (before May 1998). Source: Eurostat, Database, Economy and Finance, National accounts,gdp and main components - Price indices; Ifo Institute calculations. 108
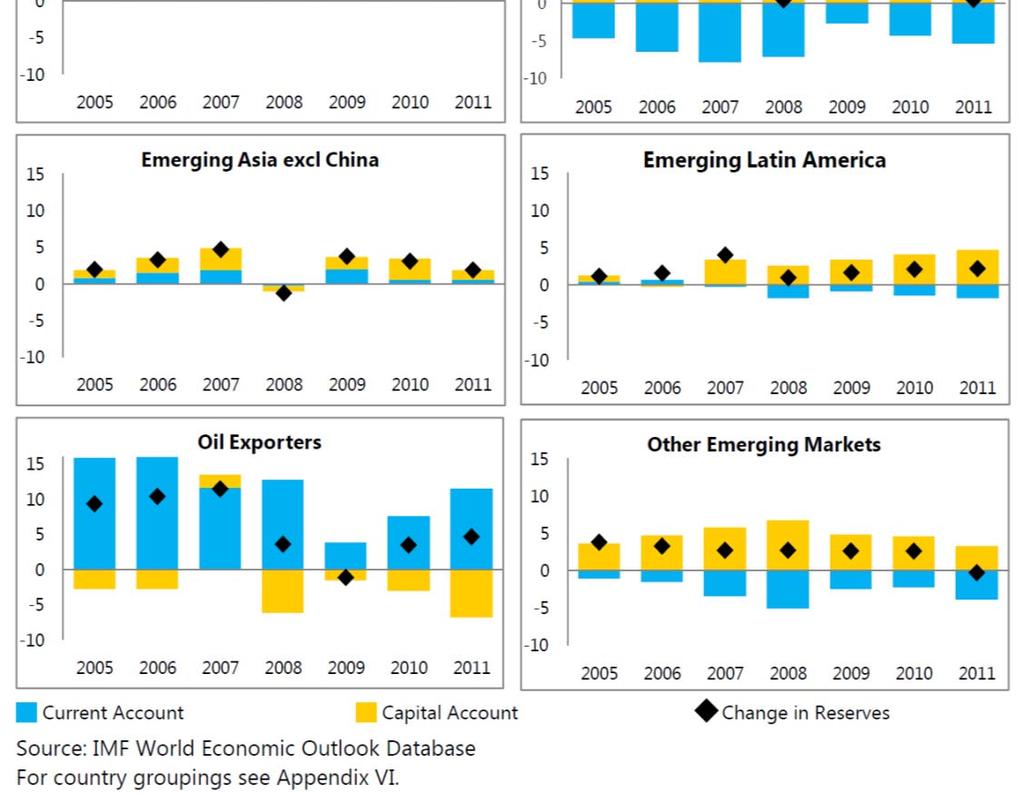
46 45 What explains past global imbalances? 1. Low US savings (governments and households) 2. Saving glut in the rest of the world (China and other Asian Countries 3. Strategy for export-led growth in China and other Asian countries - fixed exchange rate - desire to build up foreign exchange reserves (precautionary motive) Elimination of US current account deficit requires large US real exchange rate depreciation

47 46
48 47

49 48
Lecture 1: Intermediate macroeconomics, autumn Lars Calmfors
 Lecture 1: Intermediate macroeconomics, autumn 2009 Lars Calmfors 1 Topics 1. The relationship between savings, investment and real interest rates in a closed economy (the world economy) 2. The relationship
Intermediate Macroeconomics
 Intermediate Macroeconomics L1: National Income in Closed and Open Economies Anna Seim Department of Economics, Stockholm University Spring 2015 Topics The relationship between Saving and investment in
EMPLOYMENT RATE IN EU-COUNTRIES 2000 Employed/Working age population (15-64 years)
") EMPLOYMENT RATE IN EU-COUNTRIES 2 Employed/Working age population (15-64 years EU-15 Denmark Netherlands Great Britain Sweden Portugal Finland Austria Germany Ireland Luxembourg France Belgium Greece Spain
EMPLOYMENT RATE IN EU-COUNTRIES 2 Employed/Working age population (15-64 years EU-15 Denmark Netherlands Great Britain Sweden Portugal Finland Austria Germany Ireland Luxembourg France Belgium Greece Spain
EU BUDGET AND NATIONAL BUDGETS
 DIRECTORATE GENERAL FOR INTERNAL POLICIES POLICY DEPARTMENT ON BUDGETARY AFFAIRS EU BUDGET AND NATIONAL BUDGETS 1999-2009 October 2010 INDEX Foreward 3 Table 1. EU and National budgets 1999-2009; EU-27
EMPLOYMENT RATE Employed/Working age population (15 64 years)
") EMPLOYMENT RATE 198 26 Employed/Working age population (15 64 years 8 % Finland 75 EU 15 EU 25 7 65 6 55 5 8 82 84 86 88 9 92 94 96 98 2 4** 6** 14.4.25/SAK /TL Source: European Commission 1 UNEMPLOYMENT
EMPLOYMENT RATE 198 26 Employed/Working age population (15 64 years 8 % Finland 75 EU 15 EU 25 7 65 6 55 5 8 82 84 86 88 9 92 94 96 98 2 4** 6** 14.4.25/SAK /TL Source: European Commission 1 UNEMPLOYMENT
The impact of the European System of Accounts 2010 on euro area macroeconomic statistics
 Box 8 The impact of the European System of Accounts 21 on euro area macroeconomic statistics The introduction of the new European System of Accounts 21 (ESA 21) in line with international statistical standards
Lecture 4: Intermediate macroeconomics, autumn 2012
 Lecture 4: Intermediate macroeconomics, autumn 2012 Lars Calmfors Literature: Krugman Obstfeld Melitz, Chapters 14 and 15. 1 What have we done so far? Where are we going? Lecture 1: National income, saving
EMPLOYMENT RATE Employed/Working age population (15-64 years)
") 1 EMPLOYMENT RATE 1980-2003 Employed/Working age population (15-64 years 80 % Finland (Com 75 70 65 60 EU-15 Finland (Stat. Fin. 55 50 80 82 84 86 88 90 92 94 96 98 00 02 9.9.2002/SAK /TL Source: European
1 EMPLOYMENT RATE 1980-2003 Employed/Working age population (15-64 years 80 % Finland (Com 75 70 65 60 EU-15 Finland (Stat. Fin. 55 50 80 82 84 86 88 90 92 94 96 98 00 02 9.9.2002/SAK /TL Source: European
Fiscal rules in Lithuania
 Fiscal rules in Lithuania Algimantas Rimkūnas Vice Minister, Ministry of Finance of Lithuania 3 June, 2016 Evolution of National and EU Fiscal Regulations Stability and Growth Pact (SGP) Maastricht Treaty
Live Long and Prosper? Demographic Change and Europe s Pensions Crisis. Dr. Jochen Pimpertz Brussels, 10 November 2015
 Live Long and Prosper? Demographic Change and Europe s Pensions Crisis Dr. Jochen Pimpertz Brussels, 10 November 2015 Old-age-dependency ratio, EU28 45,9 49,4 50,2 39,0 27,5 31,8 2013 2020 2030 2040 2050
Macroeconomic scenarios for skill demand and supply projections, including dealing with the recession
 Alphametrics (AM) Alphametrics Ltd Macroeconomic scenarios for skill demand and supply projections, including dealing with the recession Paper presented at Skillsnet technical workshop on: Forecasting
Lecture 6: Intermediate macroeconomics, autumn Lars Calmfors
 Lecture 6: Intermediate macroeconomics, autumn 2009 Lars Calmfors 1 Topics Systems of fixed exchange rates Interest rate parity under a fixed exchange rate Stabilisation policy under a fixed exchange rate
Preliminary results of International Trade in 2014: in nominal terms exports increased by 1.8% and imports increased by 3.
 International Trade Statistics 7 July, 215 Preliminary results of International Trade in : in nominal terms exports increased by 1.8% and imports increased by 3.2% vis-à-vis 213 In, exports of goods increased
STAT/12/ October Household saving rate fell in the euro area and remained stable in the EU27. Household saving rate (seasonally adjusted)
") STAT/12/152 30 October 2012 Quarterly Sector Accounts: second quarter of 2012 Household saving rate down to 12.9% in the euro area and stable at 11. in the EU27 Household real income per capita fell by
STAT/12/152 30 October 2012 Quarterly Sector Accounts: second quarter of 2012 Household saving rate down to 12.9% in the euro area and stable at 11. in the EU27 Household real income per capita fell by
DG TAXUD. STAT/11/100 1 July 2011
 DG TAXUD STAT/11/100 1 July 2011 Taxation trends in the European Union Recession drove EU27 overall tax revenue down to 38.4% of GDP in 2009 Half of the Member States hiked the standard rate of VAT since
EU-28 RECOVERED PAPER STATISTICS. Mr. Giampiero MAGNAGHI On behalf of EuRIC
 EU-28 RECOVERED PAPER STATISTICS Mr. Giampiero MAGNAGHI On behalf of EuRIC CONTENTS EU-28 Paper and Board: Consumption and Production EU-28 Recovered Paper: Effective Consumption and Collection EU-28 -
Fiscal Policy, Budget Deficits and the Economic Crisis. Lars Calmfors Intermediate macroeconomics Stockholm, 30 March 2010
 Fiscal Policy, Budget Deficits and the Economic Crisis Lars Calmfors Intermediate macroeconomics Stockholm, 30 March 2010 Three lines of defence against the economic crisis 1. Measures to deal with the
Chart pack to council for cooperation on macroprudential policy
 Chart pack to council for cooperation on macroprudential policy Contents List of charts... 3 Macro and macro-financial setting... 5 Swedish macroeconomic setting... 5 Foreign macroeconomic setting... Macro-financial
EUROPA - Press Releases - Taxation trends in the European Union EU27 tax...of GDP in 2008 Steady decline in top corporate income tax rate since 2000
 DG TAXUD STAT/10/95 28 June 2010 Taxation trends in the European Union EU27 tax ratio fell to 39.3% of GDP in 2008 Steady decline in top corporate income tax rate since 2000 The overall tax-to-gdp ratio1
Lecture 1b. The open economy. The international flows of capital and goods, balance of payments and exchange rates.
 Lecture 1b. The open economy. The international flows of capital and goods, balance of payments and exchange rates. Carlos Llano (P) & Nuria Gallego (TA) References: these slides have been developed based
Analysis of European Union Economy in Terms of GDP Components
 Expert Journal of Economic s (2 0 1 3 ) 1, 13-18 2013 Th e Au thor. Publish ed by Sp rint In v estify. Econ omics.exp ertjou rn a ls.com Analysis of European Union Economy in Terms of GDP Components Simona
CANADA EUROPEAN UNION
 THE EUROPEAN UNION S PROFILE Economic Indicators Gross domestic product (GDP) at purchasing power parity (PPP): US$20.3 trillion (2016) GDP per capita at PPP: US$39,600 (2016) Population: 511.5 million
Macroeconomic Policies in Europe: Quo Vadis A Comment
 Macroeconomic Policies in Europe: Quo Vadis A Comment February 12, 2016 Helene Schuberth Outline Staff Projection of the Euro Area Monetary Policy Investment Rebalancing in the euro area Fiscal Policy
PUBLIC PROCUREMENT INDICATORS 2011, Brussels, 5 December 2012
 PUBLIC PROCUREMENT INDICATORS 2011, Brussels, 5 December 2012 1. INTRODUCTION This document provides estimates of three indicators of performance in public procurement within the EU. The indicators are
Quarterly Financial Accounts Household net worth reaches new peak in Q Irish Household Net Worth
 Quarterly Financial Accounts Q4 2017 4 May 2018 Quarterly Financial Accounts Household net worth reaches new peak in Q4 2017 Household net worth rose by 2.1 per cent in Q4 2017. It now exceeds its pre-crisis
January 2005 Euro-zone external trade deficit 2.2 bn euro 14.0 bn euro deficit for EU25
 42/2005-23 March 2005 January 2005 Euro-zone external trade deficit 2.2 14.0 deficit for EU25 The first estimate for euro-zone 1 trade with the rest of the world in January 2005 was a 2.2 billion euro
74 ECB THE 2012 MACROECONOMIC IMBALANCE PROCEDURE
 Box 7 THE 2012 MACROECONOMIC IMBALANCE PROCEDURE This year s European Semester (i.e. the framework for EU policy coordination introduced in 2011) includes, for the first time, the implementation of the
The Swedish Fiscal Framework and the Fiscal Policy Council. Lars Calmfors Workshop on Fiscal Rules and Institutions OECD, 22 March, 2010
 The Swedish Fiscal Framework and the Fiscal Policy Council Lars Calmfors Workshop on Fiscal Rules and Institutions OECD, 22 March, 2010 General government net lending in Sweden, per cent of GDP 6 4 2 0-2
Courthouse News Service
 14/2009-30 January 2009 Sector Accounts: Third quarter of 2008 Household saving rate at 14.4% in the euro area and 10.7% in the EU27 Business investment rate at 23.5% in the euro area and 23.6% in the
The Global Financial Crisis and the Return of the Nordic Model?
 The Global Financial Crisis and the Return of the Nordic Model? Lars Calmfors Embassy of Denmark and the Swedish Institute of International Affairs 18 November Topics 1. The global economic crisis 2. Globalisation
May 2012 Euro area international trade in goods surplus of 6.9 bn euro 3.8 bn euro deficit for EU27
 108/2012-16 July 2012 May 2012 Euro area international trade in goods surplus of 6.9 3.8 deficit for EU27 The first estimate for the euro area 1 (EA17) trade in goods balance with the rest of the world
Growth, competitiveness and jobs: priorities for the European Semester 2013 Presentation of J.M. Barroso,
 Growth, competitiveness and jobs: priorities for the European Semester 213 Presentation of J.M. Barroso, President of the European Commission, to the European Council of 14-1 March 213 Economic recovery
Macroeconomic overview SEE and Macedonia
 Macroeconomic overview SEE and Macedonia Zoltan Arokszallasi Chief Analyst, Macro & FX/FI Research Erste Group Bank Erste Investors Breakfast, 29 September, Skopje 02. Oktober SEE shows mixed performance
First estimate for 2011 Euro area external trade deficit 7.7 bn euro bn euro deficit for EU27
 27/2012-15 February 2012 First estimate for 2011 Euro area external trade deficit 7.7 152.8 deficit for EU27 The first estimate for the euro area 1 (EA17) trade in goods balance with the rest of the world
June 2014 Euro area international trade in goods surplus 16.8 bn 2.9 bn surplus for EU28
 127/2014-18 August 2014 June 2014 Euro area international trade in goods surplus 16.8 bn 2.9 bn surplus for EU28 The first estimate for the euro area 1 (EA18) trade in goods balance with the rest of the
STAT/14/ October 2014
 STAT/14/158-21 October 2014 Provision of deficit and debt data for 2013 - second notification Euro area and EU28 government deficit at 2.9% and 3.2% of GDP respectively Government debt at 90.9% and 85.4%
June 2012 Euro area international trade in goods surplus of 14.9 bn euro 0.4 bn euro surplus for EU27
 121/2012-17 August 2012 June 2012 Euro area international trade in goods surplus of 14.9 0.4 surplus for EU27 The first estimate for the euro area 1 (EA17) trade in goods balance with the rest of the world
August 2012 Euro area international trade in goods surplus of 6.6 bn euro 12.6 bn euro deficit for EU27
 146/2012-16 October 2012 August 2012 Euro area international trade in goods surplus of 6.6 12.6 deficit for EU27 The first estimate for the euro area 1 (EA17) trade in goods balance with the rest of the
STAT/09/56 22 April 2009
 STAT/09/56 22 April 2009 Provision of deficit and debt data for 2008 - first notification Euro area and EU27 government deficit at 1.9% and 2.3% of GDP respectively Government debt at 69.3% and 61.5% In
The Brussels Economic Forum
 The Brussels Economic Forum What kind of policies should the new Member States apply to optimise their speed of convergence? Banco de Portugal VÍTOR CONSTÂNCIO Brussels, 23d of April 24 I. INTRODUCTION
March 2005 Euro-zone external trade surplus 4.2 bn euro 6.5 bn euro deficit for EU25
 STAT/05/67 24 May 2005 March 2005 Euro-zone external trade surplus 4.2 6.5 deficit for EU25 The first estimate for euro-zone 1 trade with the rest of the world in March 2005 was a 4.2 billion euro surplus,
GREEK ECONOMIC OUTLOOK
 CENTRE OF PLANNING AND ECONOMIC RESEARCH Issue 27, June 2015 GREEK ECONOMIC OUTLOOK Macroeconomic analysis and projections Public finance Human resources and social policies Development policies and sectors
Approach to Employment Injury (EI) compensation benefits in the EU and OECD
 compensation benefits in the EU and OECD") Approach to (EI) compensation benefits in the EU and OECD The benefits of protection can be divided in three main groups. The cash benefits include disability pensions, survivor's pensions and other short-
Approach to (EI) compensation benefits in the EU and OECD The benefits of protection can be divided in three main groups. The cash benefits include disability pensions, survivor's pensions and other short-
August 2005 Euro-zone external trade deficit 2.6 bn euro 14.2 bn euro deficit for EU25
 STAT/05/132 20 October 2005 August 2005 Euro-zone external trade deficit 2.6 14.2 deficit for EU25 The first estimate for euro-zone 1 trade with the rest of the world in August 2005 was a 2.6 billion euro
OVERVIEW. The EU recovery is firming. Table 1: Overview - the winter 2014 forecast Real GDP. Unemployment rate. Inflation. Winter 2014 Winter 2014
 OVERVIEW The EU recovery is firming Europe's economic recovery, which began in the second quarter of 2013, is expected to continue spreading across countries and gaining strength while at the same time
THE IMPACT OF THE PUBLIC DEBT STRUCTURE IN THE EUROPEAN UNION MEMBER COUNTRIES ON THE POSSIBILITY OF DEBT OVERHANG
 THE IMPACT OF THE PUBLIC DEBT STRUCTURE IN THE EUROPEAN UNION MEMBER COUNTRIES ON THE POSSIBILITY OF DEBT OVERHANG Robert Huterski, PhD Nicolaus Copernicus University in Toruń Faculty of Economic Sciences
REPORT FROM THE COMMISSION TO THE EUROPEAN PARLIAMENT, THE COUNCIL, THE EUROPEAN ECONOMIC AND SOCIAL COMMITTEE AND THE COMMITTEE OF THE REGIONS
 EUROPEAN COMMISSION Brussels,.4.29 COM(28) 86 final/ 2 ANNEXES to 3 ANNEX to the REPORT FROM THE COMMISSION TO THE EUROPEAN PARLIAMENT, THE COUNCIL, THE EUROPEAN ECONOMIC AND SOCIAL COMMITTEE AND THE COMMITTEE
Updates and revisions of national SUTs for the November 2013 release of the WIOD
 Updates and revisions of national SUTs for the November 2013 release of the WIOD Edited by Marcel Timmer (University of Groningen) With contributions from: Abdul A. Erumban, Reitze Gouma and Gaaitzen J.
A. INTRODUCTION AND FINANCING OF THE GENERAL BUDGET. EXPENDITURE Description Budget Budget Change (%)
") DRAFT AMENDING BUDGET NO. 2/2018 VOLUME 1 - TOTAL REVENUE A. INTRODUCTION AND FINANCING OF THE GENERAL BUDGET FINANCING OF THE GENERAL BUDGET Appropriations to be covered during the financial year 2018
DRAFT AMENDING BUDGET NO. 2/2018 VOLUME 1 - TOTAL REVENUE A. INTRODUCTION AND FINANCING OF THE GENERAL BUDGET FINANCING OF THE GENERAL BUDGET Appropriations to be covered during the financial year 2018
STAT/11/60 26 April 2011
 STAT/11/60 26 April 2011 Provision of deficit and debt data for 2010 - first notification Euro area and EU27 government deficit at 6.0% and 6.4% of GDP respectively Government debt at 85.1% and 80.0% In
Governor of the Bank of Latvia
 Lessons from Latvia s internal adjustment strategy Ilmārs Rimšēvičs Governor of the Bank of Latvia September 4, 2012 Presentation outline Overheating of Latvia s economy Expansionary consolidation Lessons
January 2014 Euro area international trade in goods surplus 0.9 bn euro 13.0 bn euro deficit for EU28
 STAT/14/41 18 March 2014 January 2014 Euro area international trade in goods surplus 0.9 13.0 deficit for EU28 The first estimate for the euro area 1 (EA18) trade in goods balance with the rest of the
Second estimate for the first quarter of 2010 EU27 current account deficit 34.8 bn euro 10.8 bn euro surplus on trade in services
 109/2010-22 July 2010 Second estimate for the first quarter of 2010 EU27 current account deficit 34.8 bn euro 10.8 bn euro surplus on trade in According to the latest revisions 1, the EU27 2 external current
Auditor s involvement in the contributions to the Single Resolution Fund. Providing assurance for 2014 and 2015 SURVEY
 Auditor s involvement in the contributions to the Single Resolution Fund Providing assurance for 2014 and 2015 SURVEY AUDIT & ASSURANCE SEPTEMBER 2016 HIGHLIGHTS This survey demonstrates divergence across
Economic Imbalances in the post-maastricht Treaty World A Look at Global and European Implications and Investment Conclusions
 Economic Imbalances in the post-maastricht Treaty World A Look at Global and European Implications and Investment Conclusions JOHN W. BECK Senior Vice President Co-Director, Global Fixed Income Franklin
Growth in OECD Unit Labour Costs slows to 0.4% in the third quarter of 2016
 Growth in OECD Unit Labour Costs slows to.4% in the third quarter of 26 Growth in unit labour costs (ULCs) in the OECD area slowed to.4% in the third quarter of 26 (compared with.6% in the previous quarter)
EU KLEMS Growth and Productivity Accounts March 2011 Update of the November 2009 release
 EU KLEMS Growth and Productivity Accounts March 2011 Update of the November 2009 release Description of methodology and country notes Prepared by Reitze Gouma, Klaas de Vries and Astrid van der Veen-Mooij
34 th Associates Meeting - Andorra, 25 May Item 5: Evolution of economic governance in the EU
 34 th Associates Meeting - Andorra, 25 May 2012 - Item 5: Evolution of economic governance in the EU Plan of the Presentation 1. Fiscal and economic coordination: how did it start? 2. Did it work? 3. Five
October 2010 Euro area unemployment rate at 10.1% EU27 at 9.6%
 STAT//180 30 November 20 October 20 Euro area unemployment rate at.1% EU27 at 9.6% The euro area 1 (EA16) seasonally-adjusted 2 unemployment rate 3 was.1% in October 20, compared with.0% in September 4.
Second estimate for the fourth quarter of 2011 EU27 current account surplus 13.1 bn euro 32.3 bn euro surplus on trade in services
 59/2012-18 April 2012 Second estimate for the fourth quarter of EU27 current account surplus 13.1 bn euro 32.3 bn euro surplus on trade in According to the latest available data, the EU27 1 external current
DETERMINANT FACTORS OF FDI IN DEVELOPED AND DEVELOPING COUNTRIES IN THE E.U.
 Diana D. COCONOIU Bucharest University of Economic Studies, Dimitrie Cantemir Christian University, DETERMINANT FACTORS OF FDI IN DEVELOPED AND DEVELOPING COUNTRIES IN THE E.U. Statistical analysis Keywords
3 Labour Costs. Cost of Employing Labour Across Advanced EU Economies (EU15) Indicator 3.1a
 Indicator 3.1a") 3 Labour Costs Indicator 3.1a Indicator 3.1b Indicator 3.1c Indicator 3.2a Indicator 3.2b Indicator 3.3 Indicator 3.4 Cost of Employing Labour Across Advanced EU Economies (EU15) Cost of Employing Labour
3 Labour Costs Indicator 3.1a Indicator 3.1b Indicator 3.1c Indicator 3.2a Indicator 3.2b Indicator 3.3 Indicator 3.4 Cost of Employing Labour Across Advanced EU Economies (EU15) Cost of Employing Labour
STAT/14/64 23 April 2014
 STAT/14/64 23 April 2014 Provision of deficit and debt data for 2013 - first notification Euro area and EU28 government deficit at 3.0% and 3.3% of GDP respectively Government debt at 92.6% and 87.1% In
Borderline cases for salary, social contribution and tax
 Version Abstract 1 (5) 2015-04-21 Veronica Andersson Salary and labour cost statistics Borderline cases for salary, social contribution and tax (Workshop on Labour Cost Survey, Rome, Italy 5-6 May 2015)
3 Labour Costs. Cost of Employing Labour Across Advanced EU Economies (EU15) Indicator 3.1a
 Indicator 3.1a") 3 Labour Costs Indicator 3.1a Indicator 3.1b Indicator 3.1c Indicator 3.2a Indicator 3.2b Indicator 3.3 Indicator 3.4 Cost of Employing Labour Across Advanced EU Economies (EU15) Cost of Employing Labour
3 Labour Costs Indicator 3.1a Indicator 3.1b Indicator 3.1c Indicator 3.2a Indicator 3.2b Indicator 3.3 Indicator 3.4 Cost of Employing Labour Across Advanced EU Economies (EU15) Cost of Employing Labour
Bank resolution in the Swedish context
 Bank resolution in the Swedish context Hans Lindblad Director General UBS Annual Nordic Financial Services Conference Stockholm 8 september 2016 The Swedish economy is performing well GDP growth is strong
NOTE. for the Interparliamentary Meeting of the Committee on Budgets
 NOTE for the Interparliamentary Meeting of the Committee on Budgets THE ROLE OF THE EU BUDGET TO SUPPORT MEMBER STATES IN ACHIEVING THEIR ECONOMIC OBJECTIVES AS AGREED WITHIN THE FRAMEWORK OF THE EUROPEAN
January 2010 Euro area unemployment rate at 9.9% EU27 at 9.5%
 STAT//29 1 March 20 January 20 Euro area unemployment rate at 9.9% EU27 at 9.5% The euro area 1 (EA16) seasonally-adjusted 2 unemployment rate 3 was 9.9% in January 20, the same as in December 2009 4.
STAT/07/55 23 April 2007
 STAT/07/55 23 April 2007 Provision of deficit and debt data for 2006 Euro area and EU27 government deficit at 1.6% and 1.7% of GDP respectively Government debt at 69.0% and 61.7% In 2006, the government
ECON 3010 Intermediate Macroeconomics Chapter 6
 ECON 3010 Intermediate Macroeconomics Chapter 6 The Open Economy Imports and exports of selected countries, 2010 60 50 Exports Imports Percent of GDP 40 30 20 10 0 Australia China Germany Greece S. Korea
Lithuania: in a wind of change. Robertas Dargis President of the Lithuanian Confederation of Industrialists
 Lithuania: in a wind of change Robertas Dargis President of the Lithuanian Confederation of Industrialists 2017 06 15 Lithuanian Confederation of Industrialists - the largest business organisation in Lithuania
May 2009 Euro area external trade surplus 1.9 bn euro 6.8 bn euro deficit for EU27
 STAT/09/106 17 July 2009 May 2009 Euro area external trade surplus 1.9 6.8 deficit for EU27 The first estimate for the euro area 1 (EA16) trade balance with the rest of the world in May 2009 gave a 1.9
Irish Economy and Growth Legal Framework for Growth and Jobs High Level Workshop, Sofia
 Irish Economy and Growth Legal Framework for Growth and Jobs High Level Workshop, Sofia Diarmaid Smyth, Central Bank of Ireland 18 June 2015 Agenda 1 Background to Irish economic performance 2 Economic
European Advertising Business Climate Index Q4 2016/Q #AdIndex2017
 European Advertising Business Climate Index Q4 216/Q1 217 ABOUT Quarterly survey of European advertising and market research companies Provides information about: managers assessment of their business
Lowest implicit tax rates on labour in Malta, on consumption in Spain and on capital in Lithuania
 STAT/13/68 29 April 2013 Taxation trends in the European Union The overall tax-to-gdp ratio in the EU27 up to 38.8% of GDP in 2011 Labour taxes remain major source of tax revenue The overall tax-to-gdp
Second estimate for the third quarter of 2008 EU27 current account deficit 39.5 bn euro 19.3 bn euro surplus on trade in services
 STAT/09/12 22 January 2009 Second estimate for the third quarter of 20 EU27 current account deficit 39.5 bn euro 19.3 bn euro surplus on trade in According to the latest revisions1, the EU272 external
Recent Macroeconomic and Monetary Developments in the Czech Republic and Outlook
 Recent Macroeconomic and Monetary Developments in the Czech Republic and Outlook Miroslav Singer Governor, Czech National Bank FORECASTING DINNER 212, Czech CFA Society Prague, 22 February 212 M. Recent
International Seminar on Strengthening Public Investment and Managing Fiscal Risks from Public-Private Partnerships
 International Seminar on Strengthening Public Investment and Managing Fiscal Risks from Public-Private Partnerships Budapest, Hungary March 7 8, 2007 The views expressed in this paper are those of the
Monetary Policy report October 2015
 Monetary Policy report October 2015 Chapter 1 Figure 1.1. Repo rate with uncertainty bands Per cent Note. The uncertainty bands for the repo rate are based on the Riksbank s historical forecasting errors
Economic recovery and employment in the EU. Raymond Torres, Director, ILO Research Department
 Economic recovery and employment in the EU Raymond Torres, Director, ILO Research Department Outline of presentation I. Situation in the EU versus Japan and the US II. Role of macroeconomic policies and
The macroeconomic effects of a carbon tax in the Netherlands Íde Kearney, 13 th September 2018.
 The macroeconomic effects of a carbon tax in the Netherlands Íde Kearney, th September 08. This note reports estimates of the economic impact of introducing a carbon tax of 50 per ton of CO in the Netherlands.
World Economic Outlook Central Europe and Baltic Countries
 World Economic Outlook Central Europe and Baltic Countries Presentation by Susan Schadler and Christoph Rosenberg September 5 World growth returns to trend. (World real GDP growth, annual percent change)
COMMUNICATION FROM THE COMMISSION 2014 DRAFT BUDGETARY PLANS OF THE EURO AREA: OVERALL ASSESSMENT OF THE BUDGETARY SITUATION AND PROSPECTS
 EUROPEAN COMMISSION Brussels, 15.11.2013 COM(2013) 900 final COMMUNICATION FROM THE COMMISSION 2014 DRAFT BUDGETARY PLANS OF THE EURO AREA: OVERALL ASSESSMENT OF THE BUDGETARY SITUATION AND PROSPECTS EN
August 2008 Euro area external trade deficit 9.3 bn euro 27.2 bn euro deficit for EU27
 STAT/08/143 17 October 2008 August 2008 Euro area external trade deficit 9.3 27.2 deficit for EU27 The first estimate for the euro area 1 (EA15) trade balance with the rest of the world in August 2008
Monetary Integration
 Monetary Integration By Michael Möhnle Table of Contents 1. 6-Stages of Economic Integration 2. International Monetary Integration - Bretton Woods 3. European Monetary Integration 4. European (Economic
Fiscal sustainability challenges in Romania
 Preliminary Draft For discussion only Fiscal sustainability challenges in Romania Bucharest, May 10, 2011 Ionut Dumitru Anca Paliu Agenda 1. Main fiscal sustainability challenges 2. Tax collection issues
% of GDP
 STAT/09/149 22 October 2009 Provision of deficit and debt data for 2008 - second notification Euro area and EU27 government deficit at 2.0% and 2.3% of GDP respectively Government debt at 69.3% and 61.5%
Electricity & Gas Prices in Ireland. Annex Business Electricity Prices per kwh 2 nd Semester (July December) 2016
 2016") Electricity & Gas Prices in Ireland Annex Business Electricity Prices per kwh 2 nd Semester (July December) 2016 ENERGY POLICY STATISTICAL SUPPORT UNIT 1 Electricity & Gas Prices in Ireland Annex Business
Electricity & Gas Prices in Ireland Annex Business Electricity Prices per kwh 2 nd Semester (July December) 2016 ENERGY POLICY STATISTICAL SUPPORT UNIT 1 Electricity & Gas Prices in Ireland Annex Business
: Monetary Economics and the European Union. Lecture 8. Instructor: Prof Robert Hill. The Costs and Benefits of Monetary Union II
 320.326: Monetary Economics and the European Union Lecture 8 Instructor: Prof Robert Hill The Costs and Benefits of Monetary Union II De Grauwe Chapters 3, 4, 5 1 1. Countries in Trouble in the Eurozone
PORTUGAL E O CAMINHO PARA O FUTURO: A BANCA E O SEU PAPEL
 XV CONFERÊNCIA A CRISE EUROPEIA E AS REFORMAS NECESSÁRIAS PORTUGAL E O CAMINHO PARA O FUTURO: A BANCA E O SEU PAPEL FERNANDO FARIA DE OLIVEIRA AGENDA European Context: From the Actual Crisis to Growth
The near-term global economic outlook
 Overview The near-term global economic outlook Paul van den Noord Counsellor to the Chief Economist OECD 1 Overview World growth has slowed, including in EMEs. Trade has weakened. Unemployment is high
Quarterly Gross Domestic Product of Montenegro 4 th quarter 2018 (p)
") MONTENEGRO STATISTICAL OFFICE R E L E A S E No: 46 Podgorica, 22 March 2019 When using the data, please name the source Quarterly Gross Domestic Product of Montenegro 4 th quarter 2018 (p) The release
MONTENEGRO STATISTICAL OFFICE R E L E A S E No: 46 Podgorica, 22 March 2019 When using the data, please name the source Quarterly Gross Domestic Product of Montenegro 4 th quarter 2018 (p) The release
T5-Europe The Jus Semper Global Alliance 01/09/16 1 6
 Table-T5 Living-Wage-Gap and Equalisation analysis (vis-à-vis the U.S.) for all employed in the manufacturing sector in PPP for private consumption terms 1996-2015 (Europe) Beginning with the 2012 living-wage
DANMARKS NATIONALBANK
 DANMARKS NATIONALBANK WEALTH, DEBT AND MACROECONOMIC STABILITY Niels Lynggård Hansen, Head of Economics and Monetary Policy. IARIW, Copenhagen, 21 August 2018 Agenda Descriptive evidence on household debt
Burden of Taxation: International Comparisons
 Burden of Taxation: International Comparisons Standard Note: SN/EP/3235 Last updated: 15 October 2008 Author: Bryn Morgan Economic Policy & Statistics Section This note presents data comparing the national
139/ October 2006
 139/2006-23 October 2006 Provision of deficit and debt data for 2005 Euro area and EU25 government deficit at 2.4% and 2.3% of GDP respectively Government debt at 70.8% and 63.2% In 2005 the government
Introduction on monetary policy
 Introduction on monetary policy Riksdag Committee on Finance 18 November 214 Governor Stefan Ingves Today's presentation Where have we come from? Inflation is low in Sweden In the euro area, both growth
IS THERE ANY PREFERED COMPETITIVENESS INDICATOR IN EXPLAINING FOREING TRADE IN EURO AREA COUNTRIES? COMPNET December 12 th 2013
 IS THERE ANY PREFERED COMPETITIVENESS INDICATOR IN EXPLAINING FOREING TRADE IN EURO AREA COUNTRIES? COMPNET December 12 th 2013 Styliani Christodoulopoulou Based on joint work with Olegs Tkacevs With input
ECONOMIC OUTLOOK. World Economy Autumn No. 33 (2017 Q3) KIEL INSTITUTE NO. 33 (2017 Q3)
 KIEL INSTITUTE NO. 33 (2017 Q3)") KIEL INSTITUTE ECONOMIC OUTLOOK World Economy Autumn 7 Finalized September 6, 7 No. 33 (7 Q3) Klaus-Jürgen Gern, Philipp Hauber, Stefan Kooths, Galina Potjagailo, and Ulrich Stolzenburg Forecasting Center
KIEL INSTITUTE ECONOMIC OUTLOOK World Economy Autumn 7 Finalized September 6, 7 No. 33 (7 Q3) Klaus-Jürgen Gern, Philipp Hauber, Stefan Kooths, Galina Potjagailo, and Ulrich Stolzenburg Forecasting Center
January 2009 Euro area external trade deficit 10.5 bn euro 26.3 bn euro deficit for EU27
 STAT/09/40 23 March 2009 January 2009 Euro area external trade deficit 10.5 26.3 deficit for EU27 The first estimate for the euro area 1 (EA16) trade balance with the rest of the world in January 2009