Crescat Capital LLC 1560 Broadway Denver, CO (303) November 18, 2017.
|
|
|
- Meagan Johns
- 6 years ago
- Views:
Transcription
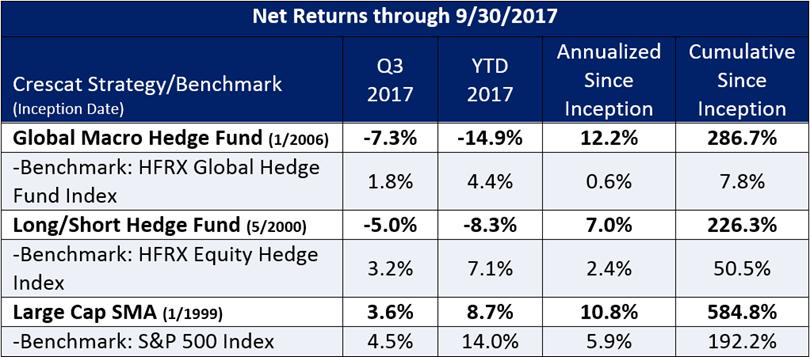
1 November 18, 2017 Dear Investors, Crescat Capital LLC 1560 Broadway Denver, CO (303) US large cap stocks are the most overvalued in history, higher than prior speculative mania market peaks in 1929 and We prove it conclusively across six comprehensive dimensions: 1. Price to Sales 2. Price to Book 3. Enterprise Value to Sales 4. Enterprise Value to EBITDA 5. Price to Earnings 6. Enterprise Value to Free Cash Flow Brutal bear markets and recessions have historically followed from record valuations like we have today, and this time will almost certainly be no different. Not even positive macro factors like low interest rates, low inflation, or recently improving earnings growth can justify today s extreme valuation levels. As we show herein, that was the same backdrop that we had in 1929, the setup to the biggest market crash in history and the Great Depression. Optimism over new-era technologies are not justification for high multiples today; they are hallmarks of market tops. Artificial intelligence and crypto-currencies feature prominently in current investor enthusiasm, a climate akin to the tech bubble peak. Also, excitement over new pro-business and pro-economic growth policies coming from Washington are poor grounds to rationalize today s valuations. Again, this is a hallmark of a market top. History has proven that market plunges routinely follow first-year Republican presidents where ebullience over business-friendly government policy runs rampant and only sets the market up for failure. Witness the market meltdowns that followed Hoover (1929), Eisenhower (1953), Nixon (1969), Reagan (1981), and Bush (2001) in their first years. Any real economic boost from Republican tax cuts now before Congress, if such legislation passes, is already more than priced into the market. There are many catalysts that are likely to send stocks into bear market in the near term. A likely bursting of the China credit bubble is first and foremost among them. Our data and analysis show that China today is the biggest credit bubble of any country in history. We believe its bursting will be globally contagious for equities, real estate, and credit markets. The US and China bubbles are part of a larger, global debt-to-gdp bubble, which is also historic in scale, and the product of excessive, lingering central bank easy monetary policies in the wake of the now longpassed 2008 Global Financial Crisis. These policies failed to resolve the debt-to-gdp imbalances that preceded the last crisis. Now, easy money policies have created even bigger debt-to-gdp imbalances and asset bubbles that will precipitate the next one. We are in the very late stages of a global economic and business expansion cycle with investor sentiment reflecting record optimism typical at market peaks, a sign of capitulation at the end of a bull market. Crescat is positioned to profit from the coming broad, global cyclical market and economic downturn that we foresee. We strongly believe that our global equity net short positioning in our hedge funds will be validated soon.
2 Proof of the Most Overvalued US Stock Market in History Below, we show that the median price-to-sales ratio for the S&P 500 today is the highest ever by a wide margin, more than 60% greater than the tech bubble peak. The median price-to-book value for the S&P 500 is also at the highest valuation ever. 2
3 Adding to risk in the markets today, we show that S&P 500 companies are more leveraged than ever before. We also show that corporate leverage for the whole US economy, not just the S&P 500, is at all-time highs relative to GDP. Now that we have looked at leverage, we look at enterprise value (EV), the market value of a firm that incorporates net corporate leverage to get the total value of a company s capital structure. Based on the median EV-to-sales multiples for the S&P 500, the market is at record valuation levels. 3
4 EBITDA (earnings before interest, taxes, depreciation, and amortization) is a popular valuation measure among investment bankers. We show below that based on median EV to EBITDA, the S&P 500 is at its highest-ever valuation. Bear with us now as we dig into the necessary nuances of the price-to-earnings (P/E) ratio. It is critical to use cyclical smoothing to accurately gauge market valuations in their current and historical context when using P/E. 4

5 Yale economics professor, Robert Shiller, received a Nobel Prize in 2013 for proving this fact so we hope you will believe it. The problem with just looking at trailing 12-month P/E ratios to determine valuation is that it produces sometimes-false readings due to large cyclical swings in earnings at peaks and valleys of the business cycle. For example, in the middle of the recession in 2001, P/Es looked artificially high due to a broad earnings plunge. P/Es can also look artificially low at the peak of a short-term business cycle, which can produce what is known as a value trap, such as in 2007 during the US housing bubble and such as we believe is the case today in China, Australia, and Canada. Shiller showed a method for cyclically-adjusting P/Es using a 10-year moving average of real earnings in the denominator of the P/E. Shiller s Cyclically-Adjusted P/E, called CAPE multiples have been better predictors of future full-business-cycle stock market returns than raw 12-month trailing P/Es. Shiller showed that markets with historically high CAPEs lead to low long-term returns for long-only index investors. Shiller CAPEs are fantastic, but they can be improved by including an adjustment for corporate profit margins which makes them even better predictors of future stock price performance and therefore even better measures of cyclically-adjusted P/E for valuation purposes. Below we show Shiller s CAPE prior to adjusting for the cyclicality of profit margins. The Shiller CAPE of 31 today is in the same vicinity as it was at its peak in 1929 which it reached before the market crashed and sent the economy into the Great Depression. In Shiller s view, the 1999 Shiller CAPE sets the record for the highest ever P/E at 44. That fact that Shiller s CAPEs do not reconcile more precisely with our four prior valuation measures points to a slight flaw in CAPE. Shiller s CAPEs simply need an adjustment for profit margins because margins are a key element of earnings cyclicality. We can understand this by looking at median S&P 500 profit margins in the chart below. For example, even though profit margins were cyclically and historically high during the tech bubble, they are even higher today. In the same spirit of Shiller s attempt to cyclically adjust earnings to determine a useful P/E, CAPEs need to be adjusted for cyclical swings in profit margins. 5

6 When we multiply Shiller CAPEs by a cyclical adjustment factor for profit margins (10-year trailing profit margins divided by long term profit margin), we get a margin-adjusted CAPE that is not only theoretically valid but empirically valid as it proves to be an even better predictor of future returns than Shiller s CAPE! Credit goes to John P. Hussman, Ph.D. for the idea and method to adjust Shiller CAPEs for swings in profit margins. As we can see in the Hussman chart below, margin-adjusted CAPE, shows that today s P/E ratio for comparative historical purposes is 43, the highest ever! The 1999 peak P/E was 41 and the 1929 P/E was 40. Once again, we can see that today we have the highest valuation multiples ever for US stocks, higher than 1929 and higher than 1999 and 2000! 6

7 Source: Hussman Strategic Advisors Note there is an improved correlation with future returns (-0.89 versus as shown in the chart above) of margin-adjusted CAPE compared to Shiller CAPE. The strength of margin-adjusted CAPE in predicting future returns is further illustrated in the chart below. Note the tightness of fit. Note also that the market is so overvalued today that margin-adjusted CAPE is predicting negative average returns for the next twelve years! This should prove terrible news for buy-and-hold index fund investors fully invested today. Index investing has never been more popular and crowded. The biggest part of the future possible 12-year negative returns for the market should come within just the next one to three years, the first part of the typical bear market which often includes a crash. We are not perma-bears for the long-term, we are cyclical bears for the next one to three years. 7

8 Source: Hussman Strategic Advisors We need just one more valuation metric to thoroughly prove our case that the stock market today is the most over-valued market ever. We have saved the best for last, enterprise value to free cash flow. EV to FCF is a Crescat favorite that features prominently in our fundamental equity model. Here it is also critical to perform Shiller/Hussman-style cyclical smoothing. We use 3-year smoothing for real FCF and margins. This is sufficientenough time to iron out outlier cyclical years given that we are working with a more limited 22-year look-back (compared to Shiller s 100+ years) for reliable free cash flow data. This period is long enough for statistical significance because it includes three business cycles. We propose that 3-year smoothing is better than 10-year anyway for active investors trying to time short-term business cycles. Shiller and Hussman seem to be focused on very long-term cycles. We also exclude banks from our universe where free cash flow and EV are less relevant. The result as we show below is that median cyclically-adjusted EV to FCF for non-banks in the S&P 500 today is at an insanely-high 41 times! 8

9 So, we have obtained the same result for every valuation multiple that we have studied. With each and in combination, we have proven that the US stock market is at all-time high valuations. We have shown it across six completely different measures that consider the totality of the corporate income statement, balance sheet, and cash flow statement. Macro Factors Undeterred bulls will say, OK Crescat you might have a point about record valuations today, but aren t they justified due to low interest rates, low inflation, low unemployment, and recently improving earnings growth? No. They are not! Our empirical analysis of stock market and economic history strongly proves otherwise as we will show next. Below, we plot 10-year yields with Shiller CAPE ratios going back to 1900 along with today s margin adjusted CAPE. We do not have margin-adjusted data going that far back, so we are using CAPE which is still highly useful. The regression line shows that there is indeed a relationship between higher multiples and lower interest rates, but with a huge deviation. The problem is that we are already at the extreme end of the deviation for the current level of interest rates. As we show below, both today s CAPE and margin-adjusted CAPE are at the highest multiples ever for the current level of interest rates. In other words, a more than 50% stock market correction would be justified just to get today s margin adjusted-cape back to its average multiple for the 2% interest rate zone on the 10-Year Treasury Note. 9

10 What about inflation? Aren t inflation conditions just perfect today with a very low but still-positive inflation rate? As we show below with data going back to 1914, P/E multiples do indeed tend to be higher under low positive inflation, but today s multiples are again among the highest P/Es ever for the current 2% headline CPI level. Again, there is a huge variation, suggesting that we could see a 50% decline in stock prices just to get back to mean historical P/E multiples for this level of inflation. And that is just the mean. As one can see, P/E levels have gone well below the mean to mid-single-digit level even in a low, positive inflation environment. Note also from our chart below that if we move in either direction, toward deflation or inflation to any significant degree, P/E multiples shrink dramatically, i.e., stock prices crash when starting from record high multiple environments like today. 10


11 But what about earnings growth? Isn t it really starting to pick up now and doesn t that justify high multiples today? It is true that earnings growth has been picking up recently, but it is very typical for earnings growth to pick up when it is late in the business cycle before topping out and falling off a cliff. It did that in , in , and in Below, using the Shiller data, we show how closely the earnings growth pattern in the last seven years matches that of the Roaring Twenties! 11

12 What about the Goldilocks zone that we are in now for simultaneous low inflation and low unemployment? It s an ideal spot on the Phillips Curve, isn t it? Doesn t that justify extended valuation multiples today? Based on history, no. The problem is that there is a natural boom-and-bust business cycle. Our long-term Phillips Curve analysis below going back to 1900 shows that inflation and unemployment tends to stray wildly with the business cycle. Downturns in the business cycle are often deflationary and lead to high unemployment, but there can be inflationary routs too. Imagine the perfect economy: full employment, low interest rates, low inflation, strong corporate earnings growth. Perhaps that would be the market that could legitimately sustain a high valuation multiple. Irving Fisher, the most well-known economist of his time, thought so. He declared just nine days before the stock market crash of 1929 that stock prices had reached what looks like a permanently high plateau. The chart below shows the remarkable similarities between 1929 and today. 12

13 Inflation Versus Deflation What is a bigger risk today in the US and globally as we go into the next business cycle downturn inflation or deflation? It is indeed a paradox. Given the record debt-gdp levels, aging population, China credit bubble, housing bubbles in Australia and Canada, and the Federal Reserve tightening, the biggest risk in the short-term is deflation, which is typical when asset bubbles burst. We started to see deflation emerge in the Global Financial Crisis until central banks came to the rescue with massive quantitative easing, but not before a market crash. Similarly, we started to see deflation emerge in China in 2015 before policy makers there ramped up money and credit growth even further to make global asset bubbles in stocks, real estate, and credit even bigger today relative to underlying world GDP. The paradox is that once a true deflationary spiral gets going, central banks are forced to resort to extraordinary inflationary money printing or quantitative easing to counter it. In the face of truly massive QE, at a certain tipping point, the mindset of the world should ultimately shift to a lack of confidence in central bankers ability to contain inflation. Only then does inflation become a self-fulfilling prophesy as investors start ratcheting up their inflation expectations. Rising inflation expectations never happened in the wake of the last crisis. Instead, the response of investors to QE was to build bigger asset bubbles. What will it take to change the mindset? Probably a bigger crisis and certainly a bigger central bank response. At that point, it is not only inflation but very possibly hyperinflation that becomes the end game. We see hyperinflation as a likely outcome to emerge first and foremost in China, but not before a deflationary crisis emerges first. The Catalysts The tightening of credit by the Fed in our view is the main catalyst that will burst global asset bubbles including the credit bubble in China. The chart below illustrates how the end of a US business cycle works. Whenever the Federal Reserve starts a campaign of tightening credit conditions in earnest, late in the business cycle, to temper an overheating stock market, economy, and/or inflation by raising interests, it is soon the kiss of death for the 13

14 stock market and ultimately the economy. Today, it is also the kiss of death for China that has been pegging its currency to the dollar. Recently, the Fed has been raising rates at the highest rate of change ever very late in the business cycle. It is also beginning a long-term campaign to reduce its balance sheet, a quantitative tightening. We are in the ninth year of an expansion. The longest economic expansion ever in the US lasted only into its tenth year, but the stock market topped out in the ninth year, March That was the peak of the tech bubble. Asset bubbles tend to top out first, then business fundamentals turn down, then the recession is declared, usually well after it already started, at which point past GDP reports get revised downward. When Fed Hikes Rates Too Late in Business Cycle It s Kiss of Death for Market and Economy Source: Bloomberg There are many good indicators of contrary bullish sentiment that we could point to today to further serve as confirming indicators that we are very near a major market top. One is the Investors Intelligence Survey which just recently showed record net bulls versus bears. 14

15 Source: Yardini Research, Inc. Here is a recent Merrill Lynch Fund Manager Survey: Nothing epitomizes the speculative mania in the global financial markets today better than Bitcoin. The novel crypto-token has appreciated 720-fold in the last five years! That s twelve times more than tulip bulbs during the Dutch mania of the 1600s! 15

16 The problem with Bitcoin is that it is easily replicated to dilute its value by any number of competing crypto currencies. This is not the problem with gold of course. Gold has been true money that has stored value in all countries for thousands of years. However, gold and silver are significantly undervalued compared to fiat money today as we showed in our Q letter. Gold will almost certainly prove its mettle over both fiat money and Bitcoin in the coming Bitcoin bust that should go hand in hand with the coming global asset bubble meltdown. Update on Crescat s China Currency and Credit Bubble Theme In our Q and prior letters, we have laid out the case for our China currency and credit bubble theme. Given that China has been about 50% of global GDP growth since 2008, we strongly believe that its credit bubble bursting will lead to global financial market contagion. We saw this start to develop in 2015, but China mounted yet another enormous but unsustainable credit surge ahead of the National Party Congress. The China credit bubble has only gotten bigger. Now that the NPC is behind us, China must attempt to rein in credit growth while still growing its economy. It is an almost impossible task. Stresses are already appearing in Chinese credit markets. The sovereign yield curve in China (10-year minus 5-year yields) has inverted twice already year, a warning sign of an impending recession. 16
17 While Fed officials remain confident in their ability to engineer their first-ever soft landing for the economy late in a business cycle, China s soon-to-be-retiring central bank governor, Zhou Xiaochaun, appears in stark contrast. He is not celebrating victory over the economic cycle at all. Instead, he has been sounding the alarm. Last month at the National Party Congress, he warned of the possibility of a Minsky moment just as we did in our last quarterly letter. Zhou later elaborated on his Minsky moment comment in writing on the People s Bank of China website (since removed) warning of hidden, complex, sudden, contagious, and hazardous dangers lurking in the world s second-largest economy. A Minsky moment is a severe debt deflation, a stage of the long-term business/economic cycle that Irving Fisher would later define based on the 1930s Great Depression. The conventional wisdom on Wall Street is that China has absolute control over its economy and multiple levers that it can pull to prevent crisis and continue to grow it. The truth is that China has had essentially only one lever and that has been more credit growth. The problem is that its central planners do not even have control over this lever as the PBOC made clear its recently released English version of the China 2017 Financial Stability Report. China now admits that the combination of on- and off-balance sheet assets among its banking institutions has exploded to 70 trillion USD equivalent as of the end of 2016 as we show in the chart below. 17

18 The PBOC also revised its assessment of 2015 off-balance sheet bank debt upward by about 100%. The problem in China is that shadow lending has been growing literally out of control and outside the direction of central planners. We believe this is the largest credit explosion in any major country ever relative to GDP, indicating that China s banking assets are vastly mismarked, and overstated. In our view, China has an enormous hidden nonperforming loan problem that essentially renders the entire Chinese banking system insolvent, more than wiping out all its equity capital and potentially leaving more than one billion Chinese depositors to bear substantial losses. China certainly was the growth engine of the world for the last few decades, but that growth is about to come to an abrupt halt. At this stage, in our view the China credit bubble is as ripe as it gets to burst. China is simply in the biggest credit bubble ever, and it translates to the biggest currency bubble ever given the sheer magnitude of yuan denominated credit when converted to dollars at the current exchange rate. Strangely, the global investment community remains largely oblivious to the scale of China s twin banking and currency bubbles. We believe that currency valuation is poorly taught in school. There are too many variables for most people to process, so people tend to just focus on a few. It is not as simple as just looking at the trade balance and foreign reserves. The relative valuation of the money supply and total banking system assets must be considered. Regarding China s foreign reserves, as we have shown before, in our analysis, we believe China s reserves are fully encumbered given the many years of running a pegged currency against constant capital outflow pressure. We believe pressure from capital outflows has only increased recently as evidenced by China s resorting to increased capital controls, but the latter has also been discouraging foreign capital inflows. China is trying to attract foreign capital into its credit markets, but supply is much greater than demand. Years of Minsky-style Ponzi finance have finally caught up with them. Non-performing loans cannot be refinanced with ever more massive amounts of new credit every year. The marginal contribution to real GDP growth from new credit growth has diminished to the breaking point. These are all signs of an impending credit bust and debt deflationary pressures that can only inevitably be met with a massive QE and currency crisis. 18


19 As we show below, housing prices in China are a sign, just like in the US housing bubble, that China s Minsky moment is fast approaching. As the Shanghai and Hang Seng indices have been making new recent highs, the chart below shows the Chinese property development stocks staring to roll over much like US homebuilding stocks were the first to crack well ahead of the rest of the market in the US housing bubble. 19
20 Update on our New Oil and Gas Resources theme Since mid-2014, we have remained mostly bearish on crude oil, and that is still the case today. In 2014, the huge increase of US oil production was finally acknowledged by the market at the same time as the US dollar was strengthening considerably, a perfect recipe for an oil bear market. In 2015, all that new US production made its way into storage, and weekly large inventory builds caused another leg down in oil and related stocks. In 2016, crude was caught in the everything rally off the February lows. Signs of solid US demand offset by increasing domestic production have allowed WTI to rebound from the mid-20s and settle into the $40-60 range during Recent events in Saudi Arabia in preparation for Mohammad bin Salman s ascension have introduced geopolitical risk back into the market. However significant reshuffling for a new king is not uncommon, and more important in our view is the Kingdom s long-term push to diversify away from oil. The Saudis originally feared early depletion of their reserves, but that fear has been replaced by looming peak demand. While somewhat over-hyped in the short term, demand growth will continue to slow as electric vehicles are pushed by governments worldwide, and the significance of China as the driving force behind oil demand over the past decade cannot be overstated. The China-led downturn that we foresee will be a clear negative for oil in the short term. Secular forces should keep a lid on prices over the long term. Today, money managers have amassed a record speculative long position across the four most liquid crude oil and products futures contracts: gasoline, distillate, WTI, and Brent. We are taking the opposite position and are currently short Brent crude and a basket of exploration and production companies that score poorly in our model, including Diamondback Energy (FANG), Pioneer Natural Resources (PXD), Resolute Energy (REN), Whiting Petroleum (WLL), and Parsley Energy (PE). Managed money is record net long over 1 billion barrels of crude and refined product ahead of the OPEC meeting at the end of the month. An extension of supply cuts is already baked into the price in our view and selling on the news should drive prices down. 20
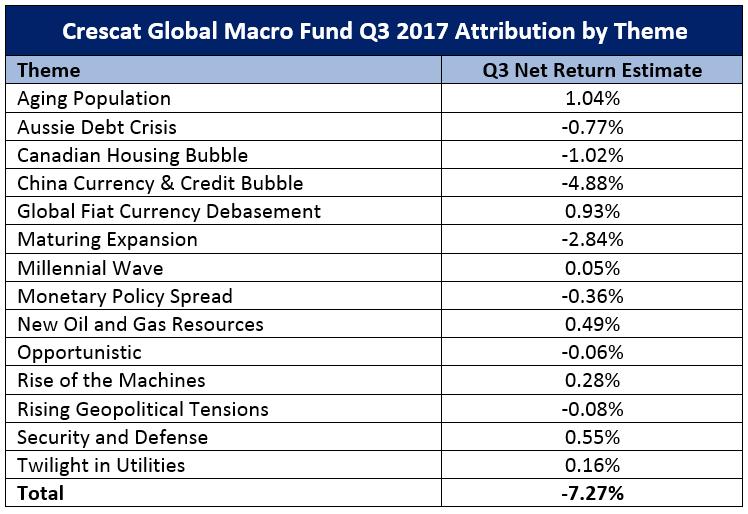
21 As a hedge fund manager, this is the type of market that we live for. The world is not ready for a bear market, let alone a brutal one. We strongly believe that Crescat and all our strategies are ready and that we will prudently protect and capitalize. See our macro letter that we wrote in the Fall of 2006 where Crescat predicted the US housing and financial sector busts. We successfully profited from these themes in both of our hedge funds by shorting homebuilders, mortgage companies, banks, and brokerage firms which all scored poorly in our fundamental equity model at the time. We were short both Bear Stearns and Lehman Brothers as they imploded. As a result, Crescat Global Macro Fund had its best year ever in 2007, up 79% net. The fund was also up 40% net in the first five months of This experience proved the rewards of our investment process of combining solid macro themes with a robust fundamental equity model. It also proved that it is critical to be early and ahead of the crowd, particularly with respect to shorting. We have a chance to do it again in the coming downturn in the economic cycle and are determined to persevere. From a macro standpoint, our hedge funds are positioned to profit from the next downturn in the global equity markets, and in particular, a China led downturn. We are not perma-bears, but we strongly believe there is a major cyclical market downturn coming soon that needs to be timed with shorts to generate performance and add substantial alpha. For many good reasons, which we have elaborated on in our past quarterly letters, we adopted an equity short bias earlier this year to capitalize on this view. In hindsight, we went net short too soon to perfectly time it, and that has hurt our performance year to date. But we are following our risk controls and have thereby contained the drawdown. We strongly believe our positioning will be rewarded soon. As expected, the drag on performance in Q3 and year to date has been short positions, largely related to our China Currency and Credit Bubble theme. US equity shorts in our Maturing Expansion theme also held back performance in the quarter. Sincerely, Kevin C. Smith, CFA Chief Investment Officer Tavi Costa Emerging Markets Analyst Nils Jenson Energy and Materials Analyst 2017 Crescat Capital LLC 21
22 22
23 Case studies are included for informational purposes only and are provided as a general overview of our general investment process, and not as indicative of any investment experience. There is no guarantee that the case studies discussed here are completely representative of our strategies or of the entirety of our investments, and we reserve the right to use or modify some or all of the methodologies mentioned herein. Only accredited investors and qualified clients will be admitted as limited partners to a Crescat fund. For natural persons, investors must meet SEC requirements including minimum annual income or net worth thresholds. Crescat funds are being offered in reliance on an exemption from the registration requirements of the Securities Act of 1933 and are not required to comply with specific disclosure requirements that apply to registration under the Securities Act. The SEC has not passed upon the merits of or given its approval to the Crescat funds, the terms of the offering, or the accuracy or completeness of any offering materials. A registration statement has not been filed for any Crescat fund with the SEC. Limited partner interests in the Crescat funds are subject to legal restrictions on transfer and resale. Investors should not assume they will be able to resell their securities. Investing in securities involves risk. Investors should be able to bear the loss of their investment. Investments in the Crescat funds are not subject to the protections of the Investment Company Act of Performance data represents past performance, and past performance does not guarantee future results. Performance data is subject to revision following each monthly reconciliation and annual audit. Current performance may be lower or higher than the performance data presented. Crescat is not required by law to follow any standard methodology when calculating and representing performance data. The performance of Crescat funds may not be directly comparable to the performance of other private or registered funds. Investors may obtain the most current performance data and private offering memorandum for a Crescat fund by contacting Linda Smith at (303) or by sending a request via to lsmith@crescat.net. See the private offering memorandum for each Crescat fund for complete information and risk factors. 23
Crescat Capital LLC 1560 Broadway Denver, CO (303) January 27, 2018.
 January 27, 2018.") January 27, 2018 Crescat Capital LLC 1560 Broadway Denver, CO 80202 (303) 271-9997 info@crescat.net www.crescat.net Dear Investors, Believe me: We re in a bubble right now. And the only thing that looks
January 27, 2018 Crescat Capital LLC 1560 Broadway Denver, CO 80202 (303) 271-9997 info@crescat.net www.crescat.net Dear Investors, Believe me: We re in a bubble right now. And the only thing that looks
February 21, Dear Investors:
 February 21, 2019 Crescat Capital LLC 1560 Broadway Denver, CO 80202 (303) 271-9997 info@crescat.net www.crescat.net Dear Investors: There is indeed a business cycle and timing it ahead of key inflection
We are positioned to capitalize on these themes in unique ways across all three of our investment strategies:
 6/25/18 Crescat Capital LLC 1560 Broadway Denver, CO 80202 (303) 271-9997 info@crescat.net www.crescat.net Dear Investors, We strongly believe that the global macro investment cycle is turning down right
March 16, Dear Investors:
 March 16, 2019 Crescat Capital LLC 1560 Broadway Denver, CO 80202 (303) 271-9997 info@crescat.net www.crescat.net Dear Investors: At Crescat we remain positioned to capitalize on a downturn in the economic
Crescat Capital LLC 1560 Broadway Denver, CO (303) November 16, Dear Fellow Investors,
 November 16, Dear Fellow Investors,") November 16, 2018 Crescat Capital LLC 1560 Broadway Denver, CO 80202 (303) 271-9997 info@crescat.net www.crescat.net Dear Fellow Investors, October was a frightening month for investors around the world.
November 16, 2018 Crescat Capital LLC 1560 Broadway Denver, CO 80202 (303) 271-9997 info@crescat.net www.crescat.net Dear Fellow Investors, October was a frightening month for investors around the world.
Crescat Capital LLC 1560 Broadway Denver, CO (303) September 15, 2018.
 September 15, 2018.") Crescat Capital LLC 1560 Broadway Denver, CO 80202 (303) 271-9997 info@crescat.net www.crescat.net September 15, 2018 Dear Investors: Our current three best macro ideas today are complementary plays on
Crescat Capital LLC 1560 Broadway Denver, CO 80202 (303) 271-9997 info@crescat.net www.crescat.net September 15, 2018 Dear Investors: Our current three best macro ideas today are complementary plays on
The yellow highlighted areas are bear markets with NO recession.
 Part 3, Final Report: Major Market Reversal Model This is the third and final report on my major market reversal model. This portion of the model focuses on the domestic and international economy. I ve
The year-to-date rally in global risk assets after the Fed flip appears to us to be a last gasp of speculative mania for the current economic cycle.
 Crescat Q1 2019 Quarterly Research Letter April 18, 2019 Crescat Capital LLC 1560 Broadway Denver, CO 80202 (303) 271-9997 info@crescat.net www.crescat.net Dear Investors: The year-to-date rally in global
Ruminations on Market Timing with the PE10
 Jan-26 Jan-29 Jan-32 Jan-35 Jan-38 Jan-41 Jan-44 Jan-47 Jan-50 Jan-53 Jan-56 Jan-59 Jan-62 Jan-65 Jan-68 Jan-71 Jan-74 Jan-77 Jan-80 Jan-83 Jan-86 Jan-89 Jan-92 Jan-95 Jan-98 Jan-01 Jan-04 Jan-07 Jan-10
Northern Trust Investments is proud to sponsor this podcast Investing in a World of
 INVESTING IN A WORLD OF BUBBLES Northern Trust Investments is proud to sponsor this podcast Investing in a World of Bubbles. This podcast will be of particular interest to advisors looking to help temper
Market Outlook By Mark Connolly, Principal, New Castle Investment Advisors, LLC. Prepared January 15, 2018
 Prepared January 15, 2018 Market Outlook 2018 By Mark Connolly, Principal, New Castle Investment Advisors, LLC Last year s stock market performance was nothing less than spectacular. The Dow Jones Industrial
Gundlach s Forecast for 2017
 Gundlach s Forecast for 2017 January 11, 2017 by Robert Huebscher Investors will confront excessive debt, high P/E levels and political uncertainty as they enter the Trump presidential era. In response,
The Grand Illusion November 4, 2016
 The Grand Illusion November 4, 2016 Many know that the economy is not good. Fact is, the economic issues actually began in 2000 and have only been made worse. The world economy is in a systemic crisis
Crestmont Research. Yet, is 17% a reasonable expectation? What were the sources for that level of return and will those drivers continue to deliver?
 Crestmont Research Where Did It Come From: Is the Trend Your Friend? By Ed Easterling October 4, 2017 Copyright 2017, Crestmont Research (www.crestmontresearch.com) Since March of 2009, the stock market
Gundlach s Forecast for 2016
 Gundlach s Forecast for 2016 January 19, 2016 by Robert Huebscher Jeffrey Gundlach is a prescient and accurate forecaster. Last week, as he does each January, he offered his market outlook. But unlike
On Our Radar September 2015
 On Our Radar September 2015 The Dow Jones Industrial Average (DJIA), S&P 500 and NASDAQ Composite fell 6.56 percent, 6.25 percent, and 6.85 percent, respectively, in August, which was highlighted by a
The Conversation We ll Be Having for Years to Come
 LEADERSHIP SERIES SEPTEMBER 2017 A feature article from our U.S. partners The Conversation We ll Be Having for Years to Come It s time to consider what a return to conventional monetary policy could mean
Gauging Current Conditions:
 Gauging Current Conditions: The Economic Outlook and Its Impact on Workers Compensation Vol. 2 2005 The gauges below indicate the economic outlook for the current year and for 2006 for factors that typically
Fed Plans To Trim Its Massive $4.5 Trillion Balance Sheet
 Fed Plans To Trim Its Massive $4.5 Trillion Balance Sheet June 21, 2017 by Gary Halbert of Halbert Wealth Management 1. Fed to Reduce Massive $4.5 Trillion Balance Sheet Implications 2. How the Fed Got
Asset Allocation Model March Update
 The month of February was marked by a sell-off in global equity markets and a sudden increase in market volatility with the CBOE Volatility Index reaching its highest level since August 2015. The rout
2017 Mid-year US Equity Outlook: Rattle and Hum
 2017 Mid-year US Equity Outlook: Rattle and Hum July 5, 2017 by Liz Ann Sonders of Charles Schwab Key Points We may be witnessing an extreme version of "gridlock is good" with record-setting partisan conflict.
Some Thoughts on Inflation, Tax Reform and the Fed
 Some Thoughts on Inflation, Tax Reform and the Fed 1 st October 2017 Before this week s report, we wanted to draw your attention to the trade ideas section of the report we have run for the past few weeks.
... Eye on the Economy August
 ............................................................................................. Eye on the Economy August 2015.............................................................................................
Four Key Drivers for Stocks in 2018
 LEADERSHIP SERIES JANUARY 2018 Four Key Drivers for Stocks in 2018 Earnings, liquidity, Fed policy, and China may be the biggest market movers in the new year Jurrien Timmer l Director of Global Macro
Jeremy Grantham Guarantees Gold will Crash By Robert Huebscher May 18, 2010
 Jeremy Grantham Guarantees Gold will Crash By Robert Huebscher May 18, 2010 Jeremy Grantham, the investor celebrated for his ability to spot and exploit bubbles in asset classes, guaranteed yesterday that
The Shiller CAPE Ratio: A New Look
 The Shiller CAPE Ratio: A New Look by Jeremy J. Siegel Russell E. Professor of Finance The Wharton School University of Pennsylvania May 2013. This work is preliminary and cannot be quoted without author
The Yield Curve WHAT IT IS AND WHY IT MATTERS. UWA Student Managed Investment Fund ECONOMICS TEAM ALEX DYKES ARKA CHANDA ANDRE CHINNERY
 The Yield Curve WHAT IT IS AND WHY IT MATTERS UWA Student Managed Investment Fund ECONOMICS TEAM ALEX DYKES ARKA CHANDA ANDRE CHINNERY What is it? The Yield Curve: What It Is and Why It Matters The yield
Financial Markets Perspective
 Financial Markets Perspective 4101 Main Street, Suite C Hilton Head Island, SC 29926 843.342.3044 www.victoriacapitalus.com FUNDAMENTALS MATTER January 2014 A BRIEF SUMMARY OF THE CURRENT ECONOMY Last
To fully understand the dramatic turns in the financial markets that
 01_chap_murphy.qxd 10/24/03 2:06 PM Page 1 CHAPTER 1 A Review of the 1980s To fully understand the dramatic turns in the financial markets that started in 1980, it s necessary to know something about the
Gary Shilling - Why You Should Own Bonds
 Gary Shilling - Why You Should Own Bonds February 17, 2015 by Robert Huebscher If you followed Gary Shilling s advice for the last 30 years, you would be very wealthy. Shilling runs the New Jersey-based
Economy Check-In: Post 2008 Crisis Market Update Special Report
 Insight. Education. Analysis. Economy Check-In: Post 2008 Crisis Market Update Special Report By Kevin Chambers The 2008 crisis was one of the worst downturns in American economic history. News reports
The Everything Bust. Causes, Consequences, and Profit Opportunities. Mike Larson Senior Analyst
 The Everything Bust Causes, Consequences, and Profit Opportunities Mike Larson Senior Analyst The extremely favorable (and arguably artificial ) market environment that lasted from March 2009 through January
Fair Value Lending. Regulating against a Property Bubble. Reform Alliance
 Fair Value Lending Regulating against a Property Bubble Reform Alliance A. Fair Value Lending The same economists and estate agents who talked about soft landings back in 2007 are back on the airwaves
10º Congresso Value Investing Brasil
 www.cvib.com.br 10º Congresso Value Investing Brasil 23 de maio de 2017 Macro global coerente insights variantes Jonathan Tepper Variant Perception Our Company Who We Are: Variant Perception is an independent
The Global Recession of 2016
 INTERVIEW BARRON S The Global Recession of 2016 Forecaster David Levy sees a spreading global recession intensifying and ultimately engulfing the world s economies By LAWRENCE C. STRAUSS December 19, 2015
THE NEW ECONOMY RECESSION: ECONOMIC SCORECARD 2001
 THE NEW ECONOMY RECESSION: ECONOMIC SCORECARD 2001 By Dean Baker December 20, 2001 Now that it is officially acknowledged that a recession has begun, most economists are predicting that it will soon be
PINECONE MACRO RESEARCH SPECIAL REPORT JANUARY Could Oil End the Global Super Cycle?
 Could Oil End the Global Super Cycle? Super cycles are made up of multiple business cycles or short term debt cycles the kind we as investors have to deal with once or twice per decade. Super cycles, or
PCA INVESTMENT MARKET RISK METRICS. Monthly Report
 PCA INVESTMENT MARKET RISK METRICS Monthly Report June 2017 Takeaways Equity volatility measure (VIX) ended the month at extremely low levels, lowest since the global financial crisis, after a brief inter-month
Gundlach s Top ETF Recommendation
 Gundlach s Top ETF Recommendation November 17, 2017 by Robert Huebscher The money to be made is in non-u.s. markets, according to Jeffrey Gundlach. For long-term investors, he recommends a specific ETF.
Chart 2: Oil prices are down considerably. This suggests that inflation is slowing.
 November 12th, 2018 1 This is provided for informational purposes only and should not be considered a recommendation to buy or sell a particular security. Past performance is no guarantee of future returns.
Happy Birthday Bull Market
 Happy Birthday Bull Market March 10, 2015 by Burt White of LPL Financial The current bull market, one of the most powerful in the S&P 500 s history, celebrates its sixth birthday today, March 9, 2015.
Baseline U.S. Economic Outlook, Summary Table*
 July 218 Gus Faucher Stuart Hoffman William Adams Kurt Rankin Chief Economist Senior Economic Advisor Senior Economist Economist Executive Summary Economy Continues to Expand in Mid-218, But Trade Remains
WILL GOLD CONTINUE TO SHINE?
 LPL RESEARCH WEEKLY MARKET COMMENTARY March 7 216 WILL GOLD CONTINUE TO SHINE? Burt White Chief Investment Officer, LPL Financial Jeffrey Buchbinder, CFA Market Strategist, LPL Financial KEY TAKEAWAYS
CORRECTION PERSPECTIVES
 LPL RESEARCH WEEKLY MARKET COMMENTARY February 12 2018 CORRECTION PERSPECTIVES John Lynch Chief Investment Strategist, LPL Financial KEY TAKEAWAYS A perfect storm of investor worries collided over the
Gundlach: Treasuries will Rally When QE2 Ends
 Gundlach: Treasuries will Rally When QE2 Ends April 19, 2011 by Robert Huebscher The bonds that PIMCO s Bill Gross sold to take a 3% short position in the Treasury market may have found a buyer in Doubleline
Things That Matter for Investors II
 II By: Robert Klosterman, CEO & Chief Investment Officer E arlier this year investors had many concerns about the economy, investment markets, US politics and global geo-political environments. Oil prices
1st INVESTMENT MANAGEMENT UPDATE. Investment Outlook Cautious optimism follows extraordinary year
 INVESTMENT MANAGEMENT UPDATE A QUARTERLY NEWSLETTER FROM BREMER ASSET MANAGEMENT 1st 2018 Investment Outlook Cautious optimism follows extraordinary year Beyond Stocks and Bonds How alternative assets
Robert Shiller on Trills, Housing and Market Valuations
 Robert Shiller on Trills, Housing and Market Valuations February 16, 2010 by Dan Richards Robert J. Shiller is the Arthur M. Okun Professor of Economics at Yale University, and Professor of Finance and
U.S. Stocks: Can We Capture Acceptable Returns From Here?
 March 2015 For discretionary use by investment professionals. U.S. Stocks: Can We Capture Acceptable Returns From Here? Editor s Note: The following commentary was written by Litman Gregory co founder
Gold and The Interdependence of Prices
 Gold and The Interdependence of Prices Jason Ruspini, Vice President, Conquest Capital Group jruspini@conquestcg.com When Does Gold Rise? When people are irrational or have irrational expectations of societal
Misdiagnosing The Risk Of Margin Debt
 Misdiagnosing The Risk Of Margin Debt December 3, 2018 by Lance Roberts of Real Investment Advice This past week, Mark Hulbert wrote an article discussing the recent drop in margin debt. To wit: Plunging
Lacy Hunt: Keynes was Wrong (and Ricardo was Right)
") Lacy Hunt: Keynes was Wrong (and Ricardo was Right) May 4, 2010 by Robert Huebscher Underpinning the Obama administration s economic policies is the work of John Maynard Keynes, the legendary British economist
Lacy Hunt: Keynes was Wrong (and Ricardo was Right) May 4, 2010 by Robert Huebscher Underpinning the Obama administration s economic policies is the work of John Maynard Keynes, the legendary British economist
ADVANCE SPECIAL COMMENTARY No. 858 Economic and Financial Review and Preview December 30, 2016
 ADVANCE SPECIAL COMMENTARY No. 858 Economic and Financial Review and Preview December 30, 2016 Consumer Expectations Soar Along with Anticipated Changes from the Incoming Administration Yet, the Near-Term
HOPE FOR ROTATION. So, let me talk a little about each of these. Tariffs. Tariffs are restrictions to trade; they are a tax and they cause inflation.
 HOPE FOR ROTATION We ve said repeatedly that we believe the current bull market will continue until there is either a recession or a restrictive monetary policy. So far, that position has been accurate
Jeremy Siegel s 2016 Forecast for Stocks
 Jeremy Siegel s 2016 Forecast for Stocks December 7, 2015 by Robert Huebscher Jeremy Siegel is the Russell E. Palmer Professor of Finance at the Wharton School of the University of Pennsylvania and a senior
Macro Monthly UBS Asset Management June 2018
 Macro Monthly UBS Asset Management June 18 Investing in a mature cycle Erin Browne Head of Asset Allocation Evan Brown, CFA Director, Asset Allocation Roland Czerniawski, CFA Associate Director, Asset
Quarterly Review and Outlook, First Quarter 2018
 Quarterly Review and Outlook, First Quarter 2018 April 19, 2018 by Lacy Hunt, Van Hoisington of Hoisington Investment Management Nearly nine years into the current economic expansion Federal Reserve policy
Consumer Price Index
 The Return of Inflation? Yet another Fed meeting has now come and gone without a rate hike. As much as market participants continue to obsess over when the Fed will normalize interest rates, the Fed Funds
Gundlach: The Goldilocks Era is Over
 Gundlach: The Goldilocks Era is Over December 6, 2017 by Robert Huebscher Easy monetary policies during the post-crisis period have propelled equity prices higher and driven bond yields lower. But as central
A Looming Lack of Liquidity
 A Looming Lack of Liquidity March 9, 2010 by Robert Huebscher Headlines warn that the rapid buildup in the money supply, caused by the Federal Reserve s efforts to confront the financial crisis, is destined
RATIONAL EXUBERANCE. Issue #12. January 2018
 RATIONAL EXUBERANCE Issue #12 January 2018 Multi asset views from RLAM Royal London Asset Management manages 113.6 billion in life insurance, pensions and third party funds*. The Multi Asset team manages
Predicting a US recession: has the yield curve lost its relevance?
 Global Perspective Predicting a US recession: has the yield curve lost its relevance? For professional investor use only Asset Management August 2018 Executive summary It is becoming apparent the US economy
COMMENTARY NUMBER 462 June Trade Balance, Consumer Credit. August 9, Bernanke Bemoans GDP Not Reflecting Common Experience
 COMMENTARY NUMBER 462 June Trade Balance, Consumer Credit August 9, 2012 Bernanke Bemoans GDP Not Reflecting Common Experience Trade Data Place Upside Pressure on Second-Quarter GDP Revision Consumer Credit
Bruce Greenwald: The Crisis Bigger than Global Warming
 Bruce Greenwald: The Crisis Bigger than Global Warming April 26, 2016 by Robert Huebscher Manufacturing is dying on a global basis, according to Bruce Greenwald, and its collapse will mean the demise of
Surveying The Commodity Carnage
 Surveying The Commodity Carnage November 25, 2015 by Doug Ramsey of Leuthold Weeden Capital Management Commodities and commodity stocks have been a disaster in recent years, but fortunately one that our
The Nutcracker and the Bond King
 The Nutcracker and the Bond King 10-year bond yields have just experienced one of the sharpest 100-day percentage drops in over 50 years Interest rates are now below their closing level of the 666 March
Letter from Linda. December 31, Valuations Have Declined Below Historical Averages
 December 31, The last four months of were the most eventful for the U.S. stock market in years. After peaking on 9/20, the S&P 500 Index declined just shy of 20% by 12/24. This was the largest drop since
2018 Stock Market Outlook: Double-Digit Returns?
 2018 Stock Market Outlook: Double-Digit Returns? January 4, 2018 by John Lynch of LPL Financial KEY TAKEAWAYS We forecast 8 10% returns for the S&P 500 in 2018. The S&P 500 is well positioned to generate
Prudential International Investments Advisers, LLC. Global Investment Strategy June 2009
 Prudential International Investments Advisers, LLC. Global Investment Strategy June 2009 By John Praveen, Chief Investment Strategist For Market Commentary Interviews Contact: Lisa Villareal, 973-367-2503/lisa.villareal@prudential.com
Market Commentary. Q Review. Market & Economic Review Fourth Quarter 2018
 Market Commentary Market & Economic Review Fourth Quarter 2018 Q3 2018 Review The third quarter embodied what we would expect to see in an environment where corporate earnings are strong and interest rates
YIELD CURVE INVERSION: A CLEAR BUT UNLIKELY DANGER
 1-year minus -year UST (%) INVESTMENT STRATEGY COMMENTARY YIELD CURVE INVERSION: A CLEAR BUT UNLIKELY DANGER December 4, 17 Investors focus on the yield curve with good reason an inverted curve has historically
August 2017 Market Update
 Market Update (8/2017) Allianz Investment Management LLC August 2017 Market Update Key Points Upbeat GDP data from the second quarter along with another solid labor market report has begun to overshadow
Cyclical Measures May Signal Swan Song for US Equities
 Cyclical Measures May Signal Swan Song for US Equities March 1, 2017 by Adam Butler of ReSolve Asset Management North American equities led the way in 2016, providing double digit returns and bolstering
The Hottest M&A Market Ever:
 The Hottest M&A Market Ever: What You Should Do About It Keynote at the World Angel Investment Summit September 27, 2018 Toronto, Canada Basil Peters Early Exits 10 Years On Ten years ago when I wrote
InvestmentPerspectives APRIL 2017
 Investment Stewardship Guidance InvestmentPerspectives APRIL 2017 How Currency Risk Can Impact Portfolios BEN MOHR, CFA, SENIOR RESEARCH ANALYST - FIXED INCOME International investment strategies such
Jeremy Siegel: The S&P 500 is Fairly Valued
 Jeremy Siegel: The S&P 500 is Fairly Valued November 21, 2017 by Robert Huebscher Jeremy Siegel is the Russell E. Palmer Professor of Finance at the Wharton School of the University of Pennsylvania and
Managed Futures managers look for intermediate involving the trading of futures contracts,
 Managed Futures A thoughtful approach to portfolio diversification Capability A properly diversified portfolio will include a variety of investments. This piece highlights one of those investment categories
3 Things: Fed Levitation, Employment, Savings Rate
 3 Things: Fed Levitation, Employment, Savings Rate March 31, 2016 by Lance Roberts of Real Investment Advice Fed Levitation What is going on at the Federal Reserve? On Tuesday, Janet Yellen comes out and
DURSO WEALTH MANAGEMENT GROUP AT MORGAN STANLEY April 29, 2016 ECONOMIC LANDSCAPE
 ECONOMIC LANDSCAPE The risk-on rotation that took hold in early February continued through the end of the first quarter and has spilled over to the month of April. What has changed? Global recession fears
Excerpts from First Principles: Five Keys to Restoring America s Prosperity
 Excerpts from First Principles: Five Keys to Restoring America s Prosperity In the most fundamental sense, the purpose of monetary reform is simple: restore and lock-in consistent rule-like policies that
Understanding the Key Support Levels for Gold
 Understanding the Key Support Levels for Gold Gold bulls and inquiring minds are perplexed by last week's mayhem in the precious metals markets. In addition to gold and silver, copper prices also went
A Snapshot of the Trump Economy
 October 2018 A Snapshot of the Trump Economy by Merrill Matthews, Ph.D. There s an old saying that a picture is worth a thousand words. Well, economic graphs are pictures that tell a story and sometimes
As Good as Gold. April 24, Be fearful when others are greedy and greedy when others are fearful. Warren Buffett
 As Good as Gold April 24, 2013 Be fearful when others are greedy and greedy when others are fearful. Warren Buffett Whenever one of our investments experiences a significant price correction, we regard
Five key investment themes for 2015
 Five key investment themes for 2015 Exiting QE in the US was always going to be a path of uncertainty for central bankers, globally and for markets and investors. There is simply no exact precedent for
The Humility of Rates and the Arrogance of Equities
 4 Year Average GDP Growth Rate % The Humility of Rates and the Arrogance of Equities U.S. GDP Growth Trends 1951-Current 8 6 4 2 0 1952 1957 1962 1967 1972 1977 1982 1987 1992 1997 2002 2007 2012 4yr GDP
Positioning Equity Portfolios for When Rates Rise
 October 2017 Positioning Equity Portfolios for When Rates Rise The current equity bull market is now more than eight years old and has survived several calls for its demise. So far, it has weathered economic
What s Next for Investors in 2018?
 MARKETS What s Next for Investors in 2018? The correction in global equities is stoking fears of a prolonged selloff putting an end to one of the longest, most profitable bull runs in history. While recent
Economic Theories & Debt Driven Realities
 Economic Theories & Debt Driven Realities March 11, 2019 by Lance Roberts of Real Investment Advice One of the most highly debated topics over the past few months has been the rise of Modern Monetary Theory
Haruhiko Kuroda: Moving forward Japan s economy under Quantitative and Qualitative Monetary Easing
 Haruhiko Kuroda: Moving forward Japan s economy under Quantitative and Qualitative Monetary Easing Speech by Mr Haruhiko Kuroda, Governor of the Bank of Japan, at the Japan Society, New York City, 26 August
Compiled by Timon Rossolimos
 Compiled by Timon Rossolimos - 2 - The Seven Best Forex Indicators -All yours! Dear new Forex trader, Everything we do in life, we do for a reason. Why have you taken time out of your day to read this
Jeremy Siegel on Dow 15,000 By Robert Huebscher December 18, 2012
 Jeremy Siegel on Dow 15,000 By Robert Huebscher December 18, 2012 Jeremy Siegel is the Russell E. Palmer Professor of Finance at the Wharton School of the University of Pennsylvania and a Senior Investment
2017 STOCK MARKET OUTLOOK:
 LPL RESEARCH WEEKLY MARKET COMMENTARY KEY TAKEAWAYS We expect mid-singledigit returns for the S&P 500 in 2017, consistent with historical mid-to-late economic cycle performance. Expected mid- to high-single-digit
A dollar crisis could be around the corner
 Part 1-2014 the year of truth! A US dollar crisis, interest rates spiking and worldwide debt growing out of control and gold and silver through the roof! A dollar crisis could be around the corner The
Value versus Growth: History Stands on the Side of Value Investing
 Value versus Growth: History Stands on the Side of Value Investing October 2015 Executive Summary Since the global financial crisis struck in 2008, we have been witnessing a new chapter in the history
What Rising Interest Rates Mean for the Economy and You
 What Rising Interest Rates Mean for the Economy and You BROUGHT TO YOU BY: In March of this year, the Federal Reserve voted to raise its target federal funds rate to a range of 0.75-1%. Not only that,
Should We Worry About the Yield Curve?
 LEADERSHIP SERIES AUGUST 2018 Should We Worry About the Yield Curve? If and when the yield curve inverts, its signal may well be premature. Jurrien Timmer l Director of Global Macro l @TimmerFidelity Key
Commodities: When is the right time? Benefits and Timing the Cycle
 Commodities: When is the right time? Benefits and Timing the Cycle Tim Pickering CIO and Founder Research Support: Ken Corner, COO Auspice Capital Advisors, Calgary, Canada The views and opinions reflected
NO PAIN, NO GAIN: 2016 MAY REQUIRE TOLERANCE FOR VOLATILITY
 LPL RESEARCH WEEKLY MARKET COMMENTARY December 07 2015 NO PAIN, NO GAIN: 2016 MAY REQUIRE TOLERANCE FOR VOLATILITY Burt White Chief Investment Officer, LPL Financial Jeffrey Buchbinder, CFA Market Strategist,
Crestmont Research. The stock market is finally fairly valued for conditions of low inflation and low interest rates.
 Crestmont Research Nightmare On Wall Street: This Secular Bear Has Only Just Begun By Ed Easterling July 1, 2012 (Updated January 31, 2017) All Rights Reserved Secular bull markets are great parties. Investors
A Picture of the Obama Economy
 March 2016 A Picture of the Obama Economy by Merrill Matthews, Ph.D. Introduction The old saying is that a picture is worth a thousand words. Well, economic graphs are pictures where data-driven lines,