LERØY SEAFOOD GROUP. Preliminary financial figures February 23 rd Henning Beltestad. Ivan Vindheim CEO CFO
|
|
|
- Tracy Bruce
- 6 years ago
- Views:
Transcription


1 LERØY SEAFOOD GROUP Preliminary financial figures 2010 February 23 rd 2011 Henning Beltestad CEO Ivan Vindheim CFO 1 1

2 Agenda 1. 1 Considerations 2. 2 Key financial figures Q Lerøy at a glance 4. 4 Market glance 2 2
 Biology satisfactory But still significant regional differences costwise")
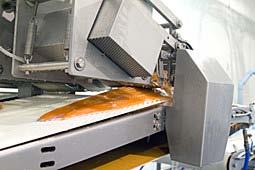
3 Highlights as of Q All-time high both turnover and profitwise EBIT/kg all inclusive NOK 15.1 High salmon spot prices on the back of a flat global supply and strong demand However, high proportion of contracts (45%) Biology satisfactory But still significant regional differences costwise Another extremely good quarter for Sales and Distribution Strong cash-flow Cash generation of NOK1.2bn 2010 FY Acquired 51.0 % stake in Jokisen Eväät OY in January 2011 Enjoys a strong position in the sale and distribution of seafood in the Finnish market 3 3


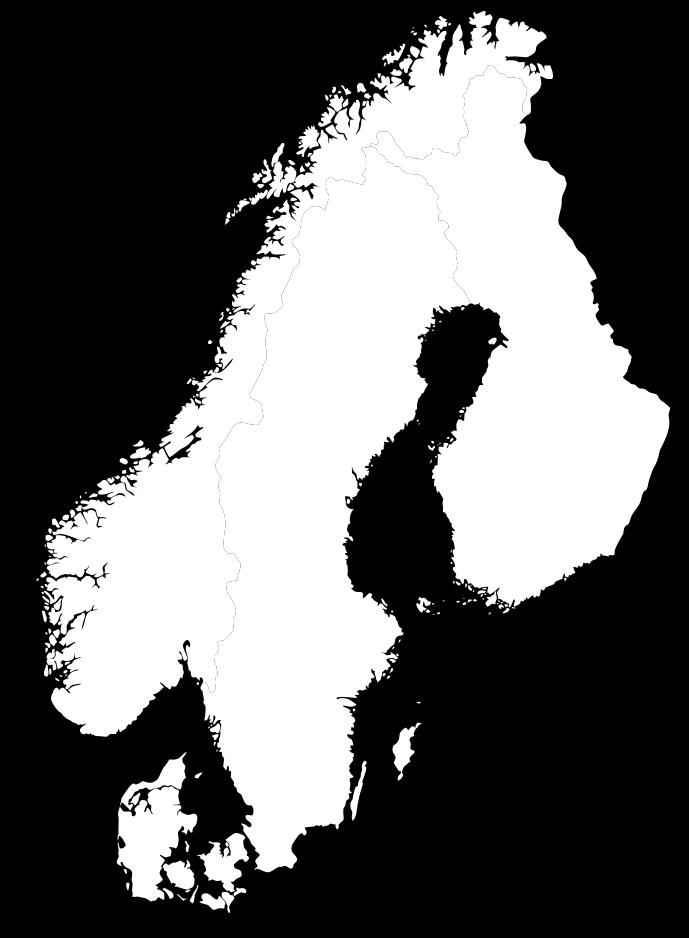
4 Nordic Distribution 4 4

5 New Distribution Centre in Stockholm April

6 New Hatchery Lerøy Midnor AS and Lerøy Hydrotech AS 10,000 m 2 recycling plant at Belsvik, Sør-Trøndelag 14 mill smolts Capex NOK220m, building start June 2011, and building period months Tveitnesvik, Hardanger 6 6
7 Internal considerations Q All figures in NOK mill Q4-10 Q4-09 Change Change Turnover % % EBITDA % % EBIT bef adj biom % % PTP bef adj biom*) % % *) PTP = Pre-Tax Profit 7 7
8 Turnover LSG NOK million
9 EBIT LSG pre biomass adj NOK million LSG was listed on Oslo Stock Exchange in
10 Quartely EBIT LSG pre biomass adj NOK million
11 Return on capital employed (ROCE) Percent %* * Target communicated at the listing on Oslo Stock Exchange
12 Annual dividend since % NOKm % 5 % 4 % 3 % 2 % 1 % Dividend Yield % Listed on Oslo Stock Exchange
13 Creating shareholder s value NOKm % 6 % 5 % 4 % 3 % 2 % 1 % 0 % Market Cap Yield Listed on Oslo Stock Exchange
14 Nine years with sustainable growth, more to come! NOKm GWT Market Cap EV GWT Listed on Oslo Stock Exchange

15 Internal considerations Q Production In total, volumes ca in line with 2010E Overall, operations satisfactory Substantial improvements in Lerøy Vest However, region Hordaland still suffers from previous biological issues Input factors rising, however, untapped potential in Biological performance Economies of scale Sales and Distribution Capitalising on Economies of scale Systems Global network Organisation/human capital 15 15

16 Internal considerations Q cont d Affiliated companies Satisfactory biological performance Significant increase in profit as a result of higher prices (Norskott/Scottish Sea Farms) Financially solid NIBD NOK1,299m as of YE 2010 Proposed dividend NOK/share 10.0, i.e. NOK546m High profit and excellent cash performance Well positioned for future organic and strategic growth 16 16

17 External considerations Q Demand and supply Seasonally high spot prices in Q4 10 on the back of a strong demand and modest global supply 37.3% in Q4 10 vs Q % in 2010 FY vs 2009 FY However, LSG high proportion of contracts Above 40% in Q4 10, and approx. 50% 2010 FY Somewhat higher contract prices in Q4 10 compared with Q3 10 Moderate supply growth from Norway in Q4 5.4% in Q4 10 vs Q % 2010 FY vs 2009 FY Uncertainty related to Chile Strong market Enduring demand for seafood in general, and for Atlantic salmon in particular Despite economic down-cycle, good demand also expected in the time ahead Political issues / trade barriers 5 years review of the US punitive tariff on fresh Norwegian salmon Extended control of Norwegian salmon into China 17 17
18 Agenda 1. 1 Considerations 2. 2 Key financial figures Q Lerøy at a glance 4. 4 Market glance 18 18
19 Income Statement Q All figures in NOK 000 Q Q Salgsinntekter / Operating revenues Vareforbruk / Cost of goods sold Lønnskostnader / Salaries and wages Andre driftskostnader / Other operating costs Driftsresultat før avskrivninger / EBITDA Ordinære avskrivninger / Ordinary depreciation Driftsresultat før verdijustering biomasse / EBIT before fair value adjustment biomass Verdijustering biomasse / Fair value adjustment biomass Driftsresultat / Operating profit Inntekt fra tilknyttede selskaper / Income from associated companies Netto finansposter / Net financial items Resultat før skattekostnad og før just biomasse / Profit before tax bef adj biom Resultat før skattekostnad / Profit before tax Beregnede skatter / Estimated taxation Periodens resultat / Profit for the period
20 Key Figures Production Q Figures NOKm *) Lerøy Midnor *) **) Lerøy Hydrotech Lerøy Aurora Lerøy Vest ***) Sjøtroll Havbruk Others / elimination Total Q4 10 Total Q4 09 Revenues 387,3 292,2 238,3 278,2 117,4 167, , ,9 EBIT before biom adj 143,6 109,5 95,9 77,0 26,7 10,6 463,1 232,7 RoS before biom adj 37 % 37 % 40 % 28 % 23 % 6 % 31 % 20 % Volumes (GWTk) 10,2 7,7 6,3 8,5 3,0 35,8 35,0 EBIT/kg 14,0 14,1 15,3 9,1 8,8 12,7 6,3 EBIT/kg all inclusive NOK 15.1 (Q NOK/kg 8.9) Q4 09 comparable figures: Revenues 338,0 247,4 208,0 205,6 n.a. 157, ,9 EBIT before biom adj 101,0 49,2 53,2 17,4 n.a. 11,9 232,7 RoS before biom adj 30 % 20 % 26 % 8 % n.a. 8 % 20 % Volumes (GWTk) 11,3 8,5 7,5 7,8 n.a. 35,0 EBIT/kg 8,9 5,8 7,1 2,2 n.a. 6,3 *) Including VAP (post / pre-rigor, fillets, portions etc) **) Cold winter and previous biological issues in Lerøy Vest causing high prod cost / RFS, in particular for salmontrout. Improved biological performance for salmon ***) Acquired and consolidated as from November
21 Key Figures Production YTD Q Figures NOKm Lerøy Midnor *) Lerøy Hydrotech Lerøy Aurora *) **) Lerøy Vest ***) Sjøtroll Havbruk Others / elimination Total YTD Q4 10 Total YTD Q4 09 Revenues 1 240,9 902,8 737, ,5 117,4 605, , ,1 EBIT before biom adj 469,8 319,7 264,9 277,5 26,7 26, ,1 755,5 RoS before biom adj 38 % 35 % 36 % 25 % 23 % 4 % 29 % 20 % Volumes (GWTk) 34,0 25,2 20,3 34,3 3,0 116,8 108,5 EBIT/kg 13,8 12,7 13,1 8,1 8,8 11,6 6,7 EBIT/kg all inclusive NOK 13.6 (YTD Q NOK/kg 8.8) YTD Q4 09 comparable figures: Revenues 1 072,2 657,9 575,2 918,2 n.a. 505, ,1 EBIT before biom adj 303,7 134,5 135,2 157,9 n.a. 24,1 755,5 RoS before biom adj 28 % 20 % 23 % 17 % n.a. 5 % 20 % Volumes (GWTk) 35,0 21,5 19,3 32,7 n.a. 108,5 EBIT/kg 8,7 6,3 7,0 4,8 n.a. 6,7 *) Including VAP (post / pre-rigor, fillets, portions etc) **) Cold winter and previous biological issues in Lerøy Vest causing high prod cost / RFS, in particular for salmontrout. Improved biological performance for salmon ***) Acquired and consolidated as from November
22 Key Figures Sales & Distribution Q Figures NOKm Sales & Distribution Elimination Total Q4 10 Total Q4 09 Revenues 2 631,5-183, , ,4 EBIT 92,0 0,2 92,2 82,8 RoS 3,5 % 3,8 % 3,8 % An extremely good quarter 22 22
23 Key Figures Sales & Distribution YTD Q Figures NOKm Sales & Distribution Elimination Total YTD Q4 10 Total YTD Q4 09 Revenues 9 425,6-755, , ,3 EBIT 254,7 0,7 255,3 216,6 RoS 2,7 % 2,9 % 2,9 % And an extremely good YTD 23 23
24 Norskott Havbruk LSG s share = 50% NOKm Q Q YTD Revenues EBITDA EBIT bef adj biom EBIT Pre tax Volumes (gwt) 6,3 8,5 27,1 26,5 EBIT/kg 10,2 6,1 10,3 6,2 Balance sheet Licences, goodwill Tangible fixed assets Inventories Other current assets Total assets Equity Debt Total equity and debt Net interest bearing debt
25 Balance Sheet Q All figures in NOK Immaterielle eiendeler / Intangible assets Varige driftsmidler / Tangible fixed assets Finansielle anleggsmidler / Financial non-current assets Sum anleggsmidler / Total fixed assets Biologiske eiendeler / Biological assets Varer / Inventories Fordringer / Receivables Betalingsmidler / Cash and cash equivalents Sum omløpsmidler / Total current assets Sum eiendeler / Total assets Innskutt egenkapital / Paid in equity Opptjent egenkapital / Earned equity Ikke-kontrollerende eierinteresser / Non-controlling interests Sum egenkapital / Total equity Avsetning for forpliktelser / Accrued liabilities Langsiktig gjeld / Long-term liabilities Kortsiktige kreditter / Short-term loans Annen kortsiktig gjeld / Other short-term liabilities Sum gjeld / Total liabilities Sum egenkapital og gjeld / Total equity and liabilities
26 Cash Flow Statement Q All figures in NOK 000 Q Q YTD Kontantstrøm fra drift / Cash flow from operating activities Resultat før skatt / Profit before tax Ordinære avskrivninger / Ordinary depreciation Endring verdijustering biomasse / Change in value adjustment biomass Resultat tilknyttede selskaper / Profit from associated companies Endring kundefordringer / Change in accounts receivable Endring leverandører / Change in accounts payable Endring varelager / Change in inventories Andre tidsavgrensninger og betalt skatt / Other accruals and taxes paid Netto kontantstrøm fra drift / Net cash flows from operating activities Kontantstrøm fra investeringsaktiviteter / Cash flow from investing activities Netto investering i varige driftsmidler etc. / Net investment in fixed assets etc Netto investering i immaterielle eiendeler / Net investment in intangible fixed assets Netto utbetaling ved kjøp av aksjer etc. / Net payments for acquisitions of shares etc Innbetaling av utbytte fra tilknyttede selskaper / Dividend from associates Netto utbetaling ved kjøp av konsernselskaper / Net acquisitions of group companies Endring langsiktige fordringer etc. / Change in long-term receivables etc Netto kontantstrøm fra investeringsaktiviteter / Net cash flow from investing activities Kontantstrøm fra finansieringsaktiviteter / Cash flow from financing activities Netto endring i kortsiktige kreditter / Net change in bank overdraft Netto endring langsiktig gjeld / Net change in long-term debt Netto innbetaling av egenkapital / Net equity contributions Utbetaling av utbytte / Dividend payments Netto kontantstrøm fra finansieringsaktiviteter / Net cash flow from financing activities Netto kontantstrøm for perioden / Net cash flows for the period Betalingsmidler ved periodens begynnelse / Cash and cash equivalents at beginning of period Betalingsmidler fra oppkjøp / Cash and cash equivalents from business combinations Betalingsmidler ved periodens slutt / Cash and equivalents at end of period
27 Key figures - Lerøy Seafood Group Q Q Q Resultatmargin før just.biomasse / Profit margin before adj. biomass 21,1 % 14,2 % 18,3 % 12,4 % Resultatmargin / Profit margin 1) 26,6 % 16,8 % 21,8 % 13,2 % Driftsmargin før just.biomasse / Operating margin before adj.biomass 20,9 % 14,3 % 17,8 % 12,7 % Driftsmargin / Operating margin 2) 25,9 % 17,2 % 21,2 % 13,5 % Resultat per aksje før just.biomasse / Earnings per share before adj.biomass 7,45 4,33 22,08 12,80 Resultat per aksje / Earnings per share 3) 9,26 5,05 26,25 13,62 Utvannet resultat per aksje / Diluted earnings per share 9,26 5,05 26,25 13,62 ROCE før just.biomasse (annualisert) / ROCE before adj.biomass (annualised) 36,7 % 23,8 % 27,5 % 18,1 % ROCE (annualisert) / ROCE (annualised) 4) 42,8 % 26,8 % 30,8 % 18,5 % Egenkapitalandel / Equity ratio 52,8 % 51,8 % 52,8 % 51,8 % Netto rentebærende gjeld / Net interest bearing debt Kontantstrøm per aksje / Cash-flow per share 5) 9,21 6,88 26,65 17,63 Utvannet kontantstrøm per aksje / Diluted cash-flow per share 9,21 6,88 26,65 17,63 1) Resultatmargin = Resultat før skatt / Salgsinntekter Profit margin = Profit before tax / Revenues 2) Driftsmargin = Driftsresultat / Salgsinntekter Operating margin = Operating profit / Revenues 3) Resultat per aksje = Majoritetens andel resultat / Gjennomsnittlig antall aksjer Earnings per share = Majority interests / Average number of shares 4) ROCE = [Resultat før skatt + netto finansposter] / Gjennomsnitt [netto rentebærende gjeld + sum egenkapital] ROCE = [Pre tax profit + Net financial items] / Average [Net interest bearing debt + Total equity] 5) Kontantstrøm fra drift Cash-flow from operations 27 27
28 Funding NOK300m 5 years extendable bond with Eksportfinans ASA established in Q at favourable terms Sound debt repayment profile NOK million Instalments *) Covenants NIBD/EBITDA < 5 and Equity ratio > 30% Q4 2010: 0.7 and 62.0 % respectively Satisfactory committed unused credit lines **) *) Of which NOK300m extendable bond with Eksportfinans ASA **) Adjusted for bank deposits and deferred tax associated with licenses 28 28
29 Agenda 1. 1 Considerations 2. 2 Key financial figures Q Lerøy at a glance 4. 4 Market glance 29 29
30 Lerøy Seafood Group - Global organization Scotland/Shetland Farming Dist. & Sales Portugal, France Dist. & Sales Norway Farming Dist. & Sales Turkey Dist. & Sales Finland Dist. & Sales Sweden Dist. & Sales Japan Dist. & Sales North America Dist. & Sales China Dist. & Sales Chile 30 30

31 31 31
 12.5% (12.4%) share of Norwegian seafood export value 17.6% (17.9%) of Norwegian salmon export 22.2% (20.")
32 Lerøy Seafood Group Global distribution network Head Office in Bergen National distribution and processing in Norway, Sweden, France, Portugal, and Turkey Branch offices in key markets (France, Japan, China and USA) 12.5% (12.4%) share of Norwegian seafood export value 17.6% (17.9%) of Norwegian salmon export 22.2% (20.8%) of Norwegian value added salmon export #2 global salmon farmer Total of 1,794 employees Sales and distribution 402 Production and farming 1,392 Associates 394 (not consolidated) 32 32

33 Lerøy Seafood Group Fully integrated From roe to the plate Competent employees Decentralized farming units Autonomous units in three regions In addition, the affiliated company Scottish Sea Farms in Scotland Processing plants Smokehouses Fillets, portions etc Post / pre-rigor Global sales network Group structure gives rise to economies of scale and avoidance of scale disadvantages 33 33

34 Lerøy Seafood Group - Sales per market 2010 USA and Canada 7,7 % Rest of Europe 8,7 % Others 2,4 % EU 54,7 % Norway 15,4 % Asia Pacific 11,1 % More than 60 countries 34 34

35 Lerøy Seafood Group - Sales per product 2010 Others Pelagic fish 3,6 % 0,9 % White fish 7,9 % Shellfish 4,6 % Salmontrout 5,2 % Processed salmon 27,9 % Whole salmon 49,8 % More than 200,000 tons 35 35
 Lerøy Aurora AS Lerøy Midnor AS Lerøy HydrotechAS Lerøy Vest AS Sjøtroll Havbruk AS 36")
36 Farming Norway Lerøy Aurora AS (salmon) Lerøy Midnor AS (salmon) Lerøy Hydrotech AS (salmon) Lerøy Vest AS (salmon and trout) Sjøtroll Havbruk AS (salmon and trout) Lerøy Aurora AS Lerøy Midnor AS Lerøy HydrotechAS Lerøy Vest AS Sjøtroll Havbruk AS 36 36

37 Integrated value chain 37 37
38 Lerøy Seafood Group Salmon/trout farming Company Ownership Licences Mill. smolt E 2011E share No individuals GWT GWT GWT Lerøy Midnor AS 100 % 30 9, Lerøy Aurora AS 100 % 17 6, Lerøy Hydrotech AS 100 % 24 7, Lerøy Vest AS 100 % 34 14, Sjøtroll Havbruk AS *) 50,71 % 25 8, Total Norway , Norskott Havbruk AS (UK) **) 50 % 6, Total 51, Consolidated, farming Affiliated, farming *) Acquired and consolidated as from November 2010 **) LSG s share 38 38
39 Agenda 1. 1 Considerations 2. 2 Key financial figures Q Lerøy at a glance 4. 4 Market glance 39 39
40 Market development for Atlantic Salmon from Norway Jan-Dec 2009 vs Jan-Dec 2010 Volume 2009 Volume 2010 Change Value 2009 Value 2010 Change EU ,0 % ,2 % Others ,2 % ,3 % Japan ,1 % ,1 % Russia ,2 % ,2 % USA ,5 % ,7 % In total ,7 % ,5 % (Volume in tons WFE, value in thousand NOK) Others is specified on the following slide Figures as per Source: NSEC 40 40
41 Market development for Atlantic Salmon from Norway Jan-Dec 2009 vs Jan-Dec 2010 "Others" Volume 2009 Volume 2010 Change Value 2009 Value 2010 Change Hongkong ,4 % ,7 % Ukraine ,1 % ,7 % China ,3 % ,2 % Taiwan ,3 % ,2 % Israel ,0 % ,0 % South Korea ,0 % ,5 % Thailand ,6 % ,6 % Vietnam ,0 % ,5 % Turkey ,3 % ,8 % Singapore ,1 % ,7 % Switzerland ,4 % ,3 % Belarussia ,5 % ,3 % Kazakhstan ,0 % ,2 % Australia ,8 % ,2 % South Africa ,2 % ,4 % Other countries ,1 % ,5 % Total "Others" ,2 % ,3 % (Volume in tons WFE, value in thousand NOK) Figures as per Source: NSEC 41 41
42 SPOT prices, fresh Atlantic salmon, crosssection, FCA Oslo, as of week (Superior quality). Avrg Q4 10 NOK vs avrg Q4 09 NOK (+37.3%) Avrg 2010 NOK vs avrg 2009 NOK (+22.5%) Q1-03 Q2-03 Q3-03 Q4-03 Q1-04 Q2-04 Q3-04 Q4-04 Q1-05 Q2-05 Q3-05 Q4-05 Q1-06 Q2-06 Q3-06 Q4-06 Q1-07 Q2-07 Q3-07 Q4-07 Q1-08 Q2-08 Q3-08 Q4-08 Q1-09 Q2-09 Q3-09 Q4-09 Q1-10 Q2-10 Q3-10 Q4-10 Q1-11 FHL/NOS FCA Oslo 20,42 18,92 18,09 20,35 22,38 23,10 21,26 20,23 23,44 24,89 26,86 25,94 28,24 39,72 34,44 25,92 27,47 25,00 24,34 23,10 24,94 25,02 27,72 25,33 28,22 35,09 31,72 27,52 34,00 40,00 38,02 37,77 39,18 46,00 44,00 42,00 40,00 38,00 36,00 34,00 32,00 30,00 28,00 26,00 24,00 22,00 20,00 18,00 16,00 14,00 12, Quarterly price NOS FCA OSLO Weekly price NOS FCA Oslo Figures as per Source: NOS 42 42
43 SPOT prices vs Export Volumes Norway 2010/ Norwegian Export of Salmon pr week (wfe tons) (EFF), Prices FCA Oslo (gwt) NOS 3-6 kg 50, ,00 40, ,00 30,00 Tons , ,00 15, ,00 5, Eksp 2009 Eksp 2010 NOS NOS Source: EFF/NOS 43 43
44 SPOT prices vs Export Volumes Norway 2011/ Norwegian Export of Salmon pr week (wfe tons) (EFF), Prices FCA Oslo (gwt) NOS 3-6 kg 50, ,00 40, ,00 30,00 Tons , ,00 15, ,00 5, Eksp 2011 Eksp 2010 NOS NOS Figures as per Source: EFF/NOS 44 44
45 Atlantic salmon Supply in tons WFE Change Change Change Change Change Change Change E E Norway % % ,9 % ,4 % ,5 % ,4 % ,3 % United Kingdom % % ,8 % ,1 % ,2 % ,8 % ,8 % Faroe Islands % % ,7 % ,5 % ,9 % ,9 % ,7 % Ireland % % ,5 % ,5 % ,0 % ,7 % ,9 % Iceland % % ,0 % ,0 % ,0 % ,0 % - Total Europe % % ,3 % ,7 % ,8 % ,4 % ,5 % Chile % % ,3 % ,2 % ,7 % ,6 % ,5 % Canada % % ,8 % ,2 % ,6 % ,4 % ,3 % Australia % % ,7 % ,0 % ,3 % ,5 % ,1 % USA % % ,6 % ,2 % ,5 % ,8 % ,1 % Others % % ,0 % ,7 % ,3 % ,0 % ,0 % Total America % % ,2 % ,2 % ,6 % ,8 % ,4 % Total World-wide ,6 % ,7 % ,0 % ,8 % ,7 % ,7 % ,4 % 3.8% growth Shift in demand due to new markets and category development Figures as per Source: Kontali 45 45
46 Atlantic salmon - Harvest Quantities World Wide in tons WFE Harvest estimates Atlantic Salmon World Wide 15 % 12 % 12 % 12 % 13 % 11 % 8 % 6 % 1 % 3 % -1 % -7 % Jan Feb Mar Apr May Jun Jul Aug Sep Oct Nov Dec Chng line 20 % 15 % 10 % 5 % 0 % -5 % -10 % Figures as per Source: Kontali 46 46
47 Atlantic salmon - Harvest Quantities Europe in tons WFE Harvest estimates Atlantic Salmon in Europe 15 % % 1 % 11 % 7 % -1 % 3 % 12 % 7 % 8 % 7 % 10 % 10 % 5 % 0 % -5 % % Jan Feb Mar Apr May Jun Jul Aug Sep Oct Nov Dec Chng line -10 % -15 % Figures as per Source: Kontali 47 47


48 Lerøy Seafood Group International Sponsor of the Nordic Ski World Championship in Oslo

49 49 49


50 Thank you!
LERØY SEAFOOD GROUP. Quarterly report Second quarter August 18 th Henning Beltestad. Ivan Vindheim CEO CFO
 LERØY SEAFOOD GROUP Quarterly report Second quarter 2011 August 18 th 2011 Henning Beltestad CEO Ivan Vindheim CFO 1 1 Agenda 1. 1 Considerations 2. 2 Key financial figures Q2 2011 3. 3 Lerøy at a glance
LERØY SEAFOOD GROUP. Quarterly report Third quarter 2010 November 4th Henning Beltestad. Ivan Vindheim CEO CFO
 LERØY SEAFOOD GROUP Quarterly report Third quarter 2010 November 4th 2010 Henning Beltestad CEO Ivan Vindheim CFO 1 Agenda 1. 1 Considerations 2. 2 Key financial figures Q3 2010 3. 3 Lerøy at a glance
LERØY SEAFOOD GROUP. Quarterly report Third quarter November 8 th Henning Beltestad. Ivan Vindheim CEO CFO
 LERØY SEAFOOD GROUP Quarterly report Third quarter 2011 November 8 th 2011 Henning Beltestad CEO Ivan Vindheim CFO 1 1 Agenda 1. 1 Considerations 2. 2 Key financial figures Q3 2011 3. 3 Lerøy at a glance
LERØY SEAFOOD GROUP. First quarter May 15 th Henning Beltestad. Arne Vatne CEO. Group Chief Accountant
 LERØY SEAFOOD GROUP Quarterly report First quarter 2012 May 15 th 2012 Henning Beltestad CEO Arne Vatne Group Chief Accountant 1 1 Agenda 1. 1 Considerations 2. 2 Key financial figures Q1 2012 3. 3 Lerøy
LERØY SEAFOOD GROUP. Quarterly report Second quarter August 23 rd Henning Beltestad. Arne Vatne CEO. Group Chief Accountant
 LERØY SEAFOOD GROUP Quarterly report Second quarter 2012 August 23 rd 2012 Henning Beltestad CEO Arne Vatne Group Chief Accountant 1 1 Agenda 1. 1 Considerations 2. 2 Key financial figures Q2 2012 3. 3
LERØY SEAFOOD GROUP. Quarterly report Preliminary financial figures February 26 th Henning Beltestad. Sjur S.
 LERØY SEAFOOD GROUP Quarterly report Preliminary financial figures 2012 February 26 th 2013 Henning Beltestad CEO 1 Sjur S. Malm 1 CFO Agenda 1. 1 Considerations 2. 2 Key financial figures Q4 2012 3. 3
Lerøy Seafood Group. Quarterly report First quarter May 12th Helge Singelstad. Henning Beltestad. Ivan Vindheim.
 Lerøy Seafood Group Quarterly report First quarter 2010 May 12th 2010 Helge Singelstad Chairman Henning Beltestad CEO Ivan Vindheim CFO 1 Agenda 1. 1 Considerations 2. 2 Key financial figures Q1 2010 3.
Lerøy Seafood Group. Preliminary financial figures February 25th Helge Singelstad. Alf-Helge Aarskog. Ivan Vindheim.
 Lerøy Seafood Group Preliminary financial figures 2009 February 25th 2010 Helge Singelstad Chairman Alf-Helge Aarskog CEO Ivan Vindheim CFO 1 Agenda 1. 1 Considerations 2. 2 Key financial figures Q4 2009
Lerøy Seafood Group. Quarterly report First quarter May 12th Helge Singelstad. Ivan Vindheim CEO CFO
 Lerøy Seafood Group Quarterly report First quarter 2009 May 12th 2009 Helge Singelstad CEO Ivan Vindheim CFO Agenda 1. 1 Considerations 2. 2 Key financial figures Q1 2009 3. 3 Lerøy at a glance 4. 4 Market
Lerøy Seafood Group. Quarterly report Second quarter August 12 th Ole-Eirik Lerøy. Ivan Vindheim. President & CEO CFO
 Seafood Group Quarterly report Second quarter 2008 August 12 th 2008 Ole-Eirik President & CEO Ivan Vindheim CFO Agenda 1. 1 Considerations 2. 2 Key financial figures Q2 2008 3. 3 at a glance 4. 4 Market
Lerøy Seafood Group. Quarterly report First quarter May 8 th Ole-Eirik Lerøy. Ivan Vindheim. President & CEO CFO
 Seafood Group Quarterly report First quarter 2008 May 8 th 2008 Ole-Eirik President & CEO Ivan Vindheim CFO Agenda 1. 1 Considerations 2. 2 Key financial figures Q1 2008 3. 3 at a glance 4. 4 Market glance
LERØY SEAFOOD GROUP. Quarterly report Second quarter August 22 th Henning Beltestad. Sjur S. Malm CEO CFO
 LERØY SEAFOOD GROUP Quarterly report Second quarter 2013 August 22 th 2013 Henning Beltestad CEO Sjur S. Malm CFO 1 1 Agenda 1. 1 Considerations 2. 2 Key financial figures Q2 2013 3. 3 Market glance 4.
LERØY SEAFOOD GROUP. Quarterly report Third quarter November 13 th Henning Beltestad. Sjur S. Malm CEO CFO
 LERØY SEAFOOD GROUP Quarterly report Third quarter 2013 November 13 th 2013 Henning Beltestad CEO Sjur S. Malm CFO 1 1 Agenda 1. 1 Considerations 2. 2 Key financial figures Q3 2013 3. 3 Market glance 4.
Lerøy Seafood Group. Quarterly report Second quarter August 19th Helge Singelstad. Ivan Vindheim CEO CFO
 Lerøy Seafood Group Quarterly report Second quarter 2009 August 19th 2009 Helge Singelstad CEO Ivan Vindheim CFO 1 Agenda 1. 1 Considerations 2. 2 Key financial figures Q2 2009 3. 3 Lerøy at a glance 4.
LERØY SEAFOOD GROUP. Quarterly report Preliminary financial figures February 25 th Henning Beltestad. Sjur S.
 LERØY SEAFOOD GROUP Quarterly report Preliminary financial figures 2013 February 25 th 2014 Henning Beltestad CEO Sjur S. Malm CFO 1 1 Agenda 1. 1 Considerations 2. 2 Key financial figures Q4 2013 3. 3
i figures 2008 February 26 th 2009 Helge Singelstad Ivan Vindheim
 Lerøy Seafood Group Preliminary i financial i figures 2008 February 26 th 2009 Helge Singelstad CEO Ivan Vindheim CFO Agenda 1. 1 Considerations 2. 2 Key financial i figures Q4 2008 3. Lerøy at a glance
i figures 2007 February 26 th 2008 Ole-Eirik Lerøy President & CEO
 Lerøy Seafood Group Preliminary i financial i figures 2007 February 26 th 2008 Ole-Eirik Lerøy President & CEO Agenda 1. 1 Considerations 2. 2 Key financial i figures Q4 2007 3. Lerøy at a glance 4. 4
Lerøy Seafood Group. Quarterly report Third quarter November 4 th Ole-Eirik Lerøy. Ivan Vindheim. President & CEO CFO
 Seafood Group Quarterly report Third quarter 2008 November 4 th 2008 Ole-Eirik President & CEO Ivan Vindheim CFO Agenda 1. 1 Considerations 2. 2 Key financial figures Q3 2008 3. 3 at a glance 4. 4 Market
Lerøy Seafood Group. Quarterly report Third quarter November 1 st Ole-Eirik Lerøy. Helge Singelstad. President & CEO
 Seafood Group Quarterly report Third quarter 2006 November 1 st 2006 Ole-Eirik President & CEO Helge Singelstad Vice president & vice CEO Agenda 1. 1 Considerations 2. 2 Key financial figures Q3 2006 3.
Lerøy Seafood Group Quarterly report First quarter 2006 May 15th 2006 Ole-Eirik Lerøy President & CEO Helge Singelstad Vice president & vice CEO
 Lerøy Seafood Group Quarterly report First quarter 2006 May 15 th 2006 Ole-Eirik Lerøy President & CEO Helge Singelstad Vice president & vice CEO Agenda 1. 1 Considerations 2. 2 Key financial figures Q1
Lerøy Seafood Group Quarterly report 3rd Quarter 2005 November 10th 2005 Ole-Eirik Lerøy President & CEO Helge Singelstad Vice president & vice CEO
 Lerøy Seafood Group Quarterly report 3rd Quarter 2005 November 10 th 2005 Ole-Eirik Lerøy President & CEO Helge Singelstad Vice president & vice CEO Agenda 1. 1 Considerations 2. 2 Key financial figures
Lerøy Seafood Group. Preliminary financial figures February 26 th Ole-Eirik Lerøy. Helge Singelstad. President & CEO
 Seafood Group Preliminary financial figures 2006 February 26 th 2007 Ole-Eirik President & CEO Helge Singelstad Vice president & vice CEO Agenda 1. 1 Considerations 2. 2 Preliminary financial figures 2006
Lerøy Seafood Group. Quarterly report 2nd Quarter August 12 th Ole-Eirik Lerøy President & CEO Helge Singelstad Vice president & vice CEO
 Lerøy Seafood Group Quarterly report 2nd Quarter 2005 August 12 th 2005 Ole-Eirik Lerøy President & CEO Helge Singelstad Vice president & vice CEO Agenda 1. 1 Considerations 2. 2 Key financial figures
Lerøy Seafood Group. Preliminary financial figures February 24 th Ole-Eirik Lerøy. Helge Singelstad. President & CEO
 Lerøy Seafood Group Preliminary financial figures 2005 February 24 th 2006 Ole-Eirik Lerøy President & CEO Helge Singelstad Vice president & vice CEO Agenda 1. 1 Considerations 2. 2 Preliminary financial
Lerøy Seafood Group Preliminary financial figures 2004 February 24th 2005 Ole-Eirik Lerøy President & CEO Helge Singelstad Vice president & vice CEO
 Lerøy Seafood Group Preliminary financial figures 2004 February 24 th 2005 Ole-Eirik Lerøy President & CEO Helge Singelstad Vice president & vice CEO Agenda 1. 1 Considerations 2. 2 Preliminary key financial
Lerøy Seafood Group. Quarterly report First quarter May 13 th. Ole-Eirik Lerøy CEO Helge Singelstad CFO
 Lerøy Seafood Group Quarterly report First quarter 2004 May 13 th Ole-Eirik Lerøy CEO Helge Singelstad CFO Agenda 1. 1 Considerations 2. 2 Key financial figures Q1 2004 3. 3 Lerøy at a glance 4. 4 Lerøy
Lerøy Seafood Group. Preliminary report February 26 th. Ole-Eirik Lerøy CEO. Helge Singelstad CFO
 Lerøy Seafood Group Preliminary report 2003 February 26 th Ole-Eirik Lerøy CEO Helge Singelstad CFO Agenda 1. 1 Considerations 2. 2 Key financial figures 2003 3. 3 Lerøy at a glance 4. 4 Lerøy Seafood
Lerøy Seafood Group. Quarterly report First quarter May 13 th Ole-Eirik Lerøy President & CEO Helge Singelstad Vice president & vice CEO
 Lerøy Seafood Group Quarterly report First quarter 2005 May 13 th 2005 Ole-Eirik Lerøy President & CEO Helge Singelstad Vice president & vice CEO Agenda 1. Considerations 1 2. 2 Key financial figures Q1
Lerøy Seafood Group. Quarterly report Second quarter August 26 th. Ole-Eirik Lerøy CEO Helge Singelstad CFO
 Lerøy Seafood Group Quarterly report Second quarter 2004 August 26 th Ole-Eirik Lerøy CEO Helge Singelstad CFO Agenda 1. 1 Considerations 2. 2 Key financial figures Q2 2004 3. 3 Lerøy at a glance 4. 4
Q May 12th Oslo
 Q1 2016 May 12th Oslo Lerøy Seafood Group ASA CEO Henning Beltestad CFO Sjur S. Malm Agenda Highlights Key financial figures Outlook Q1 2016 EBIT before FV adj. NOK 584.5 million EBIT/kg all inclusive
Lerøy Seafood Group. 2 nd quarterly report August 28 th. Ole-Eirik Lerøy CEO. Helge Singelstad CFO
 Lerøy Seafood Group 2 nd quarterly report 2003 August 28 th Ole-Eirik Lerøy CEO Helge Singelstad CFO Agenda 1. 1 Considerations 2. 2 Key financial figures Q2 2003 3. 3 Lerøy at a glance 4. 4 Lerøy Seafood
Lerøy Seafood Group. Quarterly report Third quarter November 25 th. Ole-Eirik Lerøy CEO Helge Singelstad CFO
 Lerøy Seafood Group Quarterly report Third quarter 2004 November 25 th Ole-Eirik Lerøy CEO Helge Singelstad CFO Agenda 1. 1 Considerations 2. 2 Key financial figures Q3 2004 3. 3 Lerøy at a glance 4. 4
Lerøy Seafood Group Preliminary report
 Lerøy Seafood Group Preliminary report 2002 27.02.2003 Contents Sections Page I Considerations 3 II Preliminary key financial figures 2002 6 III Lerøy at a glance 17 IV Lerøy Seafood Group - Company profile
Lerøy Seafood Group. 1 st quarterly report May 15 th. Ole-Eirik Lerøy CEO. Helge Singelstad CFO
 Lerøy Seafood Group 1 st quarterly report 2003 May 15 th Ole-Eirik Lerøy CEO Helge Singelstad CFO Contents Sections Page I Considerations 3 II Key financial figures Q1 2003 9 III Lerøy at a glance 19 IV
Q November 9th. Lerøy Seafood Group ASA. CEO Henning Beltestad CFO Sjur S. Malm
 Q3 2017 November 9th Lerøy Seafood Group ASA CEO Henning Beltestad CFO Sjur S. Malm Agenda Highlights Key financial figures Outlook Q3 2017 EBIT before FV adj. NOK 861 million Harvest volume 46 024 GWT
Lerøy Seafood Group. 3 rd quarterly report November 28 th. Ole-Eirik Lerøy CEO. Helge Singelstad CFO
 Lerøy Seafood Group 3 rd quarterly report 2003 November 28 th Ole-Eirik Lerøy CEO Helge Singelstad CFO Agenda 1. 1 Considerations 2. 2 Key financial figures Q3 2003 3. 3 Lerøy at a glance 4. 4 Lerøy Seafood
Q August 24th. Lerøy Seafood Group ASA. CEO Henning Beltestad CFO Sjur S. Malm
 Q2 2017 August 24th Lerøy Seafood Group ASA CEO Henning Beltestad CFO Sjur S. Malm Agenda Highlights Key financial figures Outlook Q2 2017 EBIT before FV adj. NOK 801 million Harvest volume 26 156 GWT
Q NOVEMBER 8TH 2018
 Q3 2018 NOVEMBER 8TH 2018 1. Highlights 2. Key Financial Figures 3. Outlook Highlights Klikke for å legge til annet bilde Q3 2018 - EBIT before FV adj. NOK 660 million - Harvest volume 37 227 GWT - EBIT/kg
Q MAY 8TH 2018
 Q1 2018 MAY 8TH 2018 1. Highlights 2. Key Financial Figures 3. Outlook Highlights Klikke for å legge til annet bilde Q1 2018 - EBIT beforefv adj. NOK 960 million - Harvest volume 37576 GWT - EBIT/kg all
Lerøy Seafood Group 3 rd quarter 2002
 Lerøy Seafood Group 3 rd quarter 2002 Contents Sections Page I Considerations 3 II Key financial figures Q3 2002 6 III Lerøy at a glance 12 IV Lerøy Seafood Group - Company profile 17 V Market glance 28
Lerøy Seafood Group 1 st half 2002
 Lerøy Seafood Group 1 st half 2002 Contents Sections Page I Considerations 3 II Key financial figures Q2 2002 6 III Lerøy at a glance 12 IV Lerøy Seafood Group - Company profile 17 V Market glance 29 Internal
Third quarter report Quarterly report. Nr
 Third quarter report 2008 Quarterly report Nr 3 2008 Highlights Operating revenue in 3Q was 207 MNOK which is lower than same period last year. The period s EBITDA was 18.1 MNOK Operating revenue year
 - - - - - - - 20 000 15 000 10 000 5 000 0 2017 2014 2013 2012 2011 2010 2009 2008 2007 2006 2005 2004 2003 2002 2001 2000 1999 1995 1 400 30 1 200 25 1 000 800 600 400 777 20 15 10 16,5 200 5 0 0 Q4/17
Q1 Financial Presentation. Arne Møgster CEO Britt K. Drivenes - CFO
 Q1 Financial Presentation Arne Møgster CEO Britt K. Drivenes - CFO As a globally integrated pelagic fishery and seafood specialist, (AUSS) operates through subsidiaries and associated companies, fishing
To 31 MARCH 2013 INTERIM REPORT. Kvartalsrapport 1. kvartal 2013 TTS GROUP ASA
 To 31 MARCH 2013 INTERIM REPORT Kvartalsrapport 1. kvartal 2013 TTS GROUP ASA HIGHLIGHTS 1 ST QUARTER 2013. Main highlights for the quarter was as follows; EPS for the quarter was NOK 0.10. Turnover in
PRESENTATION Q Oslo, 19 February 2013 John Binde, CEO Ola Loe, CFO
 PRESENTATION Q4 2012 Oslo, 19 February 2013 John Binde, CEO Ola Loe, CFO AGENDA: Highlights for the period Segment information Group financials Outlook 2 Highlights in Q4 2012: Significant improvement
Lerøy Seafood Group SEPTEMBER 2018
 Lerøy Seafood Group SEPTEMBER 2018 1. Lerøy Seafood Group 2. Key market trends supply and demand Our vision To be the leading and most profitable global supplier of sustainable high-quality seafood History
Presentation of Cermaq
 Presentation of Cermaq North Atlantic Seafood Seminar Oslo, 8 th March 2012 Agenda Introduction to Cermaq Key results 2011 Focus on Mainstream Chile Outlook 2012 Photograph: Alf Børjesson 2 This is Cermaq
PRESENTATION Q Oslo, 14 November 2012 John Binde, CEO Ola Loe, CFO
 PRESENTATION Q3 2012 Oslo, 14 November 2012 John Binde, CEO Ola Loe, CFO AGENDA: Highlights for the period Segment information Group financials Outlook 2 Highlights in Q3 2012: Strong consumption growth
3Q 2007 presentation 7 November 2007
 The global leader in aquaculture technology 3Q 2007 presentation 7 November 2007 Knut Molaug, CEO Rolf Andersen, CFO Pro-forma Please note that unless otherwise stated all comments in this presentation
SalMar ASA. Presentation Q CEO Yngve Myhre, CFO Trond Tuvstein Oslo, 14 November w w w. s a l m a r. n o
 Presentation Q3 2013 SalMar ASA CEO Yngve Myhre, CFO Trond Tuvstein Oslo, 14 November 2013 2 Agenda Highlights Financial update Operational update Market and outlook Third quarter highlights Another strong
SalMar ASA. Presentation Q CEO Olav-Andreas Ervik CFO Trond Tuvstein
 SalMar ASA Presentation Q1 2018 CEO Olav-Andreas Ervik CFO Trond Tuvstein Olav-Andreas Ervik new CEO of SalMar 41 years, from Frøya More than 20 years of experience from the aquaculture industry Worked
Financial Report Q FINANCIAL REPORT Q1 2010
 Financial Report Q4 2010 FINANCIAL REPORT Q1 2010 Austevoll Seafood ASA 0 Interim Report Q4 2010 Fourth quarter also achieved record-high operating result Good market and good prices for salmon and trout
PRESENTATION Q Oslo, 26 February 2014 John Binde, CEO Ola Loe, CFO
 PRESENTATION Q4 2013 Oslo, 26 February 2014 John Binde, CEO Ola Loe, CFO AGENDA: Highlights for the period Segment information Group financials Outlook 2 Highlights in Q4 2013: The best quarterly and yearly
Q1 presentation. Presented by Arne Møgster - CEO Britt Drivenes - CFO
 Q1 presentation Presented by Arne Møgster - CEO Britt Drivenes - CFO Disclaimer This Presentation has been produced by Austevoll Seafood ASA (the Company or Austevoll ) solely for use at the presentation
Events after balance sheet date
 Austevoll Seafood ASA 0 Financial Report Q4 2011 Successful second fishing season for anchoveta in Peru A positive result recorded for fish farming, sale and distribution, in difficult conditions Seasonally,
Q Financial presentation. CEO - Arne Møgster CFO - Britt Kathrine Drivenes
 Q2 2018 Financial presentation CEO - Arne Møgster CFO - Britt Kathrine Drivenes Highlights All figures in NOK 1,000 Q2 2018 Q2 2017 H1 2018 H1 2017 2017 Revenue 6 001 380 5 019 195 11 754 529 11 094 149
Q Financial presentation. Arne Møgster CEO Britt Kathrine Drivenes CFO
 Q2 2015 Financial presentation Arne Møgster CEO Britt Kathrine Drivenes CFO Highlights All figures in NOK 1,000 Q2 2015 (restated) Q2 2014 H1 2015 (restated) H1 2014 2014 Revenue 4 107 801 3 606 154 7
Q Financial presentation. Arne Møgster CEO Britt Kathrine Drivenes CFO
 Q1 2018 Financial presentation Arne Møgster CEO Britt Kathrine Drivenes CFO Highlights All figures in MNOK Q1 2018 Q1 2017 2017 Revenue 5 753 6 075 20 799 EBITDA* 1 445 1 555 4 747 EBIT* 1 217 1 331 3
Austevoll Seafood ASA Q1 2009
 Q1 2009 Ole Rasmus Møgster Chairman Britt Kathrine Drivenes CFO Disclaimer This Presentation has been produced by (the Company or Austevoll ) solely for use at the presentation to the market held in connection
Q Financial presentation. Arne Møgster CEO Britt Kathrine Drivenes CFO
 Q4 2013 Financial presentation Arne Møgster CEO Britt Kathrine Drivenes CFO Highlights Q4 2013 All figures in NOK 1.000 Q4 2013 Q4 2012 2013 2012 Revenue 3 623 526 2 731 852 12 409 756 11 170 879 EBITDA
PRESENTATION Q Oslo, 15 August 2013 John Binde, CEO Ola Loe, CFO
 PRESENTATION Q2 2013 Oslo, 15 August 2013 John Binde, CEO Ola Loe, CFO AGENDA: Highlights for the period Segment information Group financials Outlook 2 Highlights in Q2 2013: Best quarterly operational
RS Platou Markets. Seafood conference. 10th June 2010
 RS Platou Markets Seafood conference 10th June 2010 Agenda Introduction to Cermaq Highlights Q1 2010 and outlook full year Chile Recovery 2 Overview of Cermaq One of the global leaders in the aquaculture
Q BAKKAFROST GROUP Oslo 20 February 2018
 BAKKAFROST GROUP Oslo 20 February 2018 DISCLAIMER This presentation includes statements regarding future results, which are subject to risks and uncertainties. Consequently, actual results may differ significantly
RESULTATREGNSKAP ~ PROFIT & LOSS ACCOUNT. 2. kv kv. 98 (NOK 1 000)
") STATEMENT FIRST HALF YEAR 1998 The Norwegian newspapers and TV channels are still benefiting from the strong Norwegian economy while Aftonbladet is gaining market share in the Swedish advertising market.
STATEMENT FIRST HALF YEAR 1998 The Norwegian newspapers and TV channels are still benefiting from the strong Norwegian economy while Aftonbladet is gaining market share in the Swedish advertising market.
Marine Harvest. Q Presentation 1 November 2017
 Marine Harvest 1 Q3 2017 Presentation 1 November 2017 Forward looking statements This presentation may be deemed to include forward-looking statements, such as statements that relate to Marine Harvest
SalMar ASA. Presentation Q CEO Leif Inge Nordhammer CFO Trond Tuvstein
 SalMar ASA Presentation Q1 2015 CEO Leif Inge Nordhammer CFO Trond Tuvstein Agenda Highlights Financial update Operational update Outlook First quarter 2015 highlights Improved operations Challenging biological
Q BAKKAFROST GROUP Oslo 21 August 2018
 BAKKAFROST GROUP Oslo 21 August DISCLAIMER This presentation includes statements regarding future results, which are subject to risks and uncertainties. Consequently, actual results may differ significantly
Q Financial presentation. Arne Møgster CEO Britt Kathrine Drivenes CFO
 Q4 2014 Financial presentation Arne Møgster CEO Britt Kathrine Drivenes CFO Highlights All figures in NOK 1,000 Q4 2014 Q4 2013 (restated) 2014 2013 (restated) Revenue 3 704 689 3 725 710 14 344 177 12
Grieg Seafood ASA. griegseafood.com. Andreas Kvame CEO. Atle Harald Sandtorv CFO. 8 November 2017
 Grieg Seafood ASA Andreas Kvame CEO Atle Harald Sandtorv CFO 8 November 2017 1 Agenda Highlights This is Grieg Seafood Business Units (Regions) Financials Outlook 2 Highlights Q3 2017 Improved results
All figures in NOK 1,000 Q3 11 Q3 10 Sept. 30, 2011 Sept. 30,
 Austevoll Seafood ASA 0 INTERIM REPORT Q3 2011 Significant reduction in interest-bearing liabilities in the quarter Third quarter is low season for production of pelagic fish in Europe and South America
Austevoll Seafood ASA Q2 2009
 Q2 2009 Arne MøgsterM CEO Britt Kathrine Drivenes CFO Disclaimer This Presentation has been produced by (the Company or Austevoll ) solely for use at the presentation to the market held in connection with
Marine Harvest. Q Presentation 10 May 2017
 Marine Harvest Q1 2017 Presentation 10 May 2017 1 Forward looking statements This presentation may be deemed to include forward-looking statements, such as statements that relate to Marine Harvest s contracted
Presentatio. on Q3 2010
 Presentatio on Q3 2010 CEO Regin Jacobsen CFO Teitur Samuelsen Oslo November 9 th 2010 Disclaimer This presentation includes statements regarding future results, which are subject to risks and uncertainties.
Marine Harvest. Q Presentation 24 August 2017
 Marine Harvest Q2 2017 Presentation 24 August 2017 1 Forward looking statements This presentation may be deemed to include forward-looking statements, such as statements that relate to Marine Harvest s
NORWAY ROYA L S A L M ON PRESENTATION Q Oslo, 7 November 2017 Charles Høstlund, CEO Ola Loe, CFO 1
 PRESENTATION Q3 2017 Oslo, 7 November 2017 Charles Høstlund, CEO Ola Loe, CFO 1 AGENDA: Highlights for the period Segment information Group financials Markets Outlook 2 Highlights in Q3 2017 Operational
Austevoll Seafood ASA Q4 and Preliminary Figures 2010
 Q4 and Preliminary Figures 2010 Arne Møgster CEO Britt KathrineDrivenes CFO Disclaimer This Presentation has been produced by (the Company or Austevoll ) solely for use at the presentation to the market
Marine Harvest. Q Presentation 22 August 2018
 Marine Harvest Q2 2018 Presentation 22 August 2018 Forward looking statements This presentation may be deemed to include forward-looking statements, such as statements that relate to Marine Harvest s contracted
Financial report Q3 2014
 Financial report Q3 2014 Austevoll Seafood ASA Financial report Q3 2014 Index Key figures for the Group... 03 Q3 2014... 04 Operating segments... 04 Cash flows... 05 Financial information as of 30 September
Q Financial presentation. CEO - Arne Møgster CFO - Britt Kathrine Drivenes
 Q3 2018 Financial presentation CEO - Arne Møgster CFO - Britt Kathrine Drivenes Highlights All figures in MNOK Q3 2018 Q3 2017 YTD Q3 2018 YTD Q3 2017 2017 Revenue 5 317 4 903 17 072 15 997 20 799 EBITDA*
Marine Harvest. Q Presentation 14 February 2018
 Marine Harvest Q4 2017 Presentation 14 February 2018 1 Forward looking statements This presentation may be deemed to include forward-looking statements, such as statements that relate to Marine Harvest
THIRD QUARTER / 2018
 REPORT FOR THE THIRD QUARTER 2018 HIGHLIGHTS Operationally strong quarter, with cost improvements and good price achievement. Record-high volume for sales & processing with positive contribution Total
SalMar ASA First quarter
 SalMar ASA First quarter 2009 1 STRONG SALMON PRICES AND SATISFACTORY EARNINGS Strong salmon prices contributed to satisfactory earnings for the SalMar Group in the first quarter 2009. While Scottish Sea
Austevoll Seafood ASA Q3 2009
 Q3 2009 Arne MøgsterM CEO Britt Kathrine Drivenes CFO Disclaimer This Presentation has been produced by (the Company or Austevoll ) solely for use at the presentation to the market held in connection with
Interim Report Q2-18
 Interim Report Q2-18 HIGHLIGHTS Operational EBIT of NOK 181 million o Operational EBIT per kg of NOK 24.73 in Region North o Operational EBIT per kg of NOK 23.49 in Region South o Non-recurring item of
Marine Harvest Q Presentation
 Marine Harvest Q2 2015 Presentation Forward looking statements This presentation may be deemed to include forward-looking statements, such as statements that relate to Marine Harvest s contracted volumes,
Q BAKKAFROST GROUP Oslo 19 February 2019
 BAKKAFROST GROUP Oslo 19 February 2019 DISCLAIMER This presentation includes statements regarding future results, which are subject to risks and uncertainties. Consequently, actual results may differ significantly
Santiago, May 11 th, Results Presentation 1Q18
 Santiago, May 11 th, 2018 Results Presentation 1Q18 Agenda I. Highlights II. III. Financial Statements Supply, Demand and Prices IV. Farming Operation V. Prospects 2 Highlights EBIT 1Q18 USD 18.8 million
Q U A R T E R L Y R E P O R T 2 N D Q U A R T E R
 Q U A R T E R L Y R E P O R T 2 N D Q U A R T E R 2 0 0 7 1. Grieg Seafood develops as planned Grieg Seafood was listed in June, and has now 869 shareholders after 2 shares issues of MNOK 700 in total.
Weekly Salmon Outlook Week
 Week 10-20 Page 1 of 8 Harvest of Atlantic salmon in Norway continued to grow in week 9. The harvest volume (23 000 tonnes wfe) was up 1000 tonnes from the previous week and 3% higher than in the corresponding
Q Financial presentation. Arne Møgster CEO Britt Kathrine Drivenes CFO
 Q2 2017 Financial presentation Arne Møgster CEO Britt Kathrine Drivenes CFO Highlights All figures in NOK 1,000 Q2 2017 Q2 2016 H1 2017 H1 2016 2016 Revenue 5 019 195 4 558 229 11 094 149 8 970 468 18
4Q 2006 presentation 27. February 2007
 The global leader in aquaculture technology presentation 27. February 2007 Steven A. Morrell, Chairman of the Board Knut Molaug, CEO Rolf Andersen, CFO Agenda Background & highlights Financial review Status
Highlights for the quarter Q2 / EBIT NOK 60 million pre biomass write-down
 Half year report Highlights for the quarter EBIT NOK 60 million pre biomass write-down EBIT pre fair value and biomass write-down (NOK million) 318 348 300 101 60 Mainstream results negatively impacted
Q BAKKAFROST GROUP Glyvrar 20 May 2014
 Q1 014 BAKKAFROST GROUP Glyvrar 0 May 014 DISCLAIMER This presentation includes statements regarding future results, which are subject to risks and uncertainties. Consequently, actual results may differ
Registrert revisor og cand.philol Leder Samfunnsøkonomisk Fanny Voldnes enhet i Certified Public Accountant, Cand.philol.
 How new accounting rules have influence on society Making Fanny Transparency Voldnes Possible Oslo, 16h February 2018 Registrert revisor og cand.philol Leder Samfunnsøkonomisk Fanny Voldnes enhet i Certified
Questions - Fishpool seminar Bergen
 Questions - Fishpool seminar Bergen Paul Aandahl, Seafood Analyst, Norwegian Seafood Council 22.11.2018 Global supply Global Trade Estimates Atlantic Salmon Volume wfe Value 2 000 000 1 800 000 1 600 000
Interim report Third quarter of 2013
 Interim report Third quarter of 2013 Main features of the third quarter: Continuing high level of activity in the fixed income market Two equity listings approved in Q3, seven so far in 2013 Currently
Operating revenue NOK million Operational EBIT NOK million. Harvest volume (HOG) tonnes Q3 09 Q4 09 Q1 10 Q2 10 Q3 10
 tonnes Q3 09 Q4 09 Q1 10 Q2 10 Q3 10") Solid performance in a strong market Strong price achievement and solid results in Norway Return on Capital Employed of 18.9% in the quarter Favourable market balance expected to support a strong market
Solid performance in a strong market Strong price achievement and solid results in Norway Return on Capital Employed of 18.9% in the quarter Favourable market balance expected to support a strong market
Oslo Børs Holding ASA first quarter 2006
 Oslo Børs Holding ASA first quarter 2006 First quarter highlights: Fifth quarter in a row with record level of trading activity Operating revenues: NOK 117.2 (79.0) million Operating profit: NOK 68.3 (37.0)
Cermaq ASA Presentation for Pareto Securities Oslo, 14 th June 2012
 Cermaq ASA Presentation for Pareto Securities Oslo, 14 th June 2012 1 2020 2015 2010 2005 2000 1995 1990 1985 1980 1975 1970 1965 1960 1955 1950 Aquaculture: a sustainable growth industry Our growing population