Lerøy Seafood Group. Quarterly report First quarter May 13 th. Ole-Eirik Lerøy CEO Helge Singelstad CFO
|
|
|
- Gervase McBride
- 5 years ago
- Views:
Transcription

1 Lerøy Seafood Group Quarterly report First quarter 2004 May 13 th Ole-Eirik Lerøy CEO Helge Singelstad CFO
2 Agenda 1. 1 Considerations 2. 2 Key financial figures Q Lerøy at a glance 4. 4 Lerøy Seafood Group Company profile 5. 5 Market glance
3 Internal considerations 1.st Quarter 2004 Main figures All figures in mill NOK Q1-04 Q1-03 Change Turnover ,4% Operating profit ,7% Affiliated companies ,4% Pre-tax profit ,0% 55 40
4 Internal considerations 1.st Quarter 2004 Financially Solid Share issue 4th December 2003, NOK 86,4 mill ( shares) Well positioned for future organic and strategic growth Proposed dividend for 2003 NOK 0,60 per share (Ex dividend 26. May 2004) Appr shareholders per 7. May 2004 Increasing number of shareholders Ferd Private Equity sold shares in Q (rest 9,53%) Sparebanken Midt Norge sold all its shares ( ) in Q Considerably improved liquidity traded shares Consolidated Satisfactory operations in most areas in Q Still focus on operations and synergies Lerøy Midnor AS well integrated Affiliated companies Improved, but still difficult market situation
5 External considerations 1st Quarter 2004 Improved salmon and trout prices Prices increased in Q1 Prices in Q1 04 higher than comparable figures in Q1 03 and Q4 03 Higher prices needed Prices so far in Q2 04 higher than comparable prices in Q2 03, but uncertainty in price development Weakened financial and operational performances throughout the industry Enhances restructuring Consolidation Increased market orientation Still difficult market situation in both pelagic and white fish sectors Currencies Future will bring great volatility
6 External considerations 1st Quarter 2004 cont. Political issues / trade barriers Great uncertainty regarding regulation of future market access for non-eu producers Salmon-trout case Hear-says Safeguard measures Dumping? WTO
7 Yearly turnover LSG mill. NOK
8 Pre-tax earnings LSG mill. NOK
9 Quarterly turnover LSG mill. NOK kvt. 2. kvt. 3. kvt. 4.kvt.
10 Resultatregnskap / Income Statement Q1-04 Alle tall i NOK / All figures in NOK 1,000 Q Q Salgsinntekter / Operating revenues Vareforbruk / Cost of goods sold Lønn og andre personalkostnader / Salaries and other personnel expenses Andre driftskostnader / Other operating expenses Ordinære avskrivninger / Ordinary depreciation and amortization Driftsresultat / Operating profit Inntekt tilknyttet selskap / Income from affiliated companies Netto finansposter / Net financial items Resultat før skattekostnad / Profit before tax Beregnede skatter / Estimated taxation Periodens resultat / Profit for the period
11 Balanse / Balance Sheet Q1-04 Alle tall i NOK / All figures in NOK 1, Immaterielle eiendeler / Intangible assets Varige driftsmidler / Tangible fixed assets Finansielle anleggsmidler / Financial fixed assets Sum anleggsmidler / Total fixed assets Varer / Inventories Fordringer / Receivables Betalingsmidler / Cash and equivalents 1) Sum omløpsmidler / Total current assets Sum eiendeler / Total assets ) Tall som inngår i beregningen av netto rentebærende gjeld / Figures used in calculation of net interest bearing debt
12 Balanse / Balance Sheet Q1-04 forts./cont. Alle tall i NOK / All figures in NOK 1, Innskutt egenkapital / Equity contributions Opptjent egenkapital / Earned equity Minoritetsinteresser / Minority interests Sum egenkapital / Total equity Avsetning for forpliktelser / Accrued liabilities Langsiktig gjeld / Long-term liabilities 1) Kortsiktige kreditter / Short-term loans 1) Annen kortsiktig gjeld / Other short-term liabilities Sum gjeld / Total liabilities Sum egenkapital og gjeld / Total equity and liabilities ) Tall som inngår i beregningen av netto rentebærende gjeld / Figures used in calculation of net interest bearing debt
13 Key figures Lerøy Seafood Group Q1-04 Nøkkeltall / Key figures Q Q Resultatmargin / Profit margin 2,48 % 1,83 % 1,88 % Driftsmargin / Operating margin 3,26 % 2,87 % 2,89 % Resultat per aksje / Earnings per share 0,42 0,20 1,15 Utvannet resultat per aksje / Diluted earnings per share 0,42 0,20 1,15
14 Key figures Lerøy Seafood Group Q1-04 Nøkkeltall / Key figures Q Q Avkastning på sysselsatt kapital / ROCE 2) 9,66 % 8,22 % 9,55 % Egenkapitalandel / Equity ratio 48,77 % 57,83 % 44,01 % Netto rentebærende gjeld / Net interest bearing debt ) Tall som inngår i beregningen av netto rentebærende gjeld / Figures used in calculation of net interest bearing debt 2) Annualisert / Annualized Delårstall er ikke revidert / Ouartely figures have not been audited
15 Lerøy Seafood Group consolidated Q1-04 Lerøy Seafood Group s total equity is 806,9 mill NOK Subsidiaries share of group equity is 464,6 mill NOK Operating profit for YTD 2003 is 27,9 mill NOK
16 Affiliated companies Balance at Norskott Havbruk AS (50%) 154,7 mill 152,4 mill Hydrotech Gruppen AS (39%) 88,8 mill 98,3 mill Egersund Fisk AS (27%) 22,9 mill 21,7 mill Total Lerøy Seafood Group s total equity 266,4 mill 272,4 mill 806,9 mill 649,8 mill
17 Agenda 1. 1 Considerations 2. 2 Key financial figures Q Lerøy at a glance 4. 4 Lerøy Seafood Group Company profile 5. 5 Market glance
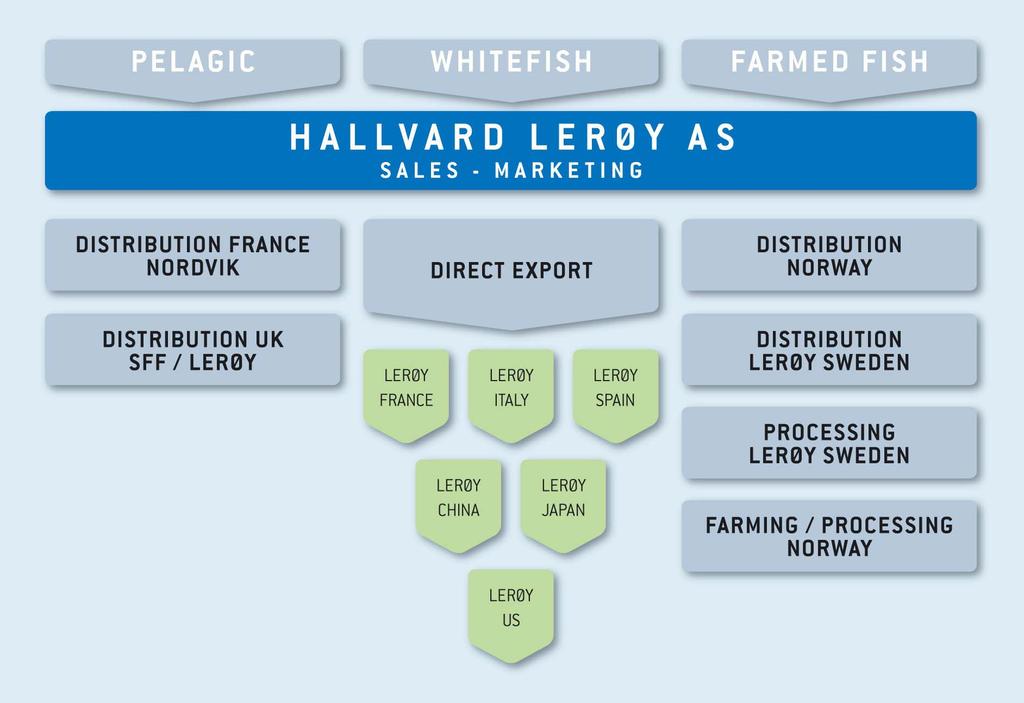
18 Lerøy Seafood Group Global distribution network Global distribution from Head Office in Bergen Local distribution and processing in Sweden Local representative offices in some key markets (France, Spain, Italy, Japan, China, USA)
19
20 Lerøy Seafood Group Norway s largest seafood exporter 9,1 % share of Norwegian Seafood total exports value 14,6 % of Norwegian salmon export in % of Norwegian value added salmon export Major shareholder in fish farming operations Lerøy Midnor AS (100%) Scottish Sea Farms (50%), 2 nd largest Scottish salmon producer Hydrotech-Gruppen AS (39%)

21 Lerøy Seafood Group Steady growth in operating profit and strong balance sheet Stable earnings despite turbulence in the sea food industry Growth potential within recently acquired businesses Satisfactory liquidity Professional and highly motivated employees Strong Partnerships / Network of alliances
22 Shareholders Shareholder No. of shares Ownership share Ole-Eirik Lerøy ,60 % Ferd Private Equity ,53 % Skagen Vekst ,30 % MP Pensjon ,82 % Knut Hallvard Lerøy ,64 % Hallvard Lerøy Jr ,46 % DnB ASA, Egenkapital Invester ,61 % Lime AS** ,77 % Gambak C/O ,45 % Sparebanken Rogaland ,44 % George Harald Lerøy ,36 % Pareto C/O ,31 % KOS Bergen AS ,18 % Inma AS** ,16 % Vital Forsikring ASA ,13 % SalMar AS ,12 % Delphi Norge ,11 % Firstnordic Norge VE ,10 % Sunnhordland Fjordbruk AS ,99 % Orkla Finans ,86 % Total 20 largest share owners ,97 % Others ,03 % Total shares ,00 % **controlled by CEO Ole-Eirik Lerøy The company has a total of sharholders.
23 Agenda 1. 1 Considerations 2. 2 Key financial figures Lerøy at a glance 4. 4 Lerøy Seafood Group Company profile 5. 5 Market glance
24 Lerøy Seafood Group ASA Sales & Distribution Production Lerøy Lerøy Sverige AB Sverige AB 80% 80% Hallvard Hallvard Lerøy Lerøy AS AS 100% 100% Nordvik SA Nordvik SA 80% 80% Lerøy Lerøy Smøgen Smøgen Seafood Seafood AB AB 100% 100% Lerøy Lerøy Midnor AS Midnor AS 100% 100% Sigerfjord Sigerfjord Aqua Aqua AS AS 90,55% 90,55% Sales and distribution in Sweden Strong position towards catering and supermarkets Sales and distribution ww Local representation: USA, France, Spain, Italy, UK, Japan, China Sales and distribution in France Strong position towards Hyper- and supermarkets Cold and hot smoked seafood products, salads and shellfish in brine. Production of Salmon, Salmon trout, Smolt Slaughtery and processing Production of Arctic char Affiliated Farming/other Norskott Norskott Havbruk Havbruk AS AS 50% 50% Hydrotech Hydrotech Gruppen Gruppen AS AS 39% 39% Egersund Egersund * * Fisk Fisk AS AS 27% 27% Hjaltland 11% Hjaltland 11% * Pelagic related activities

25 Lerøy Midnor AS
26 Description of Lerøy Midnor AS Production Smolt: 5 licenses 6 mill. smolt per year (salmon/trout) Farming: 26 licenses (salmon/trout) All production is located along the coast of Møre and Romsdal and Midt-Norge 2004E: gwt salmon gwt salmon trout Slaughtery: Capacity of 65 tonnes per shift 47% ownership in Uthaug lakseslakteri AS Processing: Capacity of appr t per year Production of skin and bone free portions and fillets Organisation: Competent and committed
27 Lerøy Midnor AS Results and balance NOK Q1-04 Revenues 107,5 EBITDA 15,8 EBIT 8,9 Pre tax 5,5 Volume (gwt) 4,7 Balance sheet Licences / Goodwill /def. Tax 62,4 Fixed assets 111,7 Inventories 202,0 Other current assets 47,6 Total assets 423,7 Equity 32,2 Debt 391,5 Total equity and debt 423,7 Net interest bearing debt 347,0 Company est. 11. July 2003
28 Lerøy Seafood Group Consolidated Key figures Total equity (48,77 %) 806,9 mill Net interest bearing debt 247,9 mill Total intangible assets Licences fish farming Norway Goodwill 270,1 mill 195,0 mill 75,1 mill Total LSG-shares:
29 Lerøy Seafood Group - Sales per market Q1-04 USA and Canada 8 % Norway 9 % Others 1 % Asia Pacific 16 % Western Europe 59 % Eastern Europe 7 %
30 Lerøy Seafood Group - Sales per product Q1-04 Shellfish Salmontrout 6 % Other/other species 6 % 3 % Pelagic fish 6 % White fish 12 % Whole salmon 44 % Processed salmon 25 %
31 Norskott Havbruk (Scottish Sea Farms Ltd.) Production capacity: gwt Volume harvested in 2003: gwt Est. harvest volume 2004: gwt Additional processing and sales: gwt 2 processing plants
 BRC SQS ISO 9002 ISO 14 001 Label Rouge Investor in")
32 Norskott Havbruk (Scottish Sea Farms Ltd.) BRC SQS ISO 9002 ISO Label Rouge Investor in people VIBES of Scotland
33 Norskott Havbruk NOKm Q Q Revenues 146,8 142,8 708,3 562,8 EBITDA 14,4 12,7 57,8 37,2 EBIT 6,3 5,5 28,2 7,9 Pre tax -0,8-0,8 2,1-20,9 Volumes (gwt) 4,9 5,2 24,0 19 Balance sheet **) *) Licences, Goodwill 374,5 375,9 Fixed assets 89,1 90,8 Inventories 332,5 323,5 Other current assets 76,8 112,6 Cash 0,8 7,9 Total assets 873,7 910,7 Equity 311,0 315,5 Interest bearing debt ,7 Non interest bearing debt 101,7 122,5 Total equity and debt 873,7 910,7 *) NOK/GBP = 11,89 **) NOK/GBP = 12,60
 Smolt production: appr.")
34 Hydrotech Gruppen AS (39%) Ownership 39% owned by Lerøy Seafood Group ASA 57.3% owned by L & K Karlsen Holding AS 3.7% owned by others Fish farms in Norway 17 wholly owned licenses Estimated sales 2004: Salmon and trout estimated : 12 gwt (14 gwt) Smolt production: appr. 5 mill Well-boat shipping co. Processing plant
35 Hydrotech Gruppen NOK Q Q * Revenues 60,1 84,8 381,6 349,0 EBITDA 3,8-3,8-11,1 25,7 EBIT -0,9-8,5-33,0 6,5 Pre tax -3,7-14,9-50,6 3,7 Volumes (gwt) 2,6 14 Balance sheet Licences / Goodwill 139,9 140,6 Fixed assets 161,1 173,5 Inventories 137,3 195,0 Other current assets 17,1 42,3 Total assets 455,4 551,4 Equity 118,7 117,0 Debt 336,7 434,5 Total equity and debt 455,4 551,5 Net interest bearing debt 266,0 343,8 * Including gain on sale of assets appr. 25 mill

36 Egersund Fisk AS (27%) Shareholder structure Lerøy 27% SalMar 27% Egersund Fiskeriinvestering 9% Others 37% (less than 4% each) Pelagic activity Fish oil, fish meal Pelagic fish for consumption Ownership in vessels for wild catch Production of ice Part ownership acquired in 2001 Egersund Fisk 100% Q1-04 Q1-03 Turnover 86,9 84,0 EBIT 1,0-1,2 Pre tax profits 0,5-2,6
37 Agenda 1. 1 Considerations 2. 2 Key financial figures Q Lerøy at a glance 4. 4 Lerøy Seafood Group Company profile 5. 5 Market glance
38 Fresh Atlantic Salmon Norway (4-5 kgs) price development YTD (FHL/NSL) NOK / Kg 45,00 40,00 35,00 30,00 25,00 20,00 15,00 10,00 5,00 0, Source: FHL/NSL

39 W W W Salmon export from Norway as of week Fresh atlantic salmon, cross-section, FCA Oslo. NOK / kg Oslo Q ,00 W W W W W 4-02 W 8-02 W W W W W W W W W W W W 4-03 W 8-03 W W W W W W W W W W W W 4-04 W ,00 24,00 22,00 20,00 18,00 16,00 14,00 Aver. 17,24 Source: FHL/NSL Q1-02 Aver. 18,04 Q2-02 Aver. 21,77 Q3-02 Aver. 20,16 Q4-02 Aver. 20,76 Q1-03 Aver. 20,42 Q2-03 Aver. 18,92 Q3-03 Aver. 18,09 Q4-03 Aver. 20,35 Q1-04 Aver. 22,38 Q2-04 Aver 24,28
40 Atlantic salmon supply side SUPPLY. Change Change E 03-04E Norway ,2 % % Chile ,7 % % UK ,6 % % Canada ,9 % % Faroe Islands ,6 % % Ireland ,5 % % USA ,9 % % Others ,1 % % In total ,0 % ,9 % Figures per Source: Kontali/SSPO/HL
41 Atlantic salmon demand side DEMAND Change Change EU - 15 USA Japan Others % 6 % -23 % 6 % 2004 E E 5 % 3 % 10 % 20 % In total % % Figures per Source: Kontali / HL
42 Drivers Q Norway EU ( mt) + 16,3 % Norway Eastern Europe ( mt) + 63,8 % Norway - Japan ( mt) + 23,5 % Norway - Feed sales (week 17) ( mt) + 5,3 % Norway Biomass of Atlantic Salmon - 7,0 %
Lerøy Seafood Group. Quarterly report Second quarter August 26 th. Ole-Eirik Lerøy CEO Helge Singelstad CFO
 Lerøy Seafood Group Quarterly report Second quarter 2004 August 26 th Ole-Eirik Lerøy CEO Helge Singelstad CFO Agenda 1. 1 Considerations 2. 2 Key financial figures Q2 2004 3. 3 Lerøy at a glance 4. 4
Lerøy Seafood Group. Preliminary report February 26 th. Ole-Eirik Lerøy CEO. Helge Singelstad CFO
 Lerøy Seafood Group Preliminary report 2003 February 26 th Ole-Eirik Lerøy CEO Helge Singelstad CFO Agenda 1. 1 Considerations 2. 2 Key financial figures 2003 3. 3 Lerøy at a glance 4. 4 Lerøy Seafood
Lerøy Seafood Group Preliminary financial figures 2004 February 24th 2005 Ole-Eirik Lerøy President & CEO Helge Singelstad Vice president & vice CEO
 Lerøy Seafood Group Preliminary financial figures 2004 February 24 th 2005 Ole-Eirik Lerøy President & CEO Helge Singelstad Vice president & vice CEO Agenda 1. 1 Considerations 2. 2 Preliminary key financial
Lerøy Seafood Group. Quarterly report Third quarter November 25 th. Ole-Eirik Lerøy CEO Helge Singelstad CFO
 Lerøy Seafood Group Quarterly report Third quarter 2004 November 25 th Ole-Eirik Lerøy CEO Helge Singelstad CFO Agenda 1. 1 Considerations 2. 2 Key financial figures Q3 2004 3. 3 Lerøy at a glance 4. 4
Lerøy Seafood Group. Quarterly report 2nd Quarter August 12 th Ole-Eirik Lerøy President & CEO Helge Singelstad Vice president & vice CEO
 Lerøy Seafood Group Quarterly report 2nd Quarter 2005 August 12 th 2005 Ole-Eirik Lerøy President & CEO Helge Singelstad Vice president & vice CEO Agenda 1. 1 Considerations 2. 2 Key financial figures
Lerøy Seafood Group. 2 nd quarterly report August 28 th. Ole-Eirik Lerøy CEO. Helge Singelstad CFO
 Lerøy Seafood Group 2 nd quarterly report 2003 August 28 th Ole-Eirik Lerøy CEO Helge Singelstad CFO Agenda 1. 1 Considerations 2. 2 Key financial figures Q2 2003 3. 3 Lerøy at a glance 4. 4 Lerøy Seafood
Lerøy Seafood Group. Quarterly report First quarter May 13 th Ole-Eirik Lerøy President & CEO Helge Singelstad Vice president & vice CEO
 Lerøy Seafood Group Quarterly report First quarter 2005 May 13 th 2005 Ole-Eirik Lerøy President & CEO Helge Singelstad Vice president & vice CEO Agenda 1. Considerations 1 2. 2 Key financial figures Q1
Lerøy Seafood Group. 1 st quarterly report May 15 th. Ole-Eirik Lerøy CEO. Helge Singelstad CFO
 Lerøy Seafood Group 1 st quarterly report 2003 May 15 th Ole-Eirik Lerøy CEO Helge Singelstad CFO Contents Sections Page I Considerations 3 II Key financial figures Q1 2003 9 III Lerøy at a glance 19 IV
Lerøy Seafood Group. 3 rd quarterly report November 28 th. Ole-Eirik Lerøy CEO. Helge Singelstad CFO
 Lerøy Seafood Group 3 rd quarterly report 2003 November 28 th Ole-Eirik Lerøy CEO Helge Singelstad CFO Agenda 1. 1 Considerations 2. 2 Key financial figures Q3 2003 3. 3 Lerøy at a glance 4. 4 Lerøy Seafood
Lerøy Seafood Group Preliminary report
 Lerøy Seafood Group Preliminary report 2002 27.02.2003 Contents Sections Page I Considerations 3 II Preliminary key financial figures 2002 6 III Lerøy at a glance 17 IV Lerøy Seafood Group - Company profile
Lerøy Seafood Group Quarterly report 3rd Quarter 2005 November 10th 2005 Ole-Eirik Lerøy President & CEO Helge Singelstad Vice president & vice CEO
 Lerøy Seafood Group Quarterly report 3rd Quarter 2005 November 10 th 2005 Ole-Eirik Lerøy President & CEO Helge Singelstad Vice president & vice CEO Agenda 1. 1 Considerations 2. 2 Key financial figures
Lerøy Seafood Group Quarterly report First quarter 2006 May 15th 2006 Ole-Eirik Lerøy President & CEO Helge Singelstad Vice president & vice CEO
 Lerøy Seafood Group Quarterly report First quarter 2006 May 15 th 2006 Ole-Eirik Lerøy President & CEO Helge Singelstad Vice president & vice CEO Agenda 1. 1 Considerations 2. 2 Key financial figures Q1
Lerøy Seafood Group. Preliminary financial figures February 24 th Ole-Eirik Lerøy. Helge Singelstad. President & CEO
 Lerøy Seafood Group Preliminary financial figures 2005 February 24 th 2006 Ole-Eirik Lerøy President & CEO Helge Singelstad Vice president & vice CEO Agenda 1. 1 Considerations 2. 2 Preliminary financial
Lerøy Seafood Group 3 rd quarter 2002
 Lerøy Seafood Group 3 rd quarter 2002 Contents Sections Page I Considerations 3 II Key financial figures Q3 2002 6 III Lerøy at a glance 12 IV Lerøy Seafood Group - Company profile 17 V Market glance 28
Lerøy Seafood Group 1 st half 2002
 Lerøy Seafood Group 1 st half 2002 Contents Sections Page I Considerations 3 II Key financial figures Q2 2002 6 III Lerøy at a glance 12 IV Lerøy Seafood Group - Company profile 17 V Market glance 29 Internal
Lerøy Seafood Group. Quarterly report Third quarter November 1 st Ole-Eirik Lerøy. Helge Singelstad. President & CEO
 Seafood Group Quarterly report Third quarter 2006 November 1 st 2006 Ole-Eirik President & CEO Helge Singelstad Vice president & vice CEO Agenda 1. 1 Considerations 2. 2 Key financial figures Q3 2006 3.
i figures 2007 February 26 th 2008 Ole-Eirik Lerøy President & CEO
 Lerøy Seafood Group Preliminary i financial i figures 2007 February 26 th 2008 Ole-Eirik Lerøy President & CEO Agenda 1. 1 Considerations 2. 2 Key financial i figures Q4 2007 3. Lerøy at a glance 4. 4
Lerøy Seafood Group. Preliminary financial figures February 26 th Ole-Eirik Lerøy. Helge Singelstad. President & CEO
 Seafood Group Preliminary financial figures 2006 February 26 th 2007 Ole-Eirik President & CEO Helge Singelstad Vice president & vice CEO Agenda 1. 1 Considerations 2. 2 Preliminary financial figures 2006
Lerøy Seafood Group. Quarterly report First quarter May 8 th Ole-Eirik Lerøy. Ivan Vindheim. President & CEO CFO
 Seafood Group Quarterly report First quarter 2008 May 8 th 2008 Ole-Eirik President & CEO Ivan Vindheim CFO Agenda 1. 1 Considerations 2. 2 Key financial figures Q1 2008 3. 3 at a glance 4. 4 Market glance
Lerøy Seafood Group. Quarterly report First quarter May 12th Helge Singelstad. Ivan Vindheim CEO CFO
 Lerøy Seafood Group Quarterly report First quarter 2009 May 12th 2009 Helge Singelstad CEO Ivan Vindheim CFO Agenda 1. 1 Considerations 2. 2 Key financial figures Q1 2009 3. 3 Lerøy at a glance 4. 4 Market
Lerøy Seafood Group. Quarterly report Second quarter August 12 th Ole-Eirik Lerøy. Ivan Vindheim. President & CEO CFO
 Seafood Group Quarterly report Second quarter 2008 August 12 th 2008 Ole-Eirik President & CEO Ivan Vindheim CFO Agenda 1. 1 Considerations 2. 2 Key financial figures Q2 2008 3. 3 at a glance 4. 4 Market
i figures 2008 February 26 th 2009 Helge Singelstad Ivan Vindheim
 Lerøy Seafood Group Preliminary i financial i figures 2008 February 26 th 2009 Helge Singelstad CEO Ivan Vindheim CFO Agenda 1. 1 Considerations 2. 2 Key financial i figures Q4 2008 3. Lerøy at a glance
Lerøy Seafood Group. Quarterly report Third quarter November 4 th Ole-Eirik Lerøy. Ivan Vindheim. President & CEO CFO
 Seafood Group Quarterly report Third quarter 2008 November 4 th 2008 Ole-Eirik President & CEO Ivan Vindheim CFO Agenda 1. 1 Considerations 2. 2 Key financial figures Q3 2008 3. 3 at a glance 4. 4 Market
Lerøy Seafood Group. Quarterly report Second quarter August 19th Helge Singelstad. Ivan Vindheim CEO CFO
 Lerøy Seafood Group Quarterly report Second quarter 2009 August 19th 2009 Helge Singelstad CEO Ivan Vindheim CFO 1 Agenda 1. 1 Considerations 2. 2 Key financial figures Q2 2009 3. 3 Lerøy at a glance 4.
LERØY SEAFOOD GROUP. Quarterly report Third quarter 2010 November 4th Henning Beltestad. Ivan Vindheim CEO CFO
 LERØY SEAFOOD GROUP Quarterly report Third quarter 2010 November 4th 2010 Henning Beltestad CEO Ivan Vindheim CFO 1 Agenda 1. 1 Considerations 2. 2 Key financial figures Q3 2010 3. 3 Lerøy at a glance
Lerøy Seafood Group. Preliminary financial figures February 25th Helge Singelstad. Alf-Helge Aarskog. Ivan Vindheim.
 Lerøy Seafood Group Preliminary financial figures 2009 February 25th 2010 Helge Singelstad Chairman Alf-Helge Aarskog CEO Ivan Vindheim CFO 1 Agenda 1. 1 Considerations 2. 2 Key financial figures Q4 2009
LERØY SEAFOOD GROUP. Quarterly report Second quarter August 18 th Henning Beltestad. Ivan Vindheim CEO CFO
 LERØY SEAFOOD GROUP Quarterly report Second quarter 2011 August 18 th 2011 Henning Beltestad CEO Ivan Vindheim CFO 1 1 Agenda 1. 1 Considerations 2. 2 Key financial figures Q2 2011 3. 3 Lerøy at a glance
LERØY SEAFOOD GROUP. Quarterly report Preliminary financial figures February 26 th Henning Beltestad. Sjur S.
 LERØY SEAFOOD GROUP Quarterly report Preliminary financial figures 2012 February 26 th 2013 Henning Beltestad CEO 1 Sjur S. Malm 1 CFO Agenda 1. 1 Considerations 2. 2 Key financial figures Q4 2012 3. 3
Lerøy Seafood Group. Quarterly report First quarter May 12th Helge Singelstad. Henning Beltestad. Ivan Vindheim.
 Lerøy Seafood Group Quarterly report First quarter 2010 May 12th 2010 Helge Singelstad Chairman Henning Beltestad CEO Ivan Vindheim CFO 1 Agenda 1. 1 Considerations 2. 2 Key financial figures Q1 2010 3.
LERØY SEAFOOD GROUP. First quarter May 15 th Henning Beltestad. Arne Vatne CEO. Group Chief Accountant
 LERØY SEAFOOD GROUP Quarterly report First quarter 2012 May 15 th 2012 Henning Beltestad CEO Arne Vatne Group Chief Accountant 1 1 Agenda 1. 1 Considerations 2. 2 Key financial figures Q1 2012 3. 3 Lerøy
LERØY SEAFOOD GROUP. Quarterly report Third quarter November 13 th Henning Beltestad. Sjur S. Malm CEO CFO
 LERØY SEAFOOD GROUP Quarterly report Third quarter 2013 November 13 th 2013 Henning Beltestad CEO Sjur S. Malm CFO 1 1 Agenda 1. 1 Considerations 2. 2 Key financial figures Q3 2013 3. 3 Market glance 4.
LERØY SEAFOOD GROUP. Quarterly report Preliminary financial figures February 25 th Henning Beltestad. Sjur S.
 LERØY SEAFOOD GROUP Quarterly report Preliminary financial figures 2013 February 25 th 2014 Henning Beltestad CEO Sjur S. Malm CFO 1 1 Agenda 1. 1 Considerations 2. 2 Key financial figures Q4 2013 3. 3
LERØY SEAFOOD GROUP. Quarterly report Second quarter August 23 rd Henning Beltestad. Arne Vatne CEO. Group Chief Accountant
 LERØY SEAFOOD GROUP Quarterly report Second quarter 2012 August 23 rd 2012 Henning Beltestad CEO Arne Vatne Group Chief Accountant 1 1 Agenda 1. 1 Considerations 2. 2 Key financial figures Q2 2012 3. 3
LERØY SEAFOOD GROUP. Quarterly report Second quarter August 22 th Henning Beltestad. Sjur S. Malm CEO CFO
 LERØY SEAFOOD GROUP Quarterly report Second quarter 2013 August 22 th 2013 Henning Beltestad CEO Sjur S. Malm CFO 1 1 Agenda 1. 1 Considerations 2. 2 Key financial figures Q2 2013 3. 3 Market glance 4.
LERØY SEAFOOD GROUP. Quarterly report Third quarter November 8 th Henning Beltestad. Ivan Vindheim CEO CFO
 LERØY SEAFOOD GROUP Quarterly report Third quarter 2011 November 8 th 2011 Henning Beltestad CEO Ivan Vindheim CFO 1 1 Agenda 1. 1 Considerations 2. 2 Key financial figures Q3 2011 3. 3 Lerøy at a glance
LERØY SEAFOOD GROUP. Preliminary financial figures February 23 rd Henning Beltestad. Ivan Vindheim CEO CFO
 LERØY SEAFOOD GROUP Preliminary financial figures 2010 February 23 rd 2011 Henning Beltestad CEO Ivan Vindheim CFO 1 1 Agenda 1. 1 Considerations 2. 2 Key financial figures Q4 2010 3. 3 Lerøy at a glance
Q May 12th Oslo
 Q1 2016 May 12th Oslo Lerøy Seafood Group ASA CEO Henning Beltestad CFO Sjur S. Malm Agenda Highlights Key financial figures Outlook Q1 2016 EBIT before FV adj. NOK 584.5 million EBIT/kg all inclusive
A N N U A L R E P O R T
 A N N U A L R E P O R T 2 0 0 4 CONTENT ANNUAL REPORT 2004 04 HISTORY 05 PRINCIPAL FIGURES & EVENTS 06 CORPORATE GOVERNANCE 09 KEY FIGURES AND GRAPHS 10 MANAGEMENT REPORT 18 REPORT OF THE BOARD OF DIRECTORS
Q November 9th. Lerøy Seafood Group ASA. CEO Henning Beltestad CFO Sjur S. Malm
 Q3 2017 November 9th Lerøy Seafood Group ASA CEO Henning Beltestad CFO Sjur S. Malm Agenda Highlights Key financial figures Outlook Q3 2017 EBIT before FV adj. NOK 861 million Harvest volume 46 024 GWT
Q August 24th. Lerøy Seafood Group ASA. CEO Henning Beltestad CFO Sjur S. Malm
 Q2 2017 August 24th Lerøy Seafood Group ASA CEO Henning Beltestad CFO Sjur S. Malm Agenda Highlights Key financial figures Outlook Q2 2017 EBIT before FV adj. NOK 801 million Harvest volume 26 156 GWT
Third quarter report Quarterly report. Nr
 Third quarter report 2008 Quarterly report Nr 3 2008 Highlights Operating revenue in 3Q was 207 MNOK which is lower than same period last year. The period s EBITDA was 18.1 MNOK Operating revenue year
A N N U A L R E P O R T
 A N N U A L R E P O R T 2 0 0 3 CONTENT ANNUAL REPORT 2003 04 HISTORY 05 PRINCIPAL FIGURES FROM INCOME STATEMENT 06 CORPORATE GOVERNANCE 09 KEY FIGURES AND GRAPHS 10 REPORT OF THE BOARD OF DIRECTORS FOR
Q NOVEMBER 8TH 2018
 Q3 2018 NOVEMBER 8TH 2018 1. Highlights 2. Key Financial Figures 3. Outlook Highlights Klikke for å legge til annet bilde Q3 2018 - EBIT before FV adj. NOK 660 million - Harvest volume 37 227 GWT - EBIT/kg
Q MAY 8TH 2018
 Q1 2018 MAY 8TH 2018 1. Highlights 2. Key Financial Figures 3. Outlook Highlights Klikke for å legge til annet bilde Q1 2018 - EBIT beforefv adj. NOK 960 million - Harvest volume 37576 GWT - EBIT/kg all
A N N U A L R E P O R T
 A N N U A L R E P O R T 2 0 0 5 ANNUAL REPORT 2005 05 HISTORY 07 Principal figures and strategic events 08 CORPORATE GOVERNANCE 11 Key figures and graphs 12 Management report 24 The Board of Directors
Lerøy Seafood Group SEPTEMBER 2018
 Lerøy Seafood Group SEPTEMBER 2018 1. Lerøy Seafood Group 2. Key market trends supply and demand Our vision To be the leading and most profitable global supplier of sustainable high-quality seafood History
To 31 MARCH 2013 INTERIM REPORT. Kvartalsrapport 1. kvartal 2013 TTS GROUP ASA
 To 31 MARCH 2013 INTERIM REPORT Kvartalsrapport 1. kvartal 2013 TTS GROUP ASA HIGHLIGHTS 1 ST QUARTER 2013. Main highlights for the quarter was as follows; EPS for the quarter was NOK 0.10. Turnover in
Austevoll Seafood ASA Q1 2009
 Q1 2009 Ole Rasmus Møgster Chairman Britt Kathrine Drivenes CFO Disclaimer This Presentation has been produced by (the Company or Austevoll ) solely for use at the presentation to the market held in connection
Q1 Financial Presentation. Arne Møgster CEO Britt K. Drivenes - CFO
 Q1 Financial Presentation Arne Møgster CEO Britt K. Drivenes - CFO As a globally integrated pelagic fishery and seafood specialist, (AUSS) operates through subsidiaries and associated companies, fishing
 - - - - - - - 20 000 15 000 10 000 5 000 0 2017 2014 2013 2012 2011 2010 2009 2008 2007 2006 2005 2004 2003 2002 2001 2000 1999 1995 1 400 30 1 200 25 1 000 800 600 400 777 20 15 10 16,5 200 5 0 0 Q4/17
Q Financial presentation. Arne Møgster CEO Britt Kathrine Drivenes CFO
 Q4 2013 Financial presentation Arne Møgster CEO Britt Kathrine Drivenes CFO Highlights Q4 2013 All figures in NOK 1.000 Q4 2013 Q4 2012 2013 2012 Revenue 3 623 526 2 731 852 12 409 756 11 170 879 EBITDA
Financial report Q3 2014
 Financial report Q3 2014 Austevoll Seafood ASA Financial report Q3 2014 Index Key figures for the Group... 03 Q3 2014... 04 Operating segments... 04 Cash flows... 05 Financial information as of 30 September
Q1 presentation. Presented by Arne Møgster - CEO Britt Drivenes - CFO
 Q1 presentation Presented by Arne Møgster - CEO Britt Drivenes - CFO Disclaimer This Presentation has been produced by Austevoll Seafood ASA (the Company or Austevoll ) solely for use at the presentation
SalMar ASA First quarter
 SalMar ASA First quarter 2009 1 STRONG SALMON PRICES AND SATISFACTORY EARNINGS Strong salmon prices contributed to satisfactory earnings for the SalMar Group in the first quarter 2009. While Scottish Sea
Presentation of Cermaq
 Presentation of Cermaq North Atlantic Seafood Seminar Oslo, 8 th March 2012 Agenda Introduction to Cermaq Key results 2011 Focus on Mainstream Chile Outlook 2012 Photograph: Alf Børjesson 2 This is Cermaq
RESULTATREGNSKAP ~ PROFIT & LOSS ACCOUNT. 2. kv kv. 98 (NOK 1 000)
") STATEMENT FIRST HALF YEAR 1998 The Norwegian newspapers and TV channels are still benefiting from the strong Norwegian economy while Aftonbladet is gaining market share in the Swedish advertising market.
STATEMENT FIRST HALF YEAR 1998 The Norwegian newspapers and TV channels are still benefiting from the strong Norwegian economy while Aftonbladet is gaining market share in the Swedish advertising market.
SalMar ASA. Presentation Q CEO Yngve Myhre, CFO Trond Tuvstein Oslo, 14 November w w w. s a l m a r. n o
 Presentation Q3 2013 SalMar ASA CEO Yngve Myhre, CFO Trond Tuvstein Oslo, 14 November 2013 2 Agenda Highlights Financial update Operational update Market and outlook Third quarter highlights Another strong
Austevoll Seafood ASA Q2 2009
 Q2 2009 Arne MøgsterM CEO Britt Kathrine Drivenes CFO Disclaimer This Presentation has been produced by (the Company or Austevoll ) solely for use at the presentation to the market held in connection with
Q Financial presentation. Arne Møgster CEO Britt Kathrine Drivenes CFO
 Q2 2015 Financial presentation Arne Møgster CEO Britt Kathrine Drivenes CFO Highlights All figures in NOK 1,000 Q2 2015 (restated) Q2 2014 H1 2015 (restated) H1 2014 2014 Revenue 4 107 801 3 606 154 7
Q Financial presentation. Arne Møgster CEO Britt Kathrine Drivenes CFO
 Q1 2018 Financial presentation Arne Møgster CEO Britt Kathrine Drivenes CFO Highlights All figures in MNOK Q1 2018 Q1 2017 2017 Revenue 5 753 6 075 20 799 EBITDA* 1 445 1 555 4 747 EBIT* 1 217 1 331 3
Q Financial presentation. CEO - Arne Møgster CFO - Britt Kathrine Drivenes
 Q2 2018 Financial presentation CEO - Arne Møgster CFO - Britt Kathrine Drivenes Highlights All figures in NOK 1,000 Q2 2018 Q2 2017 H1 2018 H1 2017 2017 Revenue 6 001 380 5 019 195 11 754 529 11 094 149
RS Platou Markets. Seafood conference. 10th June 2010
 RS Platou Markets Seafood conference 10th June 2010 Agenda Introduction to Cermaq Highlights Q1 2010 and outlook full year Chile Recovery 2 Overview of Cermaq One of the global leaders in the aquaculture
Q Financial presentation. CEO - Arne Møgster CFO - Britt Kathrine Drivenes
 Q3 2018 Financial presentation CEO - Arne Møgster CFO - Britt Kathrine Drivenes Highlights All figures in MNOK Q3 2018 Q3 2017 YTD Q3 2018 YTD Q3 2017 2017 Revenue 5 317 4 903 17 072 15 997 20 799 EBITDA*
Q Financial presentation. Arne Møgster CEO Britt Kathrine Drivenes CFO
 Q4 2014 Financial presentation Arne Møgster CEO Britt Kathrine Drivenes CFO Highlights All figures in NOK 1,000 Q4 2014 Q4 2013 (restated) 2014 2013 (restated) Revenue 3 704 689 3 725 710 14 344 177 12
3Q 2007 presentation 7 November 2007
 The global leader in aquaculture technology 3Q 2007 presentation 7 November 2007 Knut Molaug, CEO Rolf Andersen, CFO Pro-forma Please note that unless otherwise stated all comments in this presentation
Financial Report Q FINANCIAL REPORT Q1 2010
 Financial Report Q4 2010 FINANCIAL REPORT Q1 2010 Austevoll Seafood ASA 0 Interim Report Q4 2010 Fourth quarter also achieved record-high operating result Good market and good prices for salmon and trout
All figures in NOK 1,000 Q3 11 Q3 10 Sept. 30, 2011 Sept. 30,
 Austevoll Seafood ASA 0 INTERIM REPORT Q3 2011 Significant reduction in interest-bearing liabilities in the quarter Third quarter is low season for production of pelagic fish in Europe and South America
Austevoll Seafood ASA Q4 and Preliminary Figures 2010
 Q4 and Preliminary Figures 2010 Arne Møgster CEO Britt KathrineDrivenes CFO Disclaimer This Presentation has been produced by (the Company or Austevoll ) solely for use at the presentation to the market
Austevoll Seafood ASA Q3 2009
 Q3 2009 Arne MøgsterM CEO Britt Kathrine Drivenes CFO Disclaimer This Presentation has been produced by (the Company or Austevoll ) solely for use at the presentation to the market held in connection with
Highlights for the quarter Q2 / EBIT NOK 60 million pre biomass write-down
 Half year report Highlights for the quarter EBIT NOK 60 million pre biomass write-down EBIT pre fair value and biomass write-down (NOK million) 318 348 300 101 60 Mainstream results negatively impacted
4Q 2006 presentation 27. February 2007
 The global leader in aquaculture technology presentation 27. February 2007 Steven A. Morrell, Chairman of the Board Knut Molaug, CEO Rolf Andersen, CFO Agenda Background & highlights Financial review Status
AUSTEVOLL SEAFOOD ASA 4 th Quarter 2008
 AUSTEVOLL SEAFOOD ASA 4 th Quarter 2008 02.03.2009 Arne Møgster - CEO Britt Drivenes - CFO Agenda Overview of AUSS Key figures Q4 Market Outlook Q4 2008 Presentation - 2 Financial Highlights Result higlights
NORWAY ROYA L S A L M ON PRESENTATION Q Oslo, 7 November 2017 Charles Høstlund, CEO Ola Loe, CFO 1
 PRESENTATION Q3 2017 Oslo, 7 November 2017 Charles Høstlund, CEO Ola Loe, CFO 1 AGENDA: Highlights for the period Segment information Group financials Markets Outlook 2 Highlights in Q3 2017 Operational
Q Financial presentation. Arne Møgster CEO Britt Kathrine Drivenes CFO
 Q2 2017 Financial presentation Arne Møgster CEO Britt Kathrine Drivenes CFO Highlights All figures in NOK 1,000 Q2 2017 Q2 2016 H1 2017 H1 2016 2016 Revenue 5 019 195 4 558 229 11 094 149 8 970 468 18
FOURTH QUARTER / 2014
 SATISFACTORY RESULT DESPITE BIOLOGICAL CHALLENGES HIGHLIGHTS IN THE FOURTH QUARTER 2014 Good salmon prices and high harvested volume produced profit growth and record operating revenues. 50% of the harvested
Operating revenue NOK million Operational EBIT NOK million. Harvest volume (HOG) tonnes Q3 09 Q4 09 Q1 10 Q2 10 Q3 10
 tonnes Q3 09 Q4 09 Q1 10 Q2 10 Q3 10") Solid performance in a strong market Strong price achievement and solid results in Norway Return on Capital Employed of 18.9% in the quarter Favourable market balance expected to support a strong market
Solid performance in a strong market Strong price achievement and solid results in Norway Return on Capital Employed of 18.9% in the quarter Favourable market balance expected to support a strong market
Austevoll Seafood ASA
 Austevoll Seafood ASA Financial report Q2 and H1 2016 INDEX key figures for the group... 03 Q2 2016... 04 Operating segments... 04 Cash Flows, Q2 2016... 06 Financial information, H1 2016... 07 Cash Flow,
Events after balance sheet date
 Austevoll Seafood ASA 0 Financial Report Q4 2011 Successful second fishing season for anchoveta in Peru A positive result recorded for fish farming, sale and distribution, in difficult conditions Seasonally,
Grieg Seafood ASA. griegseafood.com. Andreas Kvame CEO. Atle Harald Sandtorv CFO. 8 November 2017
 Grieg Seafood ASA Andreas Kvame CEO Atle Harald Sandtorv CFO 8 November 2017 1 Agenda Highlights This is Grieg Seafood Business Units (Regions) Financials Outlook 2 Highlights Q3 2017 Improved results
Q U A R T E R L Y R E P O R T 2 N D Q U A R T E R
 Q U A R T E R L Y R E P O R T 2 N D Q U A R T E R 2 0 0 7 1. Grieg Seafood develops as planned Grieg Seafood was listed in June, and has now 869 shareholders after 2 shares issues of MNOK 700 in total.
Registrert revisor og cand.philol Leder Samfunnsøkonomisk Fanny Voldnes enhet i Certified Public Accountant, Cand.philol.
 How new accounting rules have influence on society Making Fanny Transparency Voldnes Possible Oslo, 16h February 2018 Registrert revisor og cand.philol Leder Samfunnsøkonomisk Fanny Voldnes enhet i Certified
Aker Seafoods Second quarter 2010 Profits improved in high season
 Aker Seafoods Second quarter 21 Profits improved in high season CEO Liv Monica B Stubholt CFO Gunnar Aasbø-Skinderhaug Welcome Agenda Topic Speaker Operational Update Liv Monica Stubholt, CEO Group Harvesting
Q Presentation. Oslo November 2 nd 2018 Hallvard Muri, CEO Simon Nyquist Martinsen, CFO
 Q3 218 Presentation Oslo November 2 nd 218 Hallvard Muri, CEO Simon Nyquist Martinsen, CFO Agenda Highlights Financial performance Outlook Q&A Highlights Q3 218 by CEO Hallvard Muri Order Intake development
Marine Harvest. Q Presentation 14 February 2018
 Marine Harvest Q4 2017 Presentation 14 February 2018 1 Forward looking statements This presentation may be deemed to include forward-looking statements, such as statements that relate to Marine Harvest
SalMar ASA. Presentation Q CEO Leif Inge Nordhammer CFO Trond Tuvstein
 SalMar ASA Presentation Q1 2015 CEO Leif Inge Nordhammer CFO Trond Tuvstein Agenda Highlights Financial update Operational update Outlook First quarter 2015 highlights Improved operations Challenging biological
Marine Harvest. Q Presentation 10 May 2017
 Marine Harvest Q1 2017 Presentation 10 May 2017 1 Forward looking statements This presentation may be deemed to include forward-looking statements, such as statements that relate to Marine Harvest s contracted
Austevoll Seafood ASA
 Austevoll Seafood ASA Financial Report Q3 2017 Index Key figures for the Group...03 Q3 2017...04 Operating segments...04 Cash flow Q3 2017...07 Financial factors at 30 September 2017...07 Cash flows at
Austevoll Seafood ASA
 Austevoll Seafood ASA Financial Report Q4 2016 and preliminary figures for 2016 INDEX Key figures for the group... 03 Q4 2016... 04 Operating segments... 04 Cash Flows Q4 2016... 06 Cash flows 2016...07
PRESENTATION Q Oslo, 26 February 2014 John Binde, CEO Ola Loe, CFO
 PRESENTATION Q4 2013 Oslo, 26 February 2014 John Binde, CEO Ola Loe, CFO AGENDA: Highlights for the period Segment information Group financials Outlook 2 Highlights in Q4 2013: The best quarterly and yearly
Third QUARTER / 2017
 STRONG OPERATIONS AND IMPROVING BIOLOGY HIGHLIGHTS IN THE THIRD QUARTER Strong operations and effective management of the improving biological situation Lower production costs and higher prices achieved
Aker Seafoods Second quarter 2009 Sales of fresh products up, but prices down
 Aker Seafoods Second quarter Sales of fresh products up, but prices down CEO Yngve Myhre CFO Gunnar Aasbø Interim presentation second quarter 1 Welcome Agenda Topic Operational Update Group Harvesting
Your Aquaculture Technology and Service Partner. Q Presentation Oslo - February 19 th, 2016 Trond Williksen, CEO Eirik Børve Monsen, CFO
 Q4 2015 Presentation Oslo - February 19 th, 2016 Trond Williksen, CEO Eirik Børve Monsen, CFO Agenda 1 Highlights 2 Financial performance 3 Outlook 4 Q&A Highlights Q4 2015 - by CEO Trond Williksen 3 MNOK
Cermaq ASA Presentation for Pareto Securities Oslo, 14 th June 2012
 Cermaq ASA Presentation for Pareto Securities Oslo, 14 th June 2012 1 2020 2015 2010 2005 2000 1995 1990 1985 1980 1975 1970 1965 1960 1955 1950 Aquaculture: a sustainable growth industry Our growing population
PRESENTATION Q Oslo, 19 February 2013 John Binde, CEO Ola Loe, CFO
 PRESENTATION Q4 2012 Oslo, 19 February 2013 John Binde, CEO Ola Loe, CFO AGENDA: Highlights for the period Segment information Group financials Outlook 2 Highlights in Q4 2012: Significant improvement
Grieg Seafood ASA. griegseafood.com. Andreas Kvame CEO. Atle Harald Sandtorv CFO. 11 November 2016
 Grieg Seafood ASA Andreas Kvame CEO Atle Harald Sandtorv CFO 11 November 2016 1 Agenda Highlights Business Units (Regions) Financials Outlook 2 HIGHLIGHTS Q3 2016 3 Highlights Q3 2016 Good quarterly results
Marine Harvest. Q Presentation 1 November 2017
 Marine Harvest 1 Q3 2017 Presentation 1 November 2017 Forward looking statements This presentation may be deemed to include forward-looking statements, such as statements that relate to Marine Harvest
Ekornes ASA. 1 st QUARTER 2013
 Ekornes ASA 1 st QUARTER 2013 Ekornes Q1 Headlines: Operating revenue: Q1: NOK 688.8 Mill. (up 1.3% ). Operating margin (EBIT) Q1: 13.1% (12.1%). Compared to Q1 last year, no build of stocks finished goods.
Marine Harvest. Q Presentation 22 August 2018
 Marine Harvest Q2 2018 Presentation 22 August 2018 Forward looking statements This presentation may be deemed to include forward-looking statements, such as statements that relate to Marine Harvest s contracted
SalMar ASA. Presentation Q CEO Olav-Andreas Ervik CFO Trond Tuvstein
 SalMar ASA Presentation Q1 2018 CEO Olav-Andreas Ervik CFO Trond Tuvstein Olav-Andreas Ervik new CEO of SalMar 41 years, from Frøya More than 20 years of experience from the aquaculture industry Worked
Your Aquaculture Technology and Service Partner. Q Presentation Oslo - August 17 th, 2016 Trond Williksen, CEO Eirik Børve Monsen, CFO
 Q2 2016 Presentation Oslo - August 17 th, 2016 Trond Williksen, CEO Eirik Børve Monsen, CFO Agenda 1 Highlights 2 Financial performance 3 Outlook 4 Q&A Highlights Q2 2016 - by CEO Trond Williksen 3 Improved