Institutional Presentation. December, 2014
|
|
|
- Rose Goodwin
- 6 years ago
- Views:
Transcription

1 Institutional Presentation December, 2014


2 Marfrig Global Foods Profile
3 3 History and Overview 1986: Startup of operations in Brazil with the distribution of premium beef cuts : Diversification into new regions across Brazil and start of exports : International expansion through acquisitions in South America 2007: IPO in Novo Mercado segment of BM&FBOVESPA 2008: Acquisition of Moy Park, one of the largest food companies in the UK 2009: Acquisition of Seara, one of the largest food companies in Brazil 2010: Acquisition of Keystone, one of the world's largest food suppliers to restaurant chains and quick service restaurants 2012: Divestment of Keystone's logistics services business and focus directed to the protein business 1H13: Divestment of the Seara and Zenda business units
4 4 History and Overview 2H13: Launch of strategic plan FOCUS TO WIN 2014 Target Range 9M14 % achieved 2018 Target Range Net Revenue (1) R$21.0bn to R$23.0bn R$15.1bn 72% - 66% 7.5% to 9.5% (CAGR ) EBITDA Margin (2) 7.5% - 8.5% 8.2% 109% - 96% 8.5% to 9.5% Investment (CAPEX) R$600MM R$447MM 75% n/d Free Cash Flow to Shareholders Breakeven to R$100MM R$71MM R$650MM to R$850MM Note: (1) Revenue calculated in R$ billion based on FX rate of R$2.40/US$ in 2014 and stable going forward, with no projected inflation. (2) Excludes non-recurring items.


5 5 Corporate Profile Marfrig is one of the largest and most diversified global food companies World s 3 rd largest beef producer and one of South America s largest lamb suppliers One of the world s largest providers of processed food to major restaurant chains One of the largest poultry-based processed products suppliers in the UK and Europe Diversified presence in animal protein, serving the Retail and Food Service Channels More than 45, commercial production and employees distribution units Presence in 16 Serving global retail countries in the and food chains in Americas, Europe, over Asia and countries 110 Oceania

6 6 Corporate Profile Net Revenue (R$ billion) * Revenue Breakdown - 9M14 % by Business % by Currency % by Product 46% 28% 26% 42% 26% 21% 11% 46% 44% 10% * Guidance 2014 Marfrig Beef Keytone Moy Park USD EUR/GBP BRL Other Processed Fresh Other
7 7 Corporate Governance Structure Marcos Molina Chairman of the Board Audit Board Sergio Rial CEO - Marfrig Global Foods CEOs Business Units Corporate Vice-Presidents Heraldo Geres VP - Legal Andrew Murchie Marfrig Beef Brasil Martin Secco Marfrig Beef Southern Cone Frank Ravndal Keystone Foods Janet McCollum Moy Park Jaime Singer VP Strategic Planning Marcello Zappia VP Human Resources Ricardo Florence VP Finance and IRO - CFO
8 8 Corporate Governance Structure Variable compensation plan Individual targets for each area Financial targets connected with guidance Net Revenue EBITDA Margin CAPEX Free Cash Flow Weight 20% Weight 20% Weight 10% Weight 50% Weights: CEO, Vice Presidents, Officers: 70% Financial Targets and 30% Individual Targets Managers: 50%-40% Financial Targets and 60%-50% Individual Targets


: elected one of the world s leading companies in")
9 9 Commitment to Sustainability Greenpeace Pact: higher exports to European market and sales of canned meat at Tesco Rainforest Alliance Certified: sales of beef with social and environmental responsibility seal to Carrefour and of sustainable leather to Gucci Carbon Disclosure Project and GHG Emission Inventory: first company in industry to report Scope 3 emissions The Nature Conservancy: participation on the organization's board for Latin America Business Benchmark on Farm Animal Welfare (BBFAW): elected one of the world s leading companies in animal welfare in 2013

10 Marfrig Beef
11 11 Marfrig Beef Overview One of the world's largest beef and lamb producers Strong expertise in supplying food service chains in Brazil Pioneer in the development of new export markets Geographic diversification in South America helps mitigate sanitary risks Brands recognized for quality and diversified product portfolio World s 3 rd largest beef producer and Brazil's 2 nd largest beef operation Uruguay's leading primary processor and Chile's largest meat importer

12 12 Marfrig Beef Overview Production Structure Brazil Uruguay/Chile Argentina 19 units 17,200 employees 3.7 million head of cattle/year 7 units 3,300 employees 930,000 head of cattle/year 2.0 million lamb/year 2 units 1,400 employees 390,000 head of cattle/year Revenue Breakdown 3Q14 % by Channel/Market % by Protein 44% 36% 15% 5% 76% 7% 17% Brazil Domestic Uruguay/Chile Brazil Export Argentina Fresh Beef Processed Lamb, Leather and Other


13 13 Marfrig Beef 3Q14 Highlights Net Revenue (R$ million) 2,240 2,256 2,075 2,365 2,482 9M14: R$6.9bn + 11% 3Q13 4Q13 1Q14 2Q14 3Q14 3T13 4T13 1T14 2T14 3T14 Stronger exports from Brazil Continued good performances at the Uruguay and Chile operations Lower average price in Brazil's domestic market due to the shift in the product mix
14 14 Marfrig Beef 3Q14 Highlights Adjusted EBITDA and Margin (R$ million and %) 9.0% % 10.0% 9.5% 10.2% M14: R$653MM 9.4% + 25% 3T13 4T13 1T14 2T14 3T14 3Q13 4Q13 1Q14 2Q14 3Q14 Higher raw material (cattle) costs passed through to export sales The Productivity Agenda Project in Brazil yielded initial savings of over R$13 million from the implementation of a series of actions to improve expense management
15 15 Marfrig Beef Strategic Goals Productivity Agenda Project in Brazil Rigorous monthly budget with diminishing cost targets Better management of overtime, attendance and shifts Restructuring of the sales/marketing team and redesign of route map Greater control of travel/transportation expenses Review and renegotiation of various contracts Review of procurement/expense model for maintenance, laundry, uniforms, etc Use of cheaper energy sources (steam) and reduction of cold-storage temperature losses Raise performance and optimization levels at production units to meet the company s internal benchmarks Estimated annual savings of R$30MM


16 16 Marfrig Beef Strategic Goals Segmentation of service to Food Service channel Large Chains Service Providers Specialized relationship Negotiations Pricing dynamics Product customization Street Business Independent Establishments Delivery times Logistics management

17 17 Marfrig Beef Strategic Goals Retail Higher sales to small retailers Partnerships with large retailers for portioned cuts based on specific consumer demands Pilot Project
18 Jan-10 Jun-10 Nov-10 Apr-11 Sep-11 Feb-12 Jul-12 Dec-12 May-13 Oct-13 Mar-14 Aug Marfrig Beef Outlook & Scenario Brazil Brazil enjoys a very competitive position in world beef exports Beef Cattle by Country (million head) India Brazil CAGR % 3.0% Cattle Price (USD/KG Carcass Weight) BRAZIL BRASIL AUSTRÁLIA USA EUA URUGUAI URUGUAY $5.44 China EU % -0.6% $3.72 $3.68 USA % $3.27 Argentina % Colombia % Australia %

 Europe Asia South/Central America Middle East")
19 19 Marfrig Beef Outlook & Scenario Brazil The opening up of new markets to Brazilian beef should drive export growth Share in Exports Marfrig Beef Brazil (R$ million and % of Revenue) 33% 1,473 42% 1,734 45% 1,971 3Q12 3T12 3T13 3Q13 3Q14 3T14 Exports by Destination 3Q14 Marfrig Beef Brazil (% of Revenue) Europe Asia South/Central America Middle East Russia Other
20 20 Marfrig Beef Outlook & Scenario Brazil Despite its competitive advantages, Brazil still lacks access to the world's largest beef importers Main import markets Import volume ( 000 tons/year) Share of world imports Restrictions on Brazil USA 1, % Negotiation Russia 1, % Open Japan % Negotiation Hong Kong % Open China % Open European Union % Open / Hilton South Korea % Closed Venezuela % Open Canada % Closed Chile % Open Mexico % Closed
21 21 Marfrig Beef Outlook & Scenario Uruguay Uruguay enjoys access to main beef import markets Exports by destination 3Q14 Marfrig Beef Uruguay (% of Revenue) Main import markets USA Russia Japan Hong Kong China European Union South Korea Venezuela Canada Chile Mexico Restrictions on Uruguay Open Open Negotiation Open Open Open Open Open Open Open Open Share of Exports Marfrig Beef Uruguay (R$ million and % of Revenue) 55% % 347 Europe Asia South/Central America Middle East Russia Other 56% 379 3Q12 3Q13 3Q14 3T12 3T13 3T14
22 22 Marfrig Beef Outlook & Scenario Argentina 15% tax levied on all exports from the country Each export transaction must be informed to and approved by the Trade Department Some items in the domestic market have price caps set by the government Marfrig Beef temporarily cut back its operations to two production units

23 Keystone Foods
24 24 Keystone Foods Overview Tradition stretching back over 50 years A leading global supplier of products to the food service industry and QSR chains Over 30,000 clients in North America and APMEA (Asia, Pacific, Middle East and Africa) Important protein supplier to McDonald's (61% of unit s sales in 3Q14) Committed to the highest food safety and quality standards Long-standing history of innovation
25 25 Keystone Foods Overview Production Structure United States 7 units 6,200 employees 190 million birds/year 400,000 tons of processed food/year APMEA 7 units 5,400 employees 40 million birds/year 150,000 tons of processed food/year Revenue Breakdown - 3Q14 % by Channel/Market % by Protein 76% 24% 74% 22% 4% USA APMEA Further processed poultry Further processed beef Other

26 26 Keystone Foods 3Q14 Highlights Net Revenue (R$ million) 1,483 1,390 1,391 1,414 1,412 9M14: R$4.2bn - 5% 3T13 3Q13 4T13 4Q13 1T14 1Q14 2T14 2Q14 3Q14 3T14 In the USA: Pricing model adopted with our main client whereby product prices reflect drops in raw material costs Change in sales mix to QSRs In APMEA: Sales mix was impacted by an incident involving a competitor food supplier to our main client in China
27 27 Keystone Foods 3Q14 Highlights Adjusted EBITDA and Margin (R$ million and %) 6.4% 6.9% 8.0% 7.1% 6.1% M14: R$298MM 7.1% - 9% 3T13 3Q13 4T13 4Q13 1T14 1Q14 2T14 2Q14 3Q14 3T14 Impact of mark-to-market adjustments of unrealized hedge losses Higher outside meat costs Lower feed costs


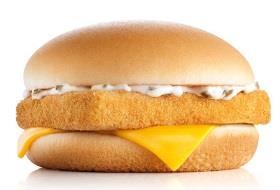
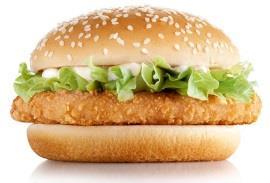
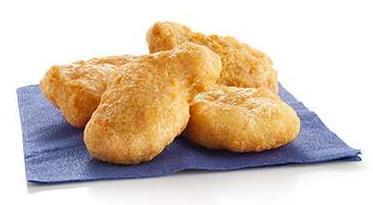


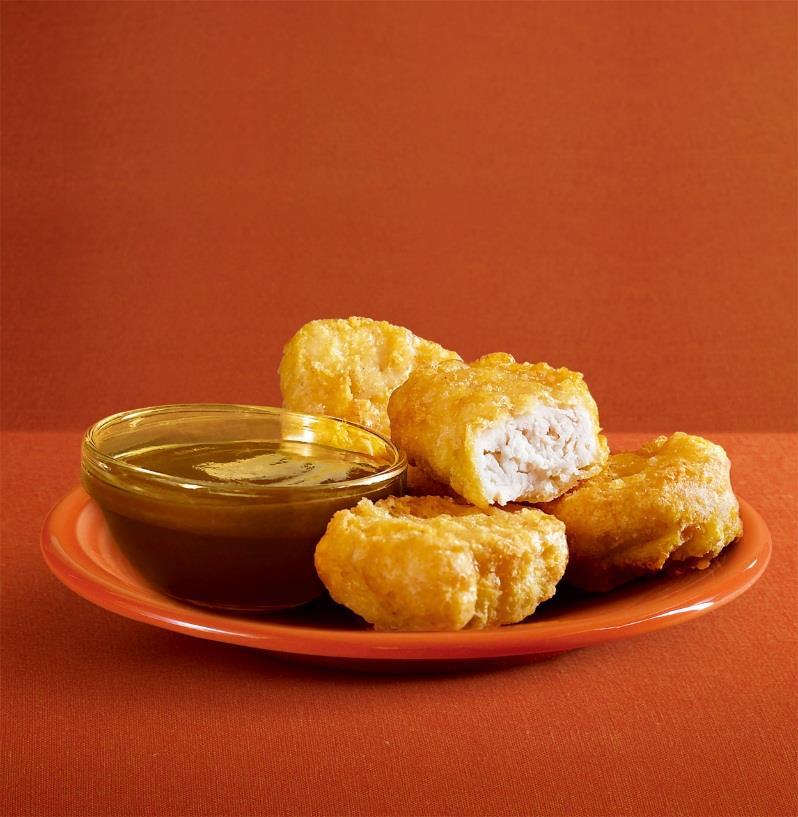
28 28 Keystone Foods Strategic Goals Comprehensive product portfolio for food service industry and QSR chains Poultry-based products Beef-based products Nuggets Chicken patties Grilled strips Beef patties Other Coated seasoned cuts Fish patties Bacon and Halal Bacon Desserts


29 29 Keystone Foods Strategic Goals Integrated production chain allows greater control and ensures product availability, consistency and quality Vertical integration corresponding to 70% poultry supply in Keystone s operation in the U.S. Bird Selection Selection of breeds based on performance Pullet Farms Hens raised until they reach sexual maturity Feed Plant High quality feed is produced to optimize the performance of chickens. Breeder Farms Hens lay eggs that are taken to the hatchery Further Processing Creation of chickenbased fully-cooked, parfried and marinated products. Primary Processing Poultry slaughter with the carcass forwarded to the further processing units Broiler Farms Broilers are raised until they reach the targeted weight. Fertile Hatchery Fertile hatching eggs are incubated and hatched.

 United Arab Emirates 5% Australia")

30 30 Keystone Foods Strategic Goals Established a Broad Footprint in APMEA Supplying 19 Countries Across the Region APMEA Sales Well Diversified (% of revenue by country of destination ) Volume growth in all markets where we have production presence ( 000 pounds) United Arab Emirates 5% Australia 6% Other 3% China 30% 12.4% CAGR 313 Australia Singapore 8% South Korea Middle East 11% 109 Thailand Malaysia South Korea 12% Malaysia 12% Japan 13% China

 5.")


31 31 Keystone Foods Outlook & Scenario Potential QSR segment growth in USA Sales of major QSR chains (US$ billion) Expected market growth (US$ billion) 5.5% CAGR Keystone Customer % CAGR E 15E 16E 17E Source: Euromonitor / U.S. Fast Food, QSR 50 Report 2012

32 32 Keystone Foods Outlook & Scenario Potential QSR segment growth in APMEA Per-capita poultry consumption by country (2013) India Pakistan Indonesia Philippines Thailand China Vietnam Korea Turkey Saudi Arabia Malaysia Growth drivers Higher per-capita GDP Population growth Growing middle class Rural flight Kg / inhabitant / year Source: OECD-FAO Agricultural Outlook
33 33 Keystone Foods Outlook & Scenario Potential QSR segment growth in APMEA Yum Brands expects to open 700 new stores in China in 2014 KFC chain has over 4,500 restaurants in over 1,000 cities in China Pizza Hut chain has over 1,200 restaurants in over 300 cities in China McDonalds has opened an average of 190 stores per year since 2008 in China, and currently has 2,000 stores McDonalds has opened an average over 300 stores per year since 2008 in APMEA, and currently has some 10,000 stores Source: websites of Yum Brands and McDonald s

34 Moy Park
35 35 Moy Park Overview Over 70 years of tradition and growth One of the 15 largest food companies in the UK and largest company in Northern Ireland Relationships with leading retailers and food service operators in UK and continental Europe Unique and comprehensive poultry production platform with high quality standards Clear opportunities for growth and operational excellence to drive margin expansion Pioneer in the production of free range and organic poultry
36 36 Moy Park Overview Production Structure UK and Continental Europe 14 units 12,000 employees 240 million birds/year 270,000 tons of processed food/year Revenue Breakdown - 3Q14 % by Market % by Channel % by Protein 74% 25% 1% 61% 29% 10% 53% 40% 7% UK Continental Europe Other Retail Food Service Other Processed Fresh Other
37 37 Moy Park 3Q14 Highlights Net Revenue (R$ million) 1,332 1,321 1,338 1,345 1,222 9M14: R$4.0bn +10% 3T13 3Q13 4T13 4Q13 1T14 1Q14 2T14 2Q14 3Q14 3T14 Sales growth in the retail channel in UK and Ireland, led by fresh meats Positive contribution from currency variation in the period (7%) Consolidation of Marfrig's convenience beef business in Europe

38 38 Moy Park 3Q14 Highlights Adjusted EBITDA and Margin (R$ million and %) 6.4% % 7.2% 7.0% 7.1% M14: R$284MM 7.1% +24% 3T13 3Q13 4T13 4Q13 1T14 1Q14 2T14 2Q14 3Q14 3T14 Grantham Project for optimizing the further processing unit in England: lower production and labor costs Lower grain costs Higher freight expenses resulting from the consolidation at Moy Park of Marfrig Beef Brazil's beef business in Europe

39 39 Moy Park Strategic Goals Moy Park has leading positions in the highest value, growing retail segments in poultry Fresh poultry Chilled ready-to-eat Chilled fresh coated 25% 46% 52% 75% 54% 48% Second largest producer in the UK Leading market positions in higher growth convenience food categories (growth of over 6% p.y.) Source: Kantar Worldpanel, Euromonitor


40 40 Moy Park Strategic Goals Unique Comprehensive Poultry Farming Production Platform Completely vertical integration Grandparent stock Parent hatchery Parent rearing Parent laying Broiler hatchery Broiler housing Feed mill Slaughterhouse/Portioning Further processing Commercial/Marketing High animal welfare Free range and organic 45% of Moy Park s broiler housing is less than 10 years old, vs. 8% for the industry


41 41 Moy Park Strategic Goals Longstanding relationships with customer base Working to enhance product offerings Developing partnership for future growth opportunities Key Clients Competitive advantages Retail Food Service v Long-term relationships Focus on win-win profitability with customers Enhanced risk management Developing deep customer access and insights Drive growth in new channels and with new, innovative products Sustainability


42 42 Moy Park Strategic Goals Innovation and food development Delivered an average of 1 to 2 new innovations per year during the last 10 years with growing NPD pipeline 2011 Jamie Oliver 2012 Meals 2013 Snacks 2014 Kitchen Menu launched in supermarkets High-quality meals made with Irish ingredients Convenient snacking products Ready meals in convenient pouches
43 43 Moy Park Outlook & Scenario UK poultry dynamics Retailer and consumer focus on UK provenance Growth in demographics: UK population forecasted to grow from 63 to 70 million by 2030 Consumer preference for fresh, convenience and locally farmed products Most versatile and healthy protein, also consumed by most religions
 ¹ Pork and Beef in 000 tons, indexed to 2008 Dec-16 UK production expected to increase 4% p.a.")
44 44 Moy Park Outlook & Scenario UK protein production Kill per week (million head) Origin of UK poultry 20 Birds 19 Hogs¹ Cattle¹ Imported 38% UK produced 62% Jan-08 Jan-14 Source: DEFRA UK broiler slaughter (rolling weekly average) ¹ Pork and Beef in 000 tons, indexed to 2008 Dec-16 UK production expected to increase 4% p.a.
45 45 Moy Park Outlook & Scenario Poultry is the most affordable protein Cost per ton ( ) 1 1,300 1,590 4,420 UK sales volume ( 000 tons) CAGR 1.6% CAGR 1.6% Chicken Pork Beef Evolution of UK consumption ( 000 tons) CAGR 0.1% 442 Chicken Pork Beef CAGR 0.1% A 2013A 2014E 2015E 2016E 2017E Source: Euromonitor, USDA 1 Production price -125 Chicken Fish Beef Pork

46 EBITDA 2014E (USD MM) 46 Moy Park Outlook & Scenario Peer comparison EV/EBITDA14E (Circle size = Enterprise Value) 400 HILTON 300 GREENCORE CRANSWICK SCANDI STANDARD EBITDA LTM MOY PARK USD 170 MM 0 6,5 7,0 7,5 8,0 8,5 9,0 9,5 10,0 10,5 11,0 11,5 Source: Factset EV/EBITDA


47 47 Moy Park Outlook & Scenario Pricing Dynamics of UK IPOs Q14 2Q14 3Q14 Under Bottom Middle Top Upper Source: Dealogic


48 Consolidated Financial Performance
 Breakdown by Business")


49 49 Financial Performance Consolidated Net Revenue (R$ million) Breakdown by Business (%) Receita por Negócio - 3T13 Receita por Negócio 45% 3Q13 25% 47% 3Q14 26% + 6% 30% 27% Compared to 3Q13: Moy Park +10% to R$1,345MM Keystone -5% to R$1,412MM Marfrig Beef +11% to R$2,482MM
 Breakdown by")


50 50 Financial Performance Consolidated Gross Income and Gross Margin (R$ million and %) Breakdown by Business (%) Lucro por Negócio - 3T13 Lucro por Negócio - 3 3Q13 3Q14 63% 21% 65% 22% + 11% 16% 13% Gross margin growth vs. 3Q13: Moy Park + 80 bps to 10.7% Keystone - 60 bps to 6.0% Marfrig Beef + 50 bps to 16.9%
 Breakdown by Business (%) 3Q13 3Q14 58% 29%")

51 51 Financial Performance Consolidated SG&A and SG&A/NOR (R$ million and %) Breakdown by Business (%) 3Q13 3Q14 58% 29% 58% 30% + 5% 13% 12% SG&A/NOR vs. 3Q13: Moy Park + 20 bps to 8.2% Keystone stable at 3.0% Marfrig Beef - 50 bps to 8.4%

52 52 Financial Performance Consolidated Adjusted EBITDA and Margin (R$ million and %) EBITDA Breakdown por Negócio by Business - 3T13 (%) EBITDA por Negócio - 54% 3Q13 21% 58% 3Q14 22% +16% 25% 20% EBITDA Margin vs. 3Q13: Moy Park + 70 bps to 7.1% Keystone - 30 bps to 6.1% Marfrig Beef bps to 10.2% Consolidated adjusted EBITDA margin of 8.2% in 9M14, reaching the upper level of the target range in the FOCUS TO WIN strategy


53 53 Liquidity and Debt Consolidated Debt (R$ million) Strong BRL depreciation at end-3q14 increased net debt, with no cash effect BRL depreciation of 11% (R$2.20/US$ at end-2q14 vs. R$2.45/US$ at end-3q14) Operating income has yet to capture the BRL depreciation that occurred late in 3Q14, since the average FX rate in the quarter was R$2.28/US$, virtually flat from R$2.23/US$ in 2Q14


54 54 Liquidity and Debt Consolidated Net Debt in USD (US$ million) Marfrig s debt in USD remained stable
55 55 Liquidity and Debt Consolidated Indicators 3Q14 2Q14 Net Debt / EBITDA LTM 4.84x 3.71x Net Debt / Annualized Adjusted EBITDA 4.33x 4.23x Net Debt / Total Assets 0.37x 0.37x Cash and Equivalents / Short- Term Debt 2.47x 2.52x Current Liquidity (*) Duration (months) Average Cost ** (p.y.) 7.6% 7.0% Short Term (%) 11.7% 11.2% Long Term (%) 88.3% 88.8% In BRL (%) 5.8% 4.1% Other Currencies (%) 94.2% 95.9% * Current Liquidity = Current Assets / Current Liabilities ** Excludes the interest paid on the mandatorily convertible debentures Leverage ratio for bank and market financing excludes FX effects, resulting in a ratio of 3.64x at end- 3Q14 EBITDA LTM does not yet fully reflect BRL depreciation Average exchange rate in LTM of R$2.29/US$, vs. R$2.45/US$ at end- 3Q14
")

56 56 Liquidity and Debt Consolidated Maturity Schedule in 3Q14 (R$ million) Short Term: R$1.2bn Longer debt maturity profile, with first large maturity due only in 2018
57 57 Liquidity and Debt Consolidated Liability Management Operations Transaction Period Amount (million) Coupon Maturity 2020 Bond Re-tap 1Q14 US$ % 2020 Moy Park Bond Issue 2Q14 GBP % Bond Issue 2Q14 US$ % 2019 Repurchase Q14 US$ % 2016 Repurchase Q14 US$ % 2021 Repurchase Q14 US$ % 2017 Bond issue of US$850MM: company's largest ever and Brazil's largest until May 2014 Demand breakdown % by region 44% 39% 5% 4% 8% Order book (US$4.9bn) exceeded the issue by 5.6x, which allowed for lowering the cost to 6.875% p.y. Repurchase of 2017 and 2021 Senior Notes, significantly reducing the cost and realigning the maturity profile % investor type Europe US Asia LatAm Other 45% 17%14%12%13% Asset Mgmt Private Bank Other Hedge Fund Bank

58 58 Cash Flow Consolidated Cash Flow Bridge 3Q14 (R$ million) Better working capital management, especially at Marfrig Beef Brazil Improvement in trade accounts receivable term from 28 days in 2Q14 to 27 days in 3Q14 Incident involving a supplier to our main client in China contributed to the temporary increase in inventories The line Other increased, mainly due to non-cash items related to market transactions, such as swap and commodity contracts

59 59 Cash Flow Consolidated Free Cash Flow (after CAPEX and Interest) (R$ million) 1Q13 1T13 2T13 2Q13 3T13 3Q13 4T13 4Q13 1T14 1Q14 2T14 2Q14 3Q14 3T (295) (135) (30) (628) (932) Free cash flow was positive R$84 million in the quarter, despite the higher export volumes and payments related to the renegotiation of tax liabilities under REFIS In 9M14, free cash flow was positive R$71 million, reaffirming our commitment to deliver positive free cash flow in 2014
 3Q13")
 (55,1) Currency")

60 60 Cash Flow Consolidated Net Income (R$ million) 3Q13 4Q13 1Q14 2Q14 3Q14 (83,4) (96,4) (55,1) Currency variation (R$226MM) (194,1) - 56% REFIS expenses (R$93MM) (303,3)
61 61 Cash Flow Consolidated Investments (R$ million) 3Q14 2Q14 1Q14 4Q13 3Q13 Investments in fixed assets Fixed Assets Breeding stock Investments in intangible assets Total investment in the period


62 Ownership Structure and Capital Markets


63 63 Ownership Structure October 2014 Share Capital Free-float 520,747,405 shares 1 255,183,732 shares Officers/ Management 0.1% Treasury 0.1% 11.0% MMS Part. 31.2% Other 42.7% 15.2% 8.2% Other 11.1% 30.7% BNDES 19.6% 23.7% 6.3% 1 In January 2007, up to 100 million shares will be issued following maturity of the mandatory convertible bond
64 64 Sell-Side Assessment Covered by 14 institutions Recommendation Manter 46% 39% 38% 15% Average TP: R$7.71 Buy Hold Sell
65 65 100% Share Performance % 60% 52% 40% 20% 0% 27% 3% 3% -20% dez-13 jan-14 fev-14 mar-14 abr-14 mai-14 jun-14 jul-14 ago-14 set-14 out-14 nov-14 Source: Bloomberg To November 12, 2014 *Peers: average of JBS, BRF and Minerva MRFG3 Peers* Ibovespa
66 jan-14 fev-14 mar-14 abr-14 mai-14 jun-14 jul-14 ago-14 set-14 out-14 nov-14 jan-14 fev-14 mar-14 abr-14 mai-14 jun-14 jul-14 ago-14 set-14 out-14 nov-14 jan-14 fev-14 mar-14 abr-14 mai-14 jun-14 jul-14 ago-14 set-14 out-14 nov Bond Performance % 24% 24% 20% 20% 20% 16% 12% 13% 16% 12% 13% 16% 12% 15% 8% 8% 8% 4% 0% 1% 4% 0% 2% 4% 0% 1% -4% -4% -4% MRFG3 Peers* Source: Bloomberg To November 12, 2014 * Peers: average of bonds issued by JBS, BRF and Minerva with same maturities
67 Final Remarks
68 68 Final Remarks Consolidated Results We are on track to delivering our 2014 guidance, which is an important milestone for Marfrig and for our shareholders We delivered another quarter of steady performance that included: (i) an undivided commitment to Free Cash Flow (FCF); (ii) a totally re-designed debt maturity profile (with the first material payment only in 2018); and (iii) improved operating performance All businesses posted EBITDA margins above 7% in the year to date, which has allowed the group to stay on the high end of its 2014 EBITDA target margin The business portfolio is well positioned to capture this unique high margin/price environment in the animal protein industry, which is further supported by a potentially stronger dollar in the near future
69 69 Final Remarks Marfrig Beef The world needs beef and we are well positioned (world's thirdlargest beef producer) to capture this opportunity Our shift to a much higher share of exports in our Beef business in Brazil (45% in 3Q14, vs. 41% in 3Q13 and 33% in 3Q12) is underpinned by our belief in the current supply and demand situation in the international market We believe there are plenty of opportunities to improve results further, especially in terms of FCF and margin. We assumed a commitment to a serious productivity agenda at Marfrig Beef Brazil, which is starting to pay off, as seen in this quarter with the improvement in cost management. Note that the same productivity agenda is being rolled out in Uruguay, Argentina and Chile
70 70 Final Remarks Marfrig Beef The gains captured in the third quarter signal a good probability of delivering annual cost savings (in Brazil alone) greater than the initial target of R$30 million Uruguay continues to post strong results, but we believe the best is yet to come in the fourth quarter of the year We do not see any short term concerns, with cattle prices most likely remaining under pressure, but with relatively strong international demand helping to keep domestic margins at reasonable levels
71 71 Final Remarks Keystone Foods Our further processing operations in the US will benefit as meat costs are moving toward seasonal lows Lower grain costs are flowing through our integrated operations in the US leading to improved cost We have secured new volumes in APMEA and expect to see an impact in Q as consumer confidence begins to return We are focused on managing costs and expect to drive SG&A savings in the 4 th quarter We expect growth in EBITDA in the 4 th market dynamics in both the US and Asia quarter due to improving
72 72 Final Remarks Moy Park The fourth quarter should be strong, with turkey sales adding to the bottom line and a better grain environment We will also focus more intensely on SG&A expenses, but while keeping an eye on making good inroads in terms of innovation and service quality Moy Park is an unquestionable growth story. Annual sales increased from 800 million in 2008 (at the time of its acquisition by Marfrig) to approximately 1.45 billion estimated for 2014, which confirms the enormous potential of the European market, which remains promising
73 73 Final Remarks Capital Structure Our operating performance has not yet benefitted from the stronger dollar, but the fourth quarter will hopefully provide some signs of this In 2015, if market conditions permit, we will carry out Moy Park s IPO
74 74 Final Remarks We will remain very focused on our full-year results. We want to finish 2014 with strong operating performance and meeting all targets in our 2014 guidance We see ourselves as a multi-year deleveraging story marked by (i) improved operating performance; (ii) lower interest expenses (and consequently expanding FCF); and (iii) attracting equity through the subsidiaries to accelerate debt reduction in absolute terms
75 75 Next Steps 1. Continue expanding margins by fully capitalizing on the current positive trends in the animal protein industry 2. Share our two-year plan (part of our current Focus to Win strategy), which will set more comprehensive targets that will enable a better assessment of the Group s operating performance and capital structure 3. We are planning a Marfrig Day event in the first half of 2015 to share management's views for the next two years, culminating in January On that occasion, the BNDES will convert its R$ 2.1 billion mandatory convertible bond into equity, which should provide annual cash flow relief of around US$100 million (based on the exchange rate of R$2.50/US$), representing another concrete step towards strengthening our capital structure 4. Management, across all businesses, remains highly committed and aligned to improving current performance. Worth sharing that management 2014 current variable compensation program, is tied up to meeting our 2014 guidance. We are on track
76 Questions and Answers
77 Disclaimer This material is a presentation of general information about Marfrig Global Foods S.A. and its consolidated subsidiaries (jointly the Corporation ) on the date hereof. The information is presented in summary form and does not purport to be complete. No representation or warranty, either expressed or implied, is made regarding the accuracy or scope of the information herein. Neither the Company nor any of its affiliated companies, consultants or representatives undertake any responsibility for any losses or damages arising from any of the information presented or contained in this presentation. The information contained in this presentation is up to date as of September 30, 2014, and, unless stated otherwise, is subject to change without prior notice. Neither the Corporation nor any of its affiliated companies, consultants or representatives have signed any commitment to update such information after the date hereof. This presentation should not be construed as a legal, tax or investment recommendation or any other type of advice. The data contained herein were obtained from various external sources and the Corporation has not verified said data through any independent source. Therefore, the Corporation makes no warranties as to the accuracy or completeness of such data, which involve risks and uncertainties and are subject to change based on various factors. This presentation includes forward-looking statements. Such statements do not constitute historical fact and reflect the beliefs and expectations of the Corporation s management. The words anticipates, hopes, expects, estimates, intends, projects, plans, predicts, projects, aims and other similar expressions are used to identify such statements. Although the Corporation believes that the expectations and assumptions reflected by these forward-looking statements are reasonable and based on the information currently available to its management, it cannot guarantee results or future events. Such forward-looking statements should be considered with caution, since actual results may differ materially from those expressed or implied by such statements. Securities are prohibited from being offered or sold in the United States unless they are registered or exempt from registration in accordance with the U.S. Securities Act of 1933, as amended ( Securities Act ). Any future offering of securities must be made exclusively through an offering memorandum. This presentation does not constitute an offer, invitation or solicitation to subscribe or acquire any securities, and no part of this presentation nor any information or statement contained herein should be used as the basis for or considered in connection with any contract or commitment of any nature. Any decision to buy securities in any offering conducted by the Corporation should be based solely on the information contained in the offering documents, which may be published or distributed opportunely in connection with any security offering conducted by the Company, depending on the case.


78 IR Contacts Address Telephone Avenida Chedid Jafet, 222 Bloco A 5º andar - São Paulo - SP SP: +55 (11) NY: ri@marfrig.com.br
Marfrig Day. March, 2015
 Marfrig Day March, 2015 2 Agenda Marfrig Day São Paulo 1. Introduction. 15 min 2. Moy Park... 20 min 3. Keystone... 20 min 4. Marfrig Beef... 20 min 5. 4 th Quarter 2014 Consolidated Results... 20 min
MARFRIG DELIVERS ITS 2014 GUIDANCE WITH CASH FLOW OF R$56 MILLION
 MARFRIG DELIVERS ITS 2014 GUIDANCE WITH CASH FLOW OF R$56 MILLION São Paulo, March 2, 2015 Marfrig Global Foods S.A. - Marfrig (BM&FBovespa Novo Mercado: MRFG3 and Level 1 ADR: MRTTY) announces today its
NET REVENUE OF R$5.9 BILLION 23% OVER 1Q14
 MARFRIG ENCERRA CONSOLIDATED O ANO RESULTS COM ENTREGA FOR 1Q2015 DE GUIDANCE E NET REVENUE OF R$5.9 BILLION 23% OVER 1Q14 São Paulo, May 8, 2015 Marfrig Global Foods S.A. - Marfrig (BM&FBovespa Novo Mercado:
Marfrig Global Foods. December 2016
 Marfrig Global Foods December 2016 Disclaimer This material is a presentation of general information about Marfrig Global Foods S.A. and its consolidated subsidiaries (jointly the Corporation ) on the
Positive Free Cash Flow of R$39 million in 3Q16
 3Q16 Earnings Release Positive Free Cash Flow of R$39 million in 3Q16 São Paulo, November 10, 2016 Marfrig Global Foods S.A. Marfrig (BM&FBovespa Novo Mercado: MRFG3 and Level 1 ADR: MRTTY) announces today
Positive free cash flow of R$68 million in 4Q16
 Positive free cash flow of R$68 million in São Paulo, February 23, 2017 Marfrig Global Foods S.A. Marfrig (BM&FBOVESPA Novo Mercado: MRFG3 and Level 1 ADR: MRTTY) announces today its results for the fourth
Earnings Conference Call 2Q18. August 15, 2018
 Earnings Conference Call August 15, 2018 Disclaimer This material is a presentation of general information about Marfrig Global Foods S.A. and its consolidated subsidiaries (jointly the Corporation ) on
POSITIVE CASH FLOW OF R$43 MILLION IN 4Q15
 4Q15 and 2015 Earnings Release POSITIVE CASH FLOW OF R$43 MILLION IN 4Q15 São Paulo, February 29, 2016 Marfrig Global Foods S.A. Marfrig (BM&FBOVESPA NOVO MERCADO: MRFG3 and Level 1 ADR : MRTTY) announces
Earnings Conference Call 3Q18. November 06, 2018
 Earnings Conference Call 3Q18 November 06, 2018 Disclaimer This material is a presentation of general information about Marfrig Global Foods S.A. and its consolidated subsidiaries (jointly the Corporation
EARNINGS CONFERENCE CALL
 EARNINGS CONFERENCE CALL AUGUST 15, 2017 INVESTOR RELATIONS Disclaimer This material is a presentation of general information about Marfrig Global Foods S.A. and its consolidated subsidiaries (jointly
JBS S.A. August / September, 2013
 JBS S.A. August / September, 2013 Disclaimer This release contains forward-looking statements relating to the prospects of the business, estimates for operating and financial results, and those related
2Q15 Results Presentation August 14th A Global Food Company
 Results Presentation August 14th 2015 A Global Food Company Disclaimer This release contains forward-looking statements relating to the prospects of the business, estimates for operating and financial
Earnings Conference Call. 4Q18 and February 28, 2018
 Earnings Conference Call 4Q18 and 2018 February 28, 2018 Disclaimer This material is a presentation of general information about Marfrig Global Foods S.A. and its consolidated subsidiaries (jointly the
4Q16 and 2016 Results
 JBS S.A. (BVM&FBOVESPA: JBSS3; OTCQX: JBSAY) São Paulo, March 13 th, 2017 and 2016 Results JBS Ended With Net Income of R$693.9 million and a free cash generation of R$2.9 billion JBS ended with net revenues
GOLDMAN SACHS 17 TH ANNUAL AGRIBUSINESS CONFERENCE. February 26, 2013
 GOLDMAN SACHS 17 TH ANNUAL AGRIBUSINESS CONFERENCE February 26, 2013 DENNIS LEATHERBY, CFO FORWARD-LOOKING STATEMENTS Certain information contained in this presentation may constitute forward-looking statements,
Marfrig announces acquisition of controlling interest in National Beef, and the decision to sell Keystone Foods
 1Q18 Earnings Release Marfrig announces acquisition of controlling interest in National Beef, and the decision to sell Keystone Foods São Paulo, May 14, 2018 Marfrig Global Foods S.A. Marfrig (B3 Novo
Pilgrim s Pride Corporation (NASDAQ: PPC) Pilgrim s Acquires Moy Park September 11, 2017
 Pilgrim s Acquires Moy Park September 11, 2017") Pilgrim s Pride Corporation (NASDAQ: PPC) Pilgrim s Acquires Moy Park September 11, 2017 Cautionary Notes and Forward-Looking Statements Statements contained in this presentation that share our intentions,
Pilgrim s Pride Corporation (NASDAQ: PPC) Pilgrim s Acquires Moy Park September 11, 2017 Cautionary Notes and Forward-Looking Statements Statements contained in this presentation that share our intentions,
TRANSACTION. April 9th, 2018
 TRANSACTION + April 9th, 2018 1 REDIRECTING THE GROWTH STRATEGY OF ITS DIVISIONS: - BEEF CORE BUSINESS WE HAVE TWO PROJECTS (1ST HALF 2018) I. AQUISITION OF MAJORITY STAKE AT NATIONAL BEEF, ADDING TO THE
March, 2010 JBS S.A. In God We Trust, Nature We Respect
 March, 2010 JBS S.A. 0 In God We Trust, Nature We Respect Our Values Excellence Planning Determination Discipline Availability Openness Simplicity 1 Agenda Company Overview Market Overview 4Q09 Highlights
JBS ENDS 3Q18 WITH NET REVENUE OF R$49.4 BILLION AND ADJUSTED EBITDA OF R$4.4 BILLION. Free cash flow reached R$2.3 billion
 Highlights São Paulo, November 13, 2018 JBS S.A. (B3: JBSS3; OTCQX: JBSAY) JBS ENDS WITH NET REVENUE OF R$49.4 BILLION AND ADJUSTED EBITDA OF R$4.4 BILLION Free cash flow reached R$2.3 billion In, net
JBS 3Q14 Results Presentation November 13 th, 2014
 JBS 3Q4 Results Presentation November 3 th, 04 Disclaimer This release contains forward-looking statements relating to the prospects of the business, estimates for operating and financial results, and
Interim Results FOR THE SIX MONTHS ENDED 30 SEPTEMBER 2016
 Interim Results FOR THE SIX MONTHS ENDED 30 SEPTEMBER 2016 1 AGENDA INTRODUCTION Martin Davey, Chairman HIGHLIGHTS Adam Couch, CEO FINANCIAL REVIEW Mark Bottomley, Finance Director COMMERCIAL REVIEW Jim
Record quarterly net revenue of R$5.82 billion grows 9.3% from 2Q11 Gross margin expands 130 bps and expenses decrease 110 bps from 2Q11
 Record quarterly net revenue of R$5.82 billion grows 9.3% from 2Q11 Gross margin expands 130 bps and expenses decrease 110 bps from 2Q11 CONSOLIDATED FINANCIAL HIGHLIGHTS: Net operating revenue was R$5.82
2017 RESULTS. JBS ended 2017 with a 18.9% higher EBITDA of R$13.4 billion. FY free cash flow was R$2.8 billion
 2017 RESULTS JBS ended 2017 with a 18.9% higher EBITDA of R$13.4 billion FY free cash flow was R$2.8 billion In 2017, net revenue was R$163.2 billion, equivalent to US$51.5 billion Gross profit totaled
3Q18 Earnings November 8, 2018
 Earnings November 8, 2018 1 Disclaimer This presentation may contain statements that express BRF S.A. ( BRF ) management s expectations, beliefs and assumptions about future events or results. Such statements
JBS S.A. A GLOBAL FOOD COMPANY. Institutional Presentation Including 1Q17 Results
 JBS S.A. A GLOBAL FOOD COMPANY Institutional Presentation Including Q7 Results Our Values DETERMINATION Be relentless. Deliver superior results. Adopt a sense of urgency. Make things happen. SIMPLICITY
Earnings Release 3Q18
 Marfrig reaches revenue and EBITDA records and resumes positive cash generation, with free cash flow of R$271 million in the quarter São Paulo, November 5, 2018 Marfrig Global Foods S.A. Marfrig (B3 Novo
Acquisition of Cargill Pork Business July 2, A Global Food Company
 Acquisition of Cargill Pork Business July 2, 205 A Global Food Company Disclaimer This release contains forward-looking statements relating to the prospects of the business, estimates for operating and
MARFRIG REPORTS EARNINGS FOR FIRST QUARTER 2013
 MARFRIG REPORTS EARNINGS FOR FIRST QUARTER 2013 São Paulo, May 14, 2013 Marfrig Alimentos S.A. Marfrig (BM&FBOVESPA: MRFG3 and ADR Level 1: MRTTY) announces today its results for the first quarter of 2013
MARFRIG New structure. Investor Relations September,
 MARFRIG New structure Investor Relations September, 4 2018 Disclaimer This material is a presentation of general information about Marfrig Global Foods S.A. and its consolidated subsidiaries (jointly the
Meeting with. Investors. 4Q17 results. March 2018
 Meeting with Investors 4Q17 results March 2018 Disclaimer This material is a presentation of general information about Marfrig Global Foods S.A. and its consolidated subsidiaries (jointly the Corporation
JBS S.A. A GLOBAL FOOD COMPANY. Institutional Presentation Including 4Q16 and 2016 Results
 JBS S.A. A GLOBAL FOOD COMPANY Institutional Presentation Including 4Q6 and 06 Results Our Values DETERMINATION Be relentless. Deliver superior results. Adopt a sense of urgency. Make things happen. SIMPLICITY
Conference Call First Quarter 2014 Financial Results. Presentation3
 Conference Call First Quarter 204 Financial Results Presentation3 May 2, 204 Agenda 2 Presentation3 Agenda 2 3 4 5 6 Opening Remarks Global Alimentos Acquisition Q4 Highlights Operating and Financial Review
Jakarta, April 5 th, Unofficial Translation
 Jakarta, April 5 th, 2017 Unofficial Translation Content Company Overview Operational Performance Financial Highlights Challenges & Strategies Appendix 2 An Introduction To Japfa Tbk Vertically integrated
3Q18 Earnings Release
 3Q18 Earnings Release Barretos, November 6, 2018 Minerva S.A. (BM&FBOVESPA: BEEF3 OTC - Nasdaq International: MRVSY), the South American leader in the export of fresh beef and cattle byproducts, which
1Q17 Conference Call
 1Q17 Conference Call May 09, 2017 MINERVA 1Q17 Highlights OPERATING AND FINANCIAL HIGHLIGHTS Operational Cash Flow: 1Q17: R$53.6 million LTM1Q17: R$432.3 million 1Q17 ROIC: 22.2% Gross revenue: 1Q17: R$2,302.9
Focused on Profitable, Consistent Growth
 Focused on Profitable, Consistent Growth Investor Presentation May 2014 FORWARD-LOOKING STATEMENTS Certain information contained in this presentation may constitute forward-looking statements, such as
Tegel Group Holdings Limited
 Tegel Group Holdings Limited FY17 Interim Results Presentation 15 December 2016 TEGEL GROUP HOLDINGS LIMITED FY17 INTERIM RESULTS 1 Disclaimer This presentation contains summary information about Tegel
Monetary Policy: A Key Driver for Long Term Macroeconomic Stability
 Monetary Policy: A Key Driver for Long Term Macroeconomic Stability Julio Velarde Governor Central Bank of Peru March 2016 Agenda 1. Peru s growth is based on strong fundamentals 2. Recent economic developments
Financial Results for Third Quarter Ended Sep 30, Pilgrim s Pride Corporation (NASDAQ: PPC)
") Financial Results for Third Quarter Ended Sep 30, 2018 Pilgrim s Pride Corporation (NASDAQ: PPC) Cautionary Notes and Forward-Looking Statements Statements contained in this presentation that share our
Financial Results for Third Quarter Ended Sep 30, 2018 Pilgrim s Pride Corporation (NASDAQ: PPC) Cautionary Notes and Forward-Looking Statements Statements contained in this presentation that share our
Tegel Group Holdings Limited
 Tegel Group Holdings Limited FY17 Full Year Results Presentation 27 June 2017 1 TEGEL GROUP HOLDINGS FY17 RESULTS PRESENTATION Disclaimer This presentation contains summary information about Tegel Group
last YEAR. 190 / 100 kg % Placings Broiler. Jul. Jul. Jan. Jan. Oct. Oct. Oct. Apr. Apr 125%
 POULTRY MEAT Last update: EVOLUTION 185.18 last YEAR 19 / 1 kg 18 + 1.9% -.1% 175 /1 kg carcase weight 17 4. 1.1 3. 6 3 2 4 1 2 Main Producers Poultry meat production ( 1 Tonnes product weight) ( Forecasts
Including 4Q17 and 2017 Results
 JBS S.A. A GLOBAL FOOD COMPANY Institutional Presentation Including 4Q17 and 2017 Results São Paulo ABOUT JBS Net Revenue of R$ 163.2 billion (FY 2017) Second largest global food company¹ Global and diversified
For personal use only
 Tegel Group Holdings Limited FY18 Interim Results Presentation 6 December 2017 1 TEGEL GROUP HOLDINGS FY18 INTERIM RESULTS PRESENTATION Disclaimer This presentation contains summary information about Tegel
Financial Results for Fourth Quarter and Year Ended December 30, Pilgrim s Pride Corporation (NASDAQ: PPC)
") Financial Results for Fourth Quarter and Year December 30, 2018 Pilgrim s Pride Corporation (NASDAQ: PPC) Cautionary Notes and Forward-Looking Statements Statements contained in this presentation that
Financial Results for Fourth Quarter and Year December 30, 2018 Pilgrim s Pride Corporation (NASDAQ: PPC) Cautionary Notes and Forward-Looking Statements Statements contained in this presentation that
Presentation 22 August 2018
 Presentation 22 August 2018 Exceeded 3YP targets in 2017, but 2018 is challenging due to continued destocking, store closures and bankruptcies Profit attributable to shareholders (like-for-like) down 19%
JBS Institutional Presentation Including 2Q15 Results. A Global Food Company
 JBS Institutional Presentation Including Q5 Results A Global Food Company JBS Global LTM to Q5 Net Revenue of R$37.8 billion Prepared & Others 30% Pork 0% LTM Revenue Q5 R$37.8 bi Poultry 0% Second largest
JBS Institutional Presentation Including 3Q14 Results
 JBS Institutional Presentation Including 3Q4 Results Disclaimer This release contains forward-looking statements relating to the prospects of the business, estimates for operating and financial results,
FOCUSED ON PROFITABLE, CONSISTENT GROWTH
 FOCUSED ON PROFITABLE, CONSISTENT GROWTH Investor Presentation August 2013 FORWARD-LOOKING STATEMENTS Certain information contained in this presentation may constitute forward-looking statements, such
Highlights of the third quarter of 2017
 Consolidated Highlights Free cash flow of R$ 500 million in 3Q17, double the amount generated in 2Q17. Selling, general and administrative expenses decrease 18% in 3Q17 compared to 3Q16, corresponding
Investor Presentation
 March, 2010 1 Disclaimer This document can contain statements which constitute forward-looking statements. Such forward-looking statements are dependent on estimates, data or methods that may be incorrect
Investor Presentation
 Investor Presentation 2017 www.gerdau.com 1 Outlook Gerdau Highlights 2 Region / Country (in Mt and %) 2017f 17/16 18/17 World 1,622 7.0% 1.6% European Union 162 2.5% 1.4% Better outlook for steel consumption
Latin America Equities
 Latin America Equities March 2013 Stephen Burrows, Senior Investment Manager Emerging Markets - Pictet Asset Management Dec-10 Feb-11 Apr-11 Jun-11 Aug-11 Oct-11 Dec-11 Feb-12 Apr-12 Jun-12 Aug-12 Oct-12
Charoen Pokphand Foods Plc.
 Charoen Pokphand Foods Plc. Content Quick Facts 9M13 Results September 30, 2013 Financial Status Appendix A: Product Sample & Retail Outlet Format B: Highlights: Q213 Results C: 3Yr Historical Results
INVESTOR PRESENTATION JANUARY 2018
 INVESTOR PRESENTATION JANUARY 2018 0 FORWARD-LOOKING STATEMENTS Forward-Looking Statements This presentation contains forward-looking statements that are subject to risks and uncertainties. All statements
menus around The World Y2009 Results 19 February 2010
 Charoen Pokphand Foods Plc. Enjoy menus around The World Y2009 Results 19 February 2010 Content Company s Brief Overview Highlights: 2009 Results Highlights: 31 Dec 09 Financial Status Appendix A: Acquisition
FONTERRA INTERIM RESULTS 2014
 FONTERRA INTERIM RESULTS 2014 Market Briefing FONTERRA CO-OPERATIVE GROUP LIMITED Overview John Wilson Chairman 2 Working Area Safee Copy Frame. This denotes working area and must be deleted before final
JBS S.A. A GLOBAL FOOD COMPANY 2017 Earnings Presentation. São Paulo
 JBS S.A. A GLOBAL FOOD COMPANY 2017 Earnings Presentation São Paulo DISCLAIMER We make statements about future events that are subject to risks and uncertainties. Such statements are based on the beliefs
Conference Call Second Quarter 2013 Financial Results. Presentation3
 Conference Call Second Quarter 2013 Financial Results Presentation3 August 2, 2013 Agenda 1 Agenda 1 2 Opening Remarks 2Q13 Highlights 3 Operating and Financial Review 4 Closing Remarks 5 Q&A 2 1 Alicorp
Investor Presentation
 March, 2010 1 Disclaimer This document can contain statements which constitute forward-looking statements. Such forward-looking statements are dependent on estimates, data or methods that may be incorrect
July 26, 2017 LafargeHolcim Ltd 2015
 Second Quarter 2017 Results Beat Hess, Chairman and Interim CEO Roland Köhler, Interim COO and Regional Head of Europe, Australia/NZ & Trading Ron Wirahadiraksa, CFO July 26, 2017 LafargeHolcim Ltd 2015
Economic Outlook. Macro Research Itaú Unibanco
 Economic Outlook Macro Research Itaú Unibanco June, 2013 Agenda Economia Global Heterogeneous growth: U.S. growing faster, Europe in recession. Deceleration in the emerging economies. The Fed signals a
Minerva Day November 10th, 2016
 Minerva Day November 10th, 2016 AGENDA 2:00pm 2017 Perspectives: Political and Economic Scenarios Keynote Speaker: Maílson da Nobrega Brazil s Former Minister of Finance 3:00pm Coffee Break 3:20pm Minerva
Continuous Improvement of Operating Performance Half Year Results 2014
 Continuous Improvement of Operating Performance Half Year Results 2014 Vernier, 17 July 2014 Gilles Andrier CEO Half Year Results 2014 Highlights Sales CHF 2.2 billion, up 4.5% on a like-for-like* basis
Earnings Release 2Q18
 Marfrig s Adj pro forma EBITDA grows 87% and reaches R$918 million São Paulo, August 14, 2018 Marfrig Global Foods S.A. Marfrig (B3 Novo Mercado: MRFG3 and Level 1 ADR: MRRTY) announces today its results
Peru s fundamentals and economic outlook Julio Velarde Governor Central Bank of Peru. March 2015
 Peru s fundamentals and economic outlook Julio Velarde Governor Central Bank of Peru March 2015 Agenda 1. Peru s growth is based on strong fundamentals 2. Recent economic developments and prospects 3.
Charoen Pokphand Foods Plc.
 Charoen Pokphand Foods Plc. DR Kurobuta Premium Pork W RLD 9M12: Results Briefing November 13, 2012 Content CPF in Brief 9M12 Results September 30, 2012 Financial Status Appendix A: Highlights: Q312 Results
2Q17 Earnings Release
 2Q17 Earnings Release Barretos, August 14, 2017 Minerva S.A. (BM&FBOVESPA: BEEF3 OTCQX: MRVSY), one of the leaders in South America in the production and sale of fresh beef, live cattle and cattle byproducts,
INVESTOR PRESENTATION JUNE 2018
 INVESTOR PRESENTATION JUNE 2018 0 FORWARD-LOOKING STATEMENTS Forward-Looking Statements This presentation contains forward-looking statements that are subject to risks and uncertainties. All statements
1. MESSAGE FROM MANAGEMENT
 MANAGEMENT REPORT 2016 The Management of Marfrig Global Foods ( Marfrig ) presents the Management Report and Financial Statements, accompanied by the reports of the Audit Board and Independent Auditors,
Operator: Fernando Galletti de Queiroz:
 4Q18 and 2018 TRANSCRIPTION 18 Operator: Good afternoon, ladies and gentlemen, and thank you for waiting. At this time, we would like to welcome everybody to Minerva s 4Q and year of 2018 results conference
Institutional Presentation. March
 Institutional Presentation March 2013 Marisa at a glance Largest women fashion and lingerie retailer in Brazil 64 years of track record Focus on the middle class National footprint 2 Multiformat store
Disclaimer. by these forward-looking statements. Many of the factors that will determine these results and
 October, 2010 Disclaimer The forward-looking statements presented herein are subject to risks and uncertainties. These statements are based on the beliefs and assumptions of our management, and on information
Unilever Investor Event 2018 Graeme Pitkethly 4 th December 2018
 Unilever Investor Event 2018 Graeme Pitkethly 4 th December 2018 SAFE HARBOUR STATEMENT This announcement may contain forward-looking statements, including forward-looking statements within the meaning
Peru s Fundamentals and Economic Outlook
 Peru s Fundamentals and Economic Outlook Julio Velarde Governor Central Bank of Peru October 2016 Content 1. Slow Global Recovery 5. Gradual withdrawal of monetary stimulus 2. Reversal in Peru s external
Localiza Rent a Car S.A.
 Localiza Rent a Car S.A. Confins airport branch Belo Horizonte 24h reservation 0800 979 2000 www.localiza.com 1 Integrated business platform 28,080 cars 172 agencies 1.2 million clients 16,600 cars 405
Investor Presentation
 Investor Presentation 2017 www.gerdau.com 1 Outlook Gerdau Highlights 2 Region / Country (in Mt and %) 2017f 17/16 World 1,622 7.0% European Union 162 2.5% Better outlook for steel consumption NAFTA 139
Earnings Presentation FIRST QUARTER 2016
 Earnings Presentation FIRST QUARTER 2016 Agenda 1 Highlights of the period 2 Consolidated overview 3 Overview by Business Units 4 Overview by Country 5 Balance Sheet Financials 6 Q&A First Quarter Highlights
Fixed Income Presentation 1Q18
 Fixed Income Presentation 1Q18 1 Agenda 1. Company Overview 2. Investment Highlights 3. Operating and Financial Highlights 2 Section 1 Company Overview 3 Company Overview Company Overview Competitive Advantages
Fixed Income Presentation 4Q17
 Fixed Income Presentation 4Q17 1 Agenda 1. Company Overview 2. Investment Highlights 3. Operating and Financial Highlights 2 Section 1 Company Overview 3 Company Overview Company Overview Competitive Advantages
Charoen Pokphand Foods Plc.
 Charoen Pokphand Foods Plc. 1Q14 RESULTS BRIEFING May 15, 2014 Content Business Overview Q12014 Results Briefing Financial Highlights Future Plan Appendix A: Product & Raw Materials Price Trend B: Product
Interim Results. For the six months ended June 30, 2011
 Interim Results For the six months ended June 30, 2011 Agenda Business and Financial Highlights Business Overview Financial Overview Concluding Remarks 2 Business Highlights in 1H 2011 Significant sales
1. MESSAGE FROM MANAGEMENT
 The Management of Marfrig Global Foods ( Marfrig ) presents the Management Report and Financial Statements, accompanied by the reports of the Audit Board and Independent Auditors, for the fiscal year ended
Fixed Income Presentation 3Q17
 Fixed Income Presentation 3Q17 1 Agenda 1. Company Overview 2. Investment Highlights 3. Operating and Financial Highlights 2 Section 1 Company Overview 3 Company Overview Company Overview Competitive Advantages
MASISA OVERVIEW & HIGHLIGHTS STRATEGY FINANCIAL PROFILE
 October 2017 MASISA OVERVIEW & HIGHLIGHTS STRATEGY FINANCIAL PROFILE Overview Masisa is a leading integrated company focused on fiberboard and particleboard production and marketing for furniture and interior
Business & Operating Review
 Business & Operating Review 0 This presentation may contain financial or business projections regarding recent acquisitions, their financial or business impact, management expectations and objectives regarding
Charoen Pokphand Foods Plc.
 Charoen Pokphand Foods Plc. 9M2014 : RESULTS BRIEFING November 10, 2014 Content Business Overview 9M2014 Results Briefing Financial Highlights Future Plan CPF Investment Highlights A leading global vertically
Agenda. 1. Highlights FY 2012 Results. 2. Operational Performance Priorities for Financials. 5. Conclusion
 1MARCH 2013 Legal Disclaimer Information in this presentation may involve guidance, expectations, beliefs, plans, intentions or strategies regarding the future. These forward-looking statements involve
EAST BALT BAKERIES July 2017 ACQUISITION
 EAST BALT BAKERIES July 2017 ACQUISITION E AST BA LT AT A G L A N C E Leading foodservice-focused company that supplies baked goods to Quick Service Restaurants ( QSR ) across the world Operates 21 bakeries
Valid reports Net Revenue of R$412.1 million in 3Q17, down 3.2% from 3Q16 and up 5.2% from 2Q17.
 Valid reports Net Revenue of R$412.1 million in, down 3.2% from and up 5.2% from 2Q17. Rio de Janeiro, November 8 th 2017 Valid (B 3 : VLID3 - ON) announces today its results for the third quarter of 2017
Investor Presentation. February 2008
 Investor Presentation February 2008 1 1 Highlights Among the most competitive steel companies in the world Strong low cost structure as a result of diversified production processes and multiple raw material
EU Market Situation for Eggs. Committee for the Common Organisation of the Agricultural Markets 30 August 2018
 EU Market Situation for Eggs Committee for the Common Organisation of the Agricultural Markets 30 August 2018 F O R E C A S T EU production of eggs for consumption (expert forecast May 2018) Source : Experts
INVESTMENT MARKET UPDATE UBC FACULTY PENSION PLAN
 INVESTMENT MARKET UPDATE UBC FACULTY PENSION PLAN MIKE LESLIE, FACULTY PENSION PLAN NEIL WATSON, LEITH WHEELER FEBRUARY 12, 2014 Presenters Mike Leslie Executive Director, Investments Faculty Pension Plan
H RESULTS PRESENTATION
 H1 2018 RESULTS PRESENTATION 03.09.2018 H1 2018 RESULTS PRESENTATION DISCLAIMER This presentation (the "Presentation") has been prepared and is issued by, and is the sole responsibility of Telepizza Group,
2010 Results. Paris - March 2, 2011
 2010 Results Paris - March 2, 2011 > Highlights of 2010 > Financial results > Strategy and outlook 2010 Results 2 2010: A Year of Acceleration Highlights of 2010 Revenue of 3,892m, up 19.1% Operating profit
Inghams Group Limited. FY2018 Results Presentation
 Inghams Group Limited FY2018 Results Presentation 22 AUGUST 2018 Important notice and disclaimer Disclaimer The material in this presentation is general background information about the activities of Inghams
Agenda. 1. Highlights 9M 2013 Results. 2. Financials. 3. Conclusion
 1November 2013 Legal Disclaimer Information in this presentation may involve guidance, expectations, beliefs, plans, intentions or strategies regarding the future. These forward-looking statements involve
Third Quarter 2017 Results Jan Jenisch, CEO Ron Wirahadiraksa, CFO. October 27, 2017 LafargeHolcim Ltd 2015
 Third Quarter 2017 Results Jan Jenisch, CEO Ron Wirahadiraksa, CFO October 27, 2017 LafargeHolcim Ltd 2015 01 Initial views Q3 2017 and Outlook Jan Jenisch, Chief Executive Officer 2017 LafargeHolcim 2
PREMIUM BRANDS HOLDINGS CORPORATION ANNOUNCES RECORD SECOND QUARTER SALES AND EARNINGS AND DECLARES THIRD QUARTER DIVIDEND
 PREMIUM BRANDS HOLDINGS CORPORATION ANNOUNCES RECORD SECOND QUARTER SALES AND EARNINGS AND DECLARES THIRD QUARTER DIVIDEND VANCOUVER, B.C., August 13,. Premium Brands Holdings Corporation (TSX: PBH), a
2018 Half Year Results
 A GLOBAL LEADER IN METAL FLOW ENGINEERING 2018 Half Year Results 26 July 2018 Patrick André Chief Executive 1 Disclaimer This presentation, which has been prepared by Vesuvius plc (the Company ), includes