Marfrig Global Foods. December 2016
|
|
|
- Jean Gibbs
- 5 years ago
- Views:
Transcription
1 Marfrig Global Foods December 2016
2 Disclaimer This material is a presentation of general information about Marfrig Global Foods S.A. and its consolidated subsidiaries (jointly the Corporation ) on the date hereof. The information is presented in summary form and does not purport to be complete. No representation or warranty, either expressed or implied, is made regarding the accuracy or scope of the information herein. Neither the Company nor any of its affiliated companies, consultants or representatives undertake any responsibility for any losses or damages arising from any of the information presented or contained in this presentation. The information contained in this presentation is up to date as of September 30, 2016, and, unless stated otherwise, is subject to change without prior notice. Neither the Corporation nor any of its affiliated companies, consultants or representatives have signed any commitment to update such information after the date hereof. This presentation should not be construed as a legal, tax or investment recommendation or any other type of advice. The data contained herein were obtained from various external sources and the Corporation has not verified said data through any independent source. Therefore, the Corporation makes no warranties as to the accuracy or completeness of such data, which involve risks and uncertainties and are subject to change based on various factors. This presentation includes forward-looking statements. Such statements do not constitute historical fact and reflect the beliefs and expectations of the Corporation s management. The words anticipates, hopes, expects, estimates, intends, projects, plans, predicts, projects, aims and other similar expressions are used to identify such statements. Although the Corporation believes that the expectations and assumptions reflected by these forward-looking statements are reasonable and based on the information currently available to its management, it cannot guarantee results or future events. Such forward-looking statements should be considered with caution, since actual results may differ materially from those expressed or implied by such statements. Securities are prohibited from being offered or sold in the United States unless they are registered or exempt from registration in accordance with the U.S. Securities Act of 1933, as amended ( Securities Act ). Any future offering of securities must be made exclusively through an offering memorandum. This presentation does not constitute an offer, invitation or solicitation to subscribe or acquire any securities, and no part of this presentation nor any information or statement contained herein should be used as the basis for or considered in connection with any contract or commitment of any nature. Any decision to buy securities in any offering conducted by the Corporation should be based solely on the information contained in the offering documents, which may be published or distributed opportunely in connection with any security offering conducted by the Company, depending on the case. 2
3 Agenda Marfrig Overview Business Units: Differentials and Strategy Keystone Foods Beef Global scenario 3Q16 Financials Why Marfrig? 3


4 Marfrig Track Record Marfrig IPO Novo Mercado Major Acquisitions Moy Park Seara Keystone Optimization of organizational structure without loosing global footprint Diversified geographic presence in animal protein, serving the retail and food service channels Growth based on acquisitions International footprint High Leverage Seara Sale Moy Park Sale Focus to Win Productivity agenda Operational improvements at BU s Liability management and debt reduction One of the world s top beef producers and one of South America s largest lamb suppliers One of the world s largest suppliers of processed food to food service 4

5 Strategic Actions FOCUS TO WIN VALUE LEVERAGE ACTIONS Continuous operational improvement and increased operating cash flow Searching for productivity + synergies Streamlining Beef Brazil production units Improving Brazil sales mix Selling non core assets Adjusting the capital structure and reducing borrowing costs Closing of Moy Park sale Implementing ongoing Liability Management Profitable growth and global leadership in foodservice Prioritizing organic growth opportunities at Keystone Consolidating operating improvements at Beef GREATER VALUE TO SHAREHOLDERS 5

6 Marfrig at a glance 47 commercial, Presence in Serving global retail production and countries in the 12 and food chains distribution Americas, Europe, Asia in close to units and Oceania countries 100 R$ billion* Market Cap: 3.9 Enterprise Value: 10.0 * As of December, 2016 Production Plants Distribution Centers Commercial Units Marfrig s strategy is to continue growing globally in valueadded protein products, increasing its focus on the food service segment, and taking advantage of its highly competitive and geographically diversified basis to supply beef from South America 6
 15.9 21.9 23.7 18.8 15.2 18.9 14.3 9.")


7 Corporate Profile Net Revenue (1) (R$ billion) M16 Notes: (1) historical figures include continued and discontinued operations. Revenue Breakdown 9M16 % by Business % by Product % by Currency 15% 7% 21% 35% 50% 37% 56% 26% 53% Keystone USA & APMEA Beef Brazil Beef International Processed Fresh Beef Other US$ Real Other 7

8 Global Scenario Highlights
9 Global Beef Growth Beef consumption growth is expected to be driven by emerging markets, especially in Asia and Middle East, where beef demand should remain robust and is expected to be supported by strong growth in imports China has become a relevant beef consumer, going from 1 million tons/year in 1990 to more than 7 million tons/year in 2015, representing 13% of world consumption, and growth is expected to continue Selected Countries Beef Consumption Selected Countries Beef Imports 10 8 Million tons/year CAGR : 6.9% 16% of world total Thousand Tons % 21% 57% 20% 7% E China Egypt Iran Malaysia Saudi Arabia Source: USDA (updated October 25, 2016) China Chile Iran Malaysia Saudi Arabia E 2017E 9
10 South America Beef Export Platform Brazil, Argentina and Uruguay together form the world's largest beef production region with the greatest growth potential Extensive production with strategic use of feedlot operations Excellent sanitary conditions with tracking Abundance of land, water and labor Management expertise, well adapted breeds and growing use of genetic enhancement Region is already a major global beef supplier, mainly Brazil and Uruguay Beef Cattle Herd (million heads) Beef Production (million tons) Beef Exports (million tons) Argentina Australia Brazil US Uruguay Argentina Australia Brazil US Uruguay Argentina Australia Brazil US Uruguay E Source: USDA (updated October 25, 2016) E E 10

11 Global Poultry Growth Poultry is the fastest growing protein in developed and emerging markets - Growth in developing markets is expected to be 2x the growth in developed markets Strong consumer demand due to poultry s lean / low fat profile, adaptability / versatility in preparation and relative cost advantage versus other proteins 17 U.S. Chicken Consumption Million Tons 15.7 Poultry Meat Consumption CAGR % 15 Developing 2.7% World 2.3% Developed 1.5% E 2017E 0.0% 0.5% 1.0% 1.5% 2.0% 2.5% 3.0% Source: USDA (updated October 25, 2016), National Chicken Council and OECD-FAO Agricultural Outlook via Watt Global Media 11

 Global Fast")

12 Global QSR Industry The Global Fast Food market is expected to grow from a US$635 billion market in 2013 to US$860 billion market in 2018, a 6.2% CAGR North America is the largest market in the industry and is projected to remain the largest by 2018 Asia-Pacific share of the global market is set to rival North America in size by 2018 Global Fast Food Market (2018E US$860 billion) Global Fast Food Market CAGR % North America 4% Australasia Western Europe 1.5% 4.4% Latin America Eastern Europe Western Europe Australasia Asia Pacific Middle East & Africa 34% 2% 12% Source: Euromonitor International, November % 3% 35% North America Global Latin America Asia-Pacific Eastern Europe Middle East & Africa 4.9% 6.2% 7.2% 7.4% 10.3% 11.6% 12


13 Keystone Foods
14 Keystone Profile Diversified food company focused on valueadded protein to the Food Service industry (US/APMEA) - Revenues of US$2.0 billion in 9M16 - Focus on QSR Revenue Breakdown 9M16 % by Market 71% 29% - Poultry, beef, pork, fish and other (bakery, etc.) USA APMEA Key partner of several leading brands - 40 year relationship with McDonald s - Strategic supplier for Wendy s, Subway, Iceland Foods, Campbell s amongst other Poultry vertical integration in the U.S. covering 70%+ of the supply, largely through contract growers - Global slaughtering capacity of over 4.5 million head per week % by Protein 76% 19% 5% Poultry Beef Other % by Customer 57% 43% McD Key Accounts 14

 and 1 primary processing plant 2 innovation centers 55 million birds/year 195,000")
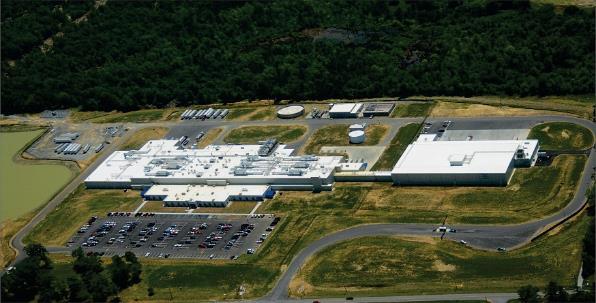
15 Keystone Production Structure United States Slaughtering Processed food Other Slaughtering Processed food Other 3 integrated poultry complexes and 7 processing plants 1 R&D facility 198 million birds/year 390,000 tons of processed food/year APMEA Countries: Australia, China, Malaysia, South Korea and Thailand Further processing plants (5 multi-protein, 3 poultry and 1 beef) and 1 primary processing plant 2 innovation centers 55 million birds/year 195,000 tons of processed food/year 15

16 Keystone US Vertical Integration Keystone Farm System 19 Pullet Farms 3 owned by Keystone 61 Breeder Farms 1 owned by Keystone 296 Broiler Farms 1 owned by Keystone Supply Control Keystone sources 70%+ of its U.S. poultry needs from vertically integrated system; purchases remainder from the market 16


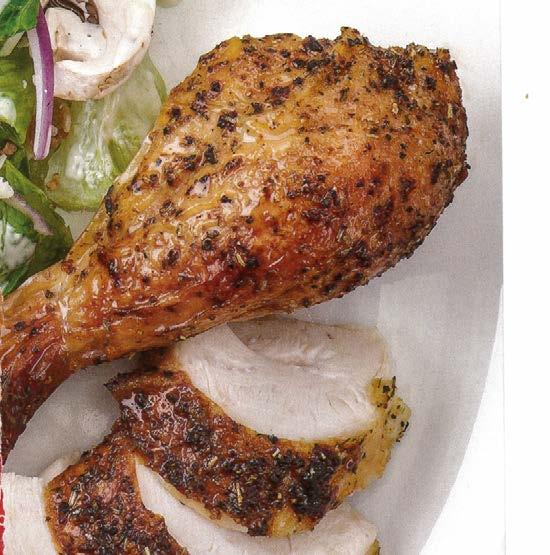
17 Keystone US Poultry Key Categories Ready-to-Cook Par Fried Poultry Fully Cooked/ Frozen Poultry Fresh/Deli Rotisserie Tenders, filets, patties, wings and nuggets Largest product type Primarily marketed to QSR chains like McDonald s, Wendy s Diced chicken, strips, filets, patties, wings Second largest product type Marketed to branded consumer companies like Campbell s, Nestlé and ConAgra Frozen Food Whole chickens without giblets, 8-piece cut-up Includes other value-added marinated products for QSRs like Zaxby s Marketed to major retailers and club stores like Publix, Sam s Club and Wegmans 17


18 Keystone US Beef & Fish Key Categories Beef Patties Fish Patties Leading supplier to McDonald s Keystone has the largest beef patties plant in US Strategic supplier to McDonald s 18


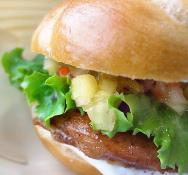
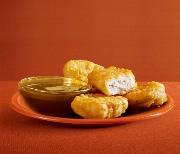
19 Keystone APMEA Key Categories Poultry Products Broad range of chicken products Primarily marketed to western QSR chains and local APMEA clients Beef Products Beef produced all facilities Products marketed to western QSRs and local APMEA clients Beef Patties Beef Patties Chicken Nugget Chicken Patty Chicken Strips Pork, Fish & Other Bacon produced in non-halal facilities; also manufacture Halal substitutes for bacon Fish patties and bakery items Middle Wing Wing Stick Spicy Wing Fish Patties Halal Bacon Substitute Cheesecake 19
20 Keystone Strategic Goals Leverage Global Poultry Demand Key Account Penetration Geographic Expansion 20


 430 531 561 681 754")

21 Key Accounts Accelerate Growth Significant business with global brand players in the QSR, foodservice, retail and industrial channels Key Account Further Processing and Value Added Sales (US$ million) APMEA USA Q16LTM Select Key Accounts 21


22 APMEA Differentiated Positioning Keystone is well positioned to capture growth in the region with operations in the high-growth markets local production over 20 years present in the region food safety acknowledgement in the industry Select Clients Slaughtering Processing Others 도니버거숙대점 -Doni Burger 22

23 APMEA Differentiated Positioning China Complete country coverage Global QSR, local QSR, Food Service, Retail Thailand Export-oriented, Japan, UK, EU, Singapore Retail, Food Service, QSR Local QSR QSR Global Retail Food Service Local Food Service Exports South Korea Domestic focus Global QSR, local food service Australia Beef focus Global QSR Malaysia Halal hub for the region Malaysia, Middle East, Singapore Retail & export, Halal certification 23


24 Food Safety & Quality Strong Reputation Food safety expectations continue to increase around the world, and Keystone s program is among the best Recognized Leadership in Food Safety Leader in Anticipatory Issue Management Award Winning Product Quality 24

 and Thailand to continue to develop new tastes and products")
25 Keystone Other Differentials Research & Development of New Product / Innovation Partnership with our customers to develop customized and innovative food solutions A USDA-inspected, state-of-the-art R&D facility in the U.S. Establishing 2 innovation centers in Shanghai (China) and Thailand to continue to develop new tastes and products for our customers 25

26 Beef
 in 9M16 - Vast brand portfolio, with increasing export focus Revenue Breakdown 9M16 % by Channel/ Market 71% 29% One of the world s top beef producers, 2 nd in Brazil")
27 Beef Profile Beef and lamb-based meatpacker with wide footprint in South America - Revenues of R$7.3 billion (51% of Marfrig Group) in 9M16 - Vast brand portfolio, with increasing export focus Revenue Breakdown 9M16 % by Channel/ Market 71% 29% One of the world s top beef producers, 2 nd in Brazil and 1 st in Uruguay Beef Brazil Beef International Unique South American footprint - 27 production sites and 7 distribution centers in Brazil, Uruguay, Argentina and Chile - Unique positioning in the South American beef region, enhances local and international competitiveness and sanitary risk control % by Protein 76% 10% 14% Fresh Beef Processed Lamb, Leather and Other 27
28 Beef Production Structure 10 production units Brazil 2.7 million cattle heads/year of operating authorized capacity 2.2 million cattle heads/year of effective capacity 380 thousand heads of lamb/year Uruguay, Argentina and Chile 8 production units 1.1 million heads of cattle/year 2.0 million heads of lamb/year Slaughtering Processed food Slaughtering/Processing Distribution Center Other 28
29 Beef Key Strategic Goals Grow volume and average prices Maximize South America s exporting platform 29

 Growth in Revenue per Sales Rep 15 (R$ million/salesman) 18 25 27")


30 Beef Brazilian Market Food service Strategy to optimize the sales team with a view to boost productivity implemented Improvements in service quality level in all segments (OTIF, on-time delivery, etc.) Growth in Revenue per Sales Rep 15 (R$ million/salesman) Retail Focus to grow volume on small/medium retail channel Partnership with large retailers in portioned cuts products New strategically located DCs and commercial partnerships in North/Northeast regions Innovation and brand management dedicated to higher-margin products
31 Beef Brazil Exports The opening of new markets promotes growth in exports for Brazilian beef 9M16 Export destinations Beef Brazil (% on revenues) Main Importers USA Russia Japan Status for Brazilian Exports Newly opened Open Closed 3% 16% 1% 40% 18% 22% Hong Kong China South Korea Open Newly opened Closed Share of Exports Beef Brazil (% on revenues) E.U. Canada Open / Hilton Closed 44% 48% 44% Mexico Closed Egypt Open Venezuela Open Saudi Arabia Newly opened LTM 31

32 Beef Uruguay Exports Uruguay has access to the main beef import markets 9M16 Export destinations Beef Uruguay (% on revenues) Main Importers Status for Uruguayan Exports 20% 28% 13% 31% USA Russia Open Open 7% 1% Japan In Negotiation Hong Kong China South Korea E.U. Canada Open Open Open Open/Hilton Opem Share of Exports Beef Uruguay (% on revenues) 62% 58% 60% Mexico Open Egypt Open Venezuela Open Saudi Arabia Open LTM 32


33 Beef Relationship programs 33


34 Beef Sustainability Marfrig club promotes the production of sustainable, safe and legal beef 4,146 farm members as of December 2015 Marfrig Tacuarembó plant started the Organic Meat Program in 2000 Meat is free from synthetic fertilizers, anabolic hormones and growth stimulants. Cattle is grass-fed only Marfrig is a signatory of the Criteria for Industrial Scale Cattle and Beef Products Operations in the Amazon Biome Monitor regularly by satellite all the suppliers located in the Amazon Biome to ensure that animals do not come from newly deforested areas, indigenous land and conservation areas 26 million hectares monitored by Marfrig Marfrig was the pioneer in Brazil to sell products with the Rainforest Alliance Certified seal. The certificate attests that the beef was produced in accordance with sustainable environmental, social and economic practices as well as good animal welfare and production management practices 34

35 Beef Animal Welfare In line with EU Regulation 1099/09 Written procedures for Animal Welfare assurance within our production plants Infra-structural and handling techniques improvements Continuous communication and reporting to farmers on bruise occurrence Investing in continuous training Marfrig Club Check-List Dedicated in-house Department for Animal Welfare Training of people handling animals Modern fleet for Cattle Transportation Animal Welfare Officers in all slaughtering plants Stunning Box and Pistol in all the plants Marfrig improved one tier in the ranking published by the BBFAW, which recognizes companies with the world s best animal welfare practices. In the BBFAW s 2015 Report, the Company was classified as Tier 2 and is the bestpositioned Brazilian multinational company. 35
36 Financial Results 3Q16
37 Guidance Revision Original Target Revised Target 2016 (1) 2016 (4) Net Revenue R$22 to R$24 billion R$19 to R$20 billion Adjusted EBITDA Margin (2) 8.5% - 9.5% 8.5% 9.0% CAPEX R$450 to R$600 million R$450 to R$550 million Free Cash Flow (3) R$100 to R$250 million R$0 to R$100 million (1) Assumptions based on exchange rate of R$4.10/US$1.00. (2) Excludes non-recurring items. (3) Operating cash flow after capital expenditures, interest expenses and income tax. (4) Assumptions based on the exchange rate of R$3.47/US$1.00 (average exchange rate: 1Q16 - R$3.91; 2Q16 - R$3.51; 3Q16 - R$3.25; 4Q16e - R$3.20/US$1.00). 37
38 Guidance 2016 and 9M16 Revised Target 2016 (1) 9M16 Net Revenue R$19 a 20 billion R$14 billion Adjusted EBITDA Margin (2) 8.5% 9.0% 8.4% CAPEX R$450 to R$550 million R$344 million Free Cash Flow (3) R$0 to R$100 million R$(29) million (1) Assumptions based on exchange rate of R$3.47/US$1.00. (2) Excludes non-recurring items. (3) Operating cash flow after capital expenditures, interest expenses and income tax. 38

39 Financial Performance Consolidated Net Revenue (R$ million) 3Q16 Revenue Breakdown -13% 15% 5,120 4,451 By Business 35% 50% Keystone USA & APMEA Beef Brazil Beef International 3Q15 3Q16 21% The decline in net revenue was due to the effects from the 8.5% Brazilian real appreciation against the U.S. and lower volume, partially offset by better prices in Brazilian domestic market. By Currency 26% US$ Real Other 53% 39
 11.4% 10.")


40 Financial Performance Consolidated Gross Profit and Gross Margin (R$ million and %) 11.4% 10.9% Adjusted EBITDA and Margin (R$ million and %) 9.1% 7.7% -17% -27% Q15 3Q16 3Q15 3Q16 3Q15 3Q16 Gross Profit impacted by the margin retraction and volume of Beef Division, partially offset by the strong Keystone result. EBITDA Breakdown 59% 41% 41% 59% Keystone Beef 40

41 Net Income/Loss Consolidated Net Loss (R$ million) 3Q15 3Q16 9M15 9M16 (170) (485) (743) (1,352) In 3Q16, the net result of continued operations* posted a net loss of R$170 million, improving R$573 million from the same quarter last year. On the same basis, the accumulated loss for the year was R$485 million, improving R$867 million from the same period of *Results from Continued Operations exclude the results from asset and equity interest divestments. 41
42 Keystone Highlights % Key Accounts Net Revenue (US$ million) 26% 31% -1% Adjusted EBITDA and Margin (US$ million and %) 7.7% 9.0% +16% Q15 Total Volume (Thousand Tons) Q15 +2% 3Q16 3Q16 3Q15 Double digit EBITDA growth: 3Q16 Continued Key Accounts expansion growth and improved product mix (NAE) in the U.S.; Improved U.S. export sales price; Strong growth in Australia and Malaysia. Net revenue impacted by lower US beef prices. 42
 27% 285 259 91 57 193 202 3Q15-9% 3Q16 3Q16 40% % sales to Asia 3Q15 3Q16 The negative")
43 Beef Highlights Net Revenue (R$ million) -16% Adjusted EBITDA and Margin (R$ million and %) 10.5% 6.3% 2,631 2,215-50% 42% 1, ,315 1,453 40% % food service Brazil Q15 Total Volume (Thousand Tons) 27% Q15-9% 3Q16 3Q16 40% % sales to Asia 3Q15 3Q16 The negative impact of the appreciation of real and the lower sales volumes were partially offset by domestic market prices. Reduction of the pace of exports to seek price improvement. EBITDA negatively impacted by the retraction of the sector's export spreads and lower sales volume. 43
 3.1x 3.4x Net Debt / EBITDA LTM (Excl.")
44 Debt Maturity Schedule & Ratios Gross Debt (R$ and US$ billion ) 5,731 +6% R$ million 1, ,007 2,102 2,020 1,285 3,129 Cash & Equiv US$ 2Q16 3Q Ratios 2Q16 3Q16 Leverage: Net Debt / adj. EBITDA LTM Continued Operations (excl. capital gains) 3.1x 3.4x Net Debt / EBITDA LTM (Excl. FX Variation) 1.1x 2.3x Managerial Indicators: Average Cost (p.a.) 7.3% 7.4% Current Liquidity Duration (years) Net Debt (R$ and US$ billion ) Q16 +1% 3Q16 US$
 (292)")

45 3Q16 Cash Flow Consolidated R$ million 537 (175) (292) (31) CFO Capex Interests FCF Descontinued 39 Total FCF 45
46 Bonds & Rating Issued Bonds Maturity Currency Notion Cupom 2018 USD mm 8.375% 2019 USD mm 6.785% 2020 USD mm 9.500% 2021 USD 27.8 mm % 2023 USD 1.0 bn 8.000% Rating Agency National Scale Int l Scale Perspective S&P br BBB B+ Positive FitchRatings A bra BB- Stable Moody s - B2 Stable 46
47 Why Marfrig?

48 Peers Potential catch up (SOTP valuation) EV/EBITDA 2016e 16.3x Average*: 8.9x 12.2x 12.6x 9.9x 11.5x 6.6x 5.7x 6.6x 6.2x 5.0x Peer 1 Peer 2 Peer 3 Peer 4 Peer 5 Peer 6 Peer 7 Peer 8 Peer 9 Peer 10 Marfrig is trading 39% below its EV/EBITDA peers average; Potential upside: Interest savings (BNDES conversion + cost reduction) Competitive assets with broad position in South America Keystone: a large protein player in the global market highly diversified (geographic and product portfolio) * 50% Beef s peers + 50% Keystone peers 48
49 Why Marfrig? Leading Player One of the largest and most diversified protein player worldwide; Solid position, strategic and diversified supplier of protein in the US QSR, foodservice and retail channels; and Leading protein supplier for APMEA region and well positioned to capture market increase in Asia and Middle East; One of the dominant players in South America: main region to support the growing international demand with grass fed, hormonfree beef; Largest player in Uruguay, already supplying in the US market, with high quality, organic and fully traceable meat. 49
50 Attached files
51 Corporate Structure Audit Committee Marcelo Correa Marcos Molina Chairman of the Board Martin Secco CEO - Marfrig Global Foods Finance Committee Carlos Langoni HR and Corporate Governance Committee Antonio Maciel CEOs - Business Units Corporate Vice-Presidents Heraldo Geres VP Legal & HR Andrew Murchie Beef Brazil Marcelo Secco Beef Southern Cone Frank Ravndal Keystone Foods Eduardo Miron VP Finance - CFO & IRO 51

52 Shareholder structure MMS BNDES Participações Brandes Investments Skagen AS Management +Treasury Float-Others 35.8% 19.6% 10.4% 4.8% 0.0% 29.4% As of December
 R$ 100 to R$ 200 million R$ 213 million For the third consecutive year 2015 (1) Assumptions based on exchange rates of R$2.70/US$1.")
53 Guidance 2015 Net Revenue Target (1) Combined (4) R$ 23 to R$ 25 billion R$ 25 billion 2013 Adjusted EBITDA Margin (2) 8.0% - 9.0% 8.5% CAPEX R$ 650 million R$ 556 million 2014 Free Cash Flow (3) R$ 100 to R$ 200 million R$ 213 million For the third consecutive year 2015 (1) Assumptions based on exchange rates of R$2.70/US$1.00 and R$4.30/ (2) Excludes non-recurring items. (3) Operating cash flow after capital expenditures, interest expenses and income tax. (4) Pro-forma non-audited values, including the discontinued operations: Moy Park, Argentina Marfood and MFG Agropecuária. Excludes the capital gain from the Moy Park divestment. Combined net revenue only includes nine months of Moy Park (Januray to September 20115) 53


54 Sales Beef Brazil Growth in Premium Brands sales volume Exponential growth of export sales to China 14x +73% +90% + + Demand Planning Proper Variable Compensation + + Routing Field Technology + + Sales Process Management System In December 2015, China (ex-hong Kong) accounted for 15% of exports and was our 2 nd main destination 54
55 Liability Management Process (1/3) Initiatives Bond Repurchase 4Q15 Tender Offer Spot Market US$375m US$59m The total face value of the senior notes repurchased amounted to US$470 million, of which US$64 million have not been canceled yet and therefore are still part of the Company s gross debt. Face Value Face Value Compared to the 3Q15, gross debt was reduced by US$684 million. US$406m US$64m 55

56 Liability Management Process (2/3) Keystone credit lines 4Q15 - Amendment and extension of existing credit lines: Limit: + USD 270 million Maturity: + 2 years Line Limit Maturity Rate Values in U$ million From To From To From To Revolver Libor+ 150 to 250 bps Term Loan Libor+ 175 to 275 bps Total Libor+ 125 to 225 bps Libor+ 150 to 250 bps Pool of 20 Banks, with Rabobank as the lead arranger. 56
 1,200 1,000 After Avg. Term : 4.")

57 Liability Management Process (3/3) In USD 1,200 1,000 Before* Avg. Term: 2,7 years Bonds Maturity Schedule (pro forma) 1,200 1,000 After Avg. Term : 4.7 years *1Q Opening Balance 184m 153m 567m 660m 670m 28m Issuance Call 1.0bn Repurchase 184m 153m 285m 185m Closing Balance 282m 660m 485m 28m 1.0bn 57
58 Investor Relations
EARNINGS CONFERENCE CALL
 EARNINGS CONFERENCE CALL AUGUST 15, 2017 INVESTOR RELATIONS Disclaimer This material is a presentation of general information about Marfrig Global Foods S.A. and its consolidated subsidiaries (jointly
Earnings Conference Call 2Q18. August 15, 2018
 Earnings Conference Call August 15, 2018 Disclaimer This material is a presentation of general information about Marfrig Global Foods S.A. and its consolidated subsidiaries (jointly the Corporation ) on
Meeting with. Investors. 4Q17 results. March 2018
 Meeting with Investors 4Q17 results March 2018 Disclaimer This material is a presentation of general information about Marfrig Global Foods S.A. and its consolidated subsidiaries (jointly the Corporation
Positive Free Cash Flow of R$39 million in 3Q16
 3Q16 Earnings Release Positive Free Cash Flow of R$39 million in 3Q16 São Paulo, November 10, 2016 Marfrig Global Foods S.A. Marfrig (BM&FBovespa Novo Mercado: MRFG3 and Level 1 ADR: MRTTY) announces today
Marfrig Day. March, 2015
 Marfrig Day March, 2015 2 Agenda Marfrig Day São Paulo 1. Introduction. 15 min 2. Moy Park... 20 min 3. Keystone... 20 min 4. Marfrig Beef... 20 min 5. 4 th Quarter 2014 Consolidated Results... 20 min
TRANSACTION. April 9th, 2018
 TRANSACTION + April 9th, 2018 1 REDIRECTING THE GROWTH STRATEGY OF ITS DIVISIONS: - BEEF CORE BUSINESS WE HAVE TWO PROJECTS (1ST HALF 2018) I. AQUISITION OF MAJORITY STAKE AT NATIONAL BEEF, ADDING TO THE
Earnings Conference Call 3Q18. November 06, 2018
 Earnings Conference Call 3Q18 November 06, 2018 Disclaimer This material is a presentation of general information about Marfrig Global Foods S.A. and its consolidated subsidiaries (jointly the Corporation
POSITIVE CASH FLOW OF R$43 MILLION IN 4Q15
 4Q15 and 2015 Earnings Release POSITIVE CASH FLOW OF R$43 MILLION IN 4Q15 São Paulo, February 29, 2016 Marfrig Global Foods S.A. Marfrig (BM&FBOVESPA NOVO MERCADO: MRFG3 and Level 1 ADR : MRTTY) announces
Positive free cash flow of R$68 million in 4Q16
 Positive free cash flow of R$68 million in São Paulo, February 23, 2017 Marfrig Global Foods S.A. Marfrig (BM&FBOVESPA Novo Mercado: MRFG3 and Level 1 ADR: MRTTY) announces today its results for the fourth
Earnings Conference Call. 4Q18 and February 28, 2018
 Earnings Conference Call 4Q18 and 2018 February 28, 2018 Disclaimer This material is a presentation of general information about Marfrig Global Foods S.A. and its consolidated subsidiaries (jointly the
JBS S.A. August / September, 2013
 JBS S.A. August / September, 2013 Disclaimer This release contains forward-looking statements relating to the prospects of the business, estimates for operating and financial results, and those related
Institutional Presentation. December, 2014
 Institutional Presentation December, 2014 Marfrig Global Foods Profile 3 History and Overview 1986: Startup of operations in Brazil with the distribution of premium beef cuts 1986-2005: Diversification
NET REVENUE OF R$5.9 BILLION 23% OVER 1Q14
 MARFRIG ENCERRA CONSOLIDATED O ANO RESULTS COM ENTREGA FOR 1Q2015 DE GUIDANCE E NET REVENUE OF R$5.9 BILLION 23% OVER 1Q14 São Paulo, May 8, 2015 Marfrig Global Foods S.A. - Marfrig (BM&FBovespa Novo Mercado:
MARFRIG New structure. Investor Relations September,
 MARFRIG New structure Investor Relations September, 4 2018 Disclaimer This material is a presentation of general information about Marfrig Global Foods S.A. and its consolidated subsidiaries (jointly the
2Q15 Results Presentation August 14th A Global Food Company
 Results Presentation August 14th 2015 A Global Food Company Disclaimer This release contains forward-looking statements relating to the prospects of the business, estimates for operating and financial
JBS S.A. A GLOBAL FOOD COMPANY. Institutional Presentation Including 1Q17 Results
 JBS S.A. A GLOBAL FOOD COMPANY Institutional Presentation Including Q7 Results Our Values DETERMINATION Be relentless. Deliver superior results. Adopt a sense of urgency. Make things happen. SIMPLICITY
Marfrig announces acquisition of controlling interest in National Beef, and the decision to sell Keystone Foods
 1Q18 Earnings Release Marfrig announces acquisition of controlling interest in National Beef, and the decision to sell Keystone Foods São Paulo, May 14, 2018 Marfrig Global Foods S.A. Marfrig (B3 Novo
MARFRIG DELIVERS ITS 2014 GUIDANCE WITH CASH FLOW OF R$56 MILLION
 MARFRIG DELIVERS ITS 2014 GUIDANCE WITH CASH FLOW OF R$56 MILLION São Paulo, March 2, 2015 Marfrig Global Foods S.A. - Marfrig (BM&FBovespa Novo Mercado: MRFG3 and Level 1 ADR: MRTTY) announces today its
JBS S.A. A GLOBAL FOOD COMPANY. Institutional Presentation Including 4Q16 and 2016 Results
 JBS S.A. A GLOBAL FOOD COMPANY Institutional Presentation Including 4Q6 and 06 Results Our Values DETERMINATION Be relentless. Deliver superior results. Adopt a sense of urgency. Make things happen. SIMPLICITY
2017 RESULTS. JBS ended 2017 with a 18.9% higher EBITDA of R$13.4 billion. FY free cash flow was R$2.8 billion
 2017 RESULTS JBS ended 2017 with a 18.9% higher EBITDA of R$13.4 billion FY free cash flow was R$2.8 billion In 2017, net revenue was R$163.2 billion, equivalent to US$51.5 billion Gross profit totaled
Acquisition of Cargill Pork Business July 2, A Global Food Company
 Acquisition of Cargill Pork Business July 2, 205 A Global Food Company Disclaimer This release contains forward-looking statements relating to the prospects of the business, estimates for operating and
EAST BALT BAKERIES July 2017 ACQUISITION
 EAST BALT BAKERIES July 2017 ACQUISITION E AST BA LT AT A G L A N C E Leading foodservice-focused company that supplies baked goods to Quick Service Restaurants ( QSR ) across the world Operates 21 bakeries
JBS 3Q14 Results Presentation November 13 th, 2014
 JBS 3Q4 Results Presentation November 3 th, 04 Disclaimer This release contains forward-looking statements relating to the prospects of the business, estimates for operating and financial results, and
JBS ENDS 3Q18 WITH NET REVENUE OF R$49.4 BILLION AND ADJUSTED EBITDA OF R$4.4 BILLION. Free cash flow reached R$2.3 billion
 Highlights São Paulo, November 13, 2018 JBS S.A. (B3: JBSS3; OTCQX: JBSAY) JBS ENDS WITH NET REVENUE OF R$49.4 BILLION AND ADJUSTED EBITDA OF R$4.4 BILLION Free cash flow reached R$2.3 billion In, net
4Q16 and 2016 Results
 JBS S.A. (BVM&FBOVESPA: JBSS3; OTCQX: JBSAY) São Paulo, March 13 th, 2017 and 2016 Results JBS Ended With Net Income of R$693.9 million and a free cash generation of R$2.9 billion JBS ended with net revenues
Earnings Release 3Q18
 Marfrig reaches revenue and EBITDA records and resumes positive cash generation, with free cash flow of R$271 million in the quarter São Paulo, November 5, 2018 Marfrig Global Foods S.A. Marfrig (B3 Novo
Record quarterly net revenue of R$5.82 billion grows 9.3% from 2Q11 Gross margin expands 130 bps and expenses decrease 110 bps from 2Q11
 Record quarterly net revenue of R$5.82 billion grows 9.3% from 2Q11 Gross margin expands 130 bps and expenses decrease 110 bps from 2Q11 CONSOLIDATED FINANCIAL HIGHLIGHTS: Net operating revenue was R$5.82
JBS S.A. A GLOBAL FOOD COMPANY 2017 Earnings Presentation. São Paulo
 JBS S.A. A GLOBAL FOOD COMPANY 2017 Earnings Presentation São Paulo DISCLAIMER We make statements about future events that are subject to risks and uncertainties. Such statements are based on the beliefs
March, 2010 JBS S.A. In God We Trust, Nature We Respect
 March, 2010 JBS S.A. 0 In God We Trust, Nature We Respect Our Values Excellence Planning Determination Discipline Availability Openness Simplicity 1 Agenda Company Overview Market Overview 4Q09 Highlights
GOLDMAN SACHS 17 TH ANNUAL AGRIBUSINESS CONFERENCE. February 26, 2013
 GOLDMAN SACHS 17 TH ANNUAL AGRIBUSINESS CONFERENCE February 26, 2013 DENNIS LEATHERBY, CFO FORWARD-LOOKING STATEMENTS Certain information contained in this presentation may constitute forward-looking statements,
1. MESSAGE FROM MANAGEMENT
 The Management of Marfrig Global Foods ( Marfrig ) presents the Management Report and Financial Statements, accompanied by the reports of the Audit Board and Independent Auditors, for the fiscal year ended
KION Q3 UPDATE CALL Gordon Riske, CEO Thomas Toepfer, CFO Wiesbaden, 14 November 2013
 KION Q3 UPDATE CALL 2013 Gordon Riske, CEO Thomas Toepfer, CFO Wiesbaden, 14 November 2013 AGENDA 1 Highlights 2013 Gordon Riske 2 Financial Update Thomas Toepfer 3 Outlook Gordon Riske 14 November 2013
3Q18 Earnings November 8, 2018
 Earnings November 8, 2018 1 Disclaimer This presentation may contain statements that express BRF S.A. ( BRF ) management s expectations, beliefs and assumptions about future events or results. Such statements
1. MESSAGE FROM MANAGEMENT
 MANAGEMENT REPORT 2016 The Management of Marfrig Global Foods ( Marfrig ) presents the Management Report and Financial Statements, accompanied by the reports of the Audit Board and Independent Auditors,
Investor Presentation 2016
 Investor Presentation 2016 Control Group: 76% Float: 24% Market Cap: US$11.4 bn (1) 2016 Revenues (2) Countries Plants Routes Sales Centers POS Associates Brands Products US$13.5 Bn 5 YR CAGR: 4.7% 22
1Q17 Conference Call
 1Q17 Conference Call May 09, 2017 MINERVA 1Q17 Highlights OPERATING AND FINANCIAL HIGHLIGHTS Operational Cash Flow: 1Q17: R$53.6 million LTM1Q17: R$432.3 million 1Q17 ROIC: 22.2% Gross revenue: 1Q17: R$2,302.9
Investor Presentation First Quarter 2017
 Investor Presentation First Quarter 2017 Control Group: 76% Float: 24% Market Cap: US$11.9 bn (1) LTM1Q 17 Revenues (2) Countries Plants Routes Sales Centers POS Associates Brands Products US$14.0 Bn 5
October / November, 2012 JBS S.A.
 October / November, 212 JBS S.A. JBS S.A. JBS S.A. at a glance Founded in the 195 s in Midwest of Brazil IPO in 27 Leading protein producer in the World Net Revenue of R$34.5 billion in 1 st semester of
Minerva Day November 10th, 2016
 Minerva Day November 10th, 2016 AGENDA 2:00pm 2017 Perspectives: Political and Economic Scenarios Keynote Speaker: Maílson da Nobrega Brazil s Former Minister of Finance 3:00pm Coffee Break 3:20pm Minerva
Investor Presentation First Quarter 2016
 Investor Presentation First Quarter 2016 Control Group: 77% Float: 23% Market Cap: US$14.2 bn (1) LTM 1Q 16 Revenues (2) Countries Plants Routes Sales Centers POS Associates Brands Products US$13.6 Bn
Including 4Q17 and 2017 Results
 JBS S.A. A GLOBAL FOOD COMPANY Institutional Presentation Including 4Q17 and 2017 Results São Paulo ABOUT JBS Net Revenue of R$ 163.2 billion (FY 2017) Second largest global food company¹ Global and diversified
Disclaimer. by these forward-looking statements. Many of the factors that will determine these results and
 October, 2010 Disclaimer The forward-looking statements presented herein are subject to risks and uncertainties. These statements are based on the beliefs and assumptions of our management, and on information
JBS Institutional Presentation Including 2Q15 Results. A Global Food Company
 JBS Institutional Presentation Including Q5 Results A Global Food Company JBS Global LTM to Q5 Net Revenue of R$37.8 billion Prepared & Others 30% Pork 0% LTM Revenue Q5 R$37.8 bi Poultry 0% Second largest
VIPS Acquisition Perfect Fit, Alsea Continues on the Right Path. September 2013
 VIPS Acquisition Perfect Fit, Alsea Continues on the Right Path September 2013 Disclaimer This presentation contains certain forward-looking statements that reflect the current views and/or expectations
Tegel Group Holdings Limited
 Tegel Group Holdings Limited FY17 Full Year Results Presentation 27 June 2017 1 TEGEL GROUP HOLDINGS FY17 RESULTS PRESENTATION Disclaimer This presentation contains summary information about Tegel Group
Operator: Fernando Galletti de Queiroz:
 4Q18 and 2018 TRANSCRIPTION 18 Operator: Good afternoon, ladies and gentlemen, and thank you for waiting. At this time, we would like to welcome everybody to Minerva s 4Q and year of 2018 results conference
3Q18 Earnings Release
 3Q18 Earnings Release Barretos, November 6, 2018 Minerva S.A. (BM&FBOVESPA: BEEF3 OTC - Nasdaq International: MRVSY), the South American leader in the export of fresh beef and cattle byproducts, which
1. MESSAGE FROM MANAGEMENT
 The Management of Marfrig Global Foods ( Marfrig or Company ) presents the Management Report and Financial Statements, accompanied by the reports of the Audit Board and Independent Auditors, for the fiscal
MARFRIG REPORTS EARNINGS FOR FIRST QUARTER 2013
 MARFRIG REPORTS EARNINGS FOR FIRST QUARTER 2013 São Paulo, May 14, 2013 Marfrig Alimentos S.A. Marfrig (BM&FBOVESPA: MRFG3 and ADR Level 1: MRTTY) announces today its results for the first quarter of 2013
JBS S.A. Institutional Presentation Including 2Q18 Results
 JBS S.A. Institutional Presentation Including 2Q18 Results 1 About JBS Over 230 thousand direct and 700 thousand indirect employees. Around 350 thousand Customers in 150 countries. JBS has been a public
I N V E S T O R PRESENTATION. Second Quarter 2018
 I N V E S T O R PRESENTATION Second Quarter 2018 Grupo Bimbo Today Control Group: 75% Float: 25% Market cap (1) Sales (2) Adj. EBITDA (2) Countries Plants Routes Points of sale Associates Products US$10
Earnings Release 2Q18
 Marfrig s Adj pro forma EBITDA grows 87% and reaches R$918 million São Paulo, August 14, 2018 Marfrig Global Foods S.A. Marfrig (B3 Novo Mercado: MRFG3 and Level 1 ADR: MRRTY) announces today its results
1Q14 Earnings Release
 1Q14 Earnings Release Barretos, May 7, 2014 Minerva S.A. (BM&FBOVESPA: BEEF3 OTCQX: MRVSY), one of the leaders in South America in the production and sale of fresh beef, live cattle and cattle byproducts,
Our Transformation Continues Sidoti NDR May 29-30, 2018
 Our Transformation Continues Sidoti NDR May 29-30, 2018 Disclosure Regarding Forward-Looking Statements Forward-Looking Statements and Factors That May Affect Future Results: Throughout this presentation,
Acquisition of Jack Wolfskin. November 2018
 Acquisition of Jack Wolfskin November 2018 Important notices Forward-Looking Statements: During this presentation, any statements relating to future plans, events, financial results, performance or prospects,
CORPORATE PRESENTATION. March 2017
 CORPORATE PRESENTATION March 2017 InRetail Overview Multi-format retailer with exclusive focus in Peru Leading positions in its 3 segments #1 supermarket chain #1 pharmacy chain #1 shopping center operator
For personal use only
 Tegel Group Holdings Limited FY18 Interim Results Presentation 6 December 2017 1 TEGEL GROUP HOLDINGS FY18 INTERIM RESULTS PRESENTATION Disclaimer This presentation contains summary information about Tegel
Pilgrim s Pride Corporation (NASDAQ: PPC) Pilgrim s Acquires Moy Park September 11, 2017
 Pilgrim s Acquires Moy Park September 11, 2017") Pilgrim s Pride Corporation (NASDAQ: PPC) Pilgrim s Acquires Moy Park September 11, 2017 Cautionary Notes and Forward-Looking Statements Statements contained in this presentation that share our intentions,
Pilgrim s Pride Corporation (NASDAQ: PPC) Pilgrim s Acquires Moy Park September 11, 2017 Cautionary Notes and Forward-Looking Statements Statements contained in this presentation that share our intentions,
2010 Results. Paris - March 2, 2011
 2010 Results Paris - March 2, 2011 > Highlights of 2010 > Financial results > Strategy and outlook 2010 Results 2 2010: A Year of Acceleration Highlights of 2010 Revenue of 3,892m, up 19.1% Operating profit
Disclosure Statement. Page 2
 Disclosure Statement This presentation and the accompanying slides (the Presentation ) which have been prepared by Samsonite International S.A. ( Samsonite or the Company ) do not constitute any offer
INVESTOR PRESENTATION 9M PT Japfa Comfeed Indonesia Tbk
 INVESTOR PRESENTATION 9M 2015 PT Japfa Comfeed Indonesia Tbk Agenda Company Overview Key Investment Highlights Financial Highlights Appendix 2 Company Overview Introduction to Japfa Tbk Established vertically
Bank of America Merrill Lynch The Future of Financials Conference. November 6, Citi Investor Relations
 Citi Investor Relations Bank of America Merrill Lynch The Future of Financials Conference November 6, 2018 Francisco Aristeguieta CEO, Citigroup Asia Pacific Agenda Franchise Overview Asia Institutional
3Q14 Earnings Conference Call
 3Q14 Earnings Conference Call 2 Group Overview CONTAX IS THE LEADING CRM BPO COMPANY IN SOUTH AMERICA Contax Group at a glance Contax Group footprint and portfolio of services Contax Group Highlights 4
FUCHS PETROLUB AG The leading independent lubricants manufacturer of the world
 The leading independent lubricants manufacturer of the world Dr. Alexander Selent, Vice Chairman & CFO Dagmar Steinert, Head of Investor Relations April 2013 FUCHS the leading independent lubricants manufacturer
Strengthening the economic model
 Strengthening the economic model Cécile CABANIS Executive Vice President, Chief Financial Officer Strategy and Information Systems DISCLAIMER This document is presented by Danone. It contains certain forward-looking
IFF Q Earnings Conference Call
 INTERNATIONAL FLAVORS & FRAGRANCES IFF Q2 2018 Earnings Conference Call August 8, 2018 Cautionary Statement This presentation contains forward-looking statements within the meaning of Section 27A of the
ARCOS DORADOS Morgan Stanley Conference November 13, 2012 Woods Staton Chief Executive Officer
 Agenda ARCOS DORADOS Morgan Stanley Conference November 13, 2012 Woods Staton Chief Executive Officer Disclaimer This presentation contains forward-looking statements that represent our beliefs, projections
Investor Relations Jay Bachmann Danièle Daouphars
 Investor Document Investor Relations Jay Bachmann jay.bachmann@lafarge.com +33 1 44 34 93 71 Granulats et Béton - Afrique du Sud, stade Moses Mabhida Danièle Daouphars daniele.daouphars@lafarge.com +33
Our Transformation Continues. March 21, 2018
 Our Transformation Continues March 21, 2018 Disclosure Regarding Forward-Looking Statements Forward-Looking Statements and Factors That May Affect Future Results: Throughout this presentation, we make
Q Presentation. Arni Oddur Thordarson, CEO Erik Kaman, CFO Sigsteinn Gretarsson, COO. 23 October 2014
 Q3 2014 Presentation Arni Oddur Thordarson, CEO Erik Kaman, CFO Sigsteinn Gretarsson, COO 23 October 2014 Arni Oddur Thordarson CEO Record order intake and revenue with 9.3% adjusted EBIT Revenue 188 million
Amcor & Bemis Combination Creating the Global Leader in Consumer Packaging. 6 August 2018
 Amcor & Bemis Combination Creating the Global Leader in Consumer Packaging 6 August 2018 Disclaimer Cautionary Statement Regarding Forward-Looking Statements This communication contains certain statements
PIAGGIO GROUP ANALYST AND INVESTOR MEETING
 PIAGGIO GROUP ANALYST AND INVESTOR MEETING Milan, December 14 th 2011 Disclaimer This presentation contains forward-looking statements regarding future events and future results of Piaggio & C S.p.A (the
Tegel Group Holdings Limited
 Tegel Group Holdings Limited FY17 Interim Results Presentation 15 December 2016 TEGEL GROUP HOLDINGS LIMITED FY17 INTERIM RESULTS 1 Disclaimer This presentation contains summary information about Tegel
CORPORATE PRESENTATION
 CORPORATE PRESENTATION 2018 InRetail Overview Peruvian multi-format retailer, also present in Ecuador, Colombia and Bolivia through the pharma business Leading positions in Peru in its 3 segments #1 supermarket
Investor Presentation
 Investor Presentation 2017 www.gerdau.com 1 Outlook Gerdau Highlights 2 Region / Country (in Mt and %) 2017f 17/16 18/17 World 1,622 7.0% 1.6% European Union 162 2.5% 1.4% Better outlook for steel consumption
FOCUSED ON PROFITABLE, CONSISTENT GROWTH
 FOCUSED ON PROFITABLE, CONSISTENT GROWTH Investor Presentation August 2013 FORWARD-LOOKING STATEMENTS Certain information contained in this presentation may constitute forward-looking statements, such
P R E S E N T A T I O N. Third Quarter 2018
 INVESTOR P R E S E N T A T I O N Third Quarter 2018 Grupo Bimbo Today Control Group: 75% Float: 25% Market cap (1) Sales (2) Adj. EBITDA (2) Countries Plants Routes Points of sale Associates Products US$10.2
Investor Presentation. April 2018
 Investor Presentation April 2018 Disclaimer This presentation has been prepared and issued by Nomad Foods Limited (the "Company"). This Presentation has been provided solely for information and background.
CORPORATE PRESENTATION
 CORPORATE PRESENTATION 2018 InRetail Overview Peruvian multi-format retailer, with presence in the Andean region through the pharma business Leading positions in Peru in its 3 segments #1 supermarket chain
Disclosure Statement. Page 2
 Disclosure Statement Page 2 This presentation and the accompanying slides (the Presentation ) which have been prepared by Samsonite International S.A. ( Samsonite or the Company ) do not constitute any
Financial Information
 Financial Information H1 revenues reached 12.8bn up 9.8%, flat org. in Q2 Adj. EBITA reached 1.6bn, up 6.4%, Adj. EBITA margin flat excl. Invensys in a challenging environment 2015 targets: Around flat
2017 Interim Results
 2017 Interim Results Disclosure Statement Page 2 This presentation and the accompanying slides (the Presentation ) which have been prepared by Samsonite International S.A. ( Samsonite or the Company )
Investor Presentation
 Investor Presentation September 2014 Scotiabank Canada s Most International Bank As at Q3, 2014 (C$) Scotiabank Canadian Peer Rank 1 Total Assets $792B 3 rd Market Capitalization $87B 3 rd Q3/14 Net Income
CORPORATE PRESENTATION
 CORPORATE PRESENTATION 2017 InRetail Overview Multi-format retailer with exclusive focus in Peru Leading positions in its 3 segments #1 supermarket chain #1 pharmacy chain #1 shopping center operator Controlled
Q presentation. Theo Hoen, CEO Erik Kaman, CFO Sigsteinn Grétarsson, COO. October 25, 2012
 Q3 2012 presentation Theo Hoen, CEO Erik Kaman, CFO Sigsteinn Grétarsson, COO October 25, 2012 Theo Hoen CEO Introduction Financial results Outlook Slower growth with improving profit margins Revenues
June IMC: Merger with Sapore
 June 2018 IMC: Merger with Sapore Disclaimer The material that follows is a presentation of general background information about International Meal Company Alimentação S.A. ( IMC or the Company ) as of
FUCHS PETROLUB SE The leading independent lubricants manufacturer of the world
 The leading independent lubricants manufacturer of the world Dr. Alexander Selent, Vice Chairman & CFO Dagmar Steinert, Head of Investor Relations September 2014 The leading independent lubricants manufacturer
HORIZON GLOBAL DRIVEN TO DELIVER. 28 th Annual Roth Conference March 2016 NYSE: HZN
 HORIZON GLOBAL DRIVEN TO DELIVER 28 th Annual Roth Conference March 2016 1 Safe Harbor Statement Forward-Looking Statements This presentation may contain "forward-looking statements" as defined in the
Assurant and The Warranty Group: Creating a Leading Global Lifestyle Provider
 Assurant and The Warranty Group: Creating a Leading Global Lifestyle Provider 1 Safe Harbor Statement Some of the statements included in this presentation, particularly those with respect to the proposed
Investor Presentation 3Q16
 Investor Presentation 3Q16 Who are we? Largest mall company in Latin America The most efficient company with the best margins The only shopping mall company in Brazil with nationwide presence Portfolio
E X P A N D I N G O U R G R O W T H P L A T F O R M JULY 2015
 E X P A N D I N G O U R G R O W T H P L A T F O R M JULY 2015 1 SAFE HARBOUR STATEMENT Certain statements contained herein constitute forward-looking statements that reflect our expectations regarding
CEO Presentation AGM. David Buckingham Managing Director and Chief Executive Officer
 CEO Presentation AGM David Buckingham Managing Director and Chief Executive Officer 15 November 2018 Disclaimer Disclaimer This investor presentation (Presentation) has been prepared by Navitas Limited
Business outlook 13 November 2018
 Business outlook 13 November 2018 Disclaimer Disclaimer This investor presentation (Presentation) has been prepared by Navitas Limited ABN 69 109 613 309 (Navitas) for information purposes only. In response
FUCHS PETROLUB SE The leading independent lubricants manufacturer of the world
 The leading independent lubricants manufacturer of the world Dr. Alexander Selent, Vice Chairman & CFO Dagmar Steinert, Head of Investor Relations January 2015 The leading independent lubricants manufacturer
As close as you need, as far as you go
 As close as you need, as far as you go BBVA, a global group For more than 150 years our clients have been the centre of our business. Now as a highly solvent international financial group we offer clients
AEGIS GROUP PLC 2008 ANNUAL RESULTS. 19 March 2009
 AEGIS GROUP PLC 2008 ANNUAL RESULTS 19 March 2009 AGENDA OVERVIEW OF RESULTS John Napier FINANCIAL REVIEW Alicja Lesniak OUTLOOK John Napier Q&A Aegis Group plc Page 2 OVERVIEW OF RESULTS John Napier,
Creating Value by Accelerating Transformation & Growth
 Creating Value by Accelerating Transformation & Growth Univar Announces Agreement to Acquire Nexeo September 17, 2018 1 2018 Univar, Inc. All rights reserved. Forward-Looking Statements This communication
Financial Targets through 2022: Focus on Value Creation
 Financial Targets through 2022: Focus on Value Creation /////////// Capital Markets Day London, December 5, 208 Wolfgang Nickl CFO Bayer AG Disclaimer Cautionary Statements Regarding Forward-Looking Information
Presentation 22 August 2018
 Presentation 22 August 2018 Exceeded 3YP targets in 2017, but 2018 is challenging due to continued destocking, store closures and bankruptcies Profit attributable to shareholders (like-for-like) down 19%
JBS S.A. Institutional Presentation Including 3Q18 Results
 JBS S.A. Institutional Presentation Including 3Q18 Results 1 About JBS Over 230 thousand direct and 700 thousand indirect employees. Around 350 thousand Customers in 150 countries. JBS has been a public