Disclosure Statement. Page 2
|
|
|
- Ashlynn McDonald
- 5 years ago
- Views:
Transcription
1
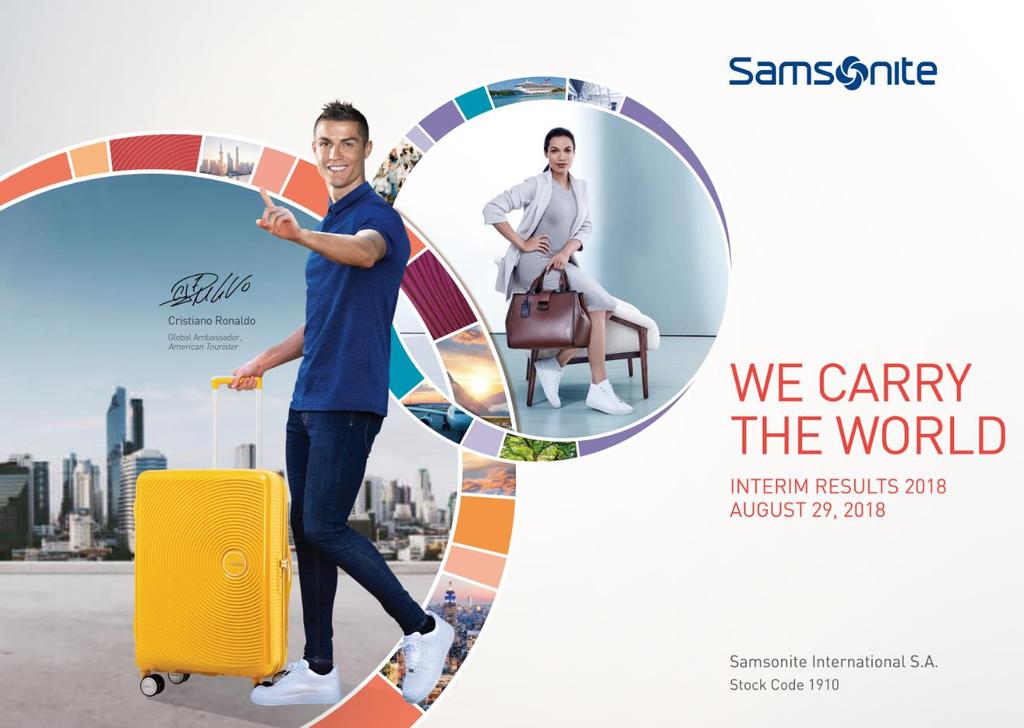
2 Disclosure Statement This presentation and the accompanying slides (the Presentation ) which have been prepared by Samsonite International S.A. ( Samsonite or the Company ) do not constitute any offer or invitation to purchase or subscribe for any securities, and shall not form the basis for or be relied on in connection with any contract or binding commitment whatsoever. This Presentation has been prepared by the Company based on information and data which the Company considers reliable, but the Company makes no representation or warranty, express or implied, whatsoever, on the truth, accuracy, completeness, fairness and reasonableness of the contents of this Presentation. This Presentation may not be all-inclusive and may not contain all of the information that you may consider material. Any liability in respect of the contents of or any omission from this Presentation is expressly excluded. Certain matters discussed in this presentation may contain statements regarding the Company s market opportunity and business prospects that are individually and collectively forward-looking statements. Such forward-looking statements are not guarantees of future performance and are subject to known and unknown risks, uncertainties and assumptions that are difficult to predict. The Company s actual results, levels of activity, performance or achievements could differ materially and adversely from results expressed in or implied by this Presentation, including, amongst others: whether the Company can successfully penetrate new markets and the degree to which the Company gains traction in these new markets; the sustainability of recent growth rates; the anticipation of the growth of certain market segments; the positioning of the Company s products in those segments; the competitive environment; general market conditions and potential impacts on reported results of foreign currency fluctuations relative to the U.S. Dollar. The Company is not responsible for any forward-looking statements and projections made by third parties included in this Presentation. Due to rounding conventions employed, certain amounts included in this presentation may not sum to totals presented and may differ from other publicly available information. Page 2
3 Agenda Results Highlights Business Overview Financial Highlights Outlook and Strategy Q&A Page 3


4 1 st Half 2018 Results Highlights Record 1 st Half Net Sales of US$1.85 billion +12.9% Constant Currency Growth +15.0% Constant Currency Growth +11.0% Constant Currency Growth 15.6% Constant Currency Growth Sales growth of US$262.6 million consists of constant currency net sales growth of US$204.9 million plus positive currency translation impact of US$57.6 million. Excluding ebags, which was acquired in May 2017, constant currency net sales growth was 9.9%. Gross margin was up 120bp from 55.3% in 1H 2017 to 56.5% in 1H 2018, reflecting a significant increase in Tumi brand gross margin and consistent gross margin in the non-tumi business. Adjusted EBITDA margin decreased by 20bp from 1H 2017 primarily due to the impact of ebags. Excluding ebags, Adjusted EBITDA margin was up 10bp. Adjusted Net Income was up 19.5% from 1H 2017 due mainly to growth of Adjusted EBITDA and US$2.4 million reduction in interest expense (excluding $53.3million write off of remaining deferred financing costs on the original senior credit facilities) due to refinancing, partly offset by higher effective tax rate. Page 4 Indicates % of net sales

5 Strong organic net sales growth 1H % 9.9% 17.1% 5-year CAGR on total net sales 9.4% 5-year CAGR on organic net sales Notes: - Organic excludes impact of High Sierra, Hartmann, Gregory, Lipault, Speck, Tumi and ebags. Does include Rolling Luggage, Chic Accent and other small channel acquisitions in Europe. Growth is considered organic one full calendar year post-acquisition. - Net sales amounts in US$ millions are based on constant currency annual growth rates from baseline of 2010 net sales. Page 5
6 1 st Half 2018 Business Overview Advertising and promotion spend of US$114.3 million (6.2% of sales) is 14.9%, or US$14.8 million, higher than 1H 2017 spend of US$99.5 million (6.3% of sales) as the Group continued to invest in its brands. Strong constant currency growth of 25.7% in total direct-to-consumer channel net sales with retail up 14.4% and direct-to-consumer e-commerce up 74.0%, partly due to the full half impact of ebags (+25.7% excluding ebags). Total e-commerce net sales (direct-toconsumer e-commerce and wholesale to e-retailers) constituted 14.1% of total net sales, up 360bp from 10.5% in 1H 2017, partly due to the full half impact of ebags. Sustained investment in brands Multi-channel strategy Strong growth in all regions The Group generated operating cash flow of US$56.2 million in 1H 2018 compared to US$152.8 million recorded in the first half of the previous year mainly due to the timing of working capital movements. Multicategory strategy Strong constant currency net sales growth in all regions: North America: +12.4% (+5.1% excluding ebags (1) ) Asia: +14.4% Europe: +11.4% Latin America: +17.0% Multi-brand strategy Constant currency net sales growth bolstered by diversified brand portfolio: Samsonite: +5.0% Tumi: +16.6% American Tourister: +24.2% Speck: +3.6% High Sierra: +1.9% Gregory: +6.8% Kamiliant: +58.0% Strong constant currency net sales growth across all product categories: Travel: +10.8% Non-Travel: +16.3% Business: +19.3% Casual: +15.4% Accessories: +21.1% Strong sales growth is underpinned by robust growth in world travel and supported by product innovation and marketing Page 6 (1) 1H 2017 adjusted to exclude sales to ebags prior to the acquisition. Compared to reported 1H 2017, constant currency net sales growth for North America was 4.6%.
7 Strong net sales growth Page 7 Net Sales Bridge 1H 2017 to 1H % (1) +16.6% (1) * * Constant currency impact of ebags net sales from January through April of Excluding Tumi brand and four additional months of ebags in 2018, net sales growth was US$108.9 million (1), or 8.4% (1), coming from: Asia: +10.5% (1) North America: +4.1% (1)(2) Europe: +11.7% (1) Latin America: +15.9% (1) Net sales growth of US$49.2 million (1), or 16.6% (1) for the Tumi brand coming from: North America: +8.2% (1) Asia: +39.4% (1) Europe: +9.2% (1) Currency translation had a positive impact of US$57.6 million on reported net sales mainly from depreciation of the USD to the EUR (+US$26.8 million), RMB (+US$11.3 million), KRW (+US$6.5 million) and JPY (+US$3.3 million). (1) Stated on a constant currency basis. (2) 1H 2017 adjusted to exclude US$2.0 million of non-tumi wholesale net sales to ebags from January 2017 through April 2017 in order to be on a comparable basis to 1H Compared to reported 1H 2017, net sales growth was 3.6% on a constant currency basis.
8 North America Net sales increased by 12.4% (1) (5.1% (1)(2) excluding ebags) with higher Adjusted EBITDA margin. Page % Constant Currency Growth Indicates % of net sales (1) Stated on a constant currency basis. (2) 1H 2017 adjusted to exclude wholesale net sales of US$2.9 million to ebags from January 2017 through April 2017 in order to be on a comparable basis to 1H Compared to reported 1H 2017, constant currency net sales growth for the region was 4.6% and for the wholesale channel was 1.6%. (3) ebags sales were US$70.5 million in 1H 2018 compared to US$21.3 million in 1H ebags Adjusted EBITDA was US$0.4 million (0.6% of sales) in 1H 2018 compared to US$0.0 million (0.1% of sales) in 1H (4) Non-advertising operating expenses as a percentage of net sales excludes Adjusted EBITDA add back items such as depreciation, amortization and stock comp expenses. Net Sales by Channel: Net sales growth in the Wholesale channel of 2.3% (1)(2). Direct-to-consumer net sales growth of 31.0% (1) (10.2% (1) excluding ebags) was driven by: Net Sales by Brand: E-commerce net sales growth of 98.7% (1) (+13.3% (1) excluding ebags (3) ); Retail net sales growth of 9.6% (1) driven by 5.2% (1) same store comps and the impact of 12 net new stores in 2017 and 4 net new stores in 1H Samsonite net sales increased by 4.0% (1). Tumi net sales growth of 8.2% (1). Net sales growth of 12.0% (1) in American Tourister due to successful new product launches and investment in brand marketing. Net sales growth of 36.1% (1) in other brands is mainly due to the ebags brand and 3 rd party brands sold through the ebags platform. Net Sales by Category: Net sales growth of 7.6% (1) in the Travel category. Non-travel category net sales growth of 19.7% (1) was due partly to the full half impact of ebags with Business +17.3% (1), Casual +18.3% (1) and Accessories +22.0% (1). Adjusted EBITDA: Adjusted EBITDA as a percentage of net sales was up 50bp from prior year driven by 110bp increase in gross margin and 10bp reduction in advertising as a percentage of net sales, partially offset by 70bp higher non-advertising operating expenses as a percentage of net sales (4). Excluding ebags (3), Adjusted EBITDA as a percentage of net sales was up 160bp.
9 Asia Net sales increased by 14.4% (1), led by Hong Kong (4), China, Japan and India % Constant Currency Growth Indicates % of net sales (1) Stated on a constant currency basis. (2) Non-advertising operating expenses as a percentage of net sales excludes Adjusted EBITDA add back items such as depreciation, amortization and stock comp expenses. (3) South Korea distribution was acquired January 1, 2017, China, Hong Kong and Macau were acquired April 1, 2017 and Thailand and Indonesia were acquired on May 1, (4) Hong Kong includes Macau and sales to Tumi distributors in certain Asian countries/territories Net Sales by Channel: Net sales growth of 10.3% (1) in the Wholesale channel. Net sales growth of 32.8% (1) in the Direct-to-consumer channel is partly due to the full half impact of taking direct control of Tumi distribution in certain markets (3) with: E-commerce net sales growth of 40.2% (1) ; Retail net sales growth of 30.6% (1) driven by same store comps of 10.0% (1) and 54 net new stores in 2017 (including 30 net new stores gained from taking direct control of Tumi distribution) (3) and 9 net new stores in 1H Net Sales by Brand: Samsonite net sales growth of 3.9% (1). Tumi net sales growth of 39.4% (1). Excluding the full half impact of taking direct control of distribution in certain markets, Tumi net sales growth was approximately 31.7% (1). Net sales growth of 17.7% (1) in American Tourister was led by China and India. All markets benefitted from the Cristiano Ronaldo marketing campaign. Net sales growth of 19.6% (1) in Other brands is due mainly to Kamiliant +57.5% (1) and High Sierra +35.3% (1). The growth in Kamiliant came largely from China, Korea and India where the brand gained market share from other entry-level brands in the region. Net Sales by Category: Net sales growth of 13.7% (1) in the Travel category. Non-travel category net sales growth of 15.5% (1) with Business +24.8% (1), Casual +13.5% (1) and Accessories +30.6% (1). Adjusted EBITDA: Adjusted EBITDA margin of 21.1% was down 10bp from 1H 2017 mainly due to a 30bp increase in advertising as a percentage of net sales and 110bp increase in other non-advertising operating expenses (2), mostly offset by a 130bp increase in gross margin. Page 9
10 Europe Net sales increased by US$67.5 million, or 11.4% (1), including 49.5% (1) growth in the American Tourister brand % Constant Currency Growth Indicates % of net sales (1) Stated on a constant currency basis. (2) Non-advertising operating expenses as a percentage of net sales excludes Adjusted EBITDA add back items such as depreciation, amortization and stock comp expenses. Net Sales by Channel: Net sales growth of 11.0% (1) in the Wholesale channel. 12.1% (1) net sales growth in the Direct-to-consumer channel is driven by: Retail net sales growth of 10.4% (1) driven by same store comps of 3.8% (1) and the impact of 32 net new stores in 2017 and 28 net new stores in 1H 2018; Strong growth in E-commerce net sales of 26.6% (1). Net Sales by Brand: Samsonite net sales increased by 5.5% (1). Tumi net sales growth of 9.2% (1). Strong net sales growth of 49.5% (1) in American Tourister as the region benefitted from the Cristiano Ronaldo marketing campaign and successful new product launches. Net sales in Other brands are down 5.8% (1) mainly due to transitioning away from 3 rd party brand net sales towards the Group s owned brands in our Rolling Luggage airport stores. Net Sales by Category: Net sales growth of 10.5% (1) in the Travel category. Non-travel category net sales growth of 13.5% (1) with Business +10.4% (1), Casual -1.8% (1) and Accessories +23.1% (1). Adjusted EBITDA: Adjusted EBITDA margin was in line with 1H 2017 as a 110bp improvement in gross margin and decreased advertising as a percentage of net sales were offset by higher non-advertising operating expenses as a percentage of net sales (2) related to new stores opened in late 2017 and 1H Page 10
 Stated on a constant currency basis.")
11 Latin America Net sales increased by US$14.7 million, or 17.0% (1), led by Mexico, Brazil and Argentina % Constant Currency Growth Indicates % of net sales (1) Stated on a constant currency basis. (2) Non-advertising operating expenses as a percentage of net sales excludes Adjusted EBITDA add back items such as depreciation, amortization and stock comp expenses. Net Sales by Channel: Wholesale channel net sales growth of 18.1% (1). Net sales growth of 15.4% (1) in the Direct-to-consumer channel driven by: Retail net sales growth of 13.4% (1) with same store comps of 0.6% (1), 11 net new stores opened during 1H 2018 and 29 net new stores opened during Excluding Chile, same store comps were 16.1% (1). Direct-to-Consumer e-commerce sites were just launched in the region last year and contributed US$0.9 million of net sales in 1H Net Sales by Brand: Samsonite net sales increased by 18.9% (1). Net sales of American Tourister more than doubled (1) to US$10.8 million as the brand continued to gain traction and market share in all countries, boosted by the Cristiano Ronaldo advertising campaign. Net sales growth of 2.1% (1) in Other brands is relatively low due mainly to softness in Chile, which is the primary market for the local brands of Saxoline, Xtrem and Secret. The softness in Chile is due to a drop in tourists due to the appreciation of the Chilean peso and Argentina consumers now buying more product within Argentina (Argentina enjoyed 168.4% (1) net sales growth). Net Sales by Category: Net sales growth of 20.2% (1) in Travel. Net sales growth of 14.7% (1) in Non-travel with Casual +23.2% (1), Business +22.3% (1). Adjusted EBITDA: Adjusted EBITDA as a percentage of net sales was down 40bp mainly driven by 110bp lower gross margin, partially offset by 40bp lower advertising as a percentage of net sales and 30bp lower non-advertising operating expenses as a percentage of net sales (2). Page 11
12 Constant currency net sales growth in most key markets (4) 4.8% (5) excluding ebags (1) (2) (2) (2) (2) (2)(3) Page 12 (1) Hong Kong includes net sales made in Macau and net sales to Tumi distributors in certain other Asian markets. (2) In integrating the Tumi business into the pre-existing European business, there have been changes made to the legal entity in which sales are being recorded, which has caused country growth rates to not be comparable, most notably in Germany and Belgium. From January 2017 through April 2017, net sales in Germany included all wholesale and ecommerce net sales of the Tumi brand for the European region. From May 2017 through December 2017, Tumi brand net sales through the wholesale channel in Europe are no longer accounted for in Germany but in Belgium. Beginning in January 2018 these sales are accounted for in the respective country of the customer. Unrelated to the Tumi integration, during 2018 non-tumi European e-commerce sales are being transitioned to be recorded in Belgium on a country by country basis. (3) UK includes Ireland. (4) The geographic location of the Group s net sales generally reflects the country/territory from which its products were sold and does not necessarily indicate the country/territory in which its end consumers were actually located. (5) 1H 2017 adjusted to exclude pre-acquisition sales to ebags..
 (1) (1) (1) Page 13 (1) In integrating the Tumi business into the pre-existing European business, there have been changes made to the legal entity in which sales are being recorded, which has")
13 Continued brand penetration drove constant currency net sales growth in all emerging markets with combined constant currency growth of 27.8% (2) (1) (1) (1) Page 13 (1) In integrating the Tumi business into the pre-existing European business, there have been changes made to the legal entity in which sales are being recorded, which has caused country growth rates to not be comparable, most notably in Germany and Belgium. From January 2017 through April 2017, net sales in Germany included all wholesale and ecommerce net sales of the Tumi brand for the European region. From May 2017 through December 2017, Tumi brand net sales through the wholesale channel in Europe are no longer accounted for in Germany but in Belgium. Beginning in January 2018 these sales are accounted for in the respective country of the customer. Unrelated to the Tumi integration, during 2018 non-tumi European e-commerce sales are being transitioned to be recorded in Belgium on a country by country basis. (2) The geographic location of the Group s net sales generally reflects the country/territory from which its products were sold and does not necessarily indicate the country/territory in which its end consumers were actually located.
 Excludes licensing income of US$4.6 million in 1H 2017 and US$2.1 million in 1H 2018. (2) Direct-to-consumer net sales increased from 30.2% of total net sales in 1H 2017 to 33.")
14 Direct-to-consumer channel sales are a growing proportion of total sales Page 14 Constant Currency Growth Net Sales growth by channel 7.7% 25.7% (1) Stated on a constant currency basis. (2) Excludes licensing income of US$4.6 million in 1H 2017 and US$2.1 million in 1H (2) Direct-to-consumer net sales increased from 30.2% of total net sales in 1H 2017 to 33.6% of total net sales in 1H Direct-to-consumer net sales growth was 25.7% (1), with: Retail net sales growth of 14.4% (1) driven by same store comps of 5.4% (1) and the addition of 52 net new stores in 1H 2018 and the full half impact of 127 net new stores added in 2017 (including 30 stores added from taking direct control of Tumi distribution in certain markets in Asia). As of June 30, 2018, the Group owned and operated 1,219 stores, of which 283 were Tumi stores. Direct-to-consumer e-commerce net sales increased by US$70.5 million or 74.0% (1) to US$161.2 million, partly driven by the full half impact of ebags (+25.7% excluding ebags). Total e-commerce net sales (includes net sales to e-retailers and Direct-to-consumer e-commerce) increased by 50.7% (1) and made up 14.0% of total net sales in 1H 2018, up from 10.5% of total net sales in 1H 2017, partly due to the full half impact of ebags. 23.1% (1) growth in net sales to e-retailers, included within the Wholesale channel. 74.0% (1) growth in Direct-to-consumer e-commerce net sales, included within the Direct-to-consumer channel (+25.7% excluding ebags).
 with North America +8.2% (1), Asia +39.4% (1) and Europe +9.2% (1). American Tourister net sales growth of 24.2% (1) with strong growth in Europe +49.5% (1), Asia +17.")
15 Strong net sales growth in all key brands Net Sales growth by brand 5.0% (1) net sales growth in Samsonite with Europe +5.5% (1), North America +4.0% (1), Asia +3.9% (1), and Latin America +18.9% (1). Tumi net sales growth of 16.6% (1) with North America +8.2% (1), Asia +39.4% (1) and Europe +9.2% (1). American Tourister net sales growth of 24.2% (1) with strong growth in Europe +49.5% (1), Asia +17.7% (1), and North America +12.0% (1) and sales more than doubling in Latin America % (1). Other brand net sales increased by 21.6% (1) comprised of: Speck net sales growth of 3.6% (1) Net sales of the High Sierra brand increased 1.9% (1). Net sales growth of 6.8% (1) for Gregory driven by double digit growth in Asia and Europe. Kamiliant, the value-conscious entry level brand that is primarily sold in Asia, increased net sales by 58.0% (1) over the prior year. Constant Currency Growth Page % 16.6% 24.2% 21.6% (1) Stated on a constant currency basis. The Latin America specific brands of Xtrem, Saxoline and Secret net sales increased by 2.3% (1) in aggregate over 1H Constant currency net sales growth in Other brands also includes the full half impact of the ebags brand as well as third party brands sold through the ebags platform. Strategy to develop products that specifically appeal to female consumers resulted in net sales growth of 38.3% (1) from US$125.8 million to US$177.5 million for these products.
 from same store comps +3.2% (1) and the impact of 7 net new stores added in 2017 and 4 net new stores in 1H 2018. Net sales in the Wholesale channel increased by 3.6%.")
 coming from all channels with Retail, E-Commerce and Wholesale up 76.2% (1), 211.4% (1) and 23.1% (1), respectively.")
16 All regions contributing to strong Tumi brand net sales growth of 16.6% (1) Net sales growth of 8.2% (1) driven mainly by the Direct-toconsumer channel with E-commerce +18.4% (1) and Retail +8.4% (1) from same store comps +3.2% (1) and the impact of 7 net new stores added in 2017 and 4 net new stores in 1H Net sales in the Wholesale channel increased by 3.6%. Gross margin increased by 370bp from 65.0% in 1H 2017 to 68.7% in 1H 2018 driven mainly by full half impact of sourcing synergies as well as lower promotional activity and channel mix. Page 16 Strong net sales growth of 39.4% (1) coming from all channels with Retail, E-Commerce and Wholesale up 76.2% (1), 211.4% (1) and 23.1% (1), respectively. Retail growth was attributable to same store comps +11.1%, 4 net new stores in 1H 2018 and the full half impact of 38 net new stores added in Excluding the impact of taking direct control of distribution in certain Asian markets (2), net sales growth was approximately 31.7% (1). Gross margin has increased by 1,100bp from 62.8% in 1H 2017 to 73.8% in 1H 2018 driven mainly by full half impact of sourcing synergies and taking direct control of distribution in certain Asian markets (2). (1) Stated on a constant currency basis (2) China, Hong Kong and Macau distribution was acquired April 1, 2017 and Thailand and Indonesia were acquired on May 1, Net sales growth of 9.2% (1) driven mainly by direct-toconsumer channels with Retail and E-Commerce +14.0% (1) and 17.7% (1), respectively. Retail growth is attributable to 9 net new stores in 1H 2018 and the full half impact of 7 net new stores added in Tumi same store comps were down 2.1% (1) due largely to fewer Asian tourists to Western Europe. Wholesale net sales were roughly flat to prior year. Gross margin has increased by 800bp from 61.2% in 1H 2017 to 69.2% in 1H 2018 driven mainly by a higher proportion of sales coming from Direct-to-consumer channels and the full half impact of sourcing synergies. Adjusted EBITDA margin for the Tumi business increased by approximately 400bp compared to 1H 2017.


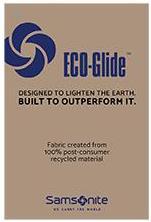

17 Exciting New Products Samsonite ECOGlide Samsonite Kevlar Tumi Latitude Page 17 American Tourister Curio/Soundbox Lipault Plume Avenue

18 Advertising spend as a percentage of net sales was consistent with prior year. Indicates % of net sales Total advertising spend increased by US$14.8 million, or 14.9%, focused mainly on boosting consumer awareness of the Tumi and American Tourister brands and non-travel categories for the Samsonite brand. Page 18


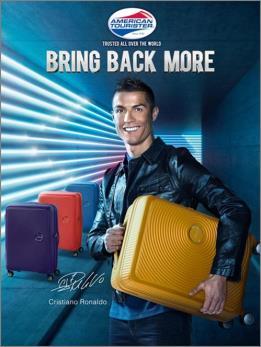
19 Targeted Brand Advertising American Tourister Global Campaign Global American Tourister Bring Back More advertising campaign, featuring Cristiano Ronaldo, has been popular and effective, helping to generate the brand s constant currency net sales growth of 24.2%. Page 19
20 Financial Highlights Net sales increased to a record 1 st half level of US$1.85 billion, with net sales growth of 12.9% (1), or 9.9% (1) excluding ebags that was acquired in May Tumi brand growth of 16.6% (1) and growth excluding Tumi of 12.1% (1) Adjusted Net Income increased by US$19.6 million, or 19.5% due mainly to strong Adjusted EBITDA growth of 14.6% and lower interest expense. Operating cash flow of US$56.2 million in 1H 2018 compared to US$152.8 million recorded in 1H 2017 reflecting US$35.4 million increase in Adjusted EBITDA offset by increased working capital of US$118.8 million in 1H 2018 compared to US$25.6 million inflow from working capital in 1H Net working capital efficiency of 14.0% as of June 30, 2018 was in line with target range, but higher than prior year due to last year being unusually low as compared to this year being slightly higher than usual from higher inventory coverage levels instituted in Q to guard against stock outs in 2018 in connection with the American Tourister global campaign and the timing of new product launches. Effective April 25, 2018, successfully completed the refinancing of senior credit facilities reducing annual cash interest expense by approximately US$9 million, extending the debt maturity profile by approximately two years and increasing liquidity by approximately US$197 million. Net debt position of US$1,588.4 million as of June 30, 2018, with US$395.4 million of cash and cash equivalents and US$1,983.8 million of debt (excluding deferred financing costs of US$17.9 million). US$47.1 million was utilized on the revolving credit facility, leaving US$602.9 million available under the revolver. The Company was in compliance with all debt covenants as of June 30, Pro-forma total net leverage ratio (2) of 2.57:1.00. Capital expenditures of US$41.1 million in 1H 2018 was largely focused on the Group s continuing strategy to pursue targeted retail expansion and store modifications and lead the industry in new product innovations. The effective tax rate was 28.3% in 1H 2018, compared to 24.3% in 1H 2017 mainly due to the deferred tax expense recognized on sharebased compensation due to the decrease in the Company s stock price during the period. On July 12, 2018, a cash distribution of US$110.0 million, or approximately US$ per share, was paid to shareholders, up 13.4% from the US$97.0 million distribution paid in Page 20 (1) Stated on a constant currency basis. (2) Per the terms of the debt agreement, net leverage ratio is calculated as (total loans and borrowings total unrestricted cash)/ltm Adj. EBITDA. LTM Adj. EBITDA is calculated on a pro-forma basis to include pro-forma run-rate cost synergies expected at August 1, 2018.
21 Excluding the non-cash write-off of deferred financing costs, profit attributable to equity holders increased by US$24.0 million, or 28.8% from strong operating income % +28.8% 1H 2017 included acquisition costs associated with the ebags acquisition and Tumi distributor buybacks in Asia. US$53.3 million excluding the impact of tax. Page 21
22 Balance sheet US$m June 30, December 31, June 30, $ C hg Jun-18 vs. Jun-17 % C hg Jun-18 vs. Jun-17 Cash and cash equivalents % Trade and other receivables, net % Inventories, net % Other current assets % Non-current assets 3, , , % Total Assets 4, , , % Current liabilities (excluding debt) % Non-current liabilities (excluding debt) (112.4) -20.5% Total borrowings 1, , , % Total equity 1, , , % Total Liabilities and Equity 4, , , % Net debt decreased by US$20.7 million in the first half of Cash flows from operations were US$56.2 million offset by outflows for capital expenditures of US$41.1 million. Pro-forma total net leverage ratio (3) of 2.57:1.00 and US$602.9 million of revolver availability. Working capital efficiency of 14.0% as of June 30, 2018 continues to be within target range. Total Net Cash (Debt) (1) (1,617.2) (1,609.1) (1,588.4) % (1) Total Net Cash (Debt) excludes deferred financing costs, which are included in total borrowings. (2) The sum of the line items in the table may not equal the total due to rounding. (3) Per the terms of the debt agreement, net leverage ratio is calculated as (total loans and borrowings total unrestricted cash)/ltm Adj. EBITDA. LTM Adj. EBITDA is calculated on a pro-forma basis to include pro-forma run-rate cost synergies expected at August 1, Page 22
23 Working Capital US$m June 30, June 30, (1) Working Capital Items Inventories $ Trade and Other Receivables $ Trade Payables $ Net Working Capital $ % of Net Sales 11.7% 14.0% Turnover Days Inventory Days Trade and Other Receivables Days Trade Payables Days Net Working Capital Days $ Chg Jun-18 vs. Jun-17 % Chg Jun-18 vs. Jun-17 $ $ % $ $ % $ $ % $ $ % Working capital efficiency of 14.0% at June 30, 2018, continues to be within the targeted range. Inventory turnover of 140 days as of June 30, 2018 was 16 days higher than prior year due to heightened inventory levels to guard against stock outs during the high summer sales months coupled with the timing of new product launches. Trade and other receivables turnover of 41 days as of June 30, 2018 was 2 days lower than prior year due to a higher proportion of sales through direct-to-consumer channels. Trade payables turnover of 117 days as of June 30, 2018 was 8 days lower than prior year due to timing of product purchases. Inventory turnover days calculated as ending inventory balance divided by cost of sales for the period and multiplied by the number of days in the period Trade and other receivables turnover days calculated as ending trade and other receivables balance divided by net sales for the period and multiplied by the number of days in the period Trade payables turnover days calculated as ending trade payables balance divided by cost of sales for the period and multiplied by the number of days in the period Net working capital efficiency (% of net sales) is calculated as net working capital divided by annualized net sales Page 23
24 Capital Expenditures Capital Expenditure by project type US$m 1H H 2018 Retail Product Development / R&D/ Supply Information Services and Facilities Other Total Capital Expenditures $32.4 $41.1 1H 2018 retail capex consisted of new stores and remodels in Europe of US$7.8 million, Asia of US$7.4 million, North America of US$5.5 million and Latin America of US$1.7 million. Capex on Product Development / R&D / Supply includes US$4.0 million on new machinery in our manufacturing facility in Hungary and US$2.5 million on tooling and equipment for Speck in North America. Information Services and Facilities includes US$1.8 million for Tumi North America office relocations and renovations and US$1.0 million for a new Chile offices as well as US$4.2 million for IT projects and upgrades around the world. The sum of the line items in the table may not equal the total due to rounding. Page 24
25 Outlook and Company Strategy International tourist arrivals grew 6% in the first four months of 2018, compared to the same period last year, not only continuing the strong 2017 trend, but exceeding UNWTO s forecast for Growth was led by Asia and the Pacific (+8%) and Europe (+7%). Africa (+6%), the Middle East (+4%) and the Americas (+3%) also recorded sound results. Earlier this year, UNWTO s forecast for 2018 was between 4-5%. (1) The Company aims to increase shareholder value through sustainable revenue and earnings growth and free cash flow generation. In order to achieve this objective, the Company has adopted the following principal strategies: Continue to develop the Company into a well-diversified multi-brand, multi-category and multi-channel luggage, bag and accessories business. Deploy multiple brands to operate at wider price points in both the travel and non-travel product categories. Within the non-travel product categories, greater emphasis will be placed on products that appeal to female consumers. Increase the proportion of net sales from the direct-to-consumer channel by growing the Company s direct-toconsumer e-commerce net sales and through targeted expansion of its bricks-and-mortar retail presence. Sustain the Company s investment in marketing to support the continued global expansion of Tumi while continuing to drive visibility for Samsonite, American Tourister and other brands. Leverage the Company's regional management structure, sourcing and distribution expertise and marketing engine to extend its brands into new markets and penetrate deeper into existing channels. Continue to invest in research and development to develop lighter and stronger new materials, advanced manufacturing processes, exciting new designs, as well as innovative functionalities that deliver real benefits to consumers. Page 25 (1) Source: UNWTO Press release PR Jun 18
2017 Interim Results
 2017 Interim Results Disclosure Statement Page 2 This presentation and the accompanying slides (the Presentation ) which have been prepared by Samsonite International S.A. ( Samsonite or the Company )
Disclosure Statement. Page 2
 Disclosure Statement Page 2 This presentation and the accompanying slides (the Presentation ) which have been prepared by Samsonite International S.A. ( Samsonite or the Company ) do not constitute any
Disclosure Statement. Page 2
 Disclosure Statement Page 2 This presentation and the accompanying slides (the Presentation ) which have been prepared by Samsonite International S.A. ( Samsonite or the Company ) do not constitute any
Disclosure Statement. Page 2
 Disclosure Statement Page 2 This presentation and the accompanying slides (the Presentation ) which have been prepared by Samsonite International S.A. ( Samsonite or the Company ) do not constitute any
2017 Third Quarter Results
 Samsonite International S.A. HKEX Stock Code: 1910 2017 Third Quarter Results November 13, 2017 Disclosure Statement Page 2 This presentation and the accompanying slides (the Presentation ) which have
2018 First Quarter Results May 14, Samsonite International S.A. Stock Code 1910
 2018 First Quarter Results May 14, 2018 Samsonite International S.A. Stock Code 1910 Disclosure Statement Page 2 This presentation and the accompanying slides (the Presentation ) which have been prepared
Disclosure Statement. Page 2
 Disclosure Statement Page 2 This presentation and the accompanying slides (the Presentation ) which have been prepared by Samsonite International S.A. ( Samsonite or the Company ) do not constitute any
Disclosure Statement. Page 2
 Disclosure Statement Page 2 This presentation and the accompanying slides (the Presentation ) which have been prepared by Samsonite International S.A. ( Samsonite or the Company ) do not constitute any
Samsonite International S.A.
 Samsonite International S.A. 13 15 avenue de la Liberté, L-1931 Luxembourg R.C.S. Luxembourg: B 159.469 (Incorporated under the laws of Luxembourg with limited liability) Consolidated financial statements
Samsonite International S.A. Announces 2018 Annual Results Net Sales Hits New Record of US$3.8 Billion
 Samsonite International S.A. Announces 2018 Annual Results Net Sales Hits New Record of US$3.8 Billion HONG KONG, March 13, 2019 Samsonite International S.A. ( Samsonite or the Company, together with its
Samsonite International S.A. Publishes 2017 Third Quarter Report
 Samsonite International S.A. Publishes 2017 Third Quarter Report Double-digit Constant Currency Net Sales Growth Reported Across All Regions for the Three Months Ended September 30, 2017 HONG KONG, November
SAMSONITE INTERNATIONAL S.A.
 Hong Kong Exchanges and Clearing Limited and The Stock Exchange of Hong Kong Limited take no responsibility for the contents of this announcement, make no representation as to its accuracy or completeness
(Incorporated in Luxembourg with limited liability) (Stock code: 1910)
 (Stock code: 1910)") (Incorporated in Luxembourg with limited liability) (Stock code: 1910) Samsonite International S.A. Announces 2014 Final Results Double-digit Revenue and EBITDA Growth for the Fifth Consecutive Year Net
(Incorporated in Luxembourg with limited liability) (Stock code: 1910) Samsonite International S.A. Announces 2014 Final Results Double-digit Revenue and EBITDA Growth for the Fifth Consecutive Year Net
Samsonite International S.A Avenue de la Liberte, L-1931, Luxembourg RCS Luxembourg: B (Incorporated under the laws of Luxembourg with
 Samsonite International S.A. 13 15 Avenue de la Liberte, L-1931, Luxembourg RCS Luxembourg: B159469 (Incorporated under the laws of Luxembourg with limited liability) Consolidated financial statements
Interim Results. For the six months ended June 30, 2011
 Interim Results For the six months ended June 30, 2011 Agenda Business and Financial Highlights Business Overview Financial Overview Concluding Remarks 2 Business Highlights in 1H 2011 Significant sales
Samsonite International S.A. Announces 2013 Interim Results
 Samsonite International S.A. Announces 2013 Interim Results Highlights Samsonite s net sales for the six months ended June 30, 2013 increased by 16.5% 1 to another record US$983.6 million with growth across
Samsonite International S.A. Announces 2013 Final Results Net sales top a record US$2 billion for the first time
 (Incorporated in Luxembourg with limited liability) (Stock code: 1910) Samsonite International S.A. Announces 2013 Final Results Net sales top a record US$2 billion for the first time Highlights Samsonite
SAMSONITE INTERNATIONAL S.A.
 Hong Kong Exchanges and Clearing Limited and The Stock Exchange of Hong Kong Limited take no responsibility for the contents of this announcement, make no representation as to its accuracy or completeness
SAMSONITE INTERNATIONAL S.A.
 Hong Kong Exchanges and Clearing Limited and The Stock Exchange of Hong Kong Limited take no responsibility for the contents of this announcement, make no representation as to its accuracy or completeness
Samsonite International S.A Interim Report. * For identification purposes only
 Samsonite International S.A. 2013 Interim Report * For identification purposes only Stock Code 1910 Contents 02 Corporate Information 03 Corporate Profile and Strategy 04 Financial Highlights 06 Chairman
SAMSONITE INTERNATIONAL S.A.
 Hong Kong Exchanges and Clearing Limited and The Stock Exchange of Hong Kong Limited take no responsibility for the contents of this announcement, make no representation as to its accuracy or completeness
Quarterly Statement for Q Metzingen, November 2, HUGO BOSS increases pace of growth in own retail
 Quarterly Statement for Q3 2017 Metzingen, November 2, 2017 HUGO BOSS increases pace of growth in own retail Currency-adjusted sales up 3% in the third quarter Retail comp store sales up 5% EBITDA before
SAMSONITE INTERNATIONAL S.A.
 Hong Kong Exchanges and Clearing Limited and The Stock Exchange of Hong Kong Limited take no responsibility for the contents of this announcement, make no representation as to its accuracy or completeness
Investor Presentation Q Results. 21 May 2015
 Investor Presentation 2015 Results 21 May 2015 1 Forward-looking statements This presentation contains forward-looking statements, including, but not limited to, the statements and expectations contained
SAMSONITE INTERNATIONAL S.A.
 Hong Kong Exchanges and Clearing Limited and The Stock Exchange of Hong Kong Limited take no responsibility for the contents of this announcement, make no representation as to its accuracy or completeness
FINAL RESULTS ANNOUNCEMENT FOR THE YEAR ENDED 31 MARCH 2010 FINANCIAL HIGHLIGHTS. Own stores number reached 764, increased by 11.
 Hong Kong Exchanges and Clearing Limited and The Stock Exchange of Hong Kong Limited take no responsibility for the contents of this announcement, make no representation as to its accuracy or completeness
1H 2018 Results Update Analyst Presentation
 1H 2018 Results Update Analyst Presentation July 31, 2018-6.00 PM CET Disclaimer This presentation contains forward-looking statements regarding future events and results of the Company that are based
CONTINUING CONNECTED TRANSACTIONS IN RELATION TO THE TAINWALA LEAVE AND LICENSE AGREEMENT
 Hong Kong Exchanges and Clearing Limited and The Stock Exchange of Hong Kong Limited take no responsibility for the contents of this announcement, make no representation as to its accuracy or completeness
901 S. Central Expressway, Richardson, TX 75080
 901 S. Central Expressway, Richardson, TX 75080 FOSSIL GROUP REPORTS RECORD SECOND QUARTER RESULTS Net Sales Increase 11% to a Record $706 Million EPS Increases 25% to a Record $1.15 Provides Third Quarter
Q Results. Lars Brorsen (CEO) Christoph Hobo (CFO) November 22, 2018
 Christoph Hobo (CFO) November 22, 2018") Q3 2018 Results Lars Brorsen (CEO) Christoph Hobo (CFO) November 22, 2018 Agenda 1. Highlights Q3 2018 2. Market outlook 3. Detailed results review 4. Company outlook 5. Q&A Appendix 1 Business summary
Q3 2018 Results Lars Brorsen (CEO) Christoph Hobo (CFO) November 22, 2018 Agenda 1. Highlights Q3 2018 2. Market outlook 3. Detailed results review 4. Company outlook 5. Q&A Appendix 1 Business summary
July 26, 2017 LafargeHolcim Ltd 2015
 Second Quarter 2017 Results Beat Hess, Chairman and Interim CEO Roland Köhler, Interim COO and Regional Head of Europe, Australia/NZ & Trading Ron Wirahadiraksa, CFO July 26, 2017 LafargeHolcim Ltd 2015
CONTINUING CONNECTED TRANSACTIONS IN RELATION TO THE SAMSONITE CHINA FRAMEWORK AGREEMENT
 Hong Kong Exchanges and Clearing Limited and The Stock Exchange of Hong Kong Limited take no responsibility for the contents of this announcement, make no representation as to its accuracy or completeness
For the six months ended 30 September Change (million ) Net sales % Gross profit %
 Net sales % Gross profit %") Highlights For the six months ended 30 September 2016 2017 Change (million ) Net sales 551.7 548.2-0.6% Gross profit 453.4 453.9 +0.1% Gross profit margin 82.2% 82.8% +0.6 pp Operating profit 19.4 13.8-28.9%
Highlights For the six months ended 30 September 2016 2017 Change (million ) Net sales 551.7 548.2-0.6% Gross profit 453.4 453.9 +0.1% Gross profit margin 82.2% 82.8% +0.6 pp Operating profit 19.4 13.8-28.9%
(Stock code: 1910) Operating profit increased by US$16.2 million, or 11.9%, year-on-year to US$152.3 million.
 Operating profit increased by US$16.2 million, or 11.9%, year-on-year to US$152.3 million.") Hong Kong Exchanges and Clearing Limited and The Stock Exchange of Hong Kong Limited take no responsibility for the contents of this announcement, make no representation as to its accuracy or completeness
Hong Kong Exchanges and Clearing Limited and The Stock Exchange of Hong Kong Limited take no responsibility for the contents of this announcement, make no representation as to its accuracy or completeness
IGG Inc. March Annual Results
 IGG Inc. March 2017 Annual Results Disclaimer This presentation and the accompanying slides (the Presentation ) which have been prepared by IGG INC (the Group ) do not constitute any offer or invitation
COACH, INC. REPORTS FISCAL 2016 FIRST QUARTER RESULTS
 COACH, INC. REPORTS FISCAL 2016 FIRST QUARTER RESULTS First Quarter Net Sales Increased 3% Over Prior Year In Constant Currency; Down 1% On A Reported Basis First Quarter Non-GAAP Earnings Per Share was
Roadshow Zurich // MainFirst. HUGO BOSS Company Handout August 6, Roadshow Zurich // MainFirst HUGO BOSS August 7, / 52
 Roadshow Zurich // MainFirst HUGO BOSS Company Handout August 6, 2014 Roadshow Zurich // MainFirst HUGO BOSS August 7, 2014 2 / 52 Agenda Half Year Results 2014 Update on Key Strategic Initiatives Outlook
Roadshow Scandinavia // equinet
 Roadshow Scandinavia // equinet HUGO BOSS Company Handout August 12-14, 2014 Dennis Weber, Head of Investor Relations Roadshow Scandinavia // equinet HUGO BOSS August 12-14, 2014 2 / 52 Agenda Half Year
Roadshow London // Deutsche Bank
 Roadshow London // Deutsche Bank HUGO BOSS Company Handout August 6, 2014 Mark Langer (CFO) & Dennis Weber (Head of Investor Relations) Roadshow London // Deutsche Bank HUGO BOSS August 6, 2014 2 / 52
Investor Meeting Presentation
 Investor Meeting Presentation November 2014 Investor Meeting Presentation HUGO BOSS November 2014 2 / 54 Agenda Update on Key Strategic Initiatives Nine Months Results 2014 Outlook Investor Meeting Presentation
TELECONFERENCE Q2 2018
 TELECONFERENCE Q2 2018 Copenhagen, 9 August 2018 1 Disclaimer Certain statements in this presentation constitute forwardlooking statements. Forward-looking statements are statements (other than statements
HUGO BOSS confirms full-year sales and earnings forecast substantial progress made in implementing strategic realignment
 Quarterly Statement for Q2 2017 Metzingen, August 2, 2017 HUGO BOSS confirms full-year sales and earnings forecast substantial progress made in implementing strategic realignment Currency-adjusted sales
Roadshow Frankfurt // Kepler Cheuvreux
 Roadshow Frankfurt // Kepler Cheuvreux HUGO BOSS Company Handout August 5, 2014 Mark Langer (CFO) & Dennis Weber (Head of Investor Relations) Roadshow Frankfurt // Kepler Cheuvreux HUGO BOSS August 5,
Full Year Results 2014
 Legal disclaimer Information in this presentation may involve guidance, expectations, beliefs, plans, intentions or strategies regarding the future. These forward-looking statements involve risks and uncertainties.
Third Quarter 2017 Results Jan Jenisch, CEO Ron Wirahadiraksa, CFO. October 27, 2017 LafargeHolcim Ltd 2015
 Third Quarter 2017 Results Jan Jenisch, CEO Ron Wirahadiraksa, CFO October 27, 2017 LafargeHolcim Ltd 2015 01 Initial views Q3 2017 and Outlook Jan Jenisch, Chief Executive Officer 2017 LafargeHolcim 2
Quarterly Statement for Q Metzingen, November 6, 2018
 Quarterly Statement for Q3 2018 Metzingen, November 6, 2018 HUGO BOSS records solid sales growth in the third quarter Full-year sales and earnings guidance confirmed Currency-adjusted sales up 1% in the
EAST BALT BAKERIES July 2017 ACQUISITION
 EAST BALT BAKERIES July 2017 ACQUISITION E AST BA LT AT A G L A N C E Leading foodservice-focused company that supplies baked goods to Quick Service Restaurants ( QSR ) across the world Operates 21 bakeries
Interim Results. IGG Inc August 2017
 Interim Results IGG Inc August 2017 Disclaimer This presentation and the accompanying slides (the Presentation ) do not constitute any offer or invitation to purchase or subscribe for any securities, and
Third Quarter Results 2018
 Third Quarter Results 2018 Metzingen November 6, 2018 Christian Stöhr, Head of Investor Relations Third Quarter Results 2018 Metzingen November 6, 2018 Yves Müller, Chief Financial Officer 1 I OPERATIONAL
Investor Presentation Q3 Results. 12 November 2014
 Investor Presentation Q3 Results 12 November 2014 1 Forward-looking statements This presentation contains forward-looking statements, including, but not limited to, the statements and expectations contained
Agenda. 1. Highlights 9M 2013 Results. 2. Financials. 3. Conclusion
 1November 2013 Legal Disclaimer Information in this presentation may involve guidance, expectations, beliefs, plans, intentions or strategies regarding the future. These forward-looking statements involve
1H 2018 results. Milan, July 23, 2018
 Milan, July 23, 2018 FORWARD-LOOKING STATEMENT Certain statements in this investor presentation may constitute forward-looking statements as defined in the Private Securities Litigation Reform Act of 1995.
Quarterly Statement for Q Metzingen, May 2, gets off to a successful start for HUGO BOSS
 Quarterly Statement for 2018 Metzingen, May 2, 2018 2018 gets off to a successful start for HUGO BOSS Currency-adjusted Group sales up 5% in the first quarter Retail comp store sales up 7% Online business
TELECONFERENCE Q FINANCIAL RESULTS
 TELECONFERENCE FINANCIAL RESULTS 10:00 CET, 12 August 2014 1 AGENDA AGENDA Business highlights: Key developments in Market development and sales-out Performance of newly launched products Guidance 2014
Financial Information
 Accelerating & profit in H1: Revenue up +4% reported, Adj. EBITA +8%, Net Income +18%, FCF +15% H1 revenue of 12.2bn, +2.7% organic, +4.1% outside Infrastructure H1 adj. EBITA margin up 60bps 1 org., to
PPG Industries, Inc. Third 2016 Financial Results Earnings Brief October 20, 2016
 PPG Industries, Inc. Third 2016 Financial Results Earnings Brief October 20, 2016 Third Quarter 2016 Financial Highlights PPG net sales for the third quarter 2016 were $3.8 billion, up almost 2 percent
L OCCITANE EN PROVENCE EN PROVENCE. Final results. for the year ended 31 March 2011
 Final results for the year ended 31 March 2011 Agenda Results Highlights Strategic Review and Future Prospects 2 1. Results Highlights (million ) Net sales Operating profit Net profit 900 800 +26.1%, +
Final Results Announcement for the Year Ended December 31, 2011
 Hong Kong Exchanges and Clearing Limited and The Stock Exchange of Hong Kong Limited take no responsibility for the contents of this announcement, make no representation as to its accuracy or completeness
IMCD reports 25% EBITA growth in 2018
 Press release IMCD reports 25% EBITA growth in 2018 Rotterdam, The Netherlands (1 March 2019) - IMCD N.V. ( IMCD or Company ), a leading distributor of speciality chemicals and food ingredients, today
Quarterly Statement for Q Metzingen, May 3, HUGO BOSS starts the year with higher sales and earnings
 Quarterly Statement for 2017 Metzingen, May 3, 2017 HUGO BOSS starts the year with higher sales and earnings Currency-adjusted sales growth of 1% in the first quarter Positive development in Europe and
For personal use only
 RELIANCE WORLDWIDE CORPORATION LIMITED ACN 610855877 www.rwc.com FY2016 RESULTS PRESENTATION 29 August 2016 Important notice This presentation contains general information about s activities at the date
SAMSONITE INTERNATIONAL S.A. 新秀麗國際有限公司
 Hong Kong Exchanges and Clearing Limited and The Stock Exchange of Hong Kong Limited take no responsibility for the contents of this announcement, make no representation as to its accuracy or completeness
4Q and Full Year 2016 Earnings Presentation. February 8, 2017
 4Q and Full Year 2016 Earnings Presentation February 8, 2017 Cautionary Language Regarding Forward-Looking Statements & Non-GAAP Measures This presentation contains forward-looking statements within the
Interim results FOR THE six months ENDED 30 September 2011
 Interim results FOR THE six months ENDED 30 September 2011 1 2 1 FINANCIAL REVIEW Creative culture AND innovation SUSTAINING COMPETITIVE ADVANTAGE QUESTIONS 3 First half achievements RECORD FIRST HALF
For personal use only
 ASX / Media release 14 February 2017 COCHLEAR FINANCIAL RESULTS FOR THE SIX MONTHS ENDED DECEMBER 2016 Positive momentum continues across all markets Net profit of $111.4m, up 19% Cochlear implant units
2010 Results. Paris - March 2, 2011
 2010 Results Paris - March 2, 2011 > Highlights of 2010 > Financial results > Strategy and outlook 2010 Results 2 2010: A Year of Acceleration Highlights of 2010 Revenue of 3,892m, up 19.1% Operating profit
Presentation 22 August 2018
 Presentation 22 August 2018 Exceeded 3YP targets in 2017, but 2018 is challenging due to continued destocking, store closures and bankruptcies Profit attributable to shareholders (like-for-like) down 19%
AXA. Henri de Castries. Chairman & CEO. London - October 2, Sanford C. Bernstein Strategic Decisions Conference
 AXA Henri de Castries Chairman & CEO London - October 2, 2013 Sanford C. Bernstein Strategic Decisions Conference Cautionary note concerning forward-looking statements Certain statements contained herein
First quarter results demonstrate resilience of ING s portfolio of businesses
 PRESS RELEASE Amsterdam 16 May 2007 First quarter results demonstrate resilience of ING s portfolio of businesses Underlying net profit EUR 1,894 million, down 3.2% but flat excluding currency effects
Press release 8 March RESULTS
 2011 RESULTS Slight growth in sales, supported by emerging markets Current Operating Income of 2.2bn Net income, Group share, down 14%, impacted by significant one off elements Net debt reduced by more
Samsonite International S.A. (Société Anonyme)
") Samsonite International S.A. (Société Anonyme) Annual accounts As at December 31, 2015 (with the report of the Réviseur d'entreprises Agréé thereon) Address of the registered office: 13 15, Avenue de la
Samsonite International S.A. (Société Anonyme) Annual accounts As at December 31, 2015 (with the report of the Réviseur d'entreprises Agréé thereon) Address of the registered office: 13 15, Avenue de la
Finansforeningens Virksomhedsdag 2015 ISS. Heine Dalsgaard, CFO June 2015
 Finansforeningens Virksomhedsdag 2015 ISS Heine Dalsgaard, CFO June 2015 1 Forward-looking statements This presentation contains forward-looking statements, including, but not limited to, the statements
Amadeus FY 2014 Results
 Amadeus FY 2014 Results February 27, 2015 Disclaimer This presentation may contain certain statements which are not purely historical facts, including statements about anticipated or expected future revenue
COACH, INC. REPORTS FISCAL 2017 SECOND QUARTER RESULTS; DRIVES DOUBLE-DIGIT EARNINGS GROWTH
 COACH, INC. REPORTS FISCAL 2017 SECOND QUARTER RESULTS; DRIVES DOUBLE-DIGIT EARNINGS GROWTH Second Quarter Net Sales Increased 4% Over Prior Year Despite North America Wholesale Strategic Repositioning
9M 2017 Results. Ongoing strong growth and acceleration of cash flow generation. October 31, 2017
 9M 2017 Results Ongoing strong growth and acceleration of cash flow generation October 31, 2017 Legal Disclaimer Information in this presentation may involve guidance, expectations, beliefs, plans, intentions
901 S. Central Expressway, Richardson, TX 75080
 901 S. Central Expressway, Richardson, TX 75080 FOSSIL GROUP REPORTS THIRD QUARTER RESULTS Net Sales Increase 18% to $810 Million Diluted EPS Increases 25% to $1.58 Maintains Full Year EPS Guidance and
Second quarter Vestas Wind Systems A/S. Copenhagen, 18 August Classification: Public
 Second quarter Vestas Wind Systems A/S Copenhagen, 18 August Disclaimer and cautionary statement This presentation contains forward-looking statements concerning Vestas' financial condition, results of
INTERIM RESULTS PRESENTATION. August 2017, Hong Kong
 2017 INTERIM RESULTS PRESENTATION August 2017, Hong Kong Disclaimer THIS DOCUMENT DOES NOT CONSTITUTE AN OFFER OR INVITATION TO PURCHASE OR SUBSCRIBE FOR ANY SECURITIES AND NO PART OF IT SHALL FORM THE
H RESULTS AND BUSINESS UPDATE
 H1 2014 RESULTS AND BUSINESS UPDATE Strong top line growth of 104% in GMV and margin improvement for Proven Winners Rocket Internet s performance on track and in line with expectations foodpanda grew into
KONE Q JULY 19, 2017 HENRIK EHRNROOTH, PRESIDENT & CEO ILKKA HARA, CFO
 KONE Q2 2017 JULY 19, 2017 HENRIK EHRNROOTH, PRESIDENT & CEO ILKKA HARA, CFO Q2 2017 highlights Good overall execution Profitability burdened by several headwinds Stabilization in China Good improvement
September Mike Poteshman. Executive VP & CFO
 September 2016 Mike Poteshman Executive VP & CFO Forward looking statements We are making some forward looking statements today that use words like outlook or target or similar predictive words. Such forward
Agenda. 1. Highlights FY 2012 Results. 2. Operational Performance Priorities for Financials. 5. Conclusion
 1MARCH 2013 Legal Disclaimer Information in this presentation may involve guidance, expectations, beliefs, plans, intentions or strategies regarding the future. These forward-looking statements involve
Full Year 2018 Results. 27 February 2019
 Full Year 2018 Results 27 February 2019 1. Key Highlights and Financial Summary Strong financial performance across all segments and progress made on all aspects of the strategic framework Financial Highlights
Investor Presentation. Domino s Pizza
 Investor Presentation Domino s Pizza July 2005 Forward-Looking Statements This presentation and our accompanying comments may contain forward-looking statements. These statements relate to future events
Q Trading Update. May 4, 2016
 Q1 2016 Trading Update May 4, 2016 Forward looking statements This Presentation may include forward-looking statements. Forward-looking statements are statements regarding or based upon our management
2011 First Quarter. May 4, Copyright 2011 First Data Corporation
 First Quarter Financial Results May 4, Copyright First Data Corporation Safe Harbor Statements in this presentation regarding First Data Corporation s business which are not historical facts are forward-looking
Investor Presentation
 Investor Presentation May 2017 Conrad Lower Manhattan New York, New York With 4,980 properties & 812,000 rooms in 103 countries and territories, Hilton is one of the world s largest hotel companies 14
TELECONFERENCE FY 2014 FINANCIAL RESULTS
 TELECONFERENCE FY 2014 FINANCIAL RESULTS 10:00 CET, 17 February 2015 1 DISCLAIMER Certain statements in this presentation constitute forward-looking statements. Forward-looking statements are statements
HY 2018 Results. Record EBITDA & free cash flow generation. August 3, 2018
 HY 2018 Results Record EBITDA & free cash flow generation August 3, 2018 Legal Disclaimer Information in this presentation may involve guidance, expectations, beliefs, plans, intentions or strategies regarding
Investor PRESENTATION. May Conrad Bora Bora Nui, French Polynesia
 Investor PRESENTATION May 2018 Conrad Bora Bora Nui, French Polynesia HLT VALUE PROPOSITION Hilton's scale, global presence and leading brands at multiple price points drive a network effect delivering
Cover-More Group. UBS Australasia Conference. November 2015
 Cover-More Group UBS Australasia Conference November 2015 Executive summary: FY15 overview Cover-More delivered another year of double digit earnings growth, with offshore business growing substantially.
Investor PRESENTATION. November Conrad Bora Bora Nui, French Polynesia
 Investor PRESENTATION November 2017 Conrad Bora Bora Nui, French Polynesia HLT VALUE PROPOSITION Hilton's scale, global presence and leading brands at multiple price points drive a network effect delivering
Interim results. for the half-year ended 30 September 2010
 Interim results for the half-year ended 30 September 2010 Agenda Results Highlights Strategic Review and Future Prospects 2 1. Results Highlights (million ) Net sales Operating profit Net profit 1 400
Q EARNINGS CALL
 Tom Goeke Chief Executive Officer Q2 2017 EARNINGS CALL JULY 27, 2017 IMPORTANT INFORMATION Forward Looking Statements These slides contain (and the accompanying oral discussion will contain) forward looking
ANNUAL RESULTS ANNOUNCEMENT FOR THE YEAR ENDED 31 MARCH 2012
 Hong Kong Exchanges and Clearing Limited and The Stock Exchange of Hong Kong Limited take no responsibility for the contents of this announcement, make no representation as to its accuracy or completeness
HUGO BOSS First Half Year Results 2014
 HUGO BOSS First Half Year Results 2014 Claus-Dietrich Lahrs (CEO), Mark Langer (CFO) Metzingen, July 31, 2014 Conference Call, First Half Year Results 2014 HUGO BOSS July 31, 2014 2 / 42 Agenda Half Year
2009/10 1 st Quarter Net Sales
 2009/10 1 st Quarter Net Sales Sales in line with our expectations 1st quarter 2009/10 Sales down 4%* with a positive price/mix effect 22 October 2009 1 * Organic growth Presentation structure - Overall
2018 Half Year Results
 A GLOBAL LEADER IN METAL FLOW ENGINEERING 2018 Half Year Results 26 July 2018 Patrick André Chief Executive 1 Disclaimer This presentation, which has been prepared by Vesuvius plc (the Company ), includes
Press Release HUGO BOSS First Half Year Results HUGO BOSS accelerates growth in second quarter of 2015
 Press Release HUGO BOSS First Half Year Results HUGO BOSS accelerates growth in second quarter of Sales rise by 16% in reporting currency and 7% currency-adjusted 6% increase in retail comp store sales
Third-quarter 2018 results November 9, 2018
 ` Third-quarter 018 results November 9, 018 ` 1 Disclaimer This presentation may contain forward-looking statements. Such statements are not statements of historical fact, and reflect the beliefs and expectations