For personal use only
|
|
|
- Derek Julius Francis
- 5 years ago
- Views:
Transcription


1 RELIANCE WORLDWIDE CORPORATION LIMITED ACN FY2016 RESULTS PRESENTATION 29 August 2016
2 Important notice This presentation contains general information about s activities at the date of presentation (29 August 2016). It is information given in summary form and does not purport to be complete. The presentation is not an offer or invitation for subscription or purchase of or a recommendation of securities in any jurisdiction. It is not intended to be relied upon as advice to investors or potential investors and does not take into account the investment objectives, financial situation or needs of any particular investor. These should be considered, with or without professional advice, when deciding if an investment is appropriate. Information, including forecast information, in this presentation should not be considered as a recommendation in relation to holding, purchasing or selling shares, securities or other instruments in. Due care and attention has been used in the preparation of forecast information. However, actual results may vary from forecasts and any variation may be materially positive or negative. Forecasts by their very nature are subject to uncertainty and contingencies many of which are outside the control of. Past performance is not a reliable indication of future performance. Except as required by applicable regulations or laws, does not undertake any obligation to publicly update or review any forward looking statements whether as a result of new information or future events. The sum totals throughout this presentation may not add exactly due to rounding differences. The information in this presentation remains subject to change without notice. Circumstances may change and the contents of this presentation may become outdated as a result. This presentation forms part of a package of information about. It should be read in conjunction with the Appendix 4E, 30 June 2016 Financial Report and the Results Announcement also released on 29 August INVESTOR PRESENTATION FY2016 RESULTS PAGE 1

3 Agenda 1. Highlights 4 2. Introduction to Reliance Financial performance Growth and outlook Appendix 31 INVESTOR PRESENTATION FY2016 RESULTS PAGE 2

4 1. Highlights INVESTOR PRESENTATION FY2016 RESULTS PAGE 3
5 FY2016 achievements Continued market penetration of SharkBite PTC fittings and accessories in the Americas Phase 1 of USA factory expansion completed, production of SharkBite PTC fittings commenced EvoPEX approval testing and trials completed Spain PEX facility commenced production, first sales made to Eastern Europe Successfully managed inventory levels in line with plan Ongoing focus on cost reductions and operational efficiencies Maintained strong health and safety track record Successfully listed on the ASX in April 2016 INVESTOR PRESENTATION FY2016 RESULTS PAGE 4
6 FY2016 financial highlights (12 months) Pro forma net sales $534.4 million Pro forma EBITDA 1 Pro forma NPAT 1 $99.1 million $52.1m million +18% growth vs PF FY % growth vs PF FY % above Prospectus forecast Strong net sales growth from Americas +22% growth vs PF FY2015 Ongoing cost focus driving margin gains +90bps (EBITDA margin) vs PF FY2015 Strong balance sheet Pro forma net debt of $127.9 million (net leverage of 1.3x) FY2016 results in line with Prospectus forecast Note 1: EBITDA and NPAT are before significant items, refer to page 28 for statutory accounts which contain further details on significant items INVESTOR PRESENTATION FY2016 RESULTS PAGE 5
7 Continuing Reliance s long-term track record of strong growth RWC historical net sales growth, constant currency basis 1 (A$m) FY06A FY07A FY08A FY09A FY10A FY11A FY12A FY13A FY14A FY15A FY16A Note 1: Period from FY2006 to FY2016. Pro forma net sales calculated based on a constant currency basis of AUD/USD , AUD/GBP of , AUD/CAD of , AUD/NZD of and AUD/EUR of , being the average exchange rates in FY2016 INVESTOR PRESENTATION FY2016 RESULTS PAGE 6

8 2. Introduction to Reliance INVESTOR PRESENTATION FY2016 RESULTS PAGE 7
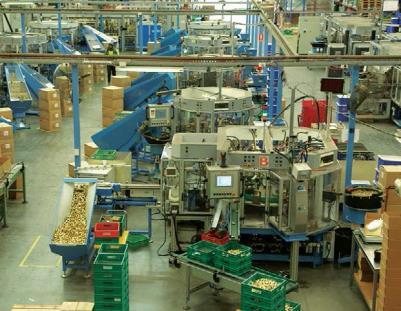
9 RWC is a leader in the design, manufacture and supply of water flow and control products and solutions for use in the behind the wall plumbing industry Leader in high growth brass push-to-connect ( PTC ) fittings category in key geographies Majority of sales to the defensive repair and renovation ( R&R ) end-market Vertically integrated, global manufacturer (11 facilities worldwide) with a strong culture of innovation, leading R&D and engineering capability Strong market positions across all key product lines and geographic regions Substantial barriers to entry and multiple avenues of future growth Senior management is a mix of long tenure RWC executives and new talent (>125 years aggregate experience with RWC) A$534.4 million of net sales 1 and A$99.1 million of pro forma EBITDA 2 in FY2016 Net sales contribution (FY2016, percentages based on AUD) By product category By operating segments By sales channel Thermostatic products 5% Control valves 19% Other 11% Fittings and pipe 65% Asia Pacific 22% EMEA 10% Americas 68% OEM 18% Wholesale 36% Export 2% Retail 44% Note 1: Net sales after eliminating intercompany sales Note 2: EBITDA before significant items, refer to page 28 for statutory accounts which contain further details on significant items INVESTOR PRESENTATION FY2016 RESULTS PAGE 8
 relief valves 1 #1 #1 #1 #1 Thermostatic")

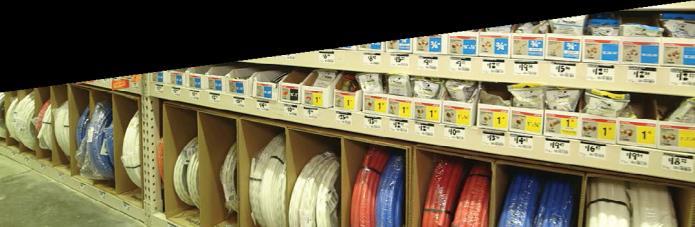
10 Valves Fittings and pipe Market leader in North America and Australia across key product lines Product line Key brands Brass PTC fittings 1 #1 RWC category share: 80% 2 #1 RWC category share: 85% 2 Recently launched #1 PEX pipe 1 Top 5 #2 Recently launched Recently launched Temperature & pressure ( T&P ) relief valves 1 #1 #1 #1 #1 Thermostatic mixing valves 1 Top 3 #1 #1 Top 2 Note 1: Market positions based on management estimates of units sold in calendar year 2014 in the relevant region Note 2: Management s estimate of the USA residential brass PTC fittings market share and Australian total brass PTC fittings category share for calendar year 2014 INVESTOR PRESENTATION FY2016 RESULTS PAGE 9
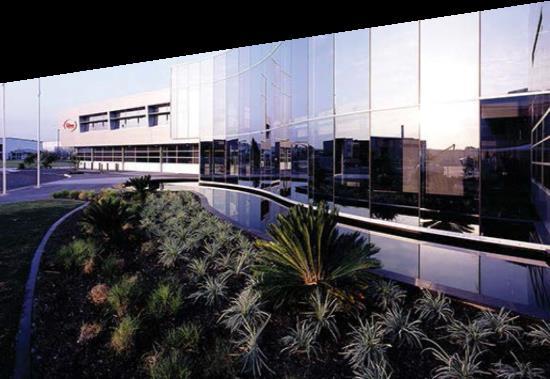
11 Global manufacturing and distribution footprint, with infrastructure in place to support strong future growth Evesham, UK Distribution 2 Vaughan, Ontario Distribution 1 Brisbane, QLD Manufacturing 1 Distribution 1 R&D 1 Cullman, Alabama Manufacturing 3 Distribution 1 R&D 1 Granada, Spain Manufacturing 1 Distribution 1 Perth, WA Distribution 1 Melbourne, VIC Manufacturing 5 Distribution 1 Sydney, NSW Distribution 1 Auckland, NZ Manufacturing 1 Distribution 1 INVESTOR PRESENTATION FY2016 RESULTS PAGE 10
12 3. Financial performance INVESTOR PRESENTATION FY2016 RESULTS PAGE 11
13 FY2016 pro forma results (12 months) June year end (A$m) Pro forma FY2016 Pro forma FY2015 Variance (%) Prospectus forecast pro forma FY2016 Variance (%) Commentary FY2016 results ahead of prospectus forecast Achieved an 18% increase in net sales vs PF FY2015 Net sales % EBITDA % % EBIT % % NPAT n/a n/a % Key metrics Double digit growth driven by strong performance from Americas and supported by a lower AUD/USD Strong growth from Retail and Wholesale channels across Americas and Asia Pacific Ongoing production efficiencies and procurement savings have supported margin expansion Pro forma FY2016 interest and tax in line with prospectus forecast Pro forma FY2016 NPAT above prospectus forecast due to higher EBIT than forecast in the prospectus EBITDA margin 18.5% 17.6% + 90 bps 18.3% + 20 bps EBIT margin 15.5% 14.5% bps 15.1% + 40 bps NPAT margin 9.7% n/a n/a 9.6% +10 bps Note: A reconciliation between pro forma and statutory results is included in the Appendix Note 1: Before significant items, refer to page 28 for statutory accounts which contain further details on significant items n/a = Not available INVESTOR PRESENTATION FY2016 RESULTS PAGE 12
14 Group EBITDA bridge (FY2015 FY2016) A$m Strong growth driven by continued market penetration of SharkBite and lower AUD/USD exchange rate Improvement in gross margin and lower opex (as % of sales) driven by cost reductions and operational efficiencies FY2015 pro forma EBITDA Net sales Amercias Net sales Asia Pacific Net sales EMEA Intercompany sales Cost of sales Operating expenses FY2016 pro forma EBITDA INVESTOR PRESENTATION FY2016 RESULTS PAGE 13
15 Segment results Americas June year end (A$m) Pro forma FY2016 Pro forma FY2015 Variance (%) Prospectus forecast pro forma FY2016 Variance (%) Net sales % EBITDA % % EBITDA margin 16.0% 15.8% + 20 bps 15.7% + 30 bps Financial commentary FY2016 results in line with prospectus forecast Achieved a 22% increase in net sales vs PF FY2015 driven by: Continued market penetration of SharkBite Strong demand from the Retail and Wholesale channels Continued strong growth in sales to The Home Depot Lower AUD/USD exchange rate OEM sales flat due to softness in water heater sales Operational commentary The Wholesale team, supported by Marketing and Training, is growing the market through strategic account management initiatives Ongoing participation in trade shows, promotional campaigns and training programs have driven increased brand and product awareness Production of SharkBite PTC fittings at Cullman, Alabama commenced in May 2016 Significant progress made with EvoPEX approval testing and trials completed Note 1: Segment net sales includes intercompany sales between segments INVESTOR PRESENTATION FY2016 RESULTS PAGE 14
16 Segment results Asia Pacific June year end (A$m) Pro forma FY2016 Pro forma FY2015 Variance (%) Prospectus forecast pro forma FY2016 Variance (%) Net sales % EBITDA % % EBITDA margin 19.6% 17.6% bps 19.5% + 10 bps Financial commentary FY2016 results in line with prospectus forecast Achieved a 6% increase in net sales vs PF FY2015 driven by: Strong performance from piping systems (Auspex and SharkBite) Good growth in wholesale channel, partially offset by lower OEM sales Lower sales to OEM channel Operational commentary New electronic press successfully installed at Moorabbin, increasing production capacity Ongoing optimisation of SalesForce (CRM) to support sales and product management team FY2016 target savings from cost reductions achieved Note 1: Segment net sales includes intercompany sales between segments INVESTOR PRESENTATION FY2016 RESULTS PAGE 15
17 Segment results EMEA June year end (A$m) Pro forma FY2016 Pro forma FY2015 Variance (%) Prospectus forecast pro forma FY2016 Variance (%) Net sales % % EBITDA % 4.1-7% EBITDA margin 7.4% 2.3% bps 7.6% - 20 bps Financial commentary Achieved a 17% increase in net sales vs PF FY2015 driven by: Strong growth in Wholesale channel, underpinned by demand from all customers Weaker AUD/GBP exchange rate OEM sales flat, reflecting tougher market conditions in 2HFY2016 FY2016 results slightly down compared to prospectus forecast Operational commentary Production of PEXa from Spain facilities commenced in late FY2016 First sales to Eastern Europe made First shipments have been made to RWC Australia Slowdown in Wholesale market in the last two months due to Brexit Lower sterling compared to prospectus forecast Note 1: Segment net sales includes intercompany sales between segments INVESTOR PRESENTATION FY2016 RESULTS PAGE 16
18 Strong free cash flow conversion (12 months) June year end (A$m) Pro forma FY16 Pro forma FY15 Variance (%) Prospectus forecast pro forma FY16 Variance (%) EBITDA % % Non-cash items in EBITDA (0.3) (1.6) - 81% - nmf Changes in working capital (15.3) 0.5 nmf (25.2) - 39% Cash flow from operations % % Maintenance capital expenditure (11.0) (10.1) + 9% (11.9) - 8% Commentary Stronger net cash flows compared with PF FY2015 and prospectus forecast Positive impact from inventory management Capital expenditure below prospectus forecast primarily due to minor variations in the Cullman, Alabama expansion Growth capital expenditure Proceeds from sale of assets (19.1) (19.5) - 2% (21.4) - 11% nmf % Net Investing cash flow (26.2) (29.3) - 11% (29.6) - 11% Net cash flow (before financing and taxation) 1 Free cash flow conversion % % 84.2% 98.6% - 14% 74.2% + 10% Note 1: Before significant items. refer to page 28 for statutory accounts which contain further details on significant items nmf = Not meaningful INVESTOR PRESENTATION FY2016 RESULTS PAGE 17
19 Capital expenditure Historical capex (A$m) and capex as % of depreciation Upgrade of manufacturing capabilities in Australia and USA Bolt-on acquisition of plastic components manufacturer TMA Commenced construction of Cullman facility Completion of Spain acquisition Cullman Phase 1 expansion completed, increasing brass PTC fittings production capacity Potential to further increase capacity with incremental capital outlay Growth capex (A$m) Maintenance capex (A$m) Total capex as % of depreciation 212% 184% % 78% FY13A FY14A FY15A FY16A INVESTOR PRESENTATION FY2016 RESULTS PAGE 18
20 Balance sheet strength Capitalisation A$m As at 30 June 2016 Prospectus pro forma (at completion of Offer) Cash and cash equivalents Total debt Net debt Net debt / FY2016 pro forma EBITDA FY2016 pro forma EBIT / Net finance costs Net working capital 1.3x 1.6x 13.1x 12.6x Commentary Strong balance sheet position Significant liquidity available to fund growth Lower net debt vs prospectus forecast due to: Favourable cash flow variance Lower IPO transaction costs Analysis vs PF FY2015 not meaningful as net debt at year end is reflective of post IPO debt structure Reduction in working capital in line with plan A$m 30 June 2016 Prospectus pro forma 31 December 2015 Trade and other receivables Inventories Trade and other payables Net working capital INVESTOR PRESENTATION FY2016 RESULTS PAGE 19

21 4. Strategy and outlook INVESTOR PRESENTATION FY2016 RESULTS PAGE 20

22 Overview of growth strategy 6 Industry consolidation 1 Continued penetration of brass PTC fittings and accessories in USA 5 New product development Growth Strategy 2 Growth in market for thermostatic and other products 4 3 Expansion into new geographic markets Expansion into new end-markets INVESTOR PRESENTATION FY2016 RESULTS PAGE 21
23 Increased penetration of PTC fittings and accessories in the USA PTC is the fastest growing category in US residential plumbing fittings Current penetration remains low at ~10% PTC sales projected to grow at CAGR of approximately 12% between , outpacing growth in the wider plumbing fittings segment 1 PTC fittings penetration expected to drive PTC accessories growth SharkBite well positioned to benefit with c.80% share of the brass PTC fittings category in the USA Drivers of RWC s PTC fittings and accessories penetration: Increasing product range with wholesale customers Extension of PTC accessories range to meet flow-on demand from increased PTC fittings penetration and SharkBite brand success Continued customer service and education US residential plumbing fittings market by fitting type 2 CPVC 11% Expansion 13% PTC 10% Press 2% Solder 28% Crimp 36% US residential plumbing fittings by end-market 2 New construction 30% PTC fittings ~10% Repair and renovation 70% Note 1: Management estimates. On a sales volume basis Note 2: Market position based on management estimates, on a unit sales volume basis for calendar year 2014 INVESTOR PRESENTATION FY2016 RESULTS PAGE 22
24 Expanding our USA retail distribution network Overview of Lowe s agreement Agreement covers Reliance s SharkBite range of PTC fittings and accessories and related products, including PEX pipe, crimp fittings and clamps Sole Supplier arrangement i.e. SharkBite range of PTC and related products will be the only products sold by Lowe s in this category National rollout to Lowe s 1,700+ stores in the USA to occur from late FY2017 and complete in FY2018 Agreement not expected to have a material impact on Prospectus profit forecast for FY2017 Distribution through The Home Depot and Lowe s ensures SharkBite products are sold and marketed as widely as possible in the retail channel Expected to have positive impact on growth and market penetration of SharkBite products in the USA from late FY2017 INVESTOR PRESENTATION FY2016 RESULTS PAGE 23
 expansion completed in FY2016 Total capital cost of A$18.")

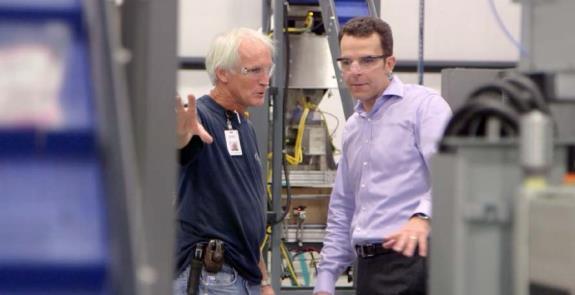
25 Investing in growth in the USA Cullman, Alabama expansion Overview Highly automated manufacturing and distribution centre located in Cullman, Alabama Manufactures control valves and PEX pipe Recent major investment program to support SharkBite growth in the USA Phase 1 (2 production cells) expansion completed in FY2016 Total capital cost of A$18.2 million (below prospectus guidance) Production of SharkBite PTC fittings has commenced from new facilities Benefits of Cullman facility investment Increased brass PTC fittings production capacity to meet growing demand in USA and Canada More efficient management of inventory SharkBite now manufactured in both the USA and Australia Extra capacity can be brought online within 12 months with incremental additional capital outlay INVESTOR PRESENTATION FY2016 RESULTS PAGE 24

 INVESTOR PRESENTATION FY2016 RESULTS PAGE 25")
26 Expansion into new end-markets through new product development Leveraging PTC technology to enter the USA residential new construction and commercial markets EvoPEX approval testing and trials completed SharkBite 2XL currently in the testing and commercialisation phase Preliminary market feedback has been positive and indicates that each new product range represents an attractive, labour saving solution US new residential construction market solution: EvoPEX fittings US new commercial construction market solution: SharkBite 2XL fittings Lower installed cost Made from engineered plastics and stainless steel materials Larger diameter fitting better suited to commercial applications Lower installed cost Intended to win market share from more basic fittings (e.g. PEX barb, copper sweat) INVESTOR PRESENTATION FY2016 RESULTS PAGE 25
27 FY2017 outlook Reliance confirms its pro forma FY2017 Prospectus profit forecast 1 Reliance confirms it is expected to consider an interim dividend in respect of the 6 months to 31 December 2016 and a final dividend in respect of the 6 months to 30 June 2017 in line with target dividend payout ratio (40-60% NPAT) FY2017 Prospectus forecast June year end (A$m) FY2017 Prospectus forecast Net sales EBITDA EBIT 97.8 NPAT 62.6 Note 1: Forecast confirmed assuming, among other things, that current general economic conditions are maintained, including in the geographies where Reliance operates, and no significant changes to foreign currency exchange rates, particularly USD/AUD INVESTOR PRESENTATION FY2016 RESULTS PAGE 26

28 5. Appendix INVESTOR PRESENTATION FY2016 RESULTS PAGE 27
29 FY2016 statutory results June year end (A$m) Actual statutory FY2016 Prospectus statutory FY2016 Variance (%) Net sales % EBITDA % EBIT % Commentary Actual FY2016 statutory results exceeded prospectus forecast due to: Timing of the restructure becoming effective; and Lower IPO transaction costs Comparison to FY2015 not meaningful given full year of trading Significant items 2 (12.1) (15.2) - 20% EBIT (after significant items) NPAT (after significant items) 1.8 (3.2) nmf (1.6) (5.4) nmf Note 1: Before significant items Note 2: Significant items include non-operating foreign exchange gains or losses, and expenses associated with the Initial Public Offering nmf = Not meaningful INVESTOR PRESENTATION FY2016 RESULTS PAGE 28
30 Statutory to pro forma results reconciliation Statutory NPAT to pro forma NPAT June year end (A$m) Actual FY2016 Prospectus FY2016 Variance (%) Statutory NPAT (1.6) (5.4) nmf Offer transaction costs % Commentary Trading for the period in line with prospectus forecasts Statutory NPAT higher than prospectus forecast due largely to lower than expected transaction costs Trading for the period from 1 July 2015 to Completion of the Offer Net finance costs (5.2) (5.3) - 2% Significant items % Tax impact of adjustments (23.1) (22.9) + 1% Pro forma NPAT % Note 1: Before significant items, refer to page 28 for statutory accounts which contain further details on significant items nmf = Not meaningful INVESTOR PRESENTATION FY2016 RESULTS PAGE 29
31 INVESTOR PRESENTATION FY2016 RESULTS PAGE 30
FY2018 RESULTS PRESENTATION 27 August 2018
 RELIANCE WORLDWIDE CORPORATION LIMITED ACN 610855877 FY2018 RESULTS PRESENTATION 27 August 2018 INVESTOR PRESENTATION FY18 RESULTS PAGE 0 Important Notice This presentation contains general information
Important Notice. The sum totals throughout this presentation may not add exactly due to rounding differences.
 Important Notice This presentation contains general information about Reliance Worldwide Corporation Limited s activities at the date of presentation (26 February 2018). It is information given in summary
1H FY19 RESULTS PRESENTATION 25 February 2019
 RELIANCE WORLDWIDE CORPORATION LIMITED ACN 610855877 1H FY19 RESULTS PRESENTATION 25 February 2019 INVESTOR PRESENTATION 1H FY19 RESULTS PAGE 0 Important Notice This presentation contains general information
RWC reports strong first half results with continued business growth. EBITDA guidance for FY2018 increased.
 ASX Announcement 26 February 2018 RWC reports strong first half results with continued business growth. EBITDA guidance for FY2018 increased. Reliance Worldwide Corporation Limited (ASX: RWC) ( RWC or
RWC delivers double digit revenue and earnings growth for FY2018 Continuing momentum expected in FY2019 following John Guest acquisition
 ASX Announcement 27 August 2018 RWC delivers double digit revenue and earnings growth for FY2018 Continuing momentum expected in FY2019 following John Guest acquisition Reliance Worldwide Corporation Limited
ASX Announcement. 25 February 2019
 ASX Announcement 25 February 2019 RWC reports continued revenue and earnings growth for the six months ended 2018 Underpinned by strong double digit growth in underlying sales in the Americas and inclusion
RELIANCE WORLDWIDE CORPORATION LIMITED ACN
 RELIANCE WORLDWIDE CORPORATION LIMITED ACN 610 855 877 ANNUAL REPORT Contents Financial Highlights 2 Chairman s Report 3 Chief Executive Officer s Report 4 Operating and Financial Review 6 Corporate Governance
For personal use only
 29 August Results for announcement to the market Appendix 4E for the period ended 30 June (ASX: RWC) ( Company ) announces the following audited financial results for the Company and its controlled entities
For personal use only RELIANCE WORLDWIDE CORPORATION LIMITED
 RELIANCE WORLDWIDE CORPORATION LIMITED ANNUAL REPORT Contents Financial Highlights 2 Chairman s Report 3 Chief Executive Officer s Report 4 Corporate Governance Statement 6 Financial Report 12 Directors
Full Year 2017 Results Presentation Bravura Solutions Limited
 Full Year 2017 Results Presentation Bravura Solutions Limited 23 rd August 2017 Important notice and disclaimer The information contained in this document (including this notice) or discussed at this presentation
Shaver Shop Group Limited 1H FY18 RESULTS INVESTOR PRESENTATION. 23 February 2018
 Shaver Shop Group Limited 1H FY18 RESULTS INVESTOR PRESENTATION 23 February 2018 1 TABLE OF CONTENTS 01 Key business highlights 02 Financial results 03 Key growth drivers 04 Trading update& outlook 05
For personal use only
 FY14 RESULTS John Croll Chief Executive Officer Nimesh Shah Chief Financial Officer AGENDA OVERVIEW OF FY14 RESULT FINANCIAL PERFORMANCE FY15 OUTLOOK GROWTH STRATEGY Q&A JOHN CROLL NIMESH SHAH JOHN CROLL
For personal use only. Beacon Lighting Group Limited RESULTS PRESENTATION F Y 20 14
 For personal use only Beacon Lighting Group Limited RESULTS PRESENTATION F Y 20 14 AGENDA 1. BACKGROUND 2. RESULTS OVERVIEW 3. TRADING PERFORMANCE 4. CASH FLOW, BALANCE SHEET, DIVIDEND 5. GROWTH STRATEGY
2Q 2017 Highlights and Operating Results
 2Q 2017 Highlights and Operating Results July 25, 2017 1 2Q 2017 Highlights and Operating Results Table of Contents Page(s) 1 Sales Overview and Highlights 4-5 2 NSS Overview 6-7 3 EES Overview 8-9 4 UPS
1H FY16 RESULTS PRESENTATION
 FY16 RESULTS PRESENTATION March 2016 Contents 1 Results Overview 2 Key Line Items 3 Country Results 4 Cash Flow, Balance Sheet, Dividend 5 Growth Strategy Update 6 FY16 Outlook 7 Questions A Appendices
For personal use only
 Nick Scali Limited NCK.ASX FY18 Results Presentation 16 th August 2018 Key Highlights Sales Sales increased 7.7% to $250.8m (FY17: $232.9m) Increase assisted by full year of sales from 4 stores opened
FY2015 Annual Results August Brett McKeon - CEO David Bailey - CFO
 FY2015 Annual Results August 27 2015 Brett McKeon - CEO David Bailey - CFO FY2015 Financial Results Highlights Delivery on FY15 Prospectus forecasts Pro forma NPAT $19.3 million up 8.4% against IPO forecast
Sales increased 8.1% to $128.0m (HY17: $118.4m)
") Nick Scali Limited NCK.ASX HY18 Results Presentation 7th February 2018 Key Highlights Sales increased 8.1% to $128.0m (HY17: $118.4m) Sales Like for like sales growth of +2.6% for Nick Scali Furniture
Nick Scali Limited NCK.ASX HY18 Results Presentation 7th February 2018 Key Highlights Sales increased 8.1% to $128.0m (HY17: $118.4m) Sales Like for like sales growth of +2.6% for Nick Scali Furniture
For personal use only. Appen Limited. Global Leader in Language Technology Solutions. FY2014 Results Presentation
 Appen Limited Global Leader in Language Technology Solutions FY2014 Results Presentation Agenda Topic: Introduction to Appen Financial Performance Growth and Outlook People and Leadership Speaker: Chris
For personal use only. Investor Presentation Bravura Solutions Limited
 Investor Presentation Bravura Solutions Limited Tony Klim CEO 27 April 2017 The information contained in this document (including this notice) or discussed at this presentation (collectively, the Presentation)
For personal use only
 Click to edit Master text styles IDP Education FY16 Results Presentation Twelve months to 30 June 2016 11 February 2016 Important notice and disclaimer Click Disclaimer to edit Master text styles The material
A S X A N N O U N C E M E N T
 A S X A N N O U N C E M E N T DATE: 24 February 2016 Attached is the Presentation regarding Pact s Half year Financial Results for the half year ended 31 December 2015. The Presentation will occur at 10am
Tegel Group Holdings Limited
 Tegel Group Holdings Limited FY17 Interim Results Presentation 15 December 2016 TEGEL GROUP HOLDINGS LIMITED FY17 INTERIM RESULTS 1 Disclaimer This presentation contains summary information about Tegel
Financial Year 1H19 Results
 Financial Year 1H19 Results Investor presentation 20 November 2018 1 Agenda 1. 1H19 Summary 2. 1H19 Financial results 3. FY19 Outlook 4. Q&A 5. Appendix 2 1H19 Summary Skander Malcolm Chief Executive Officer
FY18 Results Presentation Bravura Solutions Limited. 28 August 2018
 FY18 Results Presentation Bravura Solutions Limited 28 August 2018 Important notice and disclaimer The information contained in this document (including this notice) and discussed at this presentation
FY14. Vita Group (VTG) RESULTS PRESENTATION
 RESULTS PRESENTATION") FY14 Vita Group (VTG) RESULTS PRESENTATION GROUP HIGHLIGHTS Strong sustained performance in competitive markets Execution against strategic objectives Continued earnings growth from optimisation program
FY14 Vita Group (VTG) RESULTS PRESENTATION GROUP HIGHLIGHTS Strong sustained performance in competitive markets Execution against strategic objectives Continued earnings growth from optimisation program
4Q 2018 Highlights and Operating Results. Products. Technology. Services. Delivered Globally.
 4Q 2018 Highlights and Operating Results Products. Technology. Services. Delivered Globally. Table of Contents Page 3 Safe Harbor Statement and Non-GAAP Financial Measures 4 Sales Overview 9 Overview of
3Q 2018 Highlights and Operating Results. Products. Technology. Services. Delivered Globally.
 3Q 2018 Highlights and Operating Results Products. Technology. Services. Delivered Globally. Table of Contents Page 3 Safe Harbor Statement and Non-GAAP Financial Measures 4 Sales Overview 9 Overview of
Kathmandu FY12 Results Presentation
 Kathmandu FY12 Results Presentation Contents Results Overview Key Line Items Country Results Cash Flow, Balance Sheet, Dividend Growth Strategy Update FY13 Outlook Questions 2 Results Overview Results
25 February The Manager Market Announcements Australian Securities Exchange Limited 20 Bridge Street SYDNEY NSW 2000.
 Level 1 157 Grenfell Street Adelaide SA 5000 GPO Box 2155 Adelaide SA 5001 Adelaide Brighton Ltd ACN 007 596 018 Telephone (08) 8223 8000 International +618 8223 8000 Facsimile (08) 8215 0030 www.adbri.com.au
4Q 2017 Highlights and Operating Results
 4Q 2017 Highlights and Operating Results January 30, 2018 1 4Q 2017 Highlights and Operating Results Table of Contents Page(s) 1 Sales Overview 4-8 2 Financial Performance Trends 9-16 3 Leverage Metrics
Investor presentation
 FY17 INVESTOR PRESENTATION 1 18 August 2017 Investor presentation FY17 Agenda FY17 INVESTOR PRESENTATION 1. Overview & strategic landscape Melos Sulicich CEO & Managing Director 2. Financial results David
1Q 2018 Highlights and Operating Results
 1Q 2018 Highlights and Operating Results April 26, 2018 1 Table of Contents Page(s) 4 Announced Agreements to Acquire Australia and New Zealand Security Businesses 5-9 Sales Overview 10-17 Financial Performance
WAM Leaders (ASX: WLE)
") WAM Leaders (ASX: WLE) FY2016 update 17August 2016 Disclaimer This presentation has been prepared for use in conjunction with a verbal presentation and should be read in that context. Information for the
WAM Leaders (ASX: WLE) FY2016 update 17August 2016 Disclaimer This presentation has been prepared for use in conjunction with a verbal presentation and should be read in that context. Information for the
2017 Interim Results. Continuing Execution of Our Strategy. 3 August 2017
 2017 Interim Results Continuing Execution of Our Strategy 3 August 2017 0 Disclaimer THIS PRESENTATION IS NOT FOR RELEASE, PUBLICATION OR DISTRIBUTION, IN WHOLE OR IN PART, IN OR INTO THE UNITED STATES
COCHLEAR FINANCIAL RESULTS FOR YEAR ENDED JUNE 2017
 ASX Announcement 17 August 2017 COCHLEAR FINANCIAL RESULTS FOR YEAR ENDED JUNE 2017 Cochlear s market leadership position has strengthened with market growth and market share improvements throughout the
Sigma Pharmaceuticals Limited
 Investor Relations Contact: Gary Woodford Corporate Affairs Manager Gary.Woodford@signet.com.au Phone: 03 9215 9632 Mobile: 0417 399 204 Mark Hooper CEO and Managing Director Gary Woodford Corporate Affairs
Sonic Healthcare Limited ABN
 ABN 24 004 196 909 PRELIMINARY FINAL REPORT FOR THE YEAR ENDED 30 JUNE Lodged with the ASX under Listing Rule 4.3A Page 1 of 21 RESULTS FOR ANNOUNCEMENT TO THE MARKET For the year ended Financial Results
2017 Half-Year Results
 2017 Half-Year Results Martin Earp, CEO Josée Lemoine, CFO 16 August 2017 Financials Pillars of Growth Summary of Performance H1 2017 Sales Revenue $218.2m 1.7% Demographics Deaths 1 2.8% Australia $44.1m
Investor & Analyst Presentation Ful YearResults 30 June2016 For personal use only 25th August 2016 Rebekah O Flaherty - CEO I Jonathan Kenny - CFO
 Investor & Analyst Presentation Full YearResults 30 June2016 25th August 2016 Rebekah O Flaherty - CEO I Jonathan Kenny - CFO Agenda 1 Overview 2 Strategic Priorities 3 FY16 Financial Results 4 FY17 Outlook
Disclosure Statement. Page 2
 Disclosure Statement This presentation and the accompanying slides (the Presentation ) which have been prepared by Samsonite International S.A. ( Samsonite or the Company ) do not constitute any offer
25 th Annual General Meeting
 25 th Annual General Meeting 27 th October 2017 Page 1 Managing Director s Address Page 2 Workplace Health and Safety Total Injury Frequency Rate (TIFR) Continued focus on providing safe workplace for
Tegel Group Holdings Limited
 Tegel Group Holdings Limited FY17 Full Year Results Presentation 27 June 2017 1 TEGEL GROUP HOLDINGS FY17 RESULTS PRESENTATION Disclaimer This presentation contains summary information about Tegel Group
For personal use only
 Affinity Education Group (ASX:AFJ) Morgans Conference 10 October 2014 Disclaimer This presentation contains general information in summary form which is current as at 10 October 2014. It presents financial
FY18 - Half Year Investor Presentation 22 February 2018
 Who are we? FY18 - Half Year Investor Presentation 22 February 2018 Jonathan Rubinsztein CEO Richard Leon CFO Disclaimer Forward looking statements: All statements other than statements of historical fact
For personal use only. FY2017 H1 Results February 2017
 For personal use only FY2017 H1 Results February 2017 The half year in review Broader automotive market supported by record new vehicle sales in Australia and New Zealand Strong Automotive earnings growth
Trimble Second Quarter 2018 Results Summary
 Trimble Second Quarter 2018 Results Summary Forward-looking statements Certain statements made in this presentation and any subsequent Q&A period are forward-looking statements, within the meaning of Section
Cameron Judson, CEO Glynn Wright, CFO. McGrath Limited (ASX: MEA) Results for the 6 months ended 31 December February 2018
 Results for the 6 months ended 31 December February 2018") Cameron Judson, CEO Glynn Wright, CFO McGrath Limited (ASX: MEA) Results for the 6 months ended 31 December 2017 15 February 2018 1H18 A SNAPSHOT REVENUE DOWN 23% TO $51.6M GOODWILL IMPAIRMENT ($21.8)
Cameron Judson, CEO Glynn Wright, CFO McGrath Limited (ASX: MEA) Results for the 6 months ended 31 December 2017 15 February 2018 1H18 A SNAPSHOT REVENUE DOWN 23% TO $51.6M GOODWILL IMPAIRMENT ($21.8)
Inghams Group Limited. FY2018 Results Presentation
 Inghams Group Limited FY2018 Results Presentation 22 AUGUST 2018 Important notice and disclaimer Disclaimer The material in this presentation is general background information about the activities of Inghams
KATHMANDU FY10 RESULTS PRESENTATION
 KATHMANDU FY10 RESULTS PRESENTATION 1 CONTENTS Results Overview Key Line Items Country Results Cash Flow, Dividend, Balance Sheet FY11 Outlook Growth Strategy Update Questions 2 RESULTS OVERVIEW 3 RESULTS
During the year, the Company achieved a number of milestones in executing its growth strategy:
 Party City Announces Fourth Quarter and Full Year 2015 Results Revenue increase of 4% 1 on a constant currency basis to a record $2.29 billion for fiscal year 2015 Adjusted Net Income increase of 32% in
Total Transaction Value (TTV) (unaudited) $1,870m Up 9% Revenue and other income $150.5m Up 26% Statutory NPAT $22.1m Up 28%
 (unaudited) $1,870m Up 9% Revenue and other income $150.5m Up 26% Statutory NPAT $22.1m Up 28%") 24 February, 2017 ASX RELEASE Corporate Travel Management reports record 1HFY17 profit, Trading at top end of FY2017 profit guidance, or $97m 1HFY17 Results Highlights: Total Transaction Value (TTV) (unaudited)
24 February, 2017 ASX RELEASE Corporate Travel Management reports record 1HFY17 profit, Trading at top end of FY2017 profit guidance, or $97m 1HFY17 Results Highlights: Total Transaction Value (TTV) (unaudited)
For personal use only
 16 March 2017 Myer records first half NPAT growth of 5.3% to $62.8 million Myer Holdings Limited (MYR) today announced its financial results for the 26 weeks to 28 January 2017. Myer Chief Executive Officer
First Quarter Fiscal 2017 Financial Results
 First Quarter Fiscal 2017 Financial Results Management Presenters Joe Chlapaty Chairman and Chief Executive Officer Scott Cottrill Executive Vice President, Chief Financial Officer, Secretary and Treasurer
COLLINS FOODS LIMITED. MORGANS ANNUAL QLD CONFERENCE 8 October 2014
 COLLINS FOODS LIMITED MORGANS ANNUAL QLD CONFERENCE 8 October 2014 Page 1 Chief Executive Officer Graham Maxwell Collins Foods Limited 170 KFC restaurants across Queensland, Western Australia and Northern
 ASX ANNOUNCEMENT DATE: 22 February 2017 Attached is the Presentation regarding Pact s Half year Financial Results for the half year ended 31 December 2016. The Presentation will occur at 10am (Melbourne
Vita Group (VTG)! Results Presentation!
! Results Presentation!") Vita Group (VTG) Results Presentation First half FY14 Group highlights Sustained trend of strong profit, dividend growth Underlying EBITDA 1 +18%, underlying NPAT 2 +56%, dividend +66% Areas of strategic
Vita Group (VTG) Results Presentation First half FY14 Group highlights Sustained trend of strong profit, dividend growth Underlying EBITDA 1 +18%, underlying NPAT 2 +56%, dividend +66% Areas of strategic
Capital raising. May Doug Rathbone Managing Director and Chief Executive Officer. Kevin Martin Chief Financial Officer
 May 15 2009 Capital raising Doug Rathbone Managing Director and Chief Executive Officer Kevin Martin Chief Financial Officer Robert Reis Group GM - Corporate Strategy & External Affairs Important information
H1 16 interim results. 22 September 2015
 H1 16 interim results 22 September 2015 Important notice 2 This presentation may include certain forward-looking statements, beliefs or opinions, including statements with respect to the Company s business,
FY2017 Result Presentation. 21 August 2017
 FY2017 Result Presentation 21 August 2017 The Hansen journey growing and diversifying by geography, industry, propriety products and customer Early 1990 s Today Revenue by geography Industry verticals
For personal use only
 Tegel Group Holdings Limited FY18 Interim Results Presentation 6 December 2017 1 TEGEL GROUP HOLDINGS FY18 INTERIM RESULTS PRESENTATION Disclaimer This presentation contains summary information about Tegel
Full-Year 2017/18 Results Stäfa, May 22, 2018 Arnd Kaldowski, CEO Hartwig Grevener, CFO Thomas Bernhardsgrütter, IR
 Full-Year 2017/18 Results Stäfa, Arnd Kaldowski, CEO Hartwig Grevener, CFO Thomas Bernhardsgrütter, IR Disclaimer This presentation contains forward-looking statements, which offer no guarantee with regard
Following is a copy of the Presentation of Results for the financial half-year ended 29 December 2012.
 20 February 2013 Company Announcements Office Australian Securities Exchange Limited 20 Bridge Street Sydney NSW 2000 By electronic lodgment Total Pages: 27 (including covering letter) PRESENTATION OF
For personal use only
 FY16 FULL YEAR RESULTS REVIEW Agenda GROUP RESULTS OVERVIEW BUSINESS UNIT REVIEW OUTLOOK Eastlands Shopping Centre BSA completed the mechanical services upgrade and extension to one 29/08/2016 BSA Limited
Full Year. Results. 21 February 2019 For the year ended 31 December iress.com
 2018 Full Year Results 21 February 2019 For the year ended 31 December 2018 1 Agenda Who we are 3 2018 results 8 Segment overview 13 Financial information 22 2019 Outlook 27 Andrew Walsh Managing Director
Photo by James Ball - Coffey International Limited FY2013 Half Year Results Presentation. 11 February 2013
 Photo by James Ball - www.dlscape.com Coffey International Limited FY2013 Half Year Results Presentation 11 February 2013 Agenda Financial Performance Business Performance Outlook Presenters John Douglas
For personal use only
 FY16 RESULTS BRIEFING H U G H M A R K S C H I E F E X E C U T I V E O F F I C E R G R E G B A R N E S C H I E F F I N A N C I A L O F F I C E R M I C H A E L S T E P H E N S O N C H I E F S A L E S O F
For personal use only
 A S X A N N O U N C E M E N T DATE: 24 August 2016 FY2016 RESULTS PRESENTATION Attached is the Presentation regarding Pact s Financial Results for the year ended 30 June 2016. The Presentation will occur
COLLINS FOODS LIMITED Annual Queensland Conference
 COLLINS FOODS LIMITED Annual Queensland Conference 9 October 2013 COLLINS FOODS LIMITED 0 Today s agenda SECTION 1 Collins Foods Limited SECTION 2 KFC returns to growth SECTION 3 Sizzler in transition
For personal use only
 Level 32, 1 O Connell Street Sydney NSW 2000 W www.eclipxgroup.com Eclipx Group Limited ABN: 85 131 557 901 ASX Release 20 May 2015 ECLIPX GROUP REPORTS 1H15 NPATA OF $23.8M, ON TRACK TO MEET FY15 FORECAST
Interim Results Presentation. 28 August 2017
 Interim Results Presentation 28 August 2017 Forward Looking Statements The information in this presentation has not been independently verified and does not purport to be comprehensive. One51 is not undertaking
26 November Company Announcements Office Australian Securities Exchange Limited Exchange Centre 20 Bridge Street Sydney NSW 2000
 26 November 2013 Company Announcements Office Australian Securities Exchange Limited Exchange Centre 20 Bridge Street Sydney NSW 2000 Aristocrat Leisure Limited 2013 Aristocrat Leisure Limited will make
INTERIM RESULTS PRESENTATION SIX MONTHS TO 30 JUNE 2018
 INTERIM RESULTS PRESENTATION SIX MONTHS TO 30 JUNE 2018 DISCLAIMER The information contained in this presentation has not been independently verified and this presentation contains various forward-looking
For personal use only
 Mantra Group H1FY2015 Results Presentation 26 February 2015 Important notice and disclaimer Important notice and disclaimer This document is a presentation of general background information about the activities
JB Hi-Fi Limited. Full Year Results Presentation 30 June 2009
 JB Hi-Fi Limited Full Year Results Presentation 30 June 2009 11 August 2009 Agenda 1. Performance 2. Historical Performance 3. Trading Update 4. Financial Detail 5. Dividends 6. Store Update 7. Investment
Disclosure Statement. Page 2
 Disclosure Statement Page 2 This presentation and the accompanying slides (the Presentation ) which have been prepared by Samsonite International S.A. ( Samsonite or the Company ) do not constitute any
a2 Milk, a2 Platinum and The a2 Milk Company are trade marks of The a2 Milk Company Limited
 a2 Milk, a2 Platinum and The a2 Milk Company are trade marks of The a2 Milk Company Limited Agenda 1. Result highlights 2. Group Infant Formula update 3. Regional update 4. Research and development 5.
For personal use only. Investor Update 13 August 2018
 Investor Update 13 August 2018 Important Notice This presentation contains forward looking statements which may be subject to significant uncertainty outside of Legend Corporation Limited s (Legend) control.
Full Year results and outlook
 PRESENTATION TO INVESTORS & ANALYSTS Full Year results and outlook David Banfield, Group CEO 29 August 2018 for 12 months 1 July 2017 30 June 2018 Strong international performance drives double digit earnings
Business Update. USPP Conference Miami. Luis Damasceno Group CFO Michael Williams Group Finance Director & Treasurer January 2019
 Business Update USPP Conference Miami Luis Damasceno Group CFO Michael Williams Group Finance Director & Treasurer 23-25 January 2019 www.alsglobal.com IMPORTANT NOTICE AND DISCLAIMER This presentation
Company Results Half Year ended 4 January 2009
 Michael Luscombe Chief Executive Officer Tom Pockett Finance Director Company Results Half Year ended 4 January 2009 Highlights Financial Half Year 09 This is a strong result reflecting increasing customer
Sales increased 8.1% to $128.0m (HY17: $118.4m) Increase assisted by sales from new stores opened in FY17 and HY18
 Increase assisted by sales from new stores opened in FY17 and HY18") Nick Scali Limited NCK.ASX Macquarie Conference 2nd May 2018 Key H1-18 Highlights Sales Sales increased 8.1% to $128.0m (HY17: $118.4m) Increase assisted by sales from new stores opened in FY17 and HY18
Nick Scali Limited NCK.ASX Macquarie Conference 2nd May 2018 Key H1-18 Highlights Sales Sales increased 8.1% to $128.0m (HY17: $118.4m) Increase assisted by sales from new stores opened in FY17 and HY18
Full year results 30 June 2018.
 CORPORATE TRAVEL MANAGEMENT Full year results 30 June 2018. Presented by: Jamie Pherous, Founder & Managing Director Date: 22 nd August, 2018 PAGE 2 Disclaimer The information in this presentation does
FULL YEAR RESULTS PRESENTATION WELL POSITIONED FOR CONTINUED GROWTH. 3 April 2017
 FULL YEAR RESULTS PRESENTATION WELL POSITIONED FOR CONTINUED GROWTH 3 April 2017 AGENDA Introduction and overview John Hornby Financial review David Main Strategic progress and outlook John Hornby Questions
AUB GROUP LTD FULL YEAR RESULTS
 AUB GROUP LTD FULL YEAR RESULTS FOR THE PERIOD ENDED 30 JUNE 207 (FY7) 28 TH AUGUST 207 Page - AUB Group Ltd FY7 Results NOTICE SUMMARY INFORMATION This document has been prepared by AUB Group Limited
Bell Potter Emerging Leaders Conference
 Bell Potter Emerging Leaders Conference Sydney, 24 October 2017 Leon Allen, Managing Director and CEO Disclaimer This presentation has been prepared by QANTM Intellectual Property Limited ACN 612 441 326
Acquisition of European herbicide product portfolio from FMC
 Acquisition of European herbicide product portfolio from FMC 8 November 2017 Important notice and disclaimer This presentation has been prepared by Nufarm Limited ACN 091 2 12 ( Nufarm" or the "Company").
Business outlook 13 November 2018
 Business outlook 13 November 2018 Disclaimer Disclaimer This investor presentation (Presentation) has been prepared by Navitas Limited ABN 69 109 613 309 (Navitas) for information purposes only. In response
For personal use only. FY2017 Results Presentation
 FY2017 Results Presentation Disclaimer The material in this presentation has been prepared by Bapcor Limited ( Bapcor ) ABN 80 153 199 912 and is general background information about Bapcor s activities
2018 half year results investor presentation
 2018 half year results investor presentation 26 Feb 2018 Important notice and disclaimer This presentation includes information about the activities of amaysim Australia Limited ( amaysim ) which is current
February 21, Fourth Quarter 2018 Results
 February 21, 2019 Fourth Quarter 2018 Results Forward-looking statements This presentation, as well as other statements made by Delphi Technologies PLC (the Company ), contains forward-looking statements
Cover-More Group. UBS Australasia Conference. November 2015
 Cover-More Group UBS Australasia Conference November 2015 Executive summary: FY15 overview Cover-More delivered another year of double digit earnings growth, with offshore business growing substantially.
Select Harvests Limited ( SHV )
") Select Harvests Limited ( SHV ) 2016 Annual General Meeting Growing Together 25 November 2016 Disclaimer & Basis of Preparation This presentation is provided for information purposes only and has been
Select Harvests Limited ( SHV ) 2016 Annual General Meeting Growing Together 25 November 2016 Disclaimer & Basis of Preparation This presentation is provided for information purposes only and has been
CHAIRMAN S ADDRESS TO THE 53 RD ANNUAL GENERAL MEETING
 CHAIRMAN S ADDRESS TO THE 53 RD ANNUAL GENERAL MEETING Good morning, ladies and gentlemen Thank you for joining us and welcome to Schaffer Corporation s 2007 Annual General Meeting. Schaffer Corporation
amagroupltd.com Page 1
 amagroupltd.com Page 1 WORLD CLASS AUTOMOTIVE SOLUTIONS Page 2 Page 3 Contents. Highlights AMA Group Overview Financial Performance Vehicle Panel Repairs ACAD and Procurement Strategy and Outlook HIGHLIGHTS
For personal use only. FY16 Results Presentation
 FY16 Results Presentation PAGE 1 Agenda 1. Highlights 2. FY16 Results Trading performance Balance sheet and cash flow Capital management 3. Business Update Our objectives The JB HI-FI model Store portfolio
Big River Industries Limited (ASX:BRI)
") Big River Industries Limited (ASX:BRI) FY2018 Half Year Results Briefing 27 February 2018 Optus Stadium - Perth H1 FY2018 - Contents 1. Highlights 2. Business Diversity Strengthening 3. Sales Highlights
Big River Industries Limited (ASX:BRI) FY2018 Half Year Results Briefing 27 February 2018 Optus Stadium - Perth H1 FY2018 - Contents 1. Highlights 2. Business Diversity Strengthening 3. Sales Highlights
ANNUAL GENERAL MEETING
 Virtus Health (ASX. VRT) ANNUAL GENERAL MEETING Wednesday 22nd November 2017 2.00pm AEDT DISCLAIMER The material in this presentation has been prepared by Virtus Health Limited ABN 80 129 643 492 ( Virtus
PTC PREPARED REMARKS THIRD QUARTER FISCAL 2018 JULY 18, 2018
 PTC PREPARED REMARKS THIRD QUARTER FISCAL 2018 JULY 18, 2018 Please refer to the updated Important Disclosures section of these prepared remarks for important information about our operating metrics (including
2016 THIRD-QUARTER EARNINGS REVIEW October 25, 2016
 2016 THIRD-QUARTER EARNINGS REVIEW October 25, 2016 0 THIRD-QUARTER EARNINGS PRESENTATION WHIRLPOOL CORPORATION ADDITIONAL INFORMATION This presentation contains forward-looking statements about Whirlpool