2017 Interim Results
|
|
|
- Cornelia Martha Carroll
- 5 years ago
- Views:
Transcription

1 2017 Interim Results
2 Disclosure Statement Page 2 This presentation and the accompanying slides (the Presentation ) which have been prepared by Samsonite International S.A. ( Samsonite or the Company ) do not constitute any offer or invitation to purchase or subscribe for any securities, and shall not form the basis for or be relied on in connection with any contract or binding commitment whatsoever. This Presentation has been prepared by the Company based on information and data which the Company considers reliable, but the Company makes no representation or warranty, express or implied, whatsoever, on the truth, accuracy, completeness, fairness and reasonableness of the contents of this Presentation. This Presentation may not be all-inclusive and may not contain all of the information that you may consider material. Any liability in respect of the contents of or any omission from this Presentation is expressly excluded. Certain matters discussed in this presentation may contain statements regarding the Company s market opportunity and business prospects that are individually and collectively forward-looking statements. Such forward-looking statements are not guarantees of future performance and are subject to known and unknown risks, uncertainties and assumptions that are difficult to predict. The Company s actual results, levels of activity, performance or achievements could differ materially and adversely from results expressed in or implied by this Presentation, including, amongst others: whether the Company can successfully penetrate new markets and the degree to which the Company gains traction in these new markets; the sustainability of recent growth rates; the anticipation of the growth of certain market segments; the positioning of the Company s products in those segments; the competitive environment; general market conditions and potential impacts on reported results of foreign currency fluctuations relative to the U.S. Dollar. The Company is not responsible for any forward-looking statements and projections made by third parties included in this Presentation.
3 Agenda Results Highlights Business Overview Financial Highlights Strategy, Outlook and Key Initiatives Q&A Page 3
4 1 st Half 2017 Results Highlights Record 1 st Half Net Sales of US$1.6 billion +31.8% Constant Currency Growth +39.2% Constant Currency Growth +27.2% Constant Currency Growth 0.0% Constant Currency Growth Constant currency net sales growth of US$384.1 million, partly offset by negative currency translation impact of US$7.5 million. Excluding $292.5 million of Tumi net sales, constant currency net sales growth was 7.5%. Gross margin up 300bp from 1H 2016 to 55.3%, largely due to the inclusion of Tumi, which had 64.1% gross margin. Excluding Tumi, gross margin improved from prior year by 110bp from 52.3% to 53.4%. Adjusted EBITDA margin decreased by 50bp from 1H 2016, largely due to advertising spend as a percentage of sales increasing by 80bp from 5.5% in 1H 2016 to 6.3% in 1H Adjusted Net Income is in line with 1H 2016 with additional profits from the Tumi business largely offset by higher interest expense associated with financing the acquisition and higher advertising spend in the core business. Page 4 Indicates % of net sales
5 1 st Half 2017 Business Overview Advertising and promotion spend of US$99.5 million (6.3% of sales) is 51.0%, or US$33.6 million, higher than 1H 2016 spend of US$65.9 million (5.5% of sales) as the Group is investing today in creating brand excitement for tomorrow. Strong constant currency growth of 89.0% (20.2% excluding Tumi) in total direct-to-consumer channel net sales with retail up 82.0% (10.2% excluding Tumi) and direct-to-consumer e- commerce up 126.7%, (73.9% excluding Tumi) largely due to the addition of ebags. Total e-commerce net sales (direct-toconsumer e-commerce and wholesale to e-retailers) constituted 10.5% (11.1% excluding Tumi) of total net sales, up 220bp from 8.3% in 1H 2016, largely due to the addition of ebags. Sustained investment in brands Multi-channel strategy Strong growth in all regions The Group generated operating cash flow of US$152.8 million in 1H 2017 compared to US$81.1 million recorded in the first half of the previous year, notwithstanding a US$32.5 million increase in cash interest payments primarily associated with the Tumi acquisition. Multicategory strategy Strong constant currency net sales growth in all regions: North America: +53.0% (+7.4% excluding Tumi) Asia: +19.8% (+3.8% excluding Tumi) Europe: +24.0% (+11.5% excluding Tumi) Latin America: +19.4% Multi-brand strategy Continuing to drive strong results while making progress on multibrand, multi-category and multi-channel strategy Constant currency net sales growth bolstered by diversified brand portfolio: Samsonite: +7.0% Tumi: +11.4% (1) American Tourister: +1.3% Speck: +9.2% Gregory: +21.9% Kamiliant: +98.2% Lipault: +22.3% Strong constant currency net sales growth across all product categories: Travel: +20.5% (+6.5% excluding Tumi) Business: +98.1% (+2.5% excluding Tumi) Casual: +29.8% (+19.3% excluding Tumi) Accessories: +40.6% (+8.5% excluding Tumi) Page 5 (1) Comparative figures for Tumi s period ended June 30, 2016 are based on Tumi s internal management reporting, adjusted as necessary to align with 2017 reporting of brand sales.
 North America: +7.4% Asia: +3.8% (1) Latin America: +19.4% (1) (1) (2) Incremental net sales of US$293.3 (1) million from the acquisition of Tumi.")
6 Strong net sales growth partly offset by slight currency translation pressure Net Sales Bridge 1H 2016 to 1H 2017 Organic net sales growth of US$90.8 million (1), or 7.5% (1) (2), coming from: +7.5% +24.2% -0.6% Europe: +11.5% (1) North America: +7.4% Asia: +3.8% (1) Latin America: +19.4% (1) (1) (2) Incremental net sales of US$293.3 (1) million from the acquisition of Tumi. Currency translation had an adverse impact of US$7.5 million on reported net sales from the strengthening US Dollar during the year. Page 6 * Constant currency impact of Tumi net sales from January through June of * (1) Stated on a constant currency basis. (2) Includes US$21.3 million additional net sales from the purchase of ebags.
7 Adjusted Net Income Bridge Reflects US$17.5 million additional investment in advertising yearover-year. Reflects US$16.0 million of advertising spend for Tumi brand in 1H 2017 compared to US$7.2 million in 1H Page 7 Note: The main items that are adjusted out of net income when calculating Adjusted Net Income are amortization, acquisition costs, joint venture put option expense and the estimated tax impact on these items. In 1H 2016, US$3.6 million ticking fees on Tumi acquisition debt were also adjusted out.


8 1 st Half 2017 Results Highlights Excluding Tumi Results +7.5% Constant Currency Growth +9.5% Constant Currency Growth +27.1% Constant Currency Growth +0.7% Constant Currency Growth Constant currency net sales growth of US$90.8 million, partly offset by negative currency translation impact of US$6.7 million. Constant currency net sales growth of 7.5% was driven by Europe +11.5%, North America +7.4%, Asia +3.8% and Latin America +19.4%. Gross margin increased 110bp due mainly to a higher proportion of sales from directto-consumer channels, as well as lower freight-in costs and lower promotional activity. Advertising as a percentage of net sales is 100bp higher than prior year, focusing on categories where there is opportunity to significantly increase market share. Adjusted EBITDA margin decreased by 90bp from 1H 2016 mainly driven by higher advertising spend as a percentage of net sales and higher retail operating expenses as a percentage of sales, partly offset by higher gross margin. Page 8 Indicates % of net sales
9 ebags acquisition will accelerate growth in the E-commerce channel and strengthen digital capabilities ebags is a leading online retailer of bags and related accessories for travel, providing consumers with a diverse offering of travel bags and accessories including luggage, backpacks, handbags, business bags, travel accessories and apparel sales of US$158.5 (1) million up 23.5% from the prior year. The acquisition will give the Group a strong platform to help accelerate the growth of its direct-to-consumer e-commerce business in North America and worldwide. It will also provide the Group with immediate resources and digital expertise to strengthen its existing digital capabilities. Purchase price of US$105 million was paid in cash. Transaction closed May 5, Page 9 (1) Extracted from the unaudited financial statements of ebags for the fiscal year ended December 25, 2016.
10 Tumi Acquisition Integration Update Integration going largely as planned one year after closing. SAP conversion completed in May Accelerated advertising vs. original plan by approximately US$18 million (US$10 million in 2016 and US$8 million in 1H 2017). Assumed direct control from distributors of key Asia markets ahead of plan South Korea, effective January 1, 2017; China and Hong Kong (including Macau), effective April 1, 2017; and Indonesia and Thailand, effective May 1, Sourcing initiatives going well with additional gross margin improvements anticipated in 2H 2017 and beyond. Estimated synergy savings to date of US$13.5 million, or approximately US$21.2 million of annualized savings, mainly through reduced headcount, public company, sourcing and freight expenses in line with original plans. Page 10
11 1 st Half 2017 Tumi Results Highlights* Record 1 st Half Net Sales of US$293 million Constant currency net sales growth of 11.4% includes the positive impact of buying back distributors in Asia. Excluding the impact of Asia distributor buybacks, constant currency net sales growth was approximately 8.2%, with North America +7.7%, Asia +7.4% and Europe +12.2%. Gross margin increased by 380bp due to the impact of distributor buybacks in Asia, less promotional activity in retail stores and Tumi.com and initial sourcing synergy benefits and cost savings. Advertising spend more than doubled from prior year levels, mostly in the U.S. market, in order to accelerate brand awareness and drive future sales growth. Indicates % of net sales Adjusted EBITDA margin decreased by 80bp mainly due to higher advertising spend as a percentage of net sales and higher operating expenses associated with buying back distributors, partly offset by higher gross margin and cost savings from synergies. Page 11 * Comparative figures for Tumi s period ended June 30, 2016 are based on Tumi s internal management reporting, adjusted as necessary to align with 2017 financial reporting. Europe sales in 2016 are adjusted to exclude sales to Samsonite s multi-brand retail stores in order to be comparable to 2017.

12 Tumi Net Sales by Region North America Asia Europe Strong constant currency net sales growth of 7.7% in North America was driven by 16 net new stores since January 2016, as well as wholesale growth of 3.1% and direct-toconsumer e-commerce growth of 33.1%. Page 12 Excluding distributor buybacks and the 31 stores that were included in those buybacks, Asia s constant currency net sales growth is approximately 7.4%, driven by 21 net new stores since January 2016 and growth in wholesale channels. Constant currency net sales growth of 12.2% in Europe was driven by retail sales growth of approximately 42% from 14.2% comps and 3 net new stores since January 2016 and e-commerce growth of approximately 14%, while wholesale sales were down approximately 14%. * Comparative figures for Tumi s period ended June 30, 2016 are based on Tumi s internal management reporting, adjusted as necessary to align with 2017 financial reporting. Europe sales in 2016 are adjusted to exclude sales to Samsonite s multi-brand retail stores in order to be comparable to 2017.

13 North America Tumi driving significant increase in sales and profitability. Page % Constant Currency Growth Net sales growth of approximately US$29.9 million, or 7.4% on a constant currency basis. Excluding Tumi Indicates % of net sales Adjusted EBITDA up approximately US$2.1 million. As a percentage of net sales, Adjusted EBITDA is down 60bp from prior year. Net sales increased by 53.0% (1) including Tumi sales of US$183.9 million. Excluding Tumi sales, growth was 7.4% (1), with stronger growth in Q2 of 14.3% (1) (5.3% (1) excluding additional sales from ebags) compared to -0.9% (1) in Q1. Net sales growth for the half, excluding Tumi, was driven by: Net sales growth in the wholesale channel was 1.9% (1), including 13.2% (1) increase in net sales to e-retailers; Direct-to-consumer channel net sales were up 34.2% (1) year-over-year as: Direct-to-consumer e-commerce net sales increased by 154.3% (1) largely due to the acquisition of ebags in May; The retail channel was up 3.1% (1), with a 1.0% (1) increase in same store sales plus the full half impact of 5 net new stores in Core brands of Samsonite and American Tourister grew 4.9% (1) and 1.9% (1), respectively. Mixed performance amongst other brands with High Sierra -14.4% (1) due to non-recurrence of a backpack program at a wholesale customer that ran in 1H Hartmann -17.1% (1), Lipault +56.7% (1), and Speck +9.1% (1). Travel, accessories and casual category sales were up 7.9% (1), 15.9% (1) and 3.0% (1), respectively, while business category sales were down very slightly, -0.5% (1), due to slippage in office and electronics superstores sales. Strong growth in accessories category sales was driven by Speck smartphone protective cases as well as the ebags acquisition. Adjusted EBITDA as a percentage of net sales is down 20bp from prior year with the inclusion of Tumi. Excluding Tumi, Adjusted EBITDA margin decreased by 60bp driven by 130bp increase in advertising as a percentage of net sales and 100bp higher non-advertising operating expenses as a percentage of net sales due largely to the addition of ebags, partly offset by 180bp improvement in gross margin. (1) Stated on a constant currency basis
14 Asia Strong net sales and profit growth led by the addition of Tumi and supported by moderate growth in the organic business. Page % Constant Currency Growth Net sales growth of approximately US$17.8 million, or 3.8% on a constant currency basis. Excluding Tumi Indicates % of net sales Adjusted EBITDA up approximately US$1.5 million. As a percentage of net sales, Adjusted EBITDA is down 40bp from prior year. First half constant currency net sales growth of 19.8% (1) includes Tumi sales of US$75.7 million. Excluding Tumi, sales growth of 3.8% (1) was led by China +8.8% (1), Japan +12.8% (1) and Australia +5.8% (1), while South Korea and Hong Kong were down 1.6% (1) and 1.7% (1), respectively, due to fewer visitors from mainland China. Excluding Tumi: Strong net sales growth of 7.9% (1) in direct-to-consumer channels with: Retail store net sales growth of 2.7% (1) coming from one net new company operated store added in 1H 2017, and the full half impact of 26 net new stores added during This was partly offset by a 3.9% (1) decrease in same store comps due largely to adverse retail conditions in Hong Kong (including Macau) and South Korea; Direct-to-consumer e-commerce net sales growth of 24.8% (1) was driven by China and South Korea with growth of 24.0% (1) and 23.4% (1) respectively. Net sales growth of 3.0% (1) in wholesale channels including 37.7% (1) growth in net sales to e-retailers; Samsonite net sales growth of 4.4% (1) ; American Tourister net sales were down 3.4% (1) mainly due to decrease in the TV home shopping channel sales in South Korea and a shift in certain licensed product sales and B2B sales to other brands; Sales of Kamiliant, our value-conscious entry level brand launched at the end of 2015, almost doubled (1) over 1H 2016 and contributed US$16.4 million of net sales; Strong growth of 41.2% (1) in Lipault sales as the brand continued to successfully expand throughout the Asia region; Gregory enjoyed strong growth of 37.0% (1) mainly from Japan and South Korea. Travel category net sales growth of 1.0% (1). Casual category net sales increased by 22.9% (1) to overtake business as the second largest product category in Asia after travel. Business category sales decreased very slightly by 0.3% (1) due to a shift in B2B sales to the casual category. The accessories category was up 3.8% (1). Adjusted EBITDA margin of 21.2% was up 40bp from 1H 2016 mainly due to the impact of Tumi. Excluding Tumi, Adjusted EBITDA is down 40bp from 1H 2016 due to a 70bp increase in advertising as a percentage of net sales compared to 1H (1) Stated on a constant currency basis
15 Europe Strong net sales growth of 24.0% (1) driven by solid increase in organic sales and the inclusion of Tumi. Page % Constant Currency Growth Net sales growth of approximately US$30.8 million, or 11.5% on a constant currency basis. Excluding Tumi Indicates % of net sales Adjusted EBITDA down approximately US$0.6 million due to over $4 million additional advertising. As a percentage of net sales, Adjusted EBITDA is down 150bp from prior year. Constant currency net sales growth of 24.0% includes US$32.5 million of Tumi net sales. Excluding Tumi, sales growth was 11.5% on a constant currency basis led by Germany +15.2% (1), Russia +34.4% (1), UK +13.4% (1), and Italy +9.8% (1). This was driven by: Strong growth of 15.8% (1) in direct-to-consumer channels with: Retail up 13.6% (1), driven by +10.7% (1) same store comps, 10 net new company operated stores opened in 1H 2017 and the full half impact of 6 net new stores opened during 2016; Direct-to-consumer e-commerce net sales increased by 37.7% (1). Wholesale net sales growth of 9.4% (1), including 36.8% (1) increase in net sales to e-retailers; Strong net sales growth in core brands with Samsonite up 10.9% (1) and American Tourister up 22.2% (1). American Tourister comprised 15.8% of the net sales in the European region excluding Tumi during 1H 2017 compared to 14.1% during 1H 2016 and 12.1% in 1H 2015 as the Group continues to increase the presence of this brand in Europe; Lipault net sales increased by 1.6% (1) and Gregory was up by 44.4% (1). Hartmann sales decreased by 13.0% (1) as emphasis is on Tumi becoming the flagship premium brand in the region. High Sierra brand was exited in Europe, reflecting a strategic decision to focus on other casual brands in this region; Net sales for the travel category increased by 11.6% (1). Business and casual category net sales increased by 11.0% (1) and 47.5% (1), respectively, due to successful new product introductions and the accessories category net sales increased by 7.5% (1). Adjusted EBITDA margin decreased by 190bp. Excluding Tumi, Adjusted EBITDA margin decreased by 150bp mainly due to 90bp higher advertising as a percentage of sales and 70bp higher non-advertising operating expenses as a percentage of sales, partly offset by 10bp improvement in gross margin. (1) Stated on a constant currency basis
16 Latin America Strong growth in constant currency net sales and profitability +19.4% Constant Currency Growth Excluding Tumi Indicates % of net sales Net sales increased 19.4% (1) on strong growth in Chile +15.5% (1), Brazil +67.5% (1), and Mexico +6.3% (1)(2). Strong growth of 36.6% (1) in direct-to-consumer channels with retail up 35.5% (1) with same store comp growth of 16.8% (1) as well as 10 net new company owned stores opened during 1H 2017 and the full half impact of 37 net new stores opened during E-commerce sites have been recently launched in Chile and Brazil. Wholesale channel net sales growth of 10.1% (1) was driven mainly by Chile and Mexico. Samsonite net sales increased 22.4% (1) and American Tourister net sales grew by 3.5% (1). Strong net sales growth in brands that are specific to the Latin America region, with Xtrem +17.6% (1), Secret +19.9% (1) and Saxoline +11.6% (1). Strong net sales growth in the two major categories in the region with travel and casual up 21.2% (1) and 44.9% (1), respectively. Casual sales growth is largely due to strong back-to-school sales. Business category was up 7.8% (1) with a 15.1% (1) decrease in the accessories category. Adjusted EBITDA as a percentage of net sales was up 160bp mainly driven by 400bp higher gross margin compared to 1H 2016, partially offset by 150bp higher advertising as a percentage of sales and 120bp higher retail operating expenses as a percentage of sales. Gross margin improvement was attributable to channel mix shift towards direct-to-consumer channels, strong back-to-school sales, lower freight costs and price increases. Tumi net sales made to distributors in the Latin America region totalling approximately US$0.8 million were processed and recorded in the North America region. Page 16 (1) Stated on a constant currency basis (2) Mexico, excluding export sales
17 Constant currency net sales growth in most key markets (1) (2) Page 17 (1) Hong Kong includes Macau and wholesale sales to Asia s Tumi distributors. (2) UK includes Ireland.

18 Continued brand penetration drove constant currency net sales growth in most emerging markets with combined constant currency growth of 13.1% excluding Tumi (1) Page 18 (1) Mexico, excluding export sales
, with: D-T-C e-commerce Strong retail net sales growth of 10.2% (1) driven by same store comps of 4.")
19 Direct-to-consumer channel sales accelerated with the acquisitions of Tumi and ebags (2) 1H 2017 net sales by channel (2) + = Wholesale Retail Excluding Tumi, direct-to-consumer net sales growth was 20.2% (1), with: D-T-C e-commerce Strong retail net sales growth of 10.2% (1) driven by same store comps of 4.9% (1) and the addition of 21 net new stores in 1H 2017 and the full half impact of 74 net new stores added in Strong direct-to-consumer e-commerce net sales growth of 73.9% (1), largely driven by the addition of ebags (+20.7% excluding ebags). Excluding Tumi, total e-commerce net sales increased by 44.9% (1) and made up 11.1% of total net sales in 1H 2017, up from 8.3% of total net sales in 1H 2016, largely due to the addition of ebags. 25.5% (1) growth in net sales to e-retailers, included within the wholesale channel. 73.9% (1) growth in direct-to-consumer e-commerce net sales, included within the direct-to-consumer channel. Page 19 (1) Stated on a constant currency basis. (2) Samsonite includes ebags net sales of US$21.3 million for May and June of 2017.
20 Diversified brand portfolio generated continued net sales growth Constant Currency Growth Page 20 Net Sales growth by brand 7.0% NA 1.3% 9.2% -16.0% 21.9% 98.2% 22.3% 2.8% 33.0% (1) Stated on a constant currency basis. (2) 1H 2017 includes US$4.5 million of Tumi brand net sales made through Rolling Luggage and other Samsonite multi-brand stores as well as ebags, compared to US$3.1 million through Rolling Luggage and other Samsonite multi-brand stores in 1H 2016, which were classified under Other brands. (3) 1H 2016 sales are based on Tumi s internal management reporting adjusted to align with 2017 financial reporting. Strong growth in Samsonite with net sales up 7.0% on a constant currency basis: Europe +10.9% (1), North America +4.9% (1), Asia +4.4% (1), and Latin America +22.4% (1). Tumi contributed US$296.9 (2) million of net sales in the first half. This included US$4.5 million of Tumi brand net sales made through Rolling Luggage and other Samsonite multi-brand stores as well as ebags. Excluding these sales, Tumi net sales increased by 11.4% (1)(3) compared to 1H American Tourister net sales growth of 1.3% on a constant currency basis with strong growth in Europe +22.2% (1) and moderate 1.9% (1) growth in the Americas offsetting a small decline in Asia -3.4% (1). Expecting higher 2 nd half growth in the Americas with launch of new products. Speck net sales growth of 9.2% is largely due to successful new product launches related to new electronic device introductions and expanded distribution. Net sales of the High Sierra brand decreased as the focus has been on growing Samsonite backpacks worldwide, as well as Gregory in Europe and Asia and local backpack brand Xtrem in Latin America. Strong net sales growth for Gregory driven by double digit growth in Asia and Europe. Kamiliant, the value-conscious entry level brand launched at the end of 2015 that is sold in Asia, almost doubled (1) net sales over the prior year. Lipault net sales up 22.3% (1) over 1H 2016 driven by expansion in Asia and North America. Hartmann net sales were up in Asia, largely offset by a small decrease in North America. Constant currency net sales growth of 33.0% in Other brands includes the additional sales of third party brands sold through ebags as well as increased net sales of the Xtrem, Secret and Saxoline brands in Latin America.


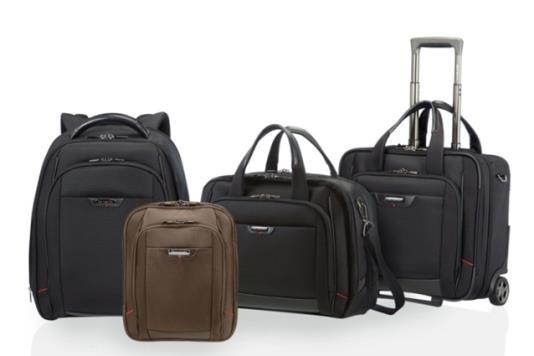


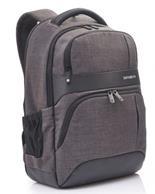
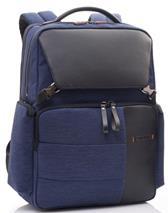
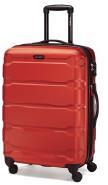
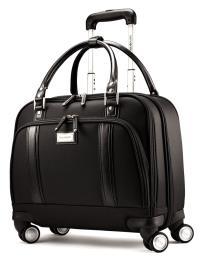
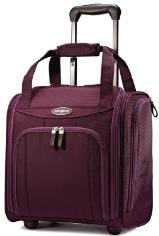
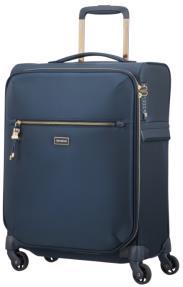
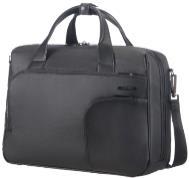
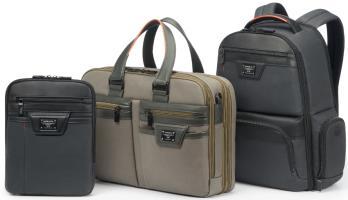
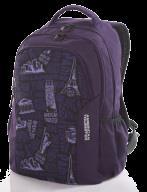
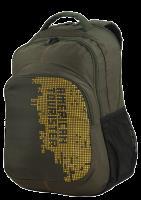

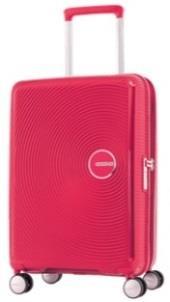
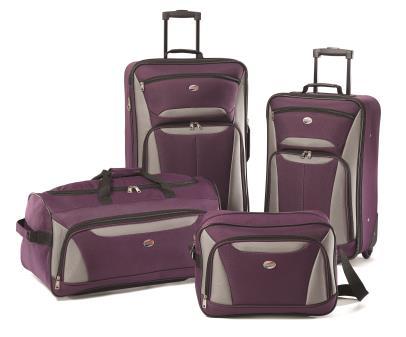
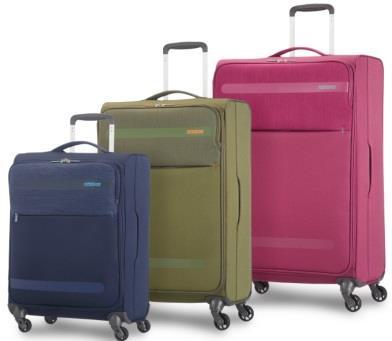
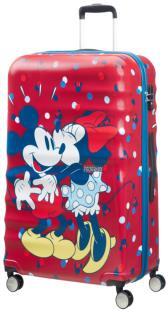
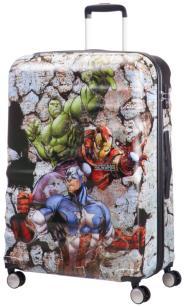

21 Key Product Assortment North America Europe Asia North America Asia Europe Latin America Page 21


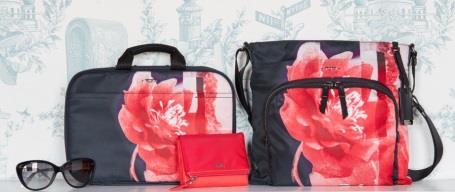

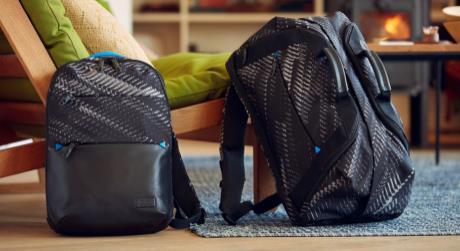
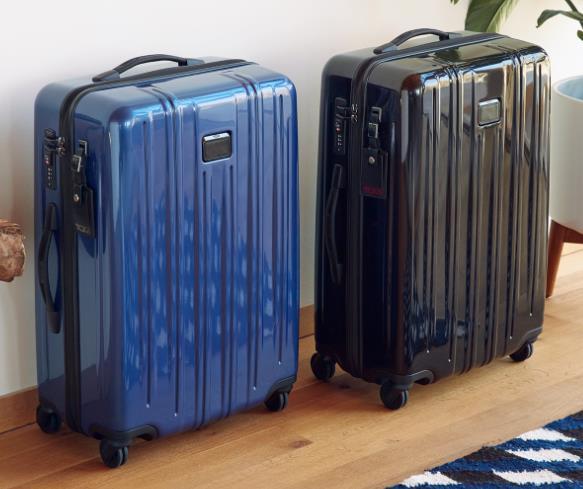
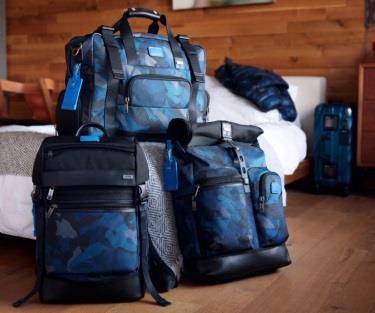
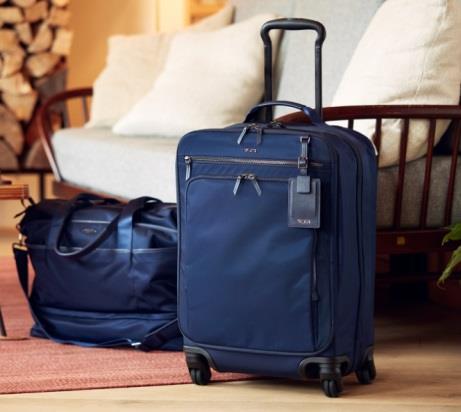
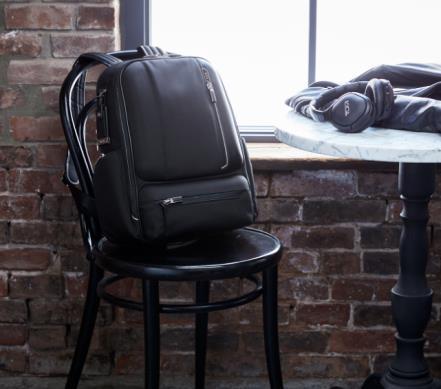
22 Page 22 Key Product Assortment


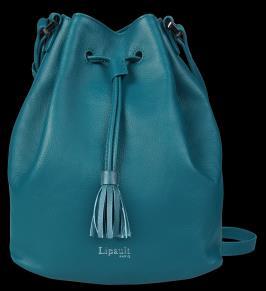

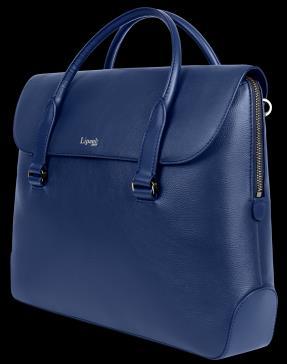


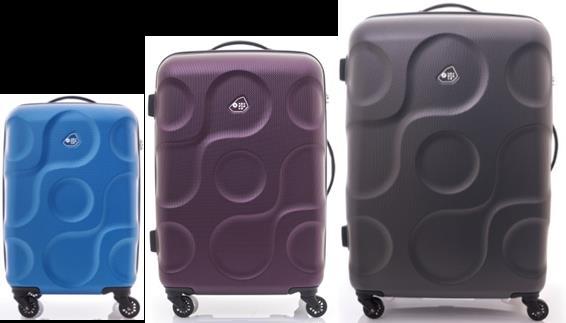
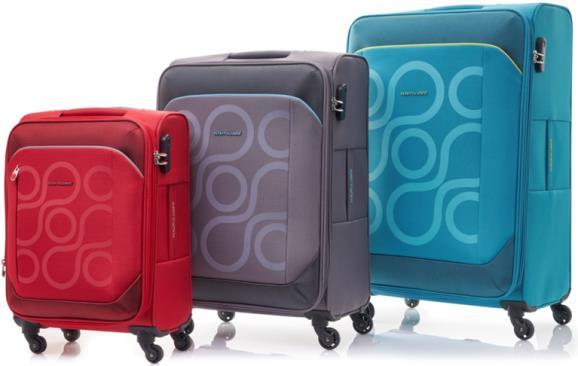
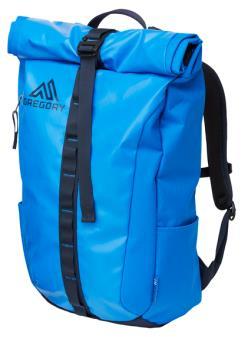

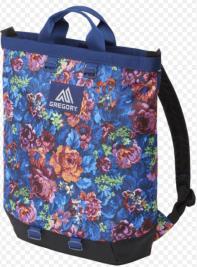
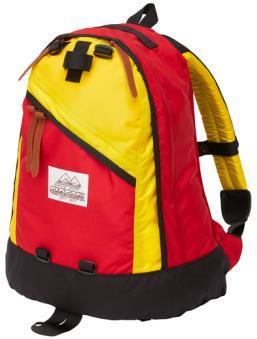
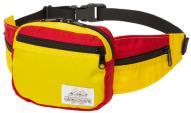
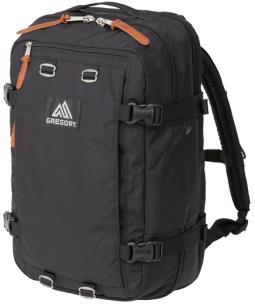
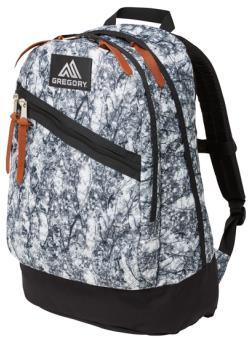
23 Page 23 Key Product Assortment
24 All key categories contributed to Net Sales growth Net Sales growth by product category Non-Travel categories constituted US$608.4 million of net sales in 1H 2017, representing 38.4% of total net sales compared to US$392.5 million, or 32.4% of net sales in 1H Const. Curr. Growth 20.5% 98.1% 29.8% 40.6% 25.5% Travel remained our largest product category and traditional strength with all regions contributing to its growth of 6.5% (1), excluding Tumi. Non-travel net sales increased from 32.4% of total net sales in 1H 2016 to 38.4% of total net sales in 1H Excluding the impact of Tumi, non-travel sales in 1H 2017 represent 33.2% of total net sales, with: Net sales in the business category increased by 2.5% (1), largely due strong growth in Europe +11.0% (1) and Latin America +7.8% (1), while North America -0.5% (1) and Asia -0.3% (1) were down slightly; Casual category net sales increased by 19.3% (1) driven largely by Asia, Latin America and Europe; Growth of 8.5% (1) in the accessories category was mainly attributable to net sales of Speck phone cases in North America as well as accessories sold through ebags. Const. Curr. Growth excl. Tumi 6.5% 2.5% 19.3% 8.5% -3.2% Page 24 (1) Stated on a constant currency basis

25 51.0% increase in global advertising spend to drive continued sales growth Indicates % of net sales Total advertising spend increased by US$33.6 million, or 51.0%, focused mainly on boosting consumer awareness of Tumi and other newer brands within the regions and non-travel categories within the Samsonite brand. On a constant currency basis, excluding Tumi, advertising spend increased by US$17.9 million, or 27.1%, compared to 1H 2016 As a percentage of net sales, excluding Tumi, total advertising spend of 6.5% is 100bp higher than 1H This is the result of the company returning to more normalized advertising as a percentage of net sales after temporarily scaling back advertising in Tumi advertising was US$16.0 million for the first half of 2017, or 5.5% of net sales for the period. This represents a significant increase over the amounts that Tumi was investing in advertising prior to the acquisition. In 1H 2016 Tumi spent approximately 2.7% of net sales on advertising based on Tumi s internal management reporting. Page 25


26 Targeted Brand Advertising American Tourister Mexico digital ad Samsonite United States digital ad Tumi Print Ad Japan American Tourister U.K. Kamiliant Philippines American Tourister Australia Page 26 Lipault Print Ad Latin America Samsonite Europe
27 Financial Highlights Net sales increased to a record 1 st half level of US$1.6 billion, with net sales growth of 7.5% (1) excluding Tumi, and an additional US$292.5 million of net sales from Tumi, which grew by 11.4% (2). Adjusted Net Income was flat year-over-year as the additional Tumi profits were offset by interest expense associated with acquiring the business. Additionally, profits in the Samsonite core business were relatively unchanged compared to prior year due mainly to US$17.5 million additional investment in advertising. Operating cash flow of US$152.8 million in 1H 2017 compared to US$81.1 million recorded in 1H 2016, an increase of US$71.7 million, notwithstanding a US$32.5 million increase in cash interest payments primarily associated with the Tumi acquisition. Net debt position of US$1,617.2 million as of June 30, 2017, with US$377.8 million of cash and cash equivalents and US$1,995.0 million of debt (excluding deferred financing costs of US$63.2 million). US$85.9 million was outstanding on the revolving credit facility, leaving US$414.1 million available under the revolver. The Company was in compliance with all debt covenants as of June 30, Pro forma total net leverage ratio (3) of 2.88:1.00. Net working capital efficiency of 11.7% as of June 30, 2017 continued to run favorable to target level of 14%, even with Tumi included. Capital expenditures of US$32.4 million in 1H 2017 was largely focused on the Group s continuing strategy to pursue targeted retail expansion and store modifications and lead the industry in new product innovations. The effective tax rate was 24.3% in 1H 2017, compared to 27.3% in 1H 2016, with the 300bp decrease coming mainly from tax deductions on interest expense and the tax effect of stock price increase on share-based compensation, partially offset by the inclusion of Tumi, which had a majority of its income generated in the higher tax rate jurisdiction of the United States. On July 12, 2017, a cash distribution of US$97.0 million, or approximately US$0.068 per share, was paid to shareholders, up 4.3% from the US$93.0 million distribution paid in Page 27 (1) Stated on a constant currency basis. (2) Comparative figures for Tumi s period ended June 30, 2016 are based on Tumi s internal management reporting, adjusted as necessary to align with 2017 financial reporting. Europe sales in 2016 are adjusted to exclude sales to Samsonite s multi-brand retail stores in order to be comparable to (3) Per the terms of the debt agreement, net leverage ratio is calculated as (total loans and borrowings total unrestricted cash)/ltm Adj. EBITDA. LTM Adj. EBITDA is calculated on a pro-forma basis to include the trailing twelve months of Tumi s results and pro-forma run-rate cost synergies expected at August 1, 2018.
28 Effective tax rate was mainly impacted by interest expense and non-recurring items 1H 2016 Effective Tax Rate 27.3% Samsonite normal year-over-year items impacting ETR: -1.1% Impact of Tumi on ETR: 2.0% Impact of interest expense on Tumi acquisition -2.8% Tumi acquisition had a net 80bp benefit on overall effective tax rate Impact of one-time items on ETR: Tax expense on transfer of Tumi Europe business 2.0% Tax benefit on share-based compensation -2.7% Tumi transaction and integration costs -0.4% Non-recurring items had a 110bp benefit on overall effective tax rate 1H 2017 Effective Tax Rate - Combined Group (reported) 24.3% Going forward, the normalized effective tax rate is expected to be in the range of 26% - 29%. Page 28
29 Balance sheet appropriately leveraged to finance Tumi acquisition US$m June 30, December 31, June 30, Cash and cash equivalents (1) (566.7) -60.0% Trade and other receivables, net % Inventories, net % Other current assets % Non-current assets 1, , , , % Total Assets 3, , , , % Current liabilities (excluding debt) % Non-current liabilities (excluding debt) % Total borrowings , , , % Total equity 1, , , % Total Liabilities and Equity 3, , , , % Total Net Cash (Debt) (2) (1,571.2) (1,617.2) (1,781.5) % (1) June 2016 cash and cash equivalents included US$671.6 million restricted cash for term loan proceeds held in escrow ahead of the Tumi transaction. (2) Total Net Cash (Debt) excludes deferred financing costs, which are included in total borrowings. $ C hg Jun-17 vs. Jun-16 % C hg Jun-17 vs. Jun-16 (3) Per the terms of the debt agreement, net leverage ratio is calculated as (total loans and borrowings total unrestricted cash)/ltm Adj. EBITDA. LTM Adj. EBITDA is calculated on a pro-forma basis to include the trailing twelve months of Tumi s results and pro-forma run-rate cost synergies expected at August 1, Net debt increased by US$46.0 million in the first half of Cash flows from operations were US$152.8 million offset by outflows for capital expenditures of US$32.4 million, the purchase of ebags for US$105.0 million and costs associated with assuming direct control of distribution of Tumi products in South Korea, China, Hong Kong/Macau, Thailand and Indonesia for a total of US$65.1 million. Pro-forma total net leverage ratio (3) of 2.88:1.00 and US$414.1 million of revolver availability. Continued strong working capital efficiency of 11.7% as of June 30, Page 29
30 Efficiently managing working capital US$m June 30, June 30, (1) Working Capital Items Inventories $ $ $ % Trade and Other Receivables $ $ $ % Trade Payables $ $ $ % Net Working Capital $ $ $ % % of Net Sales 13.8% 11.7% Turnover Days Inventory Days Trade and Other Receivables Days Trade Payables Days Net Working Capital Days $ Chg Jun-17 vs. Jun-16 % Chg Jun-17 vs. Jun-16 Inventory turnover days calculated as ending inventory balance divided by cost of sales for the period and multiplied by the number of days in the period Trade and other receivables turnover days calculated as ending trade and other receivables balance divided by net sales for the period and multiplied by the number of days in the period Trade payables turnover days calculated as ending trade payables balance divided by cost of sales for the period and multiplied by the number of days in the period Net working capital efficiency (% of net sales) is calculated as net working capital divided by annualized net sales Working capital continued to be managed efficiently at 11.7% of net sales at June 30, 2017, favorable to targeted 14% level. Excluding Tumi, working capital efficiency at June 30, 2017 was 11.3%. Inventory turnover of 124 days as of June 30, Excluding Tumi, inventory turnover as of June 30, 2017 was 115 days, representing an improvement of 6 days from prior year. Trade and other receivables turnover of 43 days as of June 30, 2017 due to a higher proportion of sales through direct-to-consumer channels and higher proportion of retail in the Tumi business. Excluding Tumi, trade and other receivables turnover of 47 days was 3 days lower than prior year. Trade payables turnover of 125 days as of June 30, Excluding Tumi, trade payables turnover of 128 days, was 8 days higher than prior year due to timing of product purchases. Page 30
31 Capital Expenditures Capital Expenditure by project type US$m 1H H 2017 Retail Product Development / R&D/ Supply Information Services and Facilities Other Total Capital Expenditures $25.9 $32.4 The sum of the line items in the table may not equal the total due to rounding. 1H 2017 retail capex consisted of new stores and remodels in North America of US$7.4 million, Asia of US$3.7 million, Europe of US$4.0 million and Latin America of US$1.4 million. Capex on Product Development / R&D / Supply includes US$6.4 million on extension of our manufacturing facility in Hungary and US$1.6 million on product tooling and molds in Europe. US$2.4 million was spent on tooling and equipment for Speck in North America. Information Services and Facilities includes US$0.8 million for Tumi hardware upgrades in Europe. 1H 2017 capex includes US$7.0 million for Tumi capex, mainly on retail projects. Page 31
32 Company Strategy The Company aims to increase shareholder value through sustainable revenue and earnings growth and free cash flow generation. In order to achieve this objective, the Company has adopted the following principal strategies: Page 32 Continue to develop the Company into a well-diversified multi-brand, multi-category and multi-channel luggage, bag and accessories business. Leverage the Company's regional management structure, sourcing and distribution expertise and marketing engine to extend the strong Tumi brand into new markets and penetrate deeper into existing channels. Tactfully deploy multiple brands to operate at wider price points and broader consumer demographics with a focus on addressing the market opportunity for women s products in each category. Increase the proportion of sales from the Company's direct-to-consumer channel by growing direct-toconsumer e-commerce net sales and through targeted expansion of its bricks-and-mortar retail presence. Continue to invest in the Company's core brands with sustained R&D spending to produce lighter and stronger new materials as well as exciting and innovative new products supported by effective marketing spend to drive awareness among consumers. Increase the Company s investment in marketing to support global expansion of Tumi and to continue to drive visibility for Samsonite, American Tourister and other brands.
33 Outlook and Key Initiatives The Group expects continuing benefits from steady growth in travel and tourism worldwide. Destinations worldwide received 369 million international tourists (overnight visitors) in the first four months of the year, 21 million more than in the same months of 2016 (+6%) (1) The current strong momentum is reflected in the UNWTO Panel of Tourism Experts confidence index, based on evaluations and prospects of worldwide experts surveyed every four months since Experts evaluated tourism performance in the first four months of 2017 with the highest score in 12 years. (1) Key initiatives: Continue to aggressively invest in advertising and promotion to fuel brand excitement for significant growth in the future. Further emphasize our "Women First" strategy to better serve the women s product sector more credibly considering they control the majority of all discretionary consumer spending. Continue to invest in improving our online brand and consumer communications and trading platforms. Page 33 (1) Source: United Nations World Tourism Organization UNWTO, Press Release 17088, Jul
Disclosure Statement. Page 2
 Disclosure Statement Page 2 This presentation and the accompanying slides (the Presentation ) which have been prepared by Samsonite International S.A. ( Samsonite or the Company ) do not constitute any
Disclosure Statement. Page 2
 Disclosure Statement Page 2 This presentation and the accompanying slides (the Presentation ) which have been prepared by Samsonite International S.A. ( Samsonite or the Company ) do not constitute any
Disclosure Statement. Page 2
 Disclosure Statement This presentation and the accompanying slides (the Presentation ) which have been prepared by Samsonite International S.A. ( Samsonite or the Company ) do not constitute any offer
Disclosure Statement. Page 2
 Disclosure Statement Page 2 This presentation and the accompanying slides (the Presentation ) which have been prepared by Samsonite International S.A. ( Samsonite or the Company ) do not constitute any
2017 Third Quarter Results
 Samsonite International S.A. HKEX Stock Code: 1910 2017 Third Quarter Results November 13, 2017 Disclosure Statement Page 2 This presentation and the accompanying slides (the Presentation ) which have
2018 First Quarter Results May 14, Samsonite International S.A. Stock Code 1910
 2018 First Quarter Results May 14, 2018 Samsonite International S.A. Stock Code 1910 Disclosure Statement Page 2 This presentation and the accompanying slides (the Presentation ) which have been prepared
Disclosure Statement. Page 2
 Disclosure Statement Page 2 This presentation and the accompanying slides (the Presentation ) which have been prepared by Samsonite International S.A. ( Samsonite or the Company ) do not constitute any
Disclosure Statement. Page 2
 Disclosure Statement Page 2 This presentation and the accompanying slides (the Presentation ) which have been prepared by Samsonite International S.A. ( Samsonite or the Company ) do not constitute any
Samsonite International S.A. Publishes 2017 Third Quarter Report
 Samsonite International S.A. Publishes 2017 Third Quarter Report Double-digit Constant Currency Net Sales Growth Reported Across All Regions for the Three Months Ended September 30, 2017 HONG KONG, November
SAMSONITE INTERNATIONAL S.A.
 Hong Kong Exchanges and Clearing Limited and The Stock Exchange of Hong Kong Limited take no responsibility for the contents of this announcement, make no representation as to its accuracy or completeness
Samsonite International S.A.
 Samsonite International S.A. 13 15 avenue de la Liberté, L-1931 Luxembourg R.C.S. Luxembourg: B 159.469 (Incorporated under the laws of Luxembourg with limited liability) Consolidated financial statements
Samsonite International S.A. Announces 2018 Annual Results Net Sales Hits New Record of US$3.8 Billion
 Samsonite International S.A. Announces 2018 Annual Results Net Sales Hits New Record of US$3.8 Billion HONG KONG, March 13, 2019 Samsonite International S.A. ( Samsonite or the Company, together with its
(Incorporated in Luxembourg with limited liability) (Stock code: 1910)
 (Stock code: 1910)") (Incorporated in Luxembourg with limited liability) (Stock code: 1910) Samsonite International S.A. Announces 2014 Final Results Double-digit Revenue and EBITDA Growth for the Fifth Consecutive Year Net
(Incorporated in Luxembourg with limited liability) (Stock code: 1910) Samsonite International S.A. Announces 2014 Final Results Double-digit Revenue and EBITDA Growth for the Fifth Consecutive Year Net
Samsonite International S.A Avenue de la Liberte, L-1931, Luxembourg RCS Luxembourg: B (Incorporated under the laws of Luxembourg with
 Samsonite International S.A. 13 15 Avenue de la Liberte, L-1931, Luxembourg RCS Luxembourg: B159469 (Incorporated under the laws of Luxembourg with limited liability) Consolidated financial statements
Samsonite International S.A. Announces 2013 Final Results Net sales top a record US$2 billion for the first time
 (Incorporated in Luxembourg with limited liability) (Stock code: 1910) Samsonite International S.A. Announces 2013 Final Results Net sales top a record US$2 billion for the first time Highlights Samsonite
Samsonite International S.A. Announces 2013 Interim Results
 Samsonite International S.A. Announces 2013 Interim Results Highlights Samsonite s net sales for the six months ended June 30, 2013 increased by 16.5% 1 to another record US$983.6 million with growth across
Interim Results. For the six months ended June 30, 2011
 Interim Results For the six months ended June 30, 2011 Agenda Business and Financial Highlights Business Overview Financial Overview Concluding Remarks 2 Business Highlights in 1H 2011 Significant sales
SAMSONITE INTERNATIONAL S.A.
 Hong Kong Exchanges and Clearing Limited and The Stock Exchange of Hong Kong Limited take no responsibility for the contents of this announcement, make no representation as to its accuracy or completeness
Samsonite International S.A Interim Report. * For identification purposes only
 Samsonite International S.A. 2013 Interim Report * For identification purposes only Stock Code 1910 Contents 02 Corporate Information 03 Corporate Profile and Strategy 04 Financial Highlights 06 Chairman
SAMSONITE INTERNATIONAL S.A.
 Hong Kong Exchanges and Clearing Limited and The Stock Exchange of Hong Kong Limited take no responsibility for the contents of this announcement, make no representation as to its accuracy or completeness
SAMSONITE INTERNATIONAL S.A.
 Hong Kong Exchanges and Clearing Limited and The Stock Exchange of Hong Kong Limited take no responsibility for the contents of this announcement, make no representation as to its accuracy or completeness
SAMSONITE INTERNATIONAL S.A.
 Hong Kong Exchanges and Clearing Limited and The Stock Exchange of Hong Kong Limited take no responsibility for the contents of this announcement, make no representation as to its accuracy or completeness
SAMSONITE INTERNATIONAL S.A.
 Hong Kong Exchanges and Clearing Limited and The Stock Exchange of Hong Kong Limited take no responsibility for the contents of this announcement, make no representation as to its accuracy or completeness
901 S. Central Expressway, Richardson, TX 75080
 901 S. Central Expressway, Richardson, TX 75080 FOSSIL GROUP REPORTS RECORD SECOND QUARTER RESULTS Net Sales Increase 11% to a Record $706 Million EPS Increases 25% to a Record $1.15 Provides Third Quarter
COACH, INC. REPORTS FISCAL 2016 FIRST QUARTER RESULTS
 COACH, INC. REPORTS FISCAL 2016 FIRST QUARTER RESULTS First Quarter Net Sales Increased 3% Over Prior Year In Constant Currency; Down 1% On A Reported Basis First Quarter Non-GAAP Earnings Per Share was
Press release 8 March RESULTS
 2011 RESULTS Slight growth in sales, supported by emerging markets Current Operating Income of 2.2bn Net income, Group share, down 14%, impacted by significant one off elements Net debt reduced by more
July 26, 2017 LafargeHolcim Ltd 2015
 Second Quarter 2017 Results Beat Hess, Chairman and Interim CEO Roland Köhler, Interim COO and Regional Head of Europe, Australia/NZ & Trading Ron Wirahadiraksa, CFO July 26, 2017 LafargeHolcim Ltd 2015
901 S. Central Expressway, Richardson, TX 75080
 901 S. Central Expressway, Richardson, TX 75080 FOSSIL GROUP REPORTS THIRD QUARTER RESULTS Net Sales Increase 18% to $810 Million Diluted EPS Increases 25% to $1.58 Maintains Full Year EPS Guidance and
(Stock code: 1910) Operating profit increased by US$16.2 million, or 11.9%, year-on-year to US$152.3 million.
 Operating profit increased by US$16.2 million, or 11.9%, year-on-year to US$152.3 million.") Hong Kong Exchanges and Clearing Limited and The Stock Exchange of Hong Kong Limited take no responsibility for the contents of this announcement, make no representation as to its accuracy or completeness
Hong Kong Exchanges and Clearing Limited and The Stock Exchange of Hong Kong Limited take no responsibility for the contents of this announcement, make no representation as to its accuracy or completeness
1H 2018 Results Update Analyst Presentation
 1H 2018 Results Update Analyst Presentation July 31, 2018-6.00 PM CET Disclaimer This presentation contains forward-looking statements regarding future events and results of the Company that are based
FINAL RESULTS ANNOUNCEMENT FOR THE YEAR ENDED 31 MARCH 2010 FINANCIAL HIGHLIGHTS. Own stores number reached 764, increased by 11.
 Hong Kong Exchanges and Clearing Limited and The Stock Exchange of Hong Kong Limited take no responsibility for the contents of this announcement, make no representation as to its accuracy or completeness
TELECONFERENCE Q2 2018
 TELECONFERENCE Q2 2018 Copenhagen, 9 August 2018 1 Disclaimer Certain statements in this presentation constitute forwardlooking statements. Forward-looking statements are statements (other than statements
Full Year 2018 Results. 27 February 2019
 Full Year 2018 Results 27 February 2019 1. Key Highlights and Financial Summary Strong financial performance across all segments and progress made on all aspects of the strategic framework Financial Highlights
PTC PREPARED REMARKS FOURTH QUARTER AND FULL YEAR FISCAL 2017 OCTOBER 25, 2017
 PTC PREPARED REMARKS FOURTH QUARTER AND FULL YEAR FISCAL 2017 OCTOBER 25, 2017 Please refer to the Important Disclosures section of these prepared remarks for important information about our operating
1H 2018 results. Milan, July 23, 2018
 Milan, July 23, 2018 FORWARD-LOOKING STATEMENT Certain statements in this investor presentation may constitute forward-looking statements as defined in the Private Securities Litigation Reform Act of 1995.
AXA. Henri de Castries. Chairman & CEO. London - October 2, Sanford C. Bernstein Strategic Decisions Conference
 AXA Henri de Castries Chairman & CEO London - October 2, 2013 Sanford C. Bernstein Strategic Decisions Conference Cautionary note concerning forward-looking statements Certain statements contained herein
CONTINUING CONNECTED TRANSACTIONS IN RELATION TO THE SAMSONITE CHINA FRAMEWORK AGREEMENT
 Hong Kong Exchanges and Clearing Limited and The Stock Exchange of Hong Kong Limited take no responsibility for the contents of this announcement, make no representation as to its accuracy or completeness
COACH, INC. REPORTS FISCAL 2017 SECOND QUARTER RESULTS; DRIVES DOUBLE-DIGIT EARNINGS GROWTH
 COACH, INC. REPORTS FISCAL 2017 SECOND QUARTER RESULTS; DRIVES DOUBLE-DIGIT EARNINGS GROWTH Second Quarter Net Sales Increased 4% Over Prior Year Despite North America Wholesale Strategic Repositioning
Investor Meeting Presentation
 September 2015 HUGO BOSS September 2015 2 Agenda Financial Review First Half Year 2015 Strategic Outlook 2015 and beyond Financial Outlook 2015 HUGO BOSS September 2015 3 Agenda Financial Review First
Quarterly Statement for Q Metzingen, November 2, HUGO BOSS increases pace of growth in own retail
 Quarterly Statement for Q3 2017 Metzingen, November 2, 2017 HUGO BOSS increases pace of growth in own retail Currency-adjusted sales up 3% in the third quarter Retail comp store sales up 5% EBITDA before
Interim Results. IGG Inc August 2017
 Interim Results IGG Inc August 2017 Disclaimer This presentation and the accompanying slides (the Presentation ) do not constitute any offer or invitation to purchase or subscribe for any securities, and
Investor Meeting Presentation
 Investor Meeting Presentation November 2014 Investor Meeting Presentation HUGO BOSS November 2014 2 / 54 Agenda Update on Key Strategic Initiatives Nine Months Results 2014 Outlook Investor Meeting Presentation
IGG Inc. March Annual Results
 IGG Inc. March 2017 Annual Results Disclaimer This presentation and the accompanying slides (the Presentation ) which have been prepared by IGG INC (the Group ) do not constitute any offer or invitation
FOSSIL GROUP, INC. REPORTS FIRST QUARTER FISCAL 2015 RESULTS; First Quarter Net Sales of $725 Million; Diluted EPS of $0.75
 FOSSIL GROUP, INC. REPORTS FIRST QUARTER FISCAL 2015 RESULTS; First Quarter Net Sales of $725 Million; Diluted EPS of $0.75 Maintains Full Year Constant Currency Guidance and Provides Second Quarter Guidance
KION Q3 UPDATE CALL Gordon Riske, CEO Thomas Toepfer, CFO Wiesbaden, 14 November 2013
 KION Q3 UPDATE CALL 2013 Gordon Riske, CEO Thomas Toepfer, CFO Wiesbaden, 14 November 2013 AGENDA 1 Highlights 2013 Gordon Riske 2 Financial Update Thomas Toepfer 3 Outlook Gordon Riske 14 November 2013
HUGO BOSS confirms full-year sales and earnings forecast substantial progress made in implementing strategic realignment
 Quarterly Statement for Q2 2017 Metzingen, August 2, 2017 HUGO BOSS confirms full-year sales and earnings forecast substantial progress made in implementing strategic realignment Currency-adjusted sales
INTERIM RESULTS PRESENTATION. August 2017, Hong Kong
 2017 INTERIM RESULTS PRESENTATION August 2017, Hong Kong Disclaimer THIS DOCUMENT DOES NOT CONSTITUTE AN OFFER OR INVITATION TO PURCHASE OR SUBSCRIBE FOR ANY SECURITIES AND NO PART OF IT SHALL FORM THE
Quarterly Statement for Q Metzingen, May 3, HUGO BOSS starts the year with higher sales and earnings
 Quarterly Statement for 2017 Metzingen, May 3, 2017 HUGO BOSS starts the year with higher sales and earnings Currency-adjusted sales growth of 1% in the first quarter Positive development in Europe and
Press Release HUGO BOSS First Half Year Results HUGO BOSS accelerates growth in second quarter of 2015
 Press Release HUGO BOSS First Half Year Results HUGO BOSS accelerates growth in second quarter of Sales rise by 16% in reporting currency and 7% currency-adjusted 6% increase in retail comp store sales
Assurant and The Warranty Group: Creating a Leading Global Lifestyle Provider
 Assurant and The Warranty Group: Creating a Leading Global Lifestyle Provider 1 Safe Harbor Statement Some of the statements included in this presentation, particularly those with respect to the proposed
TELECONFERENCE Q FINANCIAL RESULTS
 TELECONFERENCE Q3 2013 FINANCIAL RESULTS 10:00 CET, 12 November 2013 1 AUGUST 2013 INVESTOR PRESENTATION AGENDA AGENDA Business highlights: Key developments in Q3 2013 Market development and sales-out
2018 FOURTH QUARTER EARNINGS CALL
 NORTH AMERICA S LEADING BUILDING MATERIALS DISTRIBUTOR RESIDENTIAL COMMERCIAL INTERIOR SOLAR 2018 FOURTH QUARTER EARNINGS CALL Forward Looking Statements / Non-GAAP Measures This presentation contains
2280 North Greenville Avenue, Richardson, TX 75082
 2280 North Greenville Avenue, Richardson, TX 75082 Contact: Investor Relations: Mike Kovar Chief Financial Officer Fossil, Inc. (972) 699-6811 Allison Malkin Integrated Corporate Relations (203) 682-8200
CONTINUING CONNECTED TRANSACTIONS IN RELATION TO THE TAINWALA LEAVE AND LICENSE AGREEMENT
 Hong Kong Exchanges and Clearing Limited and The Stock Exchange of Hong Kong Limited take no responsibility for the contents of this announcement, make no representation as to its accuracy or completeness
TELECONFERENCE Q FINANCIAL RESULTS
 TELECONFERENCE FINANCIAL RESULTS 10:00 CET, 13 May 2014 1 AGENDA AGENDA Business highlights: Key developments in Market development and sales-out Performance of newly launched products Guidance 2014 Financial
901 S. Central Expressway, Richardson, TX 75080
 901 S. Central Expressway, Richardson, TX 75080 Contact: Investor Relations: Mike Kovar Chief Financial Officer Fossil, Inc. (972) 699-6811 Allison Malkin ICR, Inc. (203) 682-8225 FOSSIL, INC. REPORTS
2280 North Greenville Avenue, Richardson, TX 75082
 2280 North Greenville Avenue, Richardson, TX 75082 Contact: Investor Relations: Mike Kovar Chief Financial Officer Fossil, Inc. (972) 699-6811 Allison Malkin Integrated Corporate Relations (203) 682-8200
Quarterly Statement for Q Metzingen, November 6, 2018
 Quarterly Statement for Q3 2018 Metzingen, November 6, 2018 HUGO BOSS records solid sales growth in the third quarter Full-year sales and earnings guidance confirmed Currency-adjusted sales up 1% in the
SAMSONITE TO ACQUIRE TUMI FOR US$26.75 PER SHARE TO CREATE A LEADING GLOBAL TRAVEL LIFESTYLE COMPANY
 (Incorporated in Luxembourg with limited liability) (Stock code: 1910) SAMSONITE TO ACQUIRE TUMI FOR US$26.75 PER SHARE TO CREATE A LEADING GLOBAL TRAVEL LIFESTYLE COMPANY Iconic Business and Travel Brand
BAML Conference - Miami
 BAML Conference - Miami Francois Luscan, President & CEO Xavier Leclerc de Hauteclocque, CFO December 3, 2013 Forward Looking Statement This presentation may include forward-looking statements. Forward-looking
Investor Presentation. Domino s Pizza
 Investor Presentation Domino s Pizza July 2005 Forward-Looking Statements This presentation and our accompanying comments may contain forward-looking statements. These statements relate to future events
SAMSONITE INTERNATIONAL S.A. 新秀麗國際有限公司
 Hong Kong Exchanges and Clearing Limited and The Stock Exchange of Hong Kong Limited take no responsibility for the contents of this announcement, make no representation as to its accuracy or completeness
McCormick & Company, Inc. 4th Quarter 2018 Financial Results and 2019 Outlook
 McCormick & Company, Inc. 4th Quarter 2018 Financial Results and 2019 Outlook January 24 th 2019 The following slides accompany a January 24 th 2019, earnings release conference call. This information
Fourth Quarter & Full Year 2016 Earnings Results
 POLARIS INDUSTRIES INC. Fourth Quarter & Full Year 2016 Earnings Results January 24, 2017 Richard Edwards Director of Investor Relations POLARIS INDUSTRIES INC. Fourth Quarter & Full Year 2016 Earnings
Q Results. Lars Brorsen (CEO) Christoph Hobo (CFO) November 22, 2018
 Christoph Hobo (CFO) November 22, 2018") Q3 2018 Results Lars Brorsen (CEO) Christoph Hobo (CFO) November 22, 2018 Agenda 1. Highlights Q3 2018 2. Market outlook 3. Detailed results review 4. Company outlook 5. Q&A Appendix 1 Business summary
Q3 2018 Results Lars Brorsen (CEO) Christoph Hobo (CFO) November 22, 2018 Agenda 1. Highlights Q3 2018 2. Market outlook 3. Detailed results review 4. Company outlook 5. Q&A Appendix 1 Business summary
2nd quarter 2017 results
 2nd quarter 2017 results Europe gaining further momentum Jacques van den Broek, CEO Robert Jan van de Kraats, CFO Randstad Holding nv disclaimer & definitions Certain statements in this document concern
ANNUAL RESULTS ANNOUNCEMENT FOR THE YEAR ENDED 31 MARCH 2012
 Hong Kong Exchanges and Clearing Limited and The Stock Exchange of Hong Kong Limited take no responsibility for the contents of this announcement, make no representation as to its accuracy or completeness
FY 2017 Results Update Analyst Presentation
 FY 2017 Results Update Analyst Presentation March 8, 2018-6.00 PM CET Disclaimer This presentation contains forward-looking statements regarding future events and results of the Company that are based
TELECONFERENCE FY 2014 FINANCIAL RESULTS
 TELECONFERENCE FY 2014 FINANCIAL RESULTS 10:00 CET, 17 February 2015 1 DISCLAIMER Certain statements in this presentation constitute forward-looking statements. Forward-looking statements are statements
Interim results FOR THE six months ENDED 30 September 2011
 Interim results FOR THE six months ENDED 30 September 2011 1 2 1 FINANCIAL REVIEW Creative culture AND innovation SUSTAINING COMPETITIVE ADVANTAGE QUESTIONS 3 First half achievements RECORD FIRST HALF
During the year, the Company achieved a number of milestones in executing its growth strategy:
 Party City Announces Fourth Quarter and Full Year 2015 Results Revenue increase of 4% 1 on a constant currency basis to a record $2.29 billion for fiscal year 2015 Adjusted Net Income increase of 32% in
Presentation 22 August 2018
 Presentation 22 August 2018 Exceeded 3YP targets in 2017, but 2018 is challenging due to continued destocking, store closures and bankruptcies Profit attributable to shareholders (like-for-like) down 19%
ROADSHOW Hong Kong // Credit Suisse
 ROADSHOW Hong Kong // Credit Suisse HUGO BOSS Company Handout Hong Kong, July 3, 2015 HUGO BOSS July 3, 2015 2 Agenda Financial Review First Quarter 2015 Strategic Outlook 2015 and beyond Financial Outlook
Agenda. Company Overview Annual Financial Results. Business Review and Prospects
 Disclaimer This presentation and the accompanying slides (the Presentation ) which have been prepared by IGG INC (the Company ) do not constitute any offer or invitation to purchase or subscribe for any
Wedbush Morgan California Dreamin Santa Monica, CA December 9, 2008
 Wedbush Morgan California Dreamin 2008 Santa Monica, CA December 9, 2008 GUESS?, Inc. Carlos Alberini President & Chief Operating Officer 2 Safe Harbor Statement Except for historical information contained
ZEBRA TECHNOLOGIES FIRST QUARTER 2016 RESULTS May 10, 2016
 ZEBRA TECHNOLOGIES FIRST QUARTER 2016 RESULTS May 10, 2016 Anders Gustafsson Chief Executive Officer Mike Smiley Chief Financial Officer 2 Safe Harbor Statement Statements made in this presentation which
TELECONFERENCE Q FINANCIAL RESULTS
 TELECONFERENCE FINANCIAL RESULTS 10:00 CET, 12 August 2014 1 AGENDA AGENDA Business highlights: Key developments in Market development and sales-out Performance of newly launched products Guidance 2014
Q Quarterly Report
 Q1 2015 Quarterly Report Casper, WY Management s Discussion and Analysis of Financial Condition and Results of Operations of Ritchie Bros. Auctioneers Incorporated for the quarter ended March 31, 2015
Financial Information
 Financial Information H1 revenues reached 12.8bn up 9.8%, flat org. in Q2 Adj. EBITA reached 1.6bn, up 6.4%, Adj. EBITA margin flat excl. Invensys in a challenging environment 2015 targets: Around flat
TELECONFERENCE Q FINANCIAL RESULTS
 TELECONFERENCE FINANCIAL RESULTS 10:00 CET, 11 November 2014 1 12 AUGUST 2014 AGENDA AGENDA Business highlights: Key developments in Market development and sales-out Performance of newly launched products
Quarterly Statement for Q Metzingen, May 2, gets off to a successful start for HUGO BOSS
 Quarterly Statement for 2018 Metzingen, May 2, 2018 2018 gets off to a successful start for HUGO BOSS Currency-adjusted Group sales up 5% in the first quarter Retail comp store sales up 7% Online business
Global leader in luxury and premium eyewear
 Global leader in luxury and premium eyewear 2 Overview of results for 1Q06 Financial highlights for 1Q06 Looking ahead Appendix and other information 3 Overview of Results for 1Q06 An outstanding quarter
2010 Results. Paris - March 2, 2011
 2010 Results Paris - March 2, 2011 > Highlights of 2010 > Financial results > Strategy and outlook 2010 Results 2 2010: A Year of Acceleration Highlights of 2010 Revenue of 3,892m, up 19.1% Operating profit
Important Notice. The sum totals throughout this presentation may not add exactly due to rounding differences.
 Important Notice This presentation contains general information about Reliance Worldwide Corporation Limited s activities at the date of presentation (26 February 2018). It is information given in summary
Q EARNINGS CALL
 Tom Goeke Chief Executive Officer Q2 2017 EARNINGS CALL JULY 27, 2017 IMPORTANT INFORMATION Forward Looking Statements These slides contain (and the accompanying oral discussion will contain) forward looking
MONCLER S.P.A.: THE BOARD OF DIRECTORS APPROVES THE HALF-YEAR FINANCIAL REPORT AS OF 30 JUNE
 _ MONCLER S.P.A.: THE BOARD OF DIRECTORS APPROVES THE HALF-YEAR FINANCIAL REPORT AS OF 30 JUNE 2018 1 STRONG DOUBLE-DIGIT REVENUE GROWTH CONTINUED (+27% AT CONST. EXCH. RATES) WITH THE STRENGTHENING OF
MAISONS DU MONDE: FIRST-HALF 2018 RESULTS
 PRESS RELEASE MAISONS DU MONDE: FIRST-HALF 2018 RESULTS A solid first half in a challenging environment Updated full-year 2018 targets Sales up 11% to 507m including Modani, and up 9.8% at constant scope
TELECONFERENCE Q FINANCIAL RESULTS. 10:00 CET, 11 August 2015
 TELECONFERENCE FINANCIAL RESULTS 10:00 CET, 11 August 2015 1 AGENDA AGENDA Business highlights: Key developments in Market development and sales-out Performance of newly launched products Guidance 2015
1Q 2013 INVESTOR PRESENTATION
 1Q 2013 INVESTOR PRESENTATION APRIL 2013 FORWARD-LOOKING STATEMENTS The following discussion contains forward-looking statements, including those about Nielsen s outlook and prospects, in the meaning of
Roadshow Zurich // MainFirst. HUGO BOSS Company Handout August 6, Roadshow Zurich // MainFirst HUGO BOSS August 7, / 52
 Roadshow Zurich // MainFirst HUGO BOSS Company Handout August 6, 2014 Roadshow Zurich // MainFirst HUGO BOSS August 7, 2014 2 / 52 Agenda Half Year Results 2014 Update on Key Strategic Initiatives Outlook
H Interim Results. 18 May 2017
 H1 2017 Interim Results 18 May 2017 Agenda Highlights - Peter Fankhauser CEO Financial results Strategic progress Current trading and outlook Page 2 Strategic actions leading to improved performance Growing
Horizon Global First Quarter 2016 Earnings Presentation
 Horizon Global First Quarter 2016 Earnings Presentation May 3, 2016 1 Safe Harbor Statement Forward-Looking Statements This presentation may contain "forward-looking statements" as defined in the Private
TELECONFERENCE Q FINANCIAL RESULTS 10:00 CET, 10 MAY 2016
 TELECONFERENCE 2016 FINANCIAL RESULTS 10:00 CET, 10 MAY 2016 AGENDA FINANCIAL HIGHLIGHTS 2016 FINANCIAL EXPECTATIONS 2016 FINANCIAL REVIEW 2016 SUMMARY 2 DISCLAIMER Certain statements in this presentation
Roadshow Scandinavia // equinet
 Roadshow Scandinavia // equinet HUGO BOSS Company Handout August 12-14, 2014 Dennis Weber, Head of Investor Relations Roadshow Scandinavia // equinet HUGO BOSS August 12-14, 2014 2 / 52 Agenda Half Year
Q Trading Update. May 4, 2016
 Q1 2016 Trading Update May 4, 2016 Forward looking statements This Presentation may include forward-looking statements. Forward-looking statements are statements regarding or based upon our management
PTC PREPARED REMARKS SECOND QUARTER FISCAL 2018 APRIL 18, 2018
 PTC PREPARED REMARKS SECOND QUARTER FISCAL 2018 APRIL 18, 2018 Please refer to the Important Disclosures section of these prepared remarks for important information about our operating metrics (including
Roadshow London // Deutsche Bank
 Roadshow London // Deutsche Bank HUGO BOSS Company Handout August 6, 2014 Mark Langer (CFO) & Dennis Weber (Head of Investor Relations) Roadshow London // Deutsche Bank HUGO BOSS August 6, 2014 2 / 52
HUGO BOSS First Half Year Results 2014
 HUGO BOSS First Half Year Results 2014 Claus-Dietrich Lahrs (CEO), Mark Langer (CFO) Metzingen, July 31, 2014 Conference Call, First Half Year Results 2014 HUGO BOSS July 31, 2014 2 / 42 Agenda Half Year
1H FY19 RESULTS PRESENTATION 25 February 2019
 RELIANCE WORLDWIDE CORPORATION LIMITED ACN 610855877 1H FY19 RESULTS PRESENTATION 25 February 2019 INVESTOR PRESENTATION 1H FY19 RESULTS PAGE 0 Important Notice This presentation contains general information
Annual Results. IGG Inc March 2018
 Annual Results IGG Inc March 2018 Disclaimer This presentation and the accompanying slides (the Presentation ) do not constitute any offer or invitation to purchase or subscribe for any securities, and