FOCUSED ON PROFITABLE, CONSISTENT GROWTH
|
|
|
- Lee Robertson
- 5 years ago
- Views:
Transcription


1 FOCUSED ON PROFITABLE, CONSISTENT GROWTH Investor Presentation August 2013
2 FORWARD-LOOKING STATEMENTS Certain information contained in this presentation may constitute forward-looking statements, such as information relating to expected performance. These forward-looking statements are subject to a number of factors and uncertainties that could cause actual results and experiences to differ materially from the anticipated results and expectations expressed in such forward-looking statements. We caution readers not to place undue reliance on any forward-looking statements, which speak only as of the date made. Among the factors that may cause actual results and experiences to differ from anticipated results and expectations expressed in such forward-looking statements are the following: (i) the effect of, or changes in, general economic conditions; (ii) fluctuations in the cost and availability of inputs and raw materials, such as live cattle, live swine, feed grains (including corn and soybean meal) and energy; (iii) market conditions for finished products, including competition from other global and domestic food processors, supply and pricing of competing products and alternative proteins and demand for alternative proteins; (iv) successful rationalization of existing facilities and operating efficiencies of the facilities; (v) risks associated with our commodity purchasing activities; (vi) access to foreign markets together with foreign economic conditions, including currency fluctuations, import/export restrictions and foreign politics; (vii) outbreak of a livestock disease (such as avian influenza or bovine spongiform encephalopathy), which could have an adverse effect on livestock we own, the availability of livestock we purchase, consumer perception of certain protein products or our ability to access certain domestic and foreign markets; (viii) changes in availability and relative costs of labor and contract growers and our ability to maintain good relationships with employees, labor unions, contract growers and independent producers providing us livestock; (ix) issues related to food safety, including costs resulting from product recalls, regulatory compliance and any related claims or litigation; (x) changes in consumer preference and diets and our ability to identify and react to consumer trends; (xi) significant marketing plan changes by large customers or loss of one or more large customers; (xii) adverse results from litigation; (xiii) risks associated with leverage, including cost increases due to rising interest rates or changes in debt ratings or outlook; (xiv) compliance with and changes to regulations and laws (both domestic and foreign), including changes in accounting standards, tax laws, environmental laws, agricultural laws and occupational, health and safety laws; (xv) our ability to make effective acquisitions or joint ventures and successfully integrate newly acquired businesses into existing operations; (xvi) effectiveness of advertising and marketing programs; and (xvii) those factors listed under Item 1A. Risk Factors included in our September 29, 2012, Annual Report filed on Form 10-K. 2
3 EXECUTIVE SUMMARY Tyson Foods has made a turnaround since 2009 Producing more consistent, stable earnings Growth strategy implemented in 2012 Aggressively growing international in-country production Growing domestic prepared foods and value-added products Measurable growth Annual 3-4% revenue growth At least 10% EPS growth over time 3
4 TODAY S DISCUSSION Tyson Today The Global Marketplace Strategic Growth Financial Results and Outlook Appendix 4
5 TYSON TODAY

6 OUR PRINCIPLES 6
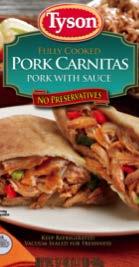
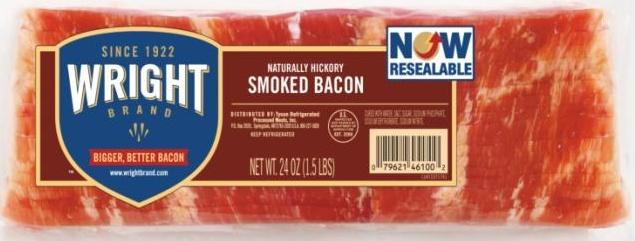
7 THERE IS VALUE IN DIVERSITY Multi-Protein Chicken, Beef, Pork Multi-Channel Retail, Food Service, Exports Multi-National Brazil, China, India, Mexico, United States Broad Product Portfolio Value-added Chicken Value-added Beef & Pork Pepperoni Beef & Pork Pizza Toppings Pizza Crusts Tortillas Bacon Deli Meats Hams Franks Ethnic Foods Soups Snacks Sauces Appetizers Side Items Prepared Meals Meal Kits Fully-cooked Dinner Meats Commodity Chicken Commodity Beef & Pork Tyson s diversity provides a natural hedge against economic cycles and a foundation for growth. 7
8 OUR APPROACH TO BUSINESS The Chicken segment is vertically integrated; we manage the production process from beginning to end. The Beef and Pork segments are not vertically integrated; we do not carry feed cost risk. Livestock are purchased from various producers. The Prepared Foods segment comprises a variety of models; raw materials for these foods come from internal and external sources. Value-added beef and pork items such as pepperoni and bacon are in the Prepared Foods segment. Value-added chicken items such as nuggets are in the Chicken segment. 8
 Tyson produces approximately 1 out of every 5 pounds of chicken, beef and pork in the United")
9 MARKET LEADERSHIP Source: Watt Poultry USA, March 2013 Based on ready-to-cook pounds Source: Cattle Buyers Weekly % of Daily Steer/Heifer Slaughter Capacity (head), 2012 Source: National Pork Board Spring 2009 (most recent available) Tyson produces approximately 1 out of every 5 pounds of chicken, beef and pork in the United States. 9

10 VALUABLE PRODUCT PORTFOLIO Tyson offers product innovation, consumer insights and a broad portfolio of foods and brands that provide solutions for our customers while giving us pricing power beyond commodity protein. 10
11 THREE-YEAR PERFORMANCE: AT A GLANCE Tyson Foods has achieved an improved level of performance while navigating global economic challenges, unfavorable market dynamics and often staggering input cost increases. From FY2010 to FY2012 Tyson: Delivered record sales each year Generated $3.7 billion in operating cash flows Invested nearly $2 billion in CapEx to fuel continued improvement and growth Paid down $1.1 billion in debt and reduced interest expense Improved net debt to cap to 18.4% (Gross debt to cap = 28.7%) Improved liquidity to more than $2 billion at the end of fiscal 2012 Achieved $715 million in operating efficiencies in the chicken segment (more than $1 billion in total since 2008) Averaged nearly $2 adjusted earnings per share* * See Appendix for non-gaap reconciliations Established investment grade rating profile with Moody s, S&P and Fitch The turnaround is over. It s time to turn it on. Donnie Smith, Tyson Foods President & CEO 11


12 POSITIONED FOR SUCCESS 115,000 Team Members worldwide Second largest food production company in the Fortune 500 Where we are in the U.S. Worldwide locations: 56 Chicken plants 12 Beef plants* 9 Pork plants* 25 Prepared Foods plants Beef and pork plants are near cattle and hog supplies, which lowers transportation costs and improves availability of livestock for processing Chicken plants are located in regions with a climate suitable for poultry production and access to feed grains Chicken Beef Pork Prepared Foods Case-Ready Beef & Pork Animal Nutrition * Includes three case-ready beef and pork plants 12

13 FarmCheck Responsible Sourcing Our Commitment Do the right thing when it comes to animal well-being Be good stewards of the animals Be our customers go-to supplier for quality meats Anticipate and embrace change based on sound science and best practices Be for something rather than against something 13


14 MAKING GREAT FOOD. MAKING A DIFFERENCE Active in the fight against hunger since Donated more than 90 million pounds 360 million meals of much needed protein to food banks. Partners with Share Our Strength, Lift Up America, Feeding America, National Urban League and the League of United Latin American Citizens to raise awareness and help feed the hungry across the nation. Meals That Matter disaster relief program begun in 2012 to support our long-standing tradition of feeding people during times of disaster. 14
15 THE GLOBAL MARKETPLACE
16 OUR CHALLENGE: FEEDING THE WORLD WORLD POPULATION GROWTH 7B B 2050 POPULATION GROWING 75M YEAR (UNITED NATIONS) ADDING A CITY THE SIZE OF PHILADELPHIA WEEKLY IT S ESTIMATED THAT IN 40 YEARS THE WORLD WILL NEED 100% MORE FOOD THAN WE PRODUCE TODAY (CENTER FOR FOOD INTEGRITY) 16
17 MARKET OPPORTUNITIES The world s population is growing; protein consumption is growing with it. Globally, as people enter the middle class, they add protein to their diets. To feed the global demand for protein, the U.S. is exporting more of its protein production. U.S. protein production is flat to declining; less protein available to U.S. consumers resulting in higher domestic pricing. Global protein consumption is projected to grow more than 500% from 1960 to Global Protein Consumption Source: USDA FAS and OECD. Includes Beef/Veal, Pork, Broilers, and Turkey 350, , ,000 Metric Tons in Millions 200, , ,000 50,
18 PROTEIN SUPPLY AND PRICE Pounds Combined Per Capita Domestic Meat Availability (Beef, Pork, Chicken, Turkey; Carcass Weight Equivalent) Cents per Pound Per Capita Domestic Protein Availability (1) Annual Composite Average Price (2) Reduced domestic production and increased exports have resulted in less protein on the market for U.S. consumers. Lower supplies have led to higher prices. Source: USDA actual historical data; 2013 and 2014 forecast by Robert A. Brown, Inc.; (1) represents beef, pork, chicken and turkey carcass weight equivalent; (2) annual composite average price is a simple average of monthly USDA wholesale price for beef, pork and poultry; 2013 data as of 7/16/
 U.S. Exports as a % of Production (Right Scale) 25,000 Pork 100.")
19 PROTEIN PRODUCTION AND EXPORTS Chicken Beef 40, % 30, % 35,000 30,000 25, % 80.00% 70.00% 60.00% 25,000 20, % 80.00% 70.00% 60.00% 20, % 15, % 15,000 10,000 5, % 30.00% 20.00% 10.00% 10,000 5, % 30.00% 20.00% 10.00% % % U.S. Production in Million Pounds (Left Scale) U.S. Exports as a % of Production (Right Scale) 25,000 Pork % While production of the three major proteins has been relatively flat in the past four years, exports have grown, leading to reduced domestic protein supplies. 20,000 15,000 10,000 5, % 80.00% 70.00% 60.00% 50.00% 40.00% 30.00% 20.00% 10.00% % Source: USDA and Robert A. Brown, Inc., May is RAB forecast 19

20 CORN FUTURES AND CHICKEN LIVE COSTS While grain prices have increased in recent years, Tyson s product innovation, quality and service to customers has helped overcome higher feed costs. Sources: corn futures, DTN Prophet X; live cost, Tyson Foods 20


21 BEEF: HISTORICALLY THE SPREAD MATTERS Dollars per Head There is a strong correlation between revenue and the cost of cattle. Tyson historically has outperformed industry indexes in the spread between revenue per head and cattle costs. 21
22 PORK: HISTORICALLY THE SPREAD MATTERS $240 $220 $200 USDA TOTAL REVENUE Dollars per Head $180 $160 USDA HOG COST $140 There is a strong correlation between revenue and the cost of hogs. Tyson historically has outperformed industry indexes in the spread between revenue per head and hog costs. 22
23 STRATEGIC GROWTH
24 GROWTH STRATEGY Accelerate Grow domestic value-added chicken sales Grow prepared foods sales Grow international chicken production Innovate Products and services Consumer insights Cultivate Talent development to support Tyson s growth and long-term future Growth will be fueled by adding value, increasing international production, innovation and Team Members. 24

25 IT S ALL ABOUT TAKING ACTION Achieve Grow sales, earnings and shareholder value: Grow international in-country production Develop innovative, value-added products Make strategic acquisitions Prepared foods, ethnic foods, value-added chicken Small regional players International Get paid for the value we provide Repurchase shares Keep operations efficient and costs under control Focus matters. 25


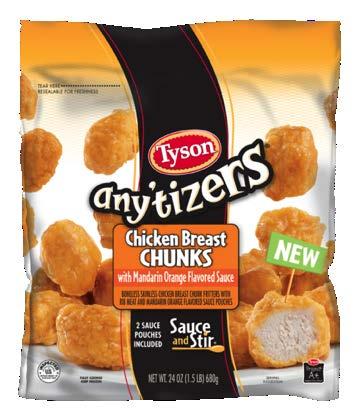
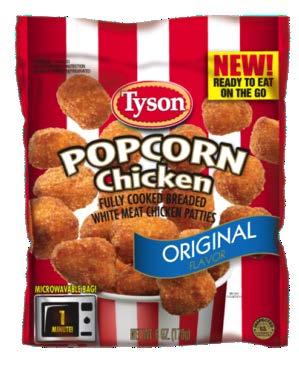

26 INNOVATION DRIVES NEW PRODUCTS AND GROWTH Product innovation is at the core of our ability to retain and grow our customer base. 26


 Raised")

27 DOING WHAT S RIGHT, RIGHT FROM THE START No antibiotics ever 100% vegetarian fed (no animal protein or bakery by-products) Independent 3 rd party animal welfare certification 100% all natural* No added hormones or steroids** USDA Process Verified Program (Fresh Products) Raised Cage Free * No artificial ingredients, minimally processed ** Federal regulations prohibit the use of hormones or steroids in chicken 27

28 INSIGHTS FUEL THE INNOVATION PROCESS Economic trends Demographic trends Flavor trends Category attitude and usage studies Consumer insights Product testing Macro trends Consumer panel data Consumer segment insights In-store/shopping studies Concept testing NEW! Products Flavors Targets Packages Usage Occasions Our proven approach to innovation helps us deliver food solutions to customers and consumers. 28
29 FINANCIAL RESULTS AND OUTLOOK
30 INVESTMENT THESIS Strong balance sheet provides attractive options for growth: Reinvestment in Tyson through CapEx Strategic acquisitions in prepared foods and value-added chicken Return capital to shareholders through repurchase program and dividends Aggressively increase international in-country production where demand for protein is growing Measurable growth: Annual 3-4% revenue growth At least 10% EPS growth over time Become the leading solution-providing food company not only a commodity protein company: Lean-thinking culture focused on operational excellence and continuous improvement Superior quality, service and innovation to be the customer s go-to supplier Alternative channels such as convenience stores, dollar stores and drug store chains Tyson strives to be the investment of choice. 30
31 BALANCE SHEET STRENGTH Reduced net debt by $2.6 billion from FY02 through FY12 Decreased net debt to cap from 51.8% to 18.4% FY02 through FY12 Invested $690 million in FY12 CapEx Achieved $1.2 billion in operating cash flow in FY12, third consecutive year above $1 billion Liquidity at the end of FY12 was $2 billion, well above our targeted range of $1.2 billion to $1.5 billion Invested $230 million in FY12 to repurchase 12.5 million shares Paid a $0.10 special dividend in December 2012 Increased the regular quarterly dividend by 25% A strong capital structure creates opportunities. 31
32 FY12 SALES $33.3 BILLION Tyson s multi-protein approach is supported by multi-channel distribution. 32
33 ADJUSTED EARNINGS PER SHARE* $2.50 $2.00 $2.19 $1.89 $1.91 $1.50 $1.00 $0.50 $0.00 -$ E Fiscal Year From 2010 through Q3 of 2013, Tyson has produced more consistent, stable earnings while absorbing approximately $1.5 billion in additional feed costs in our Chicken segment. * See Appendix for non-gaap reconciliations. Does not include impact from a discontinued operation reported in Q
34 ADJUSTED OPERATING INCOME* $1,800 $1,600 $1,400 $1,200 $1,547 $1,285 $1,263 in millions $1,000 $800 $600 $400 $200 $ Fiscal Year Tyson averaged nearly $1.4 billion annually in adjusted operating income in 2010, 2011 and * See Appendix for non-gaap reconciliations. Does not include impact from a discontinued operation reported in Q

35 GROWTH EXPECTATIONS Sales Adjusted EPS* FY 2010 $28.4 Billion $2.19 FY 2011 $32.3 Billion $1.89 FY 2012 $33.3 Billion $1.91 FY 2013 Expectation ~ $34.5 Billion > 2012 FY 2014 Expectation ~ $36 Billion > 10% FY 2015 Expectation ~ +3-4% > 10% Expect top-line sales to grow about 3-4% annually Sales from value-added products should grow 6-8% annually Sales from international production should grow 12-16% annually Anticipate an incremental $500 million in feed ingredient costs in FY13, with adjusted earnings expected to be better than FY12 adjusted EPS EPS should grow at least 10% annually over time What got us here won t get us there. Donnie Smith, Tyson Foods President & CEO * See Appendix for non-gaap reconciliations 35


36 INTERNATIONAL GROWTH BY % to 3MM bpw Maintain 2.7MM bpw 61% to 450K bpw 54% to 2MM bpw bpw = birds per week Tyson s plans for international growth are focused on poultry production and further processing in Brazil, China and India, in addition to our long-standing poultry business in Mexico. 36
37 PRIORITIES FOR USES OF CASH Capital expenditures to grow existing businesses: Capital maintenance level approximates $250 million a year FY13 CapEx on pace for $550-$600 million Preliminary plan for FY14 CapEx is $ million Acquisitions advance growth strategies around value-added products and international production: Profit improvement CapEx target greater than 20% Modified Internal Rate of Return Acquisitions and joint ventures target greater than 20% Return on Invested Capital Return cash to shareholders: Share repurchases Purchased more than 34 million shares for $650 million (as of June 29, 2013) Dividends 37
38 OPERATIONAL IMPROVEMENTS Be the best-in-class operator in beef, pork and chicken Consistently outperform beef and pork industry indexes Achieved more than $1 billion in operational efficiencies in our chicken segment since 2008; anticipating another $100 million chicken and prepared foods efficiencies in FY13 38
39 WHY TYSON? Tyson Foods is growing into a solution-providing food company: Being a commodity protein company is not our goal or our destiny Pursuing value-added product development Delivering quality, service and innovation enables us to be the customers go-to supplier Growth into alternate channels such as convenience stores, dollar stores and drug store chains offer opportunities Strong balance sheet gives Tyson options to grow Aggressively growing international in-country production Pursuing prepared foods and value-added chicken acquisitions Establishing a culture of lean thinking, operational excellence and continuous improvement Expectations of annual 3-4% revenue growth and 10% EPS growth over time Share repurchases and increased dividends 39
40 Blank
41 APPENDIX Tyson Foods, Inc. 41
42 NON-GAAP RECONCILIATIONS Adjusted operating income and adjusted net income per share attributable to Tyson (adjusted EPS) are presented as supplementary financial measurements in the evaluation of our business. We believe the presentations of adjusted operating income and adjusted EPS help investors assess our financial performance from period to period and enhance understanding of our financial performance. However, adjusted operating income and adjusted EPS may not be comparable to those of other companies in our industry, which limits the usefulness as comparative measures. Adjusted operating income and adjusted EPS are not measures required by or calculated in accordance with GAAP and should not be considered as substitutes for any measures of financial performance reported in accordance with GAAP. Investors should rely primarily on our GAAP results, and use non-gaap financial measures only supplementally, in making investment decisions. (in millions, expect per share data) 12 Months Ended September 29, 2012 October 1, 2011 October 2, 2010 October 3, 2009 Operating Operating Operating Operating Income EPS Income EPS Income EPS Income EPS Reported $ 1,248 $ 1.58 $ 1,285 $ 1.97 $ 1,556 $ 2.06 $ (215) $ (1.47) Less: Gain from insurance proceeds (38 ) (0.06 ) Gain on sale of interests in an equity method investment (0.03) Reversal of reserves for foreign uncertain tax positions (0.05) Add: Charges related to plant closing Impairment of goodwill Impairment of equity method investment 0.03 Impairment of non-core assets in China Loss related to early extinguishment of debt 0.29 Losses related to note repurchases 0.09 Adjusted $ 1,263 $ 1.91 $ 1,285 $ 1.89 $ 1,547 $ 2.19 $ 360 $
43 NON-GAAP RECONCILIATIONS CONTINUED (in millions, expect per share data) 12 Months Ended September 27, 2008 September 29, 2007 September 30, 2006 October 1, 2005 October 2, 2004 Operating Income EPS Operating Income EPS Operating Income EPS Operating Income EPS Operating Income EPS Reported $ 331 $ 0.24 $ 613 $ 0.75 $ (50) $ (0.58 ) $ 655 $ 1.04 $ 733 $ 1.13 Less: Gain on sale of an investment (0.03 ) Gain on sales of assets (19 ) (0.03 ) Gain on sale of remaining interest in Specialty Brands, Inc. (0.01) Income related to vitamin antitrust litigation (12) (0.02) Tax adjustments (0.04) Add: Charges related to BSE Charges related to flood damage Charges related to plant closings Cumulative effect of change in accounting principles 0.02 Impairment of assets Impairment of intangible assets Live swine legal settlement Loss related to Hurricane Katrina Severance and restructuring charges Tax adjustments 0.04 Write off of obsolete inventory Adjusted $ 407 $ 0.34 $ 606 $ 0.74 $ 32 $ (0.37) $ 698 $ 1.06 $ 880 $
GOLDMAN SACHS 17 TH ANNUAL AGRIBUSINESS CONFERENCE. February 26, 2013
 GOLDMAN SACHS 17 TH ANNUAL AGRIBUSINESS CONFERENCE February 26, 2013 DENNIS LEATHERBY, CFO FORWARD-LOOKING STATEMENTS Certain information contained in this presentation may constitute forward-looking statements,
Focused on Profitable, Consistent Growth
 Focused on Profitable, Consistent Growth Investor Presentation May 2014 FORWARD-LOOKING STATEMENTS Certain information contained in this presentation may constitute forward-looking statements, such as
Goldman Sachs. 18 th Annual Agribusiness Conference. March 12, 2014
 Goldman Sachs 18 th Annual Agribusiness Conference March 12, 2014 FORWARD-LOOKING STATEMENTS Certain information contained in this presentation may constitute forward-looking statements, such as information
TYSON REPORTS FOURTH QUARTER AND FISCAL YEAR 2011 RESULTS
 Media Contact: Gary Mickelson, 479-290-6111 Investor Contact: Jon Kathol, 479-290-4235 TYSON REPORTS FOURTH QUARTER AND FISCAL YEAR RESULTS 4th quarter EPS was $0.26, as compared to $0.57 last year Record
1 of 7 5/5/14 6:46 AM
 TYSON POSTS RECORD SECOND QUARTER; SALES EXCEED $9.0 BILLION AS EARNINGS INCREASE 58% TO $0.60 05/05/14 SPRINGDALE, Ark., May 5, 2014 (GLOBE NEWSWIRE) -- Tyson Foods, Inc. (NYSE:TSN), today reported the
TYSON CONTINUES GROWTH WITH RECORD THIRD QUARTER EARNINGS; PROJECTS AT LEAST 10% EPS GROWTH IN 2015
 TYSON CONTINUES GROWTH WITH RECORD THIRD QUARTER EARNINGS; PROJECTS AT LEAST 10% EPS GROWTH IN 2015 Springdale, Arkansas July 28, 2014 Tyson Foods, Inc. (NYSE: TSN), today reported the following results:
News Release. 1 sur 6 31/01/ :55. Print Page Close Window
 1 sur 6 31/01/2014 15:55 Print Page Close Window News Release Tyson Continues Strong Earnings Trend as First Quarter Earnings Increase 47% to $0.72 SPRINGDALE, Ark., Jan. 31, 2014 (GLOBE NEWSWIRE) -- Tyson
Goldman Sachs Global Staples Forum
 Goldman Sachs Global Staples Forum May 12, 2015 Forward-Looking Statements Certain information contained in this presentation may constitute forward-looking statements, such as statements relating to expected
Supplemental Information
 Supplemental Information 1st Quarter Fiscal 2018 February 8, 2018 Dennis Leatherby Tom Hayes Stewart Glendinning 2 Forward-Looking Statements Certain information contained in this presentation may constitute
Supplemental Information February 7, 2019 Tyson Foods, Inc.
 Q1 FY2019 Supplemental Information Today s Speakers Noel White President & CEO Stewart Glendinning EVP & CFO Forward-Looking Statements Certain information in this report constitutes forward-looking statements.
Supplemental Information
 Supplemental Information 2 nd Quarter Fiscal 2018 May 7, 2018 Today s Speakers Tom Hayes President & CEO Stewart Glendinning EVP & CFO 2 Forward-Looking Statements Certain information contained in this
Supplemental Information
 Supplemental Information 3 rd Quarter Fiscal 2018 August 6, 2018 Today s Speakers Tom Hayes President & CEO Stewart Glendinning EVP & CFO 2 Forward-Looking Statements Certain information contained in this
Diversified Portfolio Drives Record Year for Tyson as Fiscal Year 2015 Adjusted Operating Income up 37% to $2.25 Billion
 NEWS RELEASE Diversified Portfolio Drives Record Year for Tyson as Fiscal Year 2015 Adjusted Operating Income up 37% to $2.25 Billion 11/23/2015 SPRINGDALE, Ark., Nov. 23, 2015 (GLOBE NEWSWIRE) -- Tyson
Strong Chicken and Prepared Foods Results Drive Tyson Record Adjusted Operating Income Up 40% to $568 Million
 NEWS RELEASE Strong Chicken and Prepared Foods Results Drive Tyson Record Adjusted Operating Income Up 40% to $568 Million 8/3/2015 SPRINGDALE, Ark., Aug. 3, 2015 (GLOBE NEWSWIRE) -- Tyson Foods, Inc.
Farm to Market Conference
 12 th Annual Farm to Market Conference BMO Capital Markets May 17, 2017 Core 9 and Total Tyson Outpacing CPG Volume sales % change among top 10 branded food companies >$5B in sales 5.0% 4.8% Total Food
Tyson's Third Quarter Earnings Surge 51% Due to Strong Performance Across All Segments of Business
 NEWS RELEASE Tyson's Third Quarter Earnings Surge 51% Due to Strong Performance Across All Segments of Business 8/8/2016 SPRINGDALE, Ark., Aug. 08, 2016 (GLOBE NEWSWIRE) -- Tyson Foods, Inc. (NYSE:TSN),
Supplemental Information
 Supplemental Information 4th Quarter Fiscal 2017 November 13, 2017 Tom Hayes President & Chief Executive Officer Dennis Leatherby Executive Vice President & Chief Financial Officer 2 Forward-Looking Statements
Tyson Foods, Inc. (Exact name of Registrant as specified in its charter)
") UNITED STATES SECURITIES AND EXCHANGE COMMISSION WASHINGTON, D.C. 20549 FORM 8-K Current Report Pursuant to Section 13 or 15(d) of the Securities Exchange Act of 1934 Date of Report (Date of Earliest Event
UNITED STATES SECURITIES AND EXCHANGE COMMISSION WASHINGTON, D.C. 20549 FORM 8-K Current Report Pursuant to Section 13 or 15(d) of the Securities Exchange Act of 1934 Date of Report (Date of Earliest Event
WASHINGTON,DC20549 FORM8-K CURRENTREPORT PursuanttoSection13or15(d)ofthe
ofthe") UNITEDSTATES SECURITIESANDEXCHANGECOMMISSION WASHINGTON,DC20549 FORM8-K CURRENTREPORT PursuanttoSection13or15(d)ofthe SecuritiesExchangeActof1934 Date of Report (Date of earliest event reported): September28,2017
UNITEDSTATES SECURITIESANDEXCHANGECOMMISSION WASHINGTON,DC20549 FORM8-K CURRENTREPORT PursuanttoSection13or15(d)ofthe SecuritiesExchangeActof1934 Date of Report (Date of earliest event reported): September28,2017
Forward-Looking Statements
 December 2016 Forward-Looking Statements Certain information contained in the press release may constitute forward-looking statements, such as statements relating to expected performance, and including,
Forward-Looking Statements
 September 2016 Forward-Looking Statements Certain information contained in the press release may constitute forward-looking statements, such as statements relating to expected performance, and including,
TYSON FOODS PRODUCES SOLID FOURTH QUARTER, FISCAL 2018 EARNINGS Diversified Business Model and Portfolio Contribute to Strong Results
 TYSON FOODS PRODUCES SOLID FOURTH QUARTER, FISCAL 2018 EARNINGS Diversified Business Model and Portfolio Contribute to Strong Results Springdale, Arkansas November 13, 2018 Tyson Foods, Inc. (NYSE: TSN),
UNITED STATES SECURITIES AND EXCHANGE COMMISSION Washington, D.C FORM 10-K
 UNITED STATES SECURITIES AND EXCHANGE COMMISSION Washington, D.C. 20549 FORM 10-K [X] Annual Report Pursuant to Section 13 or 15(d) of the Securities Exchange Act of 1934 For the fiscal year ended October
Tyson Foods, Inc. (Exact name of Registrant as specified in its charter)
") UNITED STATES SECURITIES AND EXCHANGE COMMISSION WASHINGTON, D.C. 20549 FORM 8-K Current Report Pursuant to Section 13 or 15(d) of the Securities Exchange Act of 1934 Date of Report (Date of Earliest Event
UNITED STATES SECURITIES AND EXCHANGE COMMISSION WASHINGTON, D.C. 20549 FORM 8-K Current Report Pursuant to Section 13 or 15(d) of the Securities Exchange Act of 1934 Date of Report (Date of Earliest Event
UNITED STATES SECURITIES AND EXCHANGE COMMISSION Washington, D.C FORM 10-K (Commission File Number) TYSON FOODS, INC.
 TYSON FOODS, INC.") UNITED STATES SECURITIES AND EXCHANGE COMMISSION Washington, D.C. 20549 FORM 10-K [X] Annual Report Pursuant to Section 13 or 15(d) of the Securities Exchange Act of 1934 For the fiscal year ended September
UNITED STATES SECURITIES AND EXCHANGE COMMISSION Washington, D.C. 20549 FORM 10-K [X] Annual Report Pursuant to Section 13 or 15(d) of the Securities Exchange Act of 1934 For the fiscal year ended September
Supplemental Information November 13, 2018
 Q4 FY2018 Supplemental Information Today s Speakers Noel White President & CEO Stewart Glendinning EVP & CFO Forward- Looking Statements Certain information in this report constitutes forward-looking statements.
Smithfield Foods Reports Record Fourth Quarter and Full Year Results
 Smithfield Foods Reports Record Fourth Quarter and Full Year Results SMITHFIELD, Va., June 16, (GLOBE NEWSWIRE) -- Smithfield Foods, Inc. (NYSE:SFD) today reported record fiscal fourth quarter and full
4Q16 and 2016 Results
 JBS S.A. (BVM&FBOVESPA: JBSS3; OTCQX: JBSAY) São Paulo, March 13 th, 2017 and 2016 Results JBS Ended With Net Income of R$693.9 million and a free cash generation of R$2.9 billion JBS ended with net revenues
Smithfield Foods Reports Record First Quarter Results
 FOR IMMEDIATE RELEASE Smithfield Foods Reports Record First Quarter Results SMITHFIELD, Virginia (September 8, 2010) Smithfield Foods, Inc. (NYSE: SFD) today reported fiscal 2011 first quarter results.
Investor - Analyst Day
 Investor - Analyst Day October 2018 Randall C. Stuewe, Chairman and CEO Brad Phillips, EVP Chief Financial Officer John Bullock, EVP Chief Strategy Officer and Specialty Ingredients USA Melissa A. Gaither,
BMO Farm to Market Conference. May 18, 2017
 BMO Farm to Market Conference May 18, 2017 Todd Becker President & Chief Executive Officer Green Plains Inc. NASDAQ: GPRE www.gpreinc.com Green Plains Partners LP NASDAQ: GPP www.greenplainspartners.com
TYSON FOODS, INC. (Exact name of registrant as specified in its charter)
") UNITED STATES SECURITIES AND EXCHANGE COMMISSION Washington, D.C. 20549 FORM 10-K [X] Annual Report Pursuant to Section 13 or 15(d) of the Securities Exchange Act of 1934 For the fiscal year ended October
UNITED STATES SECURITIES AND EXCHANGE COMMISSION Washington, D.C. 20549 FORM 10-K [X] Annual Report Pursuant to Section 13 or 15(d) of the Securities Exchange Act of 1934 For the fiscal year ended October
Harley-Davidson, Inc. NYSE Investor Meeting June 25, 2012
 Harley-Davidson, Inc. NYSE Investor Meeting June 25, 2012 Amy Giuffre, Director of Investor Relations Harley-Davidson, Inc. Rachel Perschke, Investor Relations Coordinator Harley-Davidson, Inc. Keith Wandell,
Opportunities on the Table TYSON FOODS, INC ANNUAL REPORT
 Opportunities on the Table TYSON FOODS, INC. 2006 ANNUAL REPORT Contents 1 Letter to Shareholders 2 Food for Thought Q&A with Tyson s new President and CEO Dick Bond 4 Appetite for Change Tyson Foods is
McCormick - A taste for the future. Wachovia Consumer Growth Conference October 15, 2008
 McCormick - A taste for the future Wachovia Consumer Growth Conference October 15, 2008 Forward-Looking Information Certain information contained in these materials and our remarks, including expected
Acquisition of AdvancePierre
 Acquisition of AdvancePierre Investor Presentation April 2017 Forward-Looking Statements This communication contains forward-looking statements, including statements regarding the expected consummation
July 28, 2016 Conference Call Slide Presentation HARLEY-DAVIDSON, INC SECOND QUARTER UPDATE
 HARLEY-DAVIDSON, INC. 2016 SECOND QUARTER UPDATE JULY 28, 2016 2016 SECOND QUARTER UPDATE THIS PRESENTATION SUPPORTS THE AUDIO CONFERENCE CALL CONFERENCE CALL PARTICIPANTS Introduction Business Perspectives
Pilgrim s Pride Corporation (NASDAQ: PPC) Pilgrim s Acquires Moy Park September 11, 2017
 Pilgrim s Acquires Moy Park September 11, 2017") Pilgrim s Pride Corporation (NASDAQ: PPC) Pilgrim s Acquires Moy Park September 11, 2017 Cautionary Notes and Forward-Looking Statements Statements contained in this presentation that share our intentions,
Pilgrim s Pride Corporation (NASDAQ: PPC) Pilgrim s Acquires Moy Park September 11, 2017 Cautionary Notes and Forward-Looking Statements Statements contained in this presentation that share our intentions,
HORMEL FOODS REPORTS THIRD QUARTER EARNINGS AND RAISES FULL YEAR EARNINGS GUIDANCE
 INVESTOR CONTACT: MEDIA CONTACT: Jana Haynes Wendy Watkins (507) 437-5248 (507) 437-5355 jlhaynes@hormel.com media@hormel.com HORMEL FOODS REPORTS THIRD QUARTER EARNINGS AND RAISES FULL YEAR EARNINGS GUIDANCE
Reasons to Believe IR OVERVIEW 2014
 Reasons to Believe IR OVERVIEW 2014 2 Forward-Looking Statements This presentation may contain statements, estimates or projections that constitute forward-looking statements as defined under U.S. federal
Commodities: A Strategic Asset Allocation?
 FINANCE, INVESTMENT & RISK MANAGEMENT CONFERENCE 15-17 JUNE 2008 HILTON DEANSGATE, MANCHESTER Commodities: A Strategic Asset Allocation? John.McManus@union-investment.de Commodities: A Distinct Asset Class
Jim Snee. President and Chief Operating Officer
 Jim Snee President and Chief Operating Officer 1 Legal Disclosure This presentation contains forward-looking information based on management s current views and assumptions. Actual events may differ materially.
The J. M. Smucker Company
 The J. M. Smucker Company Fourth Quarter Fiscal 2018 Earnings SUPPLEMENTARY INFORMATION June 7, 2018 Consolidated Results ($ in millions, except per share data) FY18 Q4 FY17 Q4 YoY Change Net Sales $1,781
Fourth Quarter and Full Year 2018 Financial Review. January 28, 2019
 Fourth Quarter and Full Year 2018 Financial Review January 28, 2019 Forward-Looking Statements Certain statements in this financial review relate to future events and expectations and are forward-looking
Maple Leaf Foods Investor Presentation Fourth Quarter and Fiscal 2007 Financial Results
 Maple Leaf Foods Investor Presentation Fourth Quarter and Fiscal 2007 Financial Results Some of the statements in this presentation may constitute forward-looking information and future results could differ
HORMEL FOODS REPORTS RECORD SECOND QUARTER RESULTS
 INVESTOR CONTACT: MEDIA CONTACT: Jana Haynes Julie Craven (507) 437-5248 (507) 437-5345 jlhaynes@hormel.com media@hormel.com HORMEL FOODS REPORTS RECORD SECOND QUARTER RESULTS AUSTIN, Minn. (May 21, 2014)
McCormick & Company, Inc. 3rd Quarter 2017 Financial Results and Outlook September 28, 2017
 McCormick & Company, Inc. 3rd Quarter 2017 Financial Results and Outlook September 28, 2017 1 The following slides accompany a September 28, 2017 earnings release conference call. This information should
HORMEL FOODS REPORTS RECORD FOURTH QUARTER, FULL YEAR RESULTS
 INVESTOR CONTACT: MEDIA CONTACT: Jana Haynes Julie Craven (507) 437-5248 (507) 437-5345 jlhaynes@hormel.com media@hormel.com HORMEL FOODS REPORTS RECORD FOURTH QUARTER, FULL YEAR RESULTS AUSTIN, Minn.
Forward Looking Statements
 May 2017 Forward Looking Statements The statements contained in this presentation that are not historical facts are forward-looking statements that involve a number of risks and uncertainties. Forward-looking
McCormick & Company, Inc. 4 th Quarter 2015 Financial Results and Business Outlook January 28, 2016
 McCormick & Company, Inc 4 th Quarter 2015 Financial Results and Business Outlook January 28, 2016 The following slides accompany a January 28, 2016 presentation to investment analysts This information
GENERAL MILLS FISCAL 2019 FIRST-QUARTER EARNINGS SEPTEMBER 18, 2018
 GENERAL MILLS FISCAL 2019 FIRST-QUARTER EARNINGS SEPTEMBER 18, 2018 A Reminder on Forward-looking Statements This presentation contains forward-looking statements within the meaning of the Private Securities
Third Quarter 2018 Earnings. (Unaudited Results) October 25, 2018
 October 25, 2018") Third Quarter 2018 Earnings (Unaudited Results) October 25, 2018 Forward-Looking Statements This presentation contains a number of forward-looking statements within the meaning of the Private Securities
Third Quarter 2018 Earnings (Unaudited Results) October 25, 2018 Forward-Looking Statements This presentation contains a number of forward-looking statements within the meaning of the Private Securities
Sealed Air Reports Fourth Quarter and Full Year 2018 Results
 Exhibit 99.1 Sealed Air Corporation 2415 Cascade Pointe Blvd. Charlotte, NC 28208 For release: February 7, 2019 Sealed Air Reports Fourth Quarter and Full Year 2018 Results Solid year-over-year sales and
Cenveo Reports Third Quarter 2016 Results
 News Release Cenveo Reports Third Quarter Results - Redeeming 50% of Remaining 11.5% Notes, Repurchased Most of 7% Convertible Notes - STAMFORD, CT (November 2, ) - Cenveo, Inc. (NYSE: CVO) reported financial
Interim Report to Shareholders For the three months ended December 31, 2005
 Interim Report to Shareholders For the three months ended December 31, 2005 MANAGEMENT S DISCUSSION AND ANALYSIS The following Management Discussion and Analysis as of February 13, 2006 is based on the
Our Transformation Continues. March 21, 2018
 Our Transformation Continues March 21, 2018 Disclosure Regarding Forward-Looking Statements Forward-Looking Statements and Factors That May Affect Future Results: Throughout this presentation, we make
October 18, 2016 Conference Call Slide Presentation HARLEY-DAVIDSON, INC THIRD QUARTER UPDATE
 HARLEY-DAVIDSON, INC. 2016 THIRD QUARTER UPDATE OCTOBER 18, 2016 2016 THIRD QUARTER UPDATE THIS PRESENTATION SUPPORTS THE AUDIO CONFERENCE CALL CONFERENCE CALL PARTICIPANTS Introduction Business Perspectives
GENERAL MILLS REPORTS FISCAL 2019 FIRST-QUARTER RESULTS
 News/Information Investor Relations P. O. Box 1113 Minneapolis, MN 55440 FOR IMMEDIATE RELEASE September 18, 2018 Contact: (analysts) Jeff Siemon: 763-764-2301 (media) Kelsey Roemhildt: 763-764-6364 GENERAL
CAMPBELL REPORTS FIRST-QUARTER RESULTS
 FOR IMMEDIATE RELEASE INVESTOR CONTACT: MEDIA CONTACT: Ken Gosnell Thomas Hushen (856) 342-6081 (856) 342-5227 ken_gosnell@campbellsoup.com thomas_hushen@campbellsoup.com CAMPBELL REPORTS FIRST-QUARTER
Brand Portfolio and Positioning
 This presentation contains forward-looking statements, such as projected operating results, earnings and cash flows, that are subject to known and unknown risks and uncertainties that could cause actual
McCormick & Company, Inc. 2nd Quarter 2017 Financial Results and Outlook June 29, 2017
 McCormick & Company, Inc. 2nd Quarter 2017 Financial Results and Outlook June 29, 2017 1 The following slides accompany a June 29, 2017 presentation to investment analysts. This information should be read
McCormick & Company, Inc. 4th Quarter 2016 Financial Results and Outlook January 25, 2017
 McCormick & Company, Inc. 4th Quarter 2016 Financial Results and Outlook January 25, 2017 The following slides accompany a January 25, 2017 presentation to investment analysts. This information should
Q Investor Highlights. August 8, 2018
 Q2 2018 Investor Highlights August 8, 2018 Forward Looking Statements This document contains forward-looking statements, that is, information related to future, not past, events. Such statements generally
Second Quarter 2018 Earnings (Unaudited Results) July 25, Mattel, Inc. All Rights Reserved.
 July 25, Mattel, Inc. All Rights Reserved.") Second Quarter 2018 Earnings (Unaudited Results) July 25, 2018 FORWARD-LOOKING STATEMENTS: This presentation contains a number of forward-looking statements within the meaning of the Private Securities
Second Quarter 2018 Earnings (Unaudited Results) July 25, 2018 FORWARD-LOOKING STATEMENTS: This presentation contains a number of forward-looking statements within the meaning of the Private Securities
Rent-A-Center today is
 INVESTOR PRESENTATION FIRST QUARTER 2014 Safe Harbor This presentation contains forward-looking statements that involve risks and uncertainties. Such forward-looking statements generally can be identified
Jakarta, April 5 th, Unofficial Translation
 Jakarta, April 5 th, 2017 Unofficial Translation Content Company Overview Operational Performance Financial Highlights Challenges & Strategies Appendix 2 An Introduction To Japfa Tbk Vertically integrated
McCormick & Company, Inc.
 McCormick & Company, Inc. Bernstein Strategic Decisions Conference May 30, 2018 FORWARD-LOOKING INFORMATION Certain information contained in this release, including statements concerning expected performance
Atria Plc Interim Report
 Atria Plc Interim Report 1 January 31 March 2017 1/17 INTERIM REPORT OF ATRIA PLC 1 JANUARY 31 MARCH 2017 Atria records growth in net sales in all business areas January March 2017 - Consolidated net sales
Excluding certain items affecting comparability, earnings per share grew 23 percent to $0.97, exceeding the consensus of analyst estimates.
 General Mills Reports Strong Results for Fiscal 2010 Third Quarter Company Raises Full-year EPS Guidance MINNEAPOLIS, Mar 24, 2010 (BUSINESS WIRE) -- General Mills (NYSE: GIS) today reported financial
GENERAL MILLS. Fiscal 2018 Fourth Quarter and Full-year Results. June 27, 2018
 GENERAL MILLS Fiscal 2018 Fourth Quarter and Full-year Results June 27, 2018 A Reminder on Forward-looking Statements This presentation contains forward-looking statements within the meaning of the Private
Credit Suisse 6 th Annual Industrials Conference November 2018
 Credit Suisse 6 th Annual Industrials Conference November 2018 Safe Harbor This presentation includes forward-looking statements which are statements that are not historical facts, including statements
Investor Deck December 2018
 Investor Deck December 2018 Safe Harbor This presentation includes forward-looking statements which are statements that are not historical facts, including statements that relate to the mix of and demand
Note: Adjusted Earnings per Share measures are defined as basic earnings per share adjusted for the impact of restructuring and other related costs.
 Maple Leaf Foods Inc. Management s Discussion and Analysis For the first quarter ended March 31, 2009 Financial Overview Financial and operational highlights for the first quarter include: Adjusted Earnings
General Mills. Fiscal 2016 First Quarter Results
 General Mills Fiscal 2016 First Quarter Results A Reminder on Forward-looking Statements This presentation contains forward-looking statements within the meaning of the Private Securities Litigation Reform
April 25, 2016 Media Contact: Dan Turner WILMINGTON, Del Investor Contact:
 April 25, 2016 Media Contact: Dan Turner WILMINGTON, Del. 302-996-8372 daniel.a.turner@dupont.com Investor Contact: 302-774-4994 DuPont Reports 1Q Operating EPS 1 of $1.26 and GAAP EPS of $1.39 Operating
GENERAL MILLS FISCAL 2019 THIRD-QUARTER EARNINGS MARCH 20, 2019
 GENERAL MILLS FISCAL 2019 THIRD-QUARTER EARNINGS MARCH 20, 2019 1 A Reminder on Forward-looking Statements This presentation contains forward-looking statements within the meaning of the Private Securities
Maple Leaf Foods Reports Results for Fourth Quarter TSX: MFI
 Maple Leaf Foods Reports Results for Fourth Quarter 2013 TSX: MFI www.mapleleaffoods.com TORONTO, Feb. 27, 2014 /CNW/ - Maple Leaf Foods Inc. (TSX: MFI) today reported its financial results for the fourth
GENERAL MILLS FISCAL 2019 SECOND-QUARTER EARNINGS DECEMBER 19, 2018
 GENERAL MILLS FISCAL 2019 SECOND-QUARTER EARNINGS DECEMBER 19, 2018 1 A Reminder on Forward-looking Statements This presentation contains forward-looking statements within the meaning of the Private Securities
Assurant Investor Overview
 Assurant Investor Overview First Quarter 2018 2018 Assurant, Inc. All rights reserved. 1 Cautionary Statements Some of the statements included in this presentation, particularly those anticipating future
Our Transformation Continues Sidoti NDR May 29-30, 2018
 Our Transformation Continues Sidoti NDR May 29-30, 2018 Disclosure Regarding Forward-Looking Statements Forward-Looking Statements and Factors That May Affect Future Results: Throughout this presentation,
GENERAL MILLS REPORTS FOURTH-QUARTER AND FULL-YEAR FISCAL 2018 RESULTS; PROVIDES 2019 OUTLOOK
 News/Information Investor Relations P. O. Box 1113 Minneapolis, MN 55440 FOR IMMEDIATE RELEASE June 27, 2018 Contact: (analysts) Jeff Siemon: 763-764-2301 (media) Bridget Christenson: 763-764-6364 GENERAL
Cautionary Statement
 December 2017 Cautionary Statement Certain statements included herein contain forward-looking statements within the meaning of federal securities laws about the financial condition and results of operations
EARNINGS CALL. FISCAL 2018: Q3 RESULTS March 22, 2018
 EARNINGS CALL FISCAL 2018: Q3 RESULTS March 22, 2018 Disclaimer/Non-GAAP Information IMPORTANT NOTICE The following slides are part of a presentation by Darden Restaurants, Inc. (the "Company") and are
Fourth Quarter & Full-Year Fiscal 2018 Results. Strategy & Portfolio Review
 Fourth Quarter & Full-Year Fiscal 2018 Results Strategy & Portfolio Review 1 Forward-Looking Statements The factors that could cause actual results to vary materially from those anticipated or expressed
January 28, 2014 Media Contact: Patty Seif WILMINGTON, Del Investor Contact:
 January 28, 2014 Media Contact: Patty Seif WILMINGTON, Del. 302-774-4482 patricia.r.seif@dupont.com Investor Contact: 302-774-4994 DuPont Reports 4Q and Full-Year 2013 Operating EPS of $.59 and $3.88;
HORMEL FOODS REPORTS RECORD FOURTH QUARTER AND FISCAL 2018 EARNINGS; PROVIDES FISCAL 2019 OUTLOOK
 INVESTOR CONTACT: Nathan Annis (507) 437-5248 ir@hormel.com MEDIA CONTACT: Wendy Watkins (507) 437-5345 media@hormel.com HORMEL FOODS REPORTS RECORD FOURTH QUARTER AND FISCAL EARNINGS; PROVIDES FISCAL
GENERAL MILLS. Fiscal 2018 Second Quarter Results. December 20, 2017
 GENERAL MILLS Fiscal 2018 Second Quarter Results December 20, 2017 A Reminder on Forward-looking Statements This presentation contains forward-looking statements within the meaning of the Private Securities
Hormel Foods Achieves Record Fourth Quarter and Full Year Results Company Release - 11/22/2016 6:30 AM ET
 Press Release Home / Press Release Hormel Foods Achieves Record Fourth Quarter and Full Year Results Company Release - 11/22/2016 6:30 AM ET AUSTIN, Minn.--(BUSINESS WIRE)-- Hormel Foods Corporation (NYSE:
The J.M. Smucker Company
 The J.M. Smucker Company CONSUMER ANALYST GROUP OF NEW YORK CONFERENCE February 21, 2018 Strategy and Business Update Mark Smucker President and Chief Executive Officer Financial Update Mark Belgya Vice
JBS ENDS 3Q18 WITH NET REVENUE OF R$49.4 BILLION AND ADJUSTED EBITDA OF R$4.4 BILLION. Free cash flow reached R$2.3 billion
 Highlights São Paulo, November 13, 2018 JBS S.A. (B3: JBSS3; OTCQX: JBSAY) JBS ENDS WITH NET REVENUE OF R$49.4 BILLION AND ADJUSTED EBITDA OF R$4.4 BILLION Free cash flow reached R$2.3 billion In, net
2013 INVESTOR MEETINGS May 2013
 2013 May 2013 INVESTOR MEETINGS WHIRLPOOL CORPORATION ADDITIONAL INFORMATION This document contains forward-looking statements about Whirlpool Corporation and its consolidated subsidiaries ( Whirlpool
CUSTOMERS. PEOPLE. PARTNERS.
 THIRD-QUARTER 2017 FINANCIAL REVIEW October 24, 2017 CUSTOMERS. PEOPLE. PARTNERS. FORWARD-LOOKING STATEMENTS Forward-looking Statements Certain statements in this financial review relate to future events
FINANCIAL OVERVIEW AL MISTYSYN SENIOR VICE PRESIDENT, FINANCE & CHIEF FINANCIAL OFFICER FINANCIAL COMMUNITY PRESENTATION OCTOBER 3, 2017
 FINANCIAL OVERVIEW AL MISTYSYN SENIOR VICE PRESIDENT, FINANCE & CHIEF FINANCIAL OFFICER FINANCIAL COMMUNITY PRESENTATION OCTOBER 3, 2017 Forward Looking Statement The presentations today will contain certain
inspiring wonder 2018 New York Toy Fair
 Forward-Looking Statements/Regulation G FORWARD-LOOKING STATEMENTS: This presentation contains a number of forward-looking statements within the meaning of the Private Securities Litigation Reform Act
THE J. M. SMUCKER COMPANY
 Richard Smucker Chief Executive Officer THE J. M. SMUCKER TEAM RICHARD SMUCKER Chief Executive Officer MARK SMUCKER President, U.S. Retail Coffee PAUL SMUCKER WAGSTAFF President, U.S. Retail Consumer Foods
Q Update. May 3, 2017
 Q1 2017 Update May 3, 2017 Safe Harbor Statement This webcast presentation contains a number of forward-looking statements. Words such as build, gain, drive, invest, grow, execute, enable, continue, expect,
2017 RESULTS. JBS ended 2017 with a 18.9% higher EBITDA of R$13.4 billion. FY free cash flow was R$2.8 billion
 2017 RESULTS JBS ended 2017 with a 18.9% higher EBITDA of R$13.4 billion FY free cash flow was R$2.8 billion In 2017, net revenue was R$163.2 billion, equivalent to US$51.5 billion Gross profit totaled
Second Quarter 2018 Financial Review. July 30, 2018
 Second Quarter 2018 Financial Review July 30, 2018 Forward-Looking Statements Certain statements in this financial review relate to future events and expectations and are forward-looking statements within
JBS S.A. August / September, 2013
 JBS S.A. August / September, 2013 Disclaimer This release contains forward-looking statements relating to the prospects of the business, estimates for operating and financial results, and those related
BMC STOCK HOLDINGS, INC. Second Quarter 2018 Earnings Presentation July 30, BMC. All Rights Reserved.
 BMC STOCK HOLDINGS, INC. Second Quarter 2018 Earnings Presentation July 30, 2018 2018 BMC. All Rights Reserved. CLICK Disclaimer TO EDIT TITLE This presentation contains "forward-looking statements" within