Highlights of the third quarter of 2017
|
|
|
- Arleen Lang
- 5 years ago
- Views:
Transcription
1 Consolidated Highlights Free cash flow of R$ 500 million in 3Q17, double the amount generated in 2Q17. Selling, general and administrative expenses decrease 18% in 3Q17 compared to 3Q16, corresponding to 4.2% of net sales. Highlights of the third quarter of Cash conversion cycle decreases to 74 days. Financial leverage measured by net debt / EBITDA ratio falls to 3.4x. Net income came to R$ 145 million in 3Q17. Free Cash Flow 3Q17 (R$ million) SG&A Expenses (R$ million and % of Net Sales) -18% 1,166 (170) (33) (296) (167) % 6.2% % 4.6% 4.2% Adjusted EBITDA 3Q CAPEX Income Tax Debt Interest, net Working Capital Free Cash Flow 3Q17 3Q16 4Q16 1Q17 2Q17 3Q17 SG&A % of net sales Cash Conversion Cycle (days) Indebtedness (R$ billion) and Leverage Ratio x 3.5x 3.5x 3.6x 3.4x Sep/16 Dec/16 Mar/17 Jun/17 Sep/17 Working Capital (R$ billion) Cash Conversion Cycle (days) Sep/16 Dec/16 Mar/17 Jun/17 Sep/17 Gross Debt Cash Net debt/ebitda (R$) 1
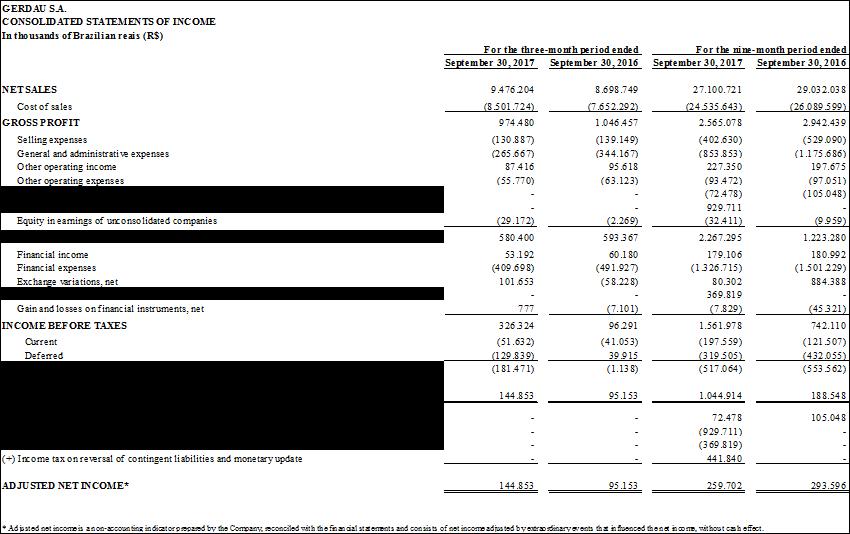
2 Gerdau s performance in the third quarter of The Consolidated Financial Statements of Gerdau S.A. are presented in accordance with the International Financial Reporting Standards (IFRS) issued by the International Accounting Standards Board (IASB) and the accounting practices adopted in Brazil, which are fully aligned with the international accounting standards issued by the Accounting Pronouncement Committee (CPC). The information in this report does not include data for associates and jointly controlled entities, except where stated otherwise. Operating Results Consolidated Information Consolidated 3Q17/3Q16 2 nd Quarter 3Q17/2Q17 9M17/9M16 Volumes (1,000 tonnes) Production of crude steel 4,062 3, % 4, % 12,171 12, % Shipments of steel 3,865 3, % 3, % 11,163 11, % Results (R$ million) Net Sales 9,476 8, % 9, % 27,101 29, % Cost of Goods Sold (8,502) (7,652) 11.1% (8,229) 3.3% (24,536) (26,090) -6.0% Gross profit 974 1, % % 2,565 2, % Gross margin (%) 10.3% 12.0% 10.2% 9.5% 10.1% SG&A (397) (483) -17.8% (420) -5.5% (1,257) (1,705) -26.3% Selling expenses (131) (139) -5.8% (133) -1.5% (403) (529) -23.8% General and administrative expenses (266) (344) -22.7% (287) -7.3% (854) (1,176) -27.4% Adjusted EBITDA 1,166 1, % 1, % 3,140 3, % Adjusted EBITDA Margin 12.3% 13.8% 12.2% 11.6% 11.5% Production and shipments Consolidated shipments increased in 3Q17 compared to 3Q16, mainly due to the higher volumes at the North America and Special Steel BDs, which more than offset the lower volumes at the South America BD caused by the deconsolidation of Colombia in June. In relation to 2Q17, consolidated shipments increased, supported by higher shipments at the North America BD and in the domestic market of the Brazil BD. Operating result Consolidated net sales and cost of goods sold increased in 3Q17 compared to 3Q16, mainly due to the higher shipments at the North America and Special Steel BDs. Gross margin in 3Q17 declined due to the weaker performances of the Brazil and North America BDs, which were affected by higher raw material costs. In relation to 2Q17, net sales and cost of goods sold increased due to higher shipments. Gross margin in 3Q17 remained stable in relation to 2Q17, with the results of the BDs neutralizing each other. The reduction in selling, general and administrative expenses in 3Q17 compared to 3Q16 and 2Q17 demonstrates the efforts made to streamline these expenses at all business divisions. In a comparison of the nine months of with the same period of, selling, general and administrative decreased by 26.3%. Breakdown of Consolidated EBITDA 2 nd Quarter (R$ million) 3Q17/3Q16 3Q17/2Q17 9M17/9M16 Net income % % 1, % Net financial result % % % Provision for income and social contribution taxes (100) % Depreciation and amortization % % 1,569 1, % EBITDA - Instruction CVM ¹ 1,095 1, % 1, % 3,836 3, % Results in operations with subsidiary and associate % Equity in earnings of unconsolidated companies % % % Proportional EBITDA of associated companies and jointly controlled entities % % % Reversal of contingent liabilities, net (930) - - Adjusted EBITDA 2 1,166 1, % 1, % 3,140 3, % Adjusted EBITDA Margin 12.3% 13.8% 12.2% 11.6% 11.5% 1 - Non-accounting measurement calculated pursuant to Instruction 527 of the CVM. 2 - Non-accounting mesurement prepared by the Company. Note: EBITDA (Earnings Before Interest, Taxes, Depreciation and Amortization) is not a method used in accounting practices, does not represent cash flow for the periods in question and should not be considered an alternative to cash flow as an indicator of liquidity. The Company presents adjusted EBITDA to provide additional information regarding cash flow generation in the period. 2
3 Conciliation of Consolidated EBITDA (R$ million) EBITDA - Instruction CVM ¹ Depreciation and amortization OPERATING INCOME BEFORE FINANCIAL RESULT AND TAXES² 1 - Non-accounting measure calculated pursuant to Instruction 527 of the CVM. 2 - Accounting measurement disclosed in consolidated Statements of Income. 3rd Quarter 3rd Quarter 2nd Quarter 1,095 1,160 1,006 3,836 3,088 (515) (567) (526) (1,569) (1,865) ,267 1,223 EBITDA and EBITDA margin in 3Q17 accompanied the performances of gross profit and gross margin in the comparisons with both 3Q16 and 2Q % 8.3% 10.1% 12.2% 12.3% 1, ,120 1,166 3Q16 4Q16 1Q17 2Q17 3Q17 EBITDA Adjusted EBITDA Margin Adjusted Financial result and net income Consolidated (R$ million) 3Q17/3Q16 2 nd Quarter 9M17/9M16 Income (loss) before financial income expenses and taxes % % 2,267 1, % Financial Result (254) (497) -48.9% (505) -49.7% (705) (481) 46.6% Financial income % % % Financial expenses (410) (492) -16.7% (454) -9.7% (1,327) (1,501) -11.6% Exchange variation, net 102 (58) - (96) % Exchange variation on net investment hedge 107 (37) - (107) % Exchange variation - other lines (5) (21) -76.2% % Reversal of monetary update of contingent liabilities, net Gains (losses) on financial instruments, net 1 (7) % (8) (45) -82.2% Income (loss) before taxes¹ % (25) - 1, % Income and social contribution taxes (181) (1) % (518) (554) -6.5% On net investment hedge (107) (72) (688) -89.5% Other lines (74) (38) 94.7% (7) 957.1% (4) On reversal of contingent liabilities (442) - - Consolidated Net Income (loss)¹ % % 1, % Extraordinary events (786) Results in operations with subsidiary and associate % Reversal of contingent liabilities, net (858) - - Consolidated Adjusted Net Income (loss) % % % 1 - Accounting measurement disclosed in the income statement of the Company. 2 - Non accounting measurement made by the Company to demonstrate the net income adjusted by the extraordinary events that impacted the result, but without cash effect. 3Q17/2Q17 In 3Q17 compared to 3Q16 and 2Q17, the reduction in the financial result was basically due to the effects from exchange variation on liabilities contracted in U.S. dollar (appreciation in the end-of-period price of the Brazilian real against the U. S. dollar of 4.2% in 3Q17, depreciation of 1.1% in 3Q16 and depreciation of 4.4% in 2Q17) and to lower financial expenses. Note that, in accordance with IFRS, the Company designated the bulk of its debt in foreign currency contracted by companies in Brazil as hedge for a portion of the investments in subsidiaries located abroad. As a result, only the effect from exchange variation on the portion of debt not linked to investment hedge is recognized in the financial result, with this effect neutralized by the line "Income and Social Contribution taxes on net investment hedge." The increase in adjusted net income in 3Q17 compared to 3Q16 was mainly due to lower financial expenses. In relation to 2Q17, adjusted net income remained relatively stable. Dividends Gerdau S.A., based on its results for 3Q17, approved the distribution of dividends in the amount of R$ 51.3 million (R$ 0.03 per share) as prepayment of the minimum mandatory dividend stipulated in the Bylaws. 3
4 Payment date: December 1, Record date: close of trading on November 21, Ex-dividend date: November 22, Working capital and Cash conversion cycle In September, the cash conversion cycle (working capital divided by daily net sales in the quarter) decreased in relation to June, reflecting the 3.4% increase in net sales, compared to the relative stability in working capital Sep/16 Dec/16 Mar/17 Jun/17 Sep/17 Working Capital (R$ billion) Cash Conversion Cycle (days) Financial liabilities Debt composition (R$ million) Short Term 4,481 4,186 4,458 Long Term 14,193 15,778 16,125 Gross Debt 18,674 19,964 20,583 Cash, cash equivalents and short-term investments 5,067 5,430 6,088 Net Debt 13,607 14,534 14,495 On September 30,, gross debt was 24.0% short term and 76.0% long term. Note that an important portion of current assets refer to the Bonds (R$ 2.5 billion), which came due in October and was amortized using cash. On September 30,, gross debt was denominated 14.8% in Brazilian real, 82.5% in U.S. dollar and 2.7% in other currencies. The R$ 1.3 billion decrease in gross debt between June 30, and September 30, is basically explained by the effects from exchange variation and by the amortization of working capital loans. On September 30,, 61.8% of cash was held by Gerdau companies abroad and denominated mainly in U.S. dollar. The decrease in net debt on September 30, compared to June 30, is due to the reduction in gross debt. On September 30,, the nominal weighted average cost of gross debt was 6.7%, or 8.2% for the portion denominated in Brazilian real, 6.1% plus exchange variation for the portion denominated in U.S. dollar contracted by companies in Brazil, and 7.2% for the portion contracted by subsidiaries abroad. On September 30,, the average gross debt term was 5.3 years. On September 30,, the payment schedule for long-term gross debt was as follows: Long Term R$ million , , , , and after 1,540 Total 14,193 4
5 The Company's main debt indicators are shown below: Indicators Gross debt / Total capitalization ¹ 42% 44% 45% Net debt² (R$) / EBITDA ³ (R$) 3.4x 3.6x 3.5x 1 - Total capitalization = shareholders' equity + gross debt- interest on debt 2 - Net debt = gross debt - interest on debt - cash, cash equivalents and short-term investments 3 - Adjusted EBITDA in the last 12 months. In October, Gerdau repurchased US$ 552 million in 2021 Bonds and US$ 35 million in 2020 Bonds (the principal in each issue), for which it issued US$ 650 million in new bonds due in 2027 with coupon of 4.875% p.a. The purpose of these transactions is to lengthen the average debt term and to better balance the maturity schedule for the coming years. Investments In 3Q17, CAPEX amounted to R$ 170 million. Of the amount invested in the quarter, 41.3% was allocated to the North America BD, 33.5% to the Brazil BD, 12.7% to the Special Steel BD and 12.5% to the South America BD. In 9M17, CAPEX came to R$ 602 million, ending an investment cycle of industrial expansion capacity to focus on maintenance and technological update of industrial units. Divestments As announced in the notice to the market dated October 4,, Gerdau signed an agreement to sell 100% of its operation in Chile to the Chilean family-owned groups Matco and Ingeniería e Inversiones. The economic value of the transaction is US$ 154 million. The conclusion of the transaction is pending on the approval by the Chilean antitrust authority. The transaction is aligned with the process to optimize the Company s asset portfolio to support higher profitability and deleveraging. Free Cash Flow (FCF) In 3Q17, EBITDA was more than sufficient to honor commitments involving CAPEX, income tax and interest, as well as the working capital consumption of R$ 167 million. Accordingly, free cash flow was positive R$ 500 million. Free cash flow in 3Q17 (R$ million) (170) 1,166 (33) (296) (167) 500 Adjusted EBITDA 3Q17 CAPEX Income Tax Debt Interest, net Working Capital Free Cash Flow 3Q17 Free cash flow by quarter (R$ million) 302 1, (227) 3Q16 4Q16 1Q17 2Q17 3Q17 5
6 Business Divisions (BD) The information in this report is divided into four Business Divisions (BD), in accordance with Gerdau s corporate governance, as follows: Brazil BD (Brazil Business Division) includes the operations in Brazil (except special steel) and the iron ore operation in Brazil; North America BD (North America Business Division) includes all operations in North America (Canada, United States and Mexico), except special steel, as well as the jointly controlled entity and associate company, both located in Mexico; South America BD (South America Business Division) includes all operations in South America (Argentina, Chile, Peru, Uruguay and Venezuela), except the operations in Brazil, and the jointly controlled entity in the Dominican Republic and Colombia; Special Steel BD (Special Steel Business Division) includes the special steel operations in Brazil, United States and India. Net sales Brazil BD North America BD South America BD Special Steel BD 32.4% 40.3% 11.1% 16.2% 2,971 3,060 3,244 3,470 3,903 4,003 1, ,386 1,616 1,648 Net Sales (R$ million) Participation of Net Sales per BD (last 12 months) EBITDA and EBITDA Margin Brazil BD North America BD South America BD Special Steel BD 40.3% 19.3% 13.4% 27.0% 19.7% 15.5% 14.1% 7.5% 6.0% 6.0% 15.1% 13.0% 15.8% 16.8% 18.4% 20.7% EBITDA (R$ million) EBITDA Margin (%) Participation of Adjusted EBITDA per BD (last 12 months) 6
7 Brazil BD Brazil BD Volumes (1,000 tonnes) Production of crude steel 1,565 1, % 1, % 4,591 4, % Shipments of long steel 1,126 1, % 1, % 3,190 3, % Domestic Market % % 1,978 2, % Exports % % 1,212 1, % Shipments of flat steel % % 956 1, % Domestic Market % % % Exports % % % Shipments of steel 1,488 1, % 1, % 4,146 4, % Domestic Market % % 2,709 2, % Exports % % 1,437 1, % Results (R$ million) Net Sales 1 3,244 2, % 3, % 9,088 8, % Domestic Market 2,473 2, % 2, % 6,977 6, % Exports % % 2,111 2, % Cost of Goods Sold (2,878) (2,453) 17.3% (2,684) 7.2% (8,046) (7,628) 5.5% Gross profit % % 1,042 1, % Gross margin (%) 11.3% 17.4% 12.3% 11.5% 12.4% EBITDA % % 1,319 1, % EBITDA margin (%) 14.1% 19.7% 15.5% 14.5% 14.2% 1 - Includes iron ore net sales. Production and shipments Crude steel production decreased in 3Q17 compared to 3Q16, due to the optimization of inventories. The stability in shipments in 3Q17 compared to 3Q16 is explained by the domestic and export markets neutralizing each other. The domestic market expanded in the period, mainly due to stronger shipments to the industrial sector. Meanwhile, shipments to export markets declined given their lower profitability due to higher costs. In relation to 2Q17, shipments increased, mainly due to the higher shipments to the domestic market. In 3Q17, 1,277,000 tonnes of iron ore were sold to third parties and 1,155,000 tonnes were consumed internally. Operating result 3Q17/3Q16 2 nd Quarter Net sales increased in 3Q17 compared to 3Q16, due to the increases in net sales per tonne sold in both the domestic and export markets and to the higher shipments to the domestic market. Compared to 2Q17, the increase in net sales is mainly due to higher shipments. Cost of goods sold increased in 3Q17 in relation to 3Q16, despite the stable shipments, given the higher raw material costs. Compared to 2Q17, cost of goods sold increased in line with the growth in shipments. Gross margin decreased in 3Q17 in relation to 3Q16 explained by higher raw material costs and by an expressive result obtained with exports in 3Q16. In relation to 2Q17, gross margin decreased due to the lower net sales per tonne sold caused by the finished products mix. EBITDA and EBITDA margin decreased in 3Q17 compared to 3Q16 and 2Q17, accompanying the performance of gross profit and gross margin. EBITDA (R$ million) and EBITDA Margin (%) 3Q17/2Q17 9M17/9M % % % 15.5% 14.1% Q16 4Q16 1Q17 2Q17 3Q17 EBITDA EBITDA Margin 7
8 North America BD North America BD Production and shipments Shipments increased in 3Q17 compared to 3Q16, given the Company s efforts to prioritize market share gains. Compared to 2Q17, the increase in shipments accompanied the growth in the region s steel consumption. Operating result 3Q17/3Q16 2 nd Quarter 3Q17/2Q17 9M17/9M16 Volumes (1,000 tonnes) Production of crude steel 1,709 1, % 1, % 5,121 4, % Shipments of steel 1,624 1, % 1, % 4,747 4, % Results (R$ million) Net Sales 4,003 3, % 3, % 11,531 12, % Cost of Goods Sold (3,811) (3,264) 16.8% (3,712) 2.7% (11,037) (11,201) -1.5% Gross profit % % % Gross margin (%) 4.8% 5.9% 4.9% 4.3% 7.1% EBITDA % % % EBITDA margin (%) 6.0% 7.5% 6.0% 5.5% 8.1% Net sales increased in 3Q17 compared to 3Q16 and 2Q17, mainly due to the higher shipments in the comparison periods. The increase in cost of goods sold in 3Q17 compared to 3Q16 is explained by higher shipments and by higher raw material costs. These higher costs with raw materials, which were not fully accompanied by the higher prices for steel, reduced gross margin in 3Q17 compared to 3Q16. In relation to 2Q17, the increase in cost of goods sold was due to the higher shipments in 3Q17. The balanced increases in net sales and cost of goods sold kept gross margin stable in 3Q17 in relation to 2Q17. EBITDA and EBITDA margin in 3Q17 compared to 3Q16 and 2Q17 accompanied the performances of gross profit and gross margin in the comparison periods. 7.5% EBITDA (R$ million) and EBITDA Margin (%) 6.0% 6.0% % % Q16 4Q16 1Q17 2Q17 3Q17 EBITDA EBITDA Margin 8
9 South America BD South America BD 3Q17/3Q16 2 nd Quarter 3Q17/2Q17 9M17/9M16 Volumes (1,000 tonnes) Production of crude steel % % % Shipments of steel % % 1,340 1, % Results (R$ million) Net Sales 930 1, % % 2,901 3, % Cost of Goods Sold (801) (981) -18.3% (849) -5.7% (2,551) (3,038) -16.0% Gross profit % % % Gross margin (%) 13.9% 12.4% 12.3% 12.1% 14.8% EBITDA % % % EBITDA margin (%) 15.8% 15.1% 13.0% 13.5% 16.5% Production and shipments Shipments decreased in 3Q17 compared to 3Q16 and 2Q17, mainly due to the deconsolidation of Colombia, as of June. Excluding this effect, shipments increased in both comparison periods, driven mainly by the higher shipments at the Argentina and Peru operations. Operating result Net sales and cost of goods sold decreased in 3Q17 compared to 3Q16 and 2Q17, due to the deconsolidation of Colombia. Gross margin expanded slightly in the comparison periods. EBITDA and EBITDA margin in 3Q17 accompanied the performances of gross profit and gross margin in the comparisons with 3Q16 and 2Q17. EBITDA (R$ million) and EBITDA Margin (%) 15.1% 10.9% 11.9% 13.0% 15.8% Q16 4Q16 1Q17 2Q17 3Q17 EBITDA EBITDA Margin 9
10 Special Steel BD Special Steel BD Production and shipments Crude steel production and shipments increased in 3Q17 compared to 3Q16 and 2Q17, due to the improvement in the automotive industry in all countries where Gerdau operates and to the improvement in the oil and gas industry in the United States. Operating result 3Q17/3Q16 2 nd Quarter 3Q17/2Q17 Volumes (1,000 tonnes) Production of crude steel % % 1,670 1, % Shipments of steel % % 1,478 1, % Results (R$ million) Net Sales 1,648 1, % 1, % 4,620 5, % Cost of Goods Sold (1,360) (1,203) 13.1% (1,364) -0.3% (3,940) (5,040) -21.8% Gross profit % % % Gross margin (%) 17.5% 13.2% 15.6% 14.7% 8.7% EBITDA % % % EBITDA margin (%) 20.7% 16.8% 18.4% 18.0% 12.2% Net sales increased in 3Q17 compared to 3Q16 and 2Q17, mainly due to higher shipments. 9M17/9M16 Cost of goods sold increased in 3Q17 in relation to 3Q16, mainly explained by the higher shipments. Gross margin expanded in 3Q17 compared to 3Q16 and 2Q17, mainly due to the higher profitability of all units in Brazil and the United States. EBITDA and EBITDA margin in 3Q17 accompanied the performances of gross profit and gross margin in the comparisons with 3Q16 and 2Q17. EBITDA (R$ million) and EBITDA Margin (%) 16.8% 16.8% 14.2% 18.4% % Q16 4Q16 1Q17 2Q17 3Q17 EBITDA EBITDA Margin THE MANAGEMENT This document contains forward-looking statements. These statements are based on estimates, information or methods that may be incorrect or inaccurate and that may not occur. These estimates are also subject to risks, uncertainties, and assumptions that include, among other factors: general economic, political, and commercial conditions in Brazil and in the markets where we operate, as well as existing and future government regulations. Potential investors are cautioned that these forward-looking statements do not constitute guarantees of future performance, given that they involve risks and uncertainties. Gerdau does not undertake and expressly waives any obligation to update any of these forward-looking statements, which are valid only on the date on which they were made. 10
11 GERDAU S.A. CONSOLIDATED BALANCE SHEETS In thousands of Brazilian reais (R$) September 30, December 31, CURRENT ASSETS Cash and cash equivalents Short-term investments Held for Trading Trade accounts receivable - net Inventories Tax credits Income and social contribution taxes recoverable Unrealized gains on financial instruments Other current assets NON-CURRENT ASSETS Tax credits Deferred income taxes Unrealized gains on financial instruments Related parties Judicial deposits Other non-current assets Prepaid pension cost Investments in associates and joint ventures Goodwill Other Intangibles Property, plant and equipment, net TOTAL ASSETS
12 GERDAU S.A. CONSOLIDATED BALANCE SHEETS In thousands of Brazilian reais (R$) September 30, December 31, CURRENT LIABILITIES Trade accounts payable Short-term debt Taxes payable Income and social contribution taxes payable Payroll and related liabilities Employee benefits Environmental liabilities Unrealized losses on financial instruments Other current liabilities NON-CURRENT LIABILITIES Long-term debt Debentures Related parties 41 - Deferred income taxes Provision for tax, civil and labor liabilities Environmental liabilities Employee benefits Obligations with FIDC Unrealized losses on financial instrument Other non-current liabilities EQUITY Capital Treasury stocks (76.489) (98.746) Capital reserves Retained earnings Operations with non-controlling interests ( ) ( ) Other reserves EQUITY ATTRIBUTABLE TO THE EQUITY HOLDERS OF THE PARENT NON-CONTROLLING INTERESTS EQUITY TOTAL LIABILITIES AND EQUITY
13 13
14 GERDAU S.A. CONSOLIDATED STATEMENTS OF CASH FLOWS In thousands of Brazilian reais (R$) For the three-month period ended For the nine-month period ended September 30, September 30, September 30, September 30, Cash flows from operating activities Net income for the period Adjustments to reconcile net income for the period to net cash provided by operating activities: Depreciation and amortization Equity in earnings of unconsolidated companies Exchange variation, net ( ) (80.302) ( ) Loss (Gains) on financial instruments, net (777) Post-employment benefits Long term incentive plan Income and social contribution taxes Gains on disposal of property, plant and equipment, net (3.663) (32.177) (65.119) (34.262) Results in operations with subsidiaries Allowance for doubtful accounts (4.376) (3.133) Provision for tax, labor and civil claims ( ) ( ) Reversal of contingent liabilities, net - - ( ) - Interest income on trading securities (19.320) (31.336) (63.928) (71.971) Interest expense on debt and debentures Reversal of monetary update of contingent liabilities, net - - ( ) - Interest on loans with related parties - (32) (Reversal) Provision for net realizable value adjustment in inventory, net (3.526) (16.410) (25.123) Changes in assets and liabilities Increase in trade accounts receivable ( ) (2.474) ( ) ( ) Decrease (Increase) in inventories ( ) ( ) Increase (Decrease) in trade accounts payable ( ) (74.823) Increase in other receivables (36.119) ( ) ( ) ( ) Increase (Decrease) in other payables ( ) Dividends from associates and joint ventures Purchases of trading securities ( ) ( ) ( ) ( ) Proceeds from maturities and sales of trading securities Cash provided by operating activities Interest paid on loans and financing ( ) ( ) ( ) ( ) Income and social contribution taxes paid (33.418) (40.301) (89.697) ( ) Net cash (used in) provided by operating activities ( ) ( ) Cash flows from investing activities Additions to property, plant and equipment ( ) ( ) ( ) ( ) Proceeds from sales of property, plant and equipment, investments and other intangibles Additions to other intangibles (8.936) (4.985) (25.555) (46.715) Capital increase in joint ventures - - ( ) - Net cash used in investing activities (44.595) ( ) ( ) ( ) Cash flows from financing activities Purchases of Treasury stocks - (95.343) - (95.343) Dividends and interest on capital paid (33.741) (51.652) (36.023) (51.652) Proceeds from loans and financing Repayment of loans and financing ( ) ( ) ( ) ( ) Intercompany loans, net (13.045) (6.774) Net cash used in financing activities ( ) (72.243) ( ) ( ) Exchange variation on cash and cash equivalents ( ) ( ) ( ) (Decrease) Increase in cash and cash equivalents ( ) ( ) ( ) Cash and cash equivalents at beginning of period Cash and cash equivalents at end of period
Highlights of the second quarter of 2017
 Highlights of the second quarter of Consolidated Highlights EBITDA of R$ 1.1 billion in 2Q17, with EBITDA margin expansion in relation to 2Q16 and 1Q17. Selling, general and administrative expenses declined
Highlights of the first quarter of 2018
 Consolidated Highlights Highlights of the first quarter of EBITDA of R$1,484 million in 1Q18, up 74% from 1Q17, with EBITDA margin of 14.3%. Reduction in selling, general and administrative expenses in
Highlights of the fourth quarter of 2017
 Consolidated Highlights Highlights of the fourth quarter of Free cash flow of R$ 1.0 billion in 4Q17, double the amount generated in 3Q17. Selling, general and administrative expenses decrease 26% in 4Q17
Highlights in the Third Quarter of 2018
 Consolidated Highlights Highlights in the Third Quarter of EBITDA of R$ 2,013 million in 3Q18, the highest quarterly result since 2008, with EBITDA margin of 15.7%. Disciplined reduction in selling, general
QUARTERLY RESULTS GERDAU S.A. 4Q18
 QUARTERLY RESULTS GERDAU S.A. 4Q18 4Q18 HIGHLIGHTS São Paulo, February 21, 2019 Gerdau S.A. (B3: GGBR4 / NYSE: GGB) announces its results for the fourth quarter of 2018. The consolidated financial statements
Consolidated Information
 Dear Shareholders: In, Gerdau prioritized positive free cash generation, which amounted to R$2.3 billion. This was achieved, in spite of the challenging scenario in the world steel industry, by reducing
Highlights in the second quarter of 2014
 Mission To create value for our customers, shareholders, employees and communities by operating as a sustainable steel business. Vision To be a global organization and a benchmark in any business we conduct.
Consolidated Information
 , Dear Shareholders: In, Gerdau prioritized free cash generation, which amounted R$3.0 billion, compared to R$1.9 billion in, supported by working capital management, optimization of costs, restriction
GERDAU S.A. and subsidiaries
 GERDAU S.A. and subsidiaries 05/02/2012 Mission To add value for our customers, shareholders, employees and communities by operating as a sustainable steel business. Vision To be a global organization
4Q13 Conference Call Gerdau S.A. Consolidated IFRS
 4Q13 Conference Call Gerdau S.A. Consolidated IFRS André Gerdau Johannpeter President and CEO Andre Pires Vice-president and IR Director February 21st, de 2014 Industry Overview World steel production
1Q14 Conference Call Gerdau S.A. Consolidated IFRS
 1Q14 Conference Call Gerdau S.A. Consolidated IFRS André Gerdau Johannpeter President and CEO Andre Pires de Oliveira Dias Vice-president and IR Director May 7th, de 2014 Industry Overview World steel
3Q13 Conference Call Gerdau S.A. Consolidated IFRS
 3Q13 Conference Call Gerdau S.A. Consolidated IFRS André Gerdau Johannpeter President and CEO Andre Pires Vice-president and IR Director October 31st, de 2013 1 Industry Overview World steel production
Highlights in the Nine Months to September 2008
 Vision To be a global steel company and one of the most profitable in the sector. Mission Gerdau is a company focused on steelmaking, seeking to satisfy the needs of customers and add value for shareholders,
GERDAU S.A. AND SUBSIDIARIES CONSOLIDATED INTERIM FINANCIAL STATEMENTS AS OF JUNE 30, 2008 AND 2007 Prepared in accordance with the International
 CONSOLIDATED INTERIM FINANCIAL STATEMENTS AS OF JUNE 30, 2008 AND 2007 Prepared in accordance with the International Financial Reporting Standards ( IFRS ) as issued by the International Accounting Standards
Investor Presentation
 March, 2010 1 Disclaimer This document can contain statements which constitute forward-looking statements. Such forward-looking statements are dependent on estimates, data or methods that may be incorrect
Investor Presentation
 Investor Presentation 2017 www.gerdau.com 1 Outlook Gerdau Highlights 2 Region / Country (in Mt and %) 2017f 17/16 18/17 World 1,622 7.0% 1.6% European Union 162 2.5% 1.4% Better outlook for steel consumption
3Q12 Conference Call Gerdau S.A. Consolidated IFRS
 3Q12 Conference Call Gerdau S.A. Consolidated IFRS André Gerdau Johannpeter President and CEO Osvaldo B. Schirmer Vice-president and IR Director November 1st, 2012 1 Mining Activities Termination of the
Investor Presentation
 March, 2010 1 Disclaimer This document can contain statements which constitute forward-looking statements. Such forward-looking statements are dependent on estimates, data or methods that may be incorrect
2015 Earnings Conference Call
 2015 Earnings Conference Call André B. Gerdau Johannpeter President & CEO Harley Lorentz Scardoelli CFO Heavy plate rolling mill starts operating in July at the Ouro Branco mill (MG). World steel demand
Usinas Siderúrgicas de Minas Gerais S.A. - USIMINAS Quarterly Information (ITR) at September 30, 2011 and Report on Review of Quarterly Information
 at September 30, 2011 and Report on Review of Quarterly Information") (A free translation of the original in Portuguese) Usinas Siderúrgicas de Minas Gerais S.A. - USIMINAS Quarterly Information (ITR) at September 30, 2011 and Report on Review of Quarterly Information (A
(A free translation of the original in Portuguese) Usinas Siderúrgicas de Minas Gerais S.A. - USIMINAS Quarterly Information (ITR) at September 30, 2011 and Report on Review of Quarterly Information (A
4Q2010 Conference Call Gerdau S.A. Consolidated IFRS
 4Q2010 Conference Call Gerdau S.A. Consolidated IFRS André Gerdau Johannpeter President and CEO Osvaldo B. Schirmer Vice-President and IRO March 3, 2011 1 Global Context 2010 vs. 2009 Growth of 15% in
VOTORANTIM INDUSTRIAL 3Q15 EARNINGS RELEASE
 São Paulo, November 23 rd, 2015. Votorantim Industrial S.A. (VID, Company), a company engaged in the basic building materials (cement, readymix concrete, aggregates and mortar), metals (aluminum, zinc
Investor Presentation
 Investor Presentation 2017 www.gerdau.com 1 Outlook Gerdau Highlights 2 Region / Country (in Mt and %) 2017f 17/16 World 1,622 7.0% European Union 162 2.5% Better outlook for steel consumption NAFTA 139
Investor Presentation. Heavy plate rolling mill starts operating in July at the Ouro Branco mill (MG)
") Investor Presentation Heavy plate rolling mill starts operating in July at the Ouro Branco mill (MG) Agenda Outlook Gerdau Highlights 2 Economic Outlook GDP Growth 2014 2015f 2016f World 3.4% 3.1% 3.4%
Investor Presentation Heavy plate rolling mill starts operating in July at the Ouro Branco mill (MG) Agenda Outlook Gerdau Highlights 2 Economic Outlook GDP Growth 2014 2015f 2016f World 3.4% 3.1% 3.4%
Usinas Siderúrgicas de Minas Gerais S.A. - USIMINAS Quarterly Information (ITR) at June 30, 2017 and report on review of quarterly information
 at June 30, 2017 and report on review of quarterly information") (A free translation of the original in Portuguese) Usinas Siderúrgicas de Minas Gerais S.A. - USIMINAS Quarterly Information (ITR) at June 30, 2017 and report on review of quarterly information Contents
(A free translation of the original in Portuguese) Usinas Siderúrgicas de Minas Gerais S.A. - USIMINAS Quarterly Information (ITR) at June 30, 2017 and report on review of quarterly information Contents
Investor Presentation
 Investor Presentation 2017 www.gerdau.com 1 Outlook Gerdau Highlights 2 Better outlook for steel consumption Region / Country (in mt and %) 2017f 17/16 World 1,535 1.3% European Union 158 0.5% NAFTA 135
Investor Presentation
 Investor Presentation 2017 www.gerdau.com 1 Outlook Gerdau Highlights 2 Better outlook for steel consumption Region / Country (in mt and %) 2017f 17/16 World 1,535 1.3% European Union 158 0.5% NAFTA 135
Investor Presentation 2017
 Investor Presentation 2017 Gerdau steel in the world www.gerdau.com 1 Outlook Gerdau Highlights 2 Economic outlook GDP Growth 2016 2017f 2018f World 3.1% 3.5% 3.6% US 1.6% 2.3% 2.5% Brazil -3.6% 0.5% 2.5%
Investor Presentation. February 2008
 Investor Presentation February 2008 1 1 Highlights Among the most competitive steel companies in the world Strong low cost structure as a result of diversified production processes and multiple raw material
Usinas Siderúrgicas de Minas Gerais S.A. - USIMINAS Quarterly Information (ITR) at September 30, 2017 and report on review of quarterly information
 at September 30, 2017 and report on review of quarterly information") (A free translation of the original in Portuguese) Usinas Siderúrgicas de Minas Gerais S.A. - USIMINAS Quarterly Information (ITR) at September 30, 2017 and report on review of quarterly information Contents
(A free translation of the original in Portuguese) Usinas Siderúrgicas de Minas Gerais S.A. - USIMINAS Quarterly Information (ITR) at September 30, 2017 and report on review of quarterly information Contents
Exports Exports from Brazil totaled 1.4 million metric tons in the first half of This volume generated revenues of US$ million.
 Porto Alegre, August 2, 06 GERDAU S.A. CONSOLIDATED First Half 06 Results Brazilian Corporate Law Highlights Net Profit The consolidated net profit for the first six months of 06 reached R$ 1.8 billion,
Conference Call on 2 nd Quarter 2007 Results GERDAU S.A. CONSOLIDATED
 Conference Call on 2 nd Quarter 2007 Results GERDAU S.A. CONSOLIDATED André Gerdau Johannpeter President & CEO Osvaldo B. Schirmer Executive VP & CFO Director of Investor Relations August 8 2007 Steel
TUPY. Global reference in castings
 TUPY. Global reference in castings Quarterly Financial Report September 30, 2017 Release Financial Information Explanatory Notes Independent auditor s report www.tupy.com.br TUPY Worldwide reference in
Ternium Announces Fourth Quarter and Full Year 2012 Results
 Sebastián Martí Ternium - Investor Relations +1 (866) 890 0443 +54 (11) 4018 2389 www.ternium.com Ternium Announces Fourth Quarter and Full Year 2012 Results Luxembourg, February 20, 2013 Ternium S.A.
9 Months Months ,257 7, Sales (1,000 t) ,7%
 ,7%") Porto Alegre, November 8 th, 05 GERDAU S.A. CONSOLIDATED 05 First Nine Months Results Brazilian Corporate Law Highlights Gross revenue Consolidated gross revenue in the first nine months of 05 reached
Porto Alegre, November 8 th, 05 GERDAU S.A. CONSOLIDATED 05 First Nine Months Results Brazilian Corporate Law Highlights Gross revenue Consolidated gross revenue in the first nine months of 05 reached
2017-4Q17 E A R N I N G S R E L E A S E
 E A R N I N G S R E L E A S E 2017-4Q17 January 01, 2017 December 31, 2017 SONDA S.A. and subsidiaries announce their consolidated financial results for the period from January 01 to December 31, 2017.
VOTORANTIM INDUSTRIAL 2013 EARNINGS RELEASE
 São Paulo, March 11 th, 2014. Votorantim Industrial S.A. (VID), a company engaged in heavy building materials (cement, ready-mix concrete, aggregates and mortar), metals (aluminum, zinc and nickel), mining
Usinas Siderúrgicas de Minas Gerais S.A. - USIMINAS Quarterly Information (ITR) at March 31, 2017 and report on review of quarterly information
 at March 31, 2017 and report on review of quarterly information") Usinas Siderúrgicas de Minas Gerais S.A. - USIMINAS Quarterly Information (ITR) at March 31, 2017 and report on review of quarterly information Contents Report on review of quarterly information - ITR
Usinas Siderúrgicas de Minas Gerais S.A. - USIMINAS Quarterly Information (ITR) at March 31, 2017 and report on review of quarterly information Contents Report on review of quarterly information - ITR
SECURITIES AND EXCHANGE COMMISSION FORM 6-K. Filing Date: Period of Report: SEC Accession No
 SECURITIES AND EXCHANGE COMMISSION FORM 6-K Current report of foreign issuer pursuant to Rules 13a-16 and 15d-16 Amendments Filing Date: 2017-05-04 Period of Report: 2017-05-04 SEC Accession No. 0001104659-17-029863
RELEVANT INFORMATION FOURTH QUARTER 2001
 RELEVANT INFORMATION FOURTH QUARTER 2001 Dear Shareholders, The end of fiscal year 2001 has been marked by two important investments which represent yet another step towards growth for the Gerdau Group:
Quarterly Information 09/30/2015 LOJAS RENNER S/A Version: 1. Summary
 Summary Company Date Composition of Capital stock 1 Dividends declared and/or paid out and after quarter 2 Individual Statements Balance Sheets Assets 3 Balance Sheets Liabilities and Shareholders Equity
Interim Financial Statements June 30, 2018
 Interim Financial Statements June 30, 2018 BRGAAP in R$ (English) Vale S.A. Interim Financial Statements Contents Page Report on the review of the quarterly information - ITR 3 and Parent Company Income
GERDAU S.A. Consolidated Information
 Highlights 1 st semester 2008 (International accounting standards, according to the declarations issued by the International Accounting Standards Board IASB) Gross Revenue Consolidated gross revenue in
Celulose Irani S.A. Quarterly Information (ITR) at September 30, 2015 and report on review of quarterly information
 at September 30, 2015 and report on review of quarterly information") Celulose Irani S.A. Quarterly Information (ITR) at September 30, 2015 and report on review of quarterly information IRANI915GHM.DOCX / IRANI915GHM.XLSX Report on review of quarterly information To the
Celulose Irani S.A. Quarterly Information (ITR) at September 30, 2015 and report on review of quarterly information IRANI915GHM.DOCX / IRANI915GHM.XLSX Report on review of quarterly information To the
Natura Cosméticos S.A.
 (Convenience Translation into English from the Original Previously Issued in Portuguese) Natura Cosméticos S.A. Individual and Consolidated Financial Statements for the Year Ended December 31, 2011 and
12M11 4Q11. Earnings Release. Sonda S.A. SONDA S.A. 1
 12M11 4Q11 Earnings Release Sonda S.A. 1 EARNINGS RELEASE January 01, 2011 December 31, 2011 (Santiago Stock Exchange: SONDA), the leading Latin American owned private-sector IT Services provider, announces
Investor Presentation. Heavy plate rolling mill starts operating in July at the Ouro Branco mill (MG)
") Investor Presentation Heavy plate rolling mill starts operating in July at the Ouro Branco mill (MG) Agenda Outlook Gerdau Highlights 2 Economic Outlook GDP Growth 2014 2015f 2016f World 3.4% 3.1% 3.4%
Investor Presentation Heavy plate rolling mill starts operating in July at the Ouro Branco mill (MG) Agenda Outlook Gerdau Highlights 2 Economic Outlook GDP Growth 2014 2015f 2016f World 3.4% 3.1% 3.4%
Itaú Unibanco Holding S.A.
 2nd Quarter 2009 The table below shows selected information and performance indicators of (*) The result and balances of the second quarter of 2008 and from the first half of 2008, correspond to the sum
Usinas Siderúrgicas de Minas Gerais S.A. - USIMINAS Quarterly Information (ITR) at March 31, 2018 and report on review of quarterly information
 at March 31, 2018 and report on review of quarterly information") (A free translation of the original in Portuguese) Usinas Siderúrgicas de Minas Gerais S.A. - USIMINAS Quarterly Information (ITR) at March 31, 2018 and report on review of quarterly information Report
(A free translation of the original in Portuguese) Usinas Siderúrgicas de Minas Gerais S.A. - USIMINAS Quarterly Information (ITR) at March 31, 2018 and report on review of quarterly information Report
Ternium Announces Third Quarter and First Nine Months of 2018 Results
 Sebastián Martí Ternium - Investor Relations +1 (866) 890 0443 +54 (11) 4018 8389 www.ternium.com Ternium Announces Third Quarter and First Nine Months of 2018 Results Luxembourg, October 30, 2018 Ternium
Investor Presentation. Heavy plate rolling mill starts operating in July at the Ouro Branco mill (MG)
") Investor Presentation Heavy plate rolling mill starts operating in July at the Ouro Branco mill (MG) Agenda Outlook Gerdau Highlights 2 Economic outlook GDP Growth 2014 2015f 2016f World 3.4% 3.1% 3.2%
Investor Presentation Heavy plate rolling mill starts operating in July at the Ouro Branco mill (MG) Agenda Outlook Gerdau Highlights 2 Economic outlook GDP Growth 2014 2015f 2016f World 3.4% 3.1% 3.2%
Blau reaches LTM Net Revenues of R$ 677 million, the highest of its history
 Blau reaches Net Revenues of R$ 677 million, the highest of its history São Paulo, November 09 th, 2018 - Blau Farmacêutica, one of the main Brazilian pharmaceutical companies in the non-retail segment,
Usinas Siderúrgicas de Minas Gerais S.A. - USIMINAS Quarterly Information (ITR) at June 30, 2018 and report on review of quarterly information
 at June 30, 2018 and report on review of quarterly information") (A free translation of the original in Portuguese) Usinas Siderúrgicas de Minas Gerais S.A. - USIMINAS Quarterly Information (ITR) at June 30, 2018 and report on review of quarterly information Report
(A free translation of the original in Portuguese) Usinas Siderúrgicas de Minas Gerais S.A. - USIMINAS Quarterly Information (ITR) at June 30, 2018 and report on review of quarterly information Report
Usinas Siderúrgicas de Minas Gerais S.A. - USIMINAS Quarterly Information (ITR) at September 30, 2018 and report on review of quarterly information
 at September 30, 2018 and report on review of quarterly information") Usinas Siderúrgicas de Minas Gerais S.A. - USIMINAS Quarterly Information (ITR) at September 30, 2018 and report on review of quarterly information Report on review of quarterly information To the Board
Usinas Siderúrgicas de Minas Gerais S.A. - USIMINAS Quarterly Information (ITR) at September 30, 2018 and report on review of quarterly information Report on review of quarterly information To the Board
Interim Financial Information (ITR) MRV Engenharia e Participações S.A.
 MRV Engenharia e Participações S.A.") Interim Financial Information (ITR) MRV Engenharia e Participações S.A. Individual and Consolidated Interim Financial Information for the quarter Ended June 30, 2015 and Report on Review of Interim Financial
Interim Financial Information (ITR) MRV Engenharia e Participações S.A. Individual and Consolidated Interim Financial Information for the quarter Ended June 30, 2015 and Report on Review of Interim Financial
E A R N I N G S R E L E A S E P R E S E N T A T I O N 1 Q 1 6 A P R I L 27,
 E A R N I N G S R E L E A S E P R E S E N T A T I O N Q 6 A P R I L 27, 2 0 6 Q 6 H I G H L I G H T S Consolidated revenues total US$295.8 million, EBITDA US$40.4 million and Net Income attributable to
EARNINGS RELEASE 1Q18 RESULTADOS
 EARNINGS RELEASE 1Q18 CONFERENCE CALL IN ENGLISH May 11 th, 2018 - Friday 10:00 a.m. (US ET) 11:00 a.m. (BRT) / 3:00 p.m. (London) Connecting Number: +1 (412) 317 6776 Code: Valid Webcast: click here Valid
3Q17 and 9M17 Results NOVEMBER 2017
 3Q17 and 9M17 Results NOVEMBER 2017 Brazilian Fertilizer Market The Company & Financial Highlights Outlook In thousands of metric tons BRAZILIAN FERTILIZER MARKET - DELIVERIES +9.8% +1.3% +6.7% +3.3% 22,294
FLEX RECONCILIATION OF GAAP TO NON-GAAP FINANCIAL MEASURES (In thousands, except per share amounts)
") FLEX RECONCILIATION OF GAAP TO NON-GAAP FINANCIAL MEASURES (In thousands, except per share amounts) Q1 FY18 Q2 FY18 Q3 FY18 Q4 FY18 Q1 FY19 Q2 FY19 GAAP gross profit $ 406,932 6.8% $ 393,325 6.3% $ 446,328
FLEX RECONCILIATION OF GAAP TO NON-GAAP FINANCIAL MEASURES (In thousands, except per share amounts) Q1 FY18 Q2 FY18 Q3 FY18 Q4 FY18 Q1 FY19 Q2 FY19 GAAP gross profit $ 406,932 6.8% $ 393,325 6.3% $ 446,328
financial report 1Q14 Management Discussion & Analysis and Complete Financial Statements
 financial report 1Q14 Management Discussion & Analysis and Complete Financial Statements Contents Management Discussion & Analysis 3 Executive Summary 5 Analysis of Net Income 15 Managerial Financial Margin
CAMIL ANNOUNCES ITS THIRD QUARTER RESULTS (3Q17) The Company reached an EBITDA of R$128.9 million with EBITDA margin of 11.
 The Company reached an EBITDA of R$128.9 million with EBITDA margin of 11.") CAMIL ANNOUNCES ITS THIRD QUARTER RESULTS (3Q17) The Company reached an EBITDA of R$128.9 million with EBITDA margin of 11.1% in 3Q17 São Paulo, January 11, 2018 Camil Alimentos S.A. ("Company" or "Camil")
CAMIL ANNOUNCES ITS THIRD QUARTER RESULTS (3Q17) The Company reached an EBITDA of R$128.9 million with EBITDA margin of 11.1% in 3Q17 São Paulo, January 11, 2018 Camil Alimentos S.A. ("Company" or "Camil")
1 st Quarter Executive Summary. Itaú Unibanco Holding S.A.
 1 st Quarter 2010 Executive Summary Holding S.A. Information and financial indicators of Holding S.A. from the first quarter of 2010 are presented below. (except where indicated) Highlights Statements
Celulose Irani S.A. Quarterly Information (ITR) at June 30, 2015 and report on review of quarterly information
 at June 30, 2015 and report on review of quarterly information") Celulose Irani S.A. Quarterly Information (ITR) at June 30, 2015 and report on review of quarterly information / IRANI615IFN.XLSX Report on review of quarterly information To the Board of Directors and
Celulose Irani S.A. Quarterly Information (ITR) at June 30, 2015 and report on review of quarterly information / IRANI615IFN.XLSX Report on review of quarterly information To the Board of Directors and
(Translation of the original in Portuguese)
") (Translation of the original in Portuguese) THE REGISTRATION WITH CVM DOES NOT IMPLY ANY EVALUATION OF THE COMPANY AND ITS MANAGERS ARE RESPONSIBLE FOR THE VERACITY OF THE INFORMATION PROVIDED. 01.01 IDENTIFICATION
(Translation of the original in Portuguese) THE REGISTRATION WITH CVM DOES NOT IMPLY ANY EVALUATION OF THE COMPANY AND ITS MANAGERS ARE RESPONSIBLE FOR THE VERACITY OF THE INFORMATION PROVIDED. 01.01 IDENTIFICATION
Consolidated Balance Sheet - 1/2
 Consolidated Balance Sheet March 31, 212 ASSETS CURRENT ASSETS: Cash and cash equivalents (Notes 8 and 19) Time deposits over three months (Note 19) Receivables (Note 19): Trade notes (Note 11) Trade accounts
11-Year Consolidated Financial Highlights
 11-Year Consolidated Financial Highlights As of March 31, 2017 2007.3 2008.3 2009.3 2010.3 Net Sales ( million) 1,376,958 1,487,496 1,660,162 1,415,718 Operating Profit ( million) 162,315 70,048 65,204
Positive Free Cash Flow of R$39 million in 3Q16
 3Q16 Earnings Release Positive Free Cash Flow of R$39 million in 3Q16 São Paulo, November 10, 2016 Marfrig Global Foods S.A. Marfrig (BM&FBovespa Novo Mercado: MRFG3 and Level 1 ADR: MRTTY) announces today
Adjusted EBITDA 1 of R$ 847 million is an industry highlight with operating performance improvement and ROIC of 10.6%
 1Q17 Results Adjusted EBITDA 1 of R$ 847 million is an industry highlight with operating performance improvement and ROIC of 10.6% São Paulo, May 3, 2017. Suzano Papel e Celulose (Bovespa: SUZB5), one
Report on review of parent company and consolidated condensed interim financial statements
 (A free translation of the original in Portuguese) Report on review of parent company and consolidated condensed interim financial statements To the Board of Directors and Stockholders Votorantim Cimentos
Blau Farmacêutica reaches Net Revenues of R$334 million and EBITDA of R$79 million on the first half of 2018
 Blau Farmacêutica reaches Net Revenues of R$334 million and EBITDA of R$79 million on the first half of 2018 São Paulo, August 13 th, 2018 - Blau Farmacêutica, one of the main Brazilian pharmaceutical
Bekaert delivers vigorous growth, record results and continuing strong dividend
 Press release regulated information 13 March, 2009 Press Katelijn Bohez T +32 56 23 05 71 Investor Relations Jacques Anckaert T +32 56 23 05 72 Annual results 2008 Bekaert delivers Highlights 1 Bekaert
FLEX RECONCILIATION OF GAAP TO NON-GAAP FINANCIAL MEASURES
 FLEX RECONCILIATION OF GAAP TO NON-GAAP FINANCIAL MEASURES (In thousands, except per share amounts) Q1 FY17 Q2 FY17 Q3 FY17 Q4 FY17 Q1 FY18 Q2 FY18 GAAP gross profit $ 405,995 6.9% $ 313,691 5.2% $ 416,455
executive summary Itaú Unibanco Holding S.A. 4th quarter of 2012 Management Discussion & Analysis
 executive summary 4th quarter of 2012 Information and financial indicators of (Itaú Unibanco) are presented below: Highlights (except where indicated) 4Q12 3Q12 4Q11 2012 2011 Statement of Income Recurring
Tenaris Announces 2018 First Quarter Results
 Giovanni Sardagna Tenaris 1-888-300-5432 www.tenaris.com Tenaris Announces 2018 First Quarter Results The financial and operational information contained in this press release is based on unaudited consolidated
3Q08 EARNINGS RELEASE
 3Q08 EARNINGS RELEASE SONDA REPORTS A 26.9% EBITDA GROWTH IN 3Q08 Santiago, Chile, October 28, 2008 SONDA S.A. (Santiago Stock Exchange: SONDA), the leading Latin American owned private-sector IT Services
3Q18 Earnings Release
 3Q18 Earnings Release Barretos, November 6, 2018 Minerva S.A. (BM&FBOVESPA: BEEF3 OTC - Nasdaq International: MRVSY), the South American leader in the export of fresh beef and cattle byproducts, which
(Convenience Translation into English from the Original Previously Issued in Portuguese)
") (Convenience Translation into English from the Original Previously Issued in Portuguese) INDEPENDENT ACCOUNTANTS REVIEW REPORT To the Shareholders and Management of Gerdau S.A. Rio de Janeiro RJ 1. We
(Convenience Translation into English from the Original Previously Issued in Portuguese) INDEPENDENT ACCOUNTANTS REVIEW REPORT To the Shareholders and Management of Gerdau S.A. Rio de Janeiro RJ 1. We
financial report September 30, 2013
 financial report September 30, 2013 Itaú Unibanco Holding S.A. Management Discussion & Analysis and Complete Financial Statements Contents Management Discussion & Analysis 3 Executive Summary 3 Analysis
Consolidated Balance Sheet - 1/2
 Consolidated Balance Sheet March 31, ASSETS CURRENT ASSETS (Note 3): Cash and cash equivalents (Notes 9 and 21) Time deposits over three months (Note 21) Receivables (Note 21): Trade notes (Note 13) Trade
financial report September 30, 2012 Itaú Unibanco Holding S.A. Management Discussion & Analysis and Complete Financial Statements
 financial report September 30, 2012 Itaú Unibanco Holding S.A. Management Discussion & Analysis and Complete Financial Statements Contents Management Discussion & Analysis 3 Executive Summary 3 Analysis
ITR - Quarterly Financial Information Alpargatas S.A. September 30, 2013
 ITR - Quarterly Financial Information Alpargatas S.A. September 30, 2013 A free translation from Portuguese into English of Independent Auditor s Review Report on Individual Interim Financial Information
4Q08 EARNINGS RELEASE
 4Q08 EARNINGS RELEASE SONDA REPORTS US$115.3 MILLION IN EBITDA AND US$671.3 MILLION IN REVENUES FOR YEAR 2008 Santiago, Chile, January 27, 2009 SONDA S.A. (Santiago Stock Exchange: SONDA), the leading
3Q17 Earnings Release
 São Paulo, December 22, 2017 Earnings Release Companhia Siderúrgica Nacional (CSN) (B3 S.A. - BRASIL BOLSA BALCÃO : CSNA3) (NYSE: SID) discloses results for the third quarter of 2017 (). The information
Ternium Announces Third Quarter and First Nine Months of 2017 Results
 Sebastián Martí Ternium - Investor Relations +1 (866) 890 0443 +54 (11) 4018 8389 www.ternium.com Ternium Announces Third Quarter and First Nine Months of 2017 Results Luxembourg, October 31, 2017 Ternium
financial report December 31, 2012 Itaú Unibanco Holding S.A. Management Discussion & Analysis and Complete Financial Statements
 financial report December 31, 2012 Itaú Unibanco Holding S.A. Management Discussion & Analysis and Complete Financial Statements Contents Management Discussion & Analysis 3 Executive Summary 3 Analysis
Abril S.A. and subsidiaries
 (A free translation of the original in Portuguese) Abril S.A. Abril S.A. and subsidiaries FINANCIAL STATEMENTS at December 31, 2012 and Independent Auditor's Report (A free translation of the original
Ternium Announces Third Quarter and First Nine Months of 2013 Results
 Sebastián Martí Ternium - Investor Relations +1 (866) 890 0443 +54 (11) 4018 2389 www.ternium.com Ternium Announces Third Quarter and First Nine Months of 2013 Results Luxembourg, November 5, 2013 Ternium
Financial Review NINE MONTHS / THIRD QUARTER. 29 October Rothausstrasse Muttenz Switzerland CLARIANT INTERNATIONAL LTD
 Financial Review NINE MONTHS / THIRD QUARTER CLARIANT INTERNATIONAL LTD Rothausstrasse 61 4132 Muttenz Switzerland Page 1 of 21 Key Financial Group Figures Continuing operations: Nine Months Third Quarter
Positive free cash flow of R$68 million in 4Q16
 Positive free cash flow of R$68 million in São Paulo, February 23, 2017 Marfrig Global Foods S.A. Marfrig (BM&FBOVESPA Novo Mercado: MRFG3 and Level 1 ADR: MRTTY) announces today its results for the fourth
Data presented in this document is based on Brazilian Corporate Law.
 2004 Fourth Quarter Results Gerdau S.A. Consolidated Highlights Data presented in this document is based on Brazilian Corporate Law. Net Profit 2004 presented a consolidated net profit of R$ 3.2 billion,
Plascar Participações Industriais S.A. Quarterly Information (ITR) at September 30, 2013 and report on review of quarterly information
 at September 30, 2013 and report on review of quarterly information") (A free translation of the original in Portuguese) Plascar Participações Industriais S.A. Quarterly Information (ITR) at September 30, 2013 and report on review of quarterly information (A free translation
(A free translation of the original in Portuguese) Plascar Participações Industriais S.A. Quarterly Information (ITR) at September 30, 2013 and report on review of quarterly information (A free translation
3Q16 EARNINGS RELEASE. Viver Announces its Results for the Third Quarter of Highlights
 3Q16 EARNINGS RELEASE Conference Call Wednesday, Nov 16, 2016 Portuguese (With simultaneous translation into English) 10:00 a.m. (Brasilia) 09:00 a.m. (New York) Phone: +55 (11) 3728-5971 +55 (11) 3127-4971
Raízen Combustíveis S.A.
 Consolidated and condensed balance sheet Assets 09.30.2014 03.31.2014 Liabilities and equity 09.30.2014 03.31.2014 Current assets Current liabilities Cash and cash equivalents 198,987 566,606 Loans and
Unaudited Pro-forma Combined Financial Statements Raízen Energia Participações S.A
 Pro-forma Combined Financial Statements Pro-forma Combined Financial Statements Contents Basis of preparation and presentation of the pro-forma combined... 3 Pro-forma Combined Statements of Financial
GEOPARK LIMITED CONSOLIDATED FINANCIAL STATEMENTS. As of and for the year ended 31 December 2017
 CONSOLIDATED FINANCIAL STATEMENTS As of and for the year ended 31 December 2017 Contents 2 Report of Independent Registered Public Accounting Firm 3 Consolidated Statement of Income 4 Consolidated Statement
3Q17 Results. CONFERENCE CALL ON RESULTS October 25, :00 p.m. (Brazil) / 11:00 a.m. (US-EST)
 / 11:00 a.m. (US-EST)") 3Q17 Results CONFERENCE CALL ON RESULTS October 25, 2017 1:00 p.m. (Brazil) / 11:00 a.m. (US-EST) Access in Portuguese: +55 11 3127-4971 +55 11 3728-5971 Access in English: +1 516-300-1066 Password: Lojas
3Q17 Results CONFERENCE CALL ON RESULTS October 25, 2017 1:00 p.m. (Brazil) / 11:00 a.m. (US-EST) Access in Portuguese: +55 11 3127-4971 +55 11 3728-5971 Access in English: +1 516-300-1066 Password: Lojas
Individual and Consolidated Financial Statements for the Year Ended December 31, 2012 and Report of Independent Auditors on Financial Statements
 Individual and Consolidated Financial Statements for the Year Ended December 31, 2012 and Report of Independent Auditors on Financial Statements Natura Cosméticos S.A. December 31, 2012 Individual and
Management s Discussion and Analysis
 FIRST QUARTERLY REPORT FOR THE THREE MONTHS ENDED MARCH 31, 2018 Management s Discussion and Analysis of Financial Conditions and Results of Operations For the three months ended March 31, 2018 All figures
management discussion analysis Itaú Unibanco Holding S.A.
 management discussion analysis 3 rd quarter of 2013 (This page was left in blank intentionally) 4 Executive Summary Information and financial indicators of (Itaú Unibanco) are presented below. Highlights
Basics of IFRS Mining accounting throughout the Americas. Presenters James Lusby PwC Toronto Edmundo Garcia PwC Mexico
 Basics of IFRS Mining accounting throughout the Americas Presenters James Lusby PwC Toronto Edmundo Garcia PwC Mexico IFRS throughout the Americas Country Year GAAP Canada 2011 IFRS (IASB) US! US GAAP