Merrill Lynch Emerging Companies Conference
|
|
|
- Gavin Briggs
- 5 years ago
- Views:
Transcription
1 Tassal Group Limited Merrill Lynch Emerging Companies Conference (Sydney) 19 th June 2009 Presenter: Mark Ryan CEO and Managing Director Tassal Group Limited 1
2 Agenda Tassal Overview Profit Update Key Highlights Strategy How Are We Tracking? Financial Performance Hatchery Marine Processing Branding Revenue Risk Management ESG Competitive Advantages Conclusions Appendices 2
3 Overview Tassal Group Limited in FY2009 Australia s leading aquaculture company Benefiting from strong domestic and global demand Well positioned to escalate key export market penetration Leading branding Delivering strong growth in financial performance and increased dividends d d for shareholders Continued reduction in cost of production and automated processing driving transition to global best practice Significant capital investment undertaken targeted at growth, innovation, efficiency and risk mitigation Low gearing profile and ample debt facility head room Balance sheet well capitalised and positioned to support continued growth 3
4 Profit Update Tassal expects to report underlying FY2009 NPAT in the range of $27.0m - $28.0m (statutory NPAT [i.e. after inclusion of AASB 141 Agriculture uplift] expected to be above $30.0m) Represents strong underlying earnings growth of 27% - 32% for FY2009 Achieved significant sales growth Absorbed significant feed cost and marine infrastructure depreciation increases Tassal has made a number of longer term business decisions in FY2009: Strategic decision to sacrifice short term profit for longer term gain by leaving fish in the water longer to achieve optimal weight which will deliver benefits in FY2010 and beyond we currently could be profitably exporting more, however pulling fish forward now will compromise both growth and cost in FY2010 Strategy of investing in and growing g retail channel has delivered strong sales growth, however terms of trade and use of promotions/rebates has impacted overall contribution margin Strategy of continuing to incrementally invest in marketing to sustain underlying domestic market growth 4
5 Profit Update Tassal continues to experience strong sales momentum (>30% in domestic market volumes) despite challenging economic environment Tassal is an agricultural stock with agricultural risk. Our risk mitigation strategies are robust, yet medium term operational demands often must be balanced against short term financial outcomes 5
6 Key Highlights Forecasting strong sales growth overall sales volume increasing by 21% with domestic market sales volume increasing 31% H overall sales volume increasing 26% [H %], with domestic market sales volume increasing 32% [H %] Changing g sales mix FY2009 has seen strong gg growth in our retail lines (i.e. smoked salmon and fillets and portions), particularly the supermarket business Maintained premium pricing model maintained domestic market prices in FY2009 and we have seen recent significant export price increases, offering incremental FY2010 margin opportunities Investment in marketing we have a robust marketing strategy and plan in place and will continue to invest around 3% - 5% of our domestic market sales in marketing in line with food and beverage peers target to increase domestic per capita consumption from 1.2kg to 1.8kg by FY2015 Overall cost reduction focus we remain on track to achieve global best practice from a cost of growing and cost of processing perspective Strong balance sheet gearing circa 30%, at bottom of 30% - 35% target range and operationally cash flow positive in FY2009 Investing for future - Continued accelerated capital investment focused on growth, efficiency and risk mitigation 6
7 Strategic Plan FY2015 Strategic Plan FY2015 in place we clearly understand where Tassal is heading there is a plan in place and we are achieving the hurdles set Strategy - Global cost competitiveness in both aquaculture production and processing, together with achieving premium returns from our sales and marketing initiatives FY2009 Focus to build on our FY2008 achievements to drive further substantial increases in both financial and operational performance in the short term, and ensure that the appropriate infrastructure from a capital, financial and operational perspective is in place to underwrite the delivery of the Strategic Plan FY2015 FY2009 Priority Initiatives Hatchery Initiatives i i larger and earlier introduced d smolt underwrites fish size growth targets Marine Initiatives increased fish size underscores profit growth Processing Initiatives further processing innovation and efficiencies continue to flow Branding Initiatives Tassal Pure Tasmania the consumer choice Revenue Initiatives opening the gateway to new market and product development horizons Risk Management Initiatives enhanced company-wide risk management drives business sustainability Environmental Management Initiatives sustainable environmental management a key accountability across the business 7
8 Strategic Plan FY2015 Key Plan Metrics Now FY2015 Harvest tonnes Circa 18,000T Circa 30,000T Harvest size 4.1Kg 4.3 Kg 4.8Kg Kg Year class 82% - 84% 88% - 90% survival % FCR* Smolt input nos. 5.5m 6.8m 7.0m Domestic market CAGR 10% 10% Export market Circa 10% total Circa 10% total sales tonnage sales tonnage Pricing assumption Flat Flat * FCR = Number of kilograms of fish feed to deliver 1 kilogram of fish weight. The bridge builders 8
9 How are we tracking? 9
10 Financial Performance Sector leading Return on Equity 16.0% Return on Equ ity (%) 14.0% 12.0% 10.0% 8.0% 6.0% 4.0% 2.0% 0.0% % CAGR FY2004-FY2008 FY2008 impacted by timing of capital raising Market leading result in Agribusiness sector Tassal Peer Average Peer Group: AWB, ABB, Graincorp, Ridley and Futuris 10
11 Financial Performance Strong growth in EPS % +22% EPS (c) % +70% EPS CAGR FY of 42.8% v peer* average of % Tassal * Peer Group: AWB, ABB, Graincorp, Ridley and Futuris 11
12 Hatchery Hatchery Initiatives larger and earlier introduced smolt underwrites fish size growth targets Tassal is constructing a state-of-the-art freshwater hatchery to mitigate risk and underwrite significant improvement in smolt size and an accelerated smolt input regime Summary of the new Hatchery: Cost $18.5 million for FY2009 Hatchery capacity = 4 million smolts Ready for egg incubation in June 2009 First smolt output March 2010 Benefits: Flexibility and growth allows Tassal to have the ability to input up to 9 million smolt Global best practice facility employing global best practice biosecurity and environmental measures Full recirculation allowing minimum use of fresh water resources Limited use of fresh water = ability to cool water in summer = ability to carry more biomass over summer = earlier smolt inputs at a bigger size Closeness to marine sites = improving quality of smolts 12


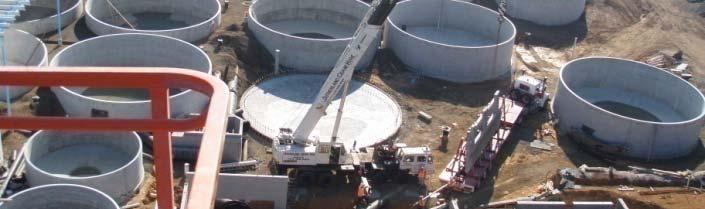
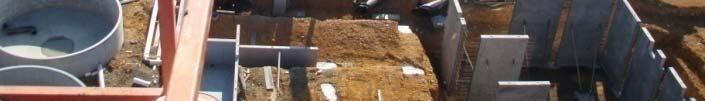
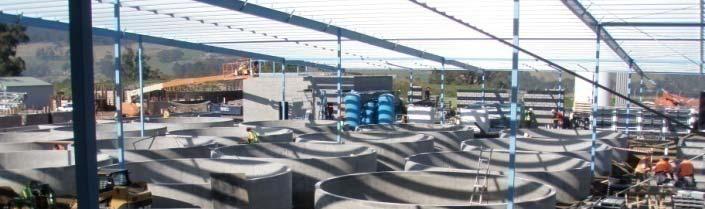
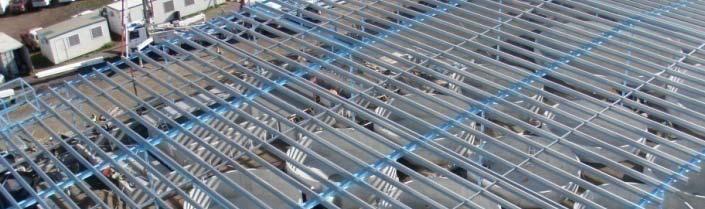

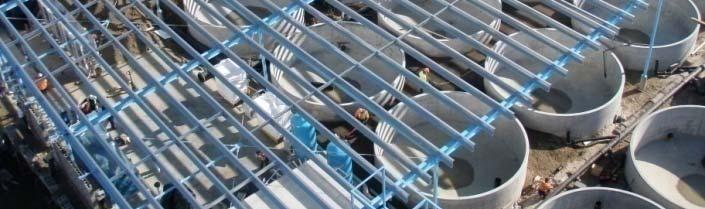
13 Hatchery Huonville Hatchery site - April
14 Marine Marine Initiatives increased fish size underscores profit growth Underpinning FY2009..continued infrastructure investment * *Paybacks 0 2 years (refer appendices) Growth Go targeting g 4.3kg hog for 2007 YC (4.9% improvement e on 2006 YC) Automatic feeders (2 more to be put to sea) Lighting of fish pens Underwater net cleaners (3 to be utilised) Harvest vessels Diet formulations Survival targeting 84% survival for 2007 YC (1% improvement on 2006 YC) Harvest vessels Diet formulations Underwater net cleaners FCR improved FCR's Stable FCR performance in 2007YC (Focus is on fish growth delivery) Automatic Feeders Diet formulations 14


15 Automatic Feeders 15
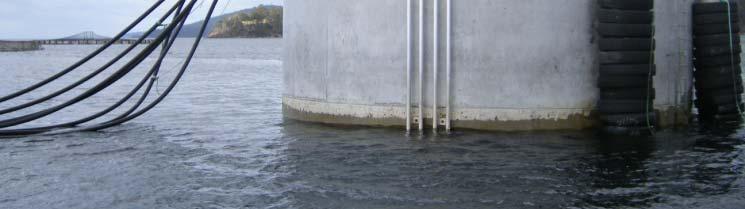
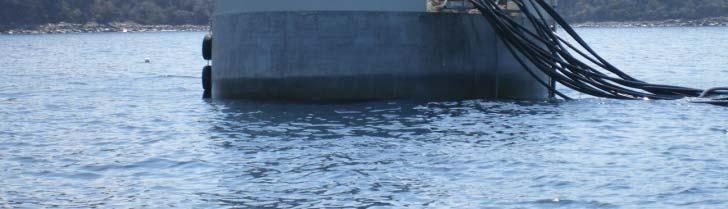
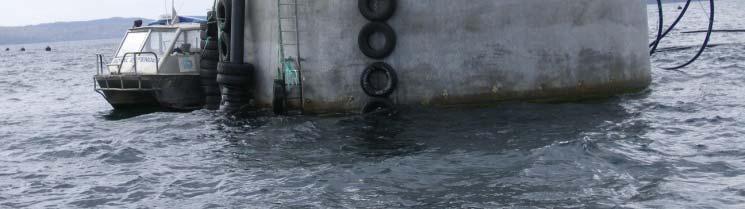
16 Harvest Vessel Tassal 1 16
17 Marine Capital Expenditure Expansion Initiatives Additional marine capital expenditure on pens, moorings and nets will be incurred during FY2009 to allow for the growth in fish numbers and biomass Diet Formulation Initiatives Skretting and Tassal continue to use and research a number of diet formulations Dual feed supply arrangements also being investigated t to maximise i diet formulation alternative options There is a high degree of substitutability of raw materials allowing Tassal to be flexible Year Class Fish Meal % Other Meal % Fish Oil % Other Oil % Feed prices have increased over FY2008 and FY Tassal has absorbed these - now seeing a stabilisation 17
18 Marine Selective Breeding Potential for significant gains from the selective breeding program are excellent growth, survival, fish quality and AGD. Around 9% predicted gain in the growth from selectively bred fish for the first commercially produced stock Strong evidence to support the reduction of bathing for AGD through increasing the bathing interval at least three bathes less for fish during their life cycle (single bath costs $0.08 / kg, so potential savings $0.24 / kg) Significant genetic diversity exists in the Tasmanian Salmon Industry population to allow us to breed from fish that will tolerate high water temperatures which will allow us to embrace climate change CSIRO describe the program as a global best practice breeding program utilising successes from terrestrial breeding and other global salmon breeding programs We have completed one full cycle of breeding now we can introduce some of the program s stock into our 2009 Year Class (to be harvested FY2010) 18
19 Global Salmon Farming How we compare from a cost perspective e % cost of smolt is comparable % of feed v total cost is less than Norway, comparable to Chile Tassal 07 YC Norway Chile UK Cost of smolt 11% 11% 11% 16% Cost of feed 58% 66% 60% 55% Marine labour 10% 7% 4% 6% Marine overheads 13% 12% 19% 17% Depreciation 8% 4% 6% 6% Total cost at the wharf 100% 100% 100% 100% Harvest cost per kg at the wharf $5.00 $3.50 $4-$4.50 $4.35 Tassal s FY2015 strategic plan underpins drive to achieving world s best practice levels 19
20 Processing Processing Initiatives further processing innovation investment* and efficiencies continue to flow *Paybacks 0 2 years (refer appendices) Focus is to deliver incremental processing efficiency gains by introducing further automation and innovative processing techniques leveraging off the benefits from improved fish harvest size Set out below is a summary of the processing improvements for FY2008 (over FY2007) Labour Overhead Total Improvement Improvement Improvement FY2008 (over FY2007) % % % Wet Processing 14% 8% 9% Value-Add Processing 10% 0% 7% We are delivering further continuation of processing improvements in % terms during FY2009 (over FY2008) which are underpinned by Automation benefit of FY2008 initiatives for a full year in FY2009 together with implementation in H of further automation to underpin further quantum uplift in H Improved processing techniques will underpin improved yields particularly in H Improved fish size also underpinning throughput ($/kg) and yield improvements Fish quality initiatives will underpin sales and freight improvements in H
21 Processing Initiatives Pin-boning machine IPS 3000 Retail packing line Vacuum packing line 21
22 Revenue Revenue Initiatives continuing the growth in the domestic market and open the gateway to new market and product development horizons Focus is to continue to drive growth in the domestic market and to harness increasing global demand to continue strong sales growth and expand our Australian and Asia- Pacific markets Forecast growth in the domestic market of Tassal products assumed at circa 10% Significant additional growth over FY2008 for both contract growing (Petuna supply effectively commenced in late March 2008) and Superior Gold (Tassal acquired in mid- February 2008) Export opportunities - FY2009 only at break-even even in these markets as we progressively deliver on existing hedge positions. Further upside expected in FY2010. Brand management strategy is focussed on development and differentiation of Tassal brand 22
23 Revenue We continue to investigate opportunities to grow demand for Atlantic Salmon in Australia Internally: Restructure of Sales & Marketing team Regression analysis fresh and smoked * * (refer appendices) Externally: independent Sales and Marketing Review undertaken (framework for Marketing Plan) Objectives o Achieve sales growth of 10%+ o Refocus Tassal branding initiatives o Increase Salmon per capita from 1.2kg to 1.8kg o Excite the customer o Educate the consumer Key Strategies o Build Tassal brand awareness and equity o Drive and lead NPD and innovation o Fortify retail and wholesaler relationships o Lead growth in Salmon per capita consumption Branding Innovation (NPD) Centre Salmon Education and Retail Centre Consumer Relations Team 23


24 Branding Branding Initiatives Tassal Pure Tasmania the consumer choice Focus is to drive the Tassal Pure Tasmania brand to strengthen product positioning, deliver innovative products to our customer base and build on existing customer loyalty y 24
25 Innovation Centre 25


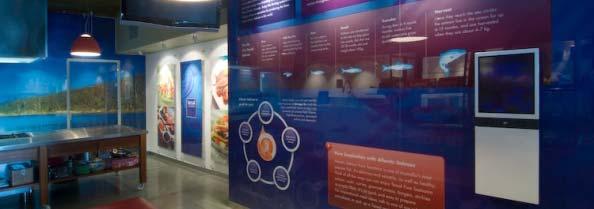
26 Salmon Education Centre


27 Consumer Relations Team Unique to industry Currently 14 employees Increasing in 2009 Specialists with egg to plate knowledge Store merchandising support
28 Risk Management Risk Management Initiatives enhanced company-wide risk management drives business sustainability Focus is to cascade risk mitigation and management accountability to all levels of the business and continue to build on the significant trend improvement in key workplace safety performance indicators achieved to date FY2010 workers compensation insurance renewal parameters improved over FY2009 Tassal has achieved significant improvement trends across a range of workplace safety performance indicators demonstrated as follows: Indicator Lost times injuries Days lost Workers compensation claims Number of Employees Workers compensation cost of claims ($'000) $622 $284 $261 $123 28
29 Environmental, Social and Governance ( ESG ) ESG Initiatives sustainable environmental management a key accountability across the business As a fundamental premise, we have a responsibility to act in the best interests of our stakeholders short, medium and long term. Environmental, Social and Corporate Governance ( ESG ) issues underpin this responsibility Our focus is to continue to drive sustainable environmental management practices and accountability across all levels l of business to build on the foundations laid during 2008 Tassal has appointed a Chief Sustainability Officer (start July 2009) this represents the next step in our commitment to growing high quality salmon in an environmentally responsible and sustainable stainable manner Tassal fully supports sustainable aquaculture practices from fish feed through to the Hatchery, Marine, Processing and Sales & Marketing activities Tassal will continue to support the expansion of its aquaculture activities in a sustainable manner 29
30 Competitive Advantages 30
31 Australia Barriers to entry extremely high There are significant operational and financial barriers to entry with respect to the Tasmanian Atlantic Salmon Industry from a live (Hatchery), fresh (fresh hog) and frozen fish perspective Hatchery due to biosecurity measures in place through Biosecurity Australia no live broodstock, eggs or salmon semen is allowed into Australia even if Biosecurity Australia allowed the importation, to some degree, of live Atlantic Salmon Tasmanian Government biosecurity measures still exist to stop the importation of live fish to propagate and populate a new Atlantic Salmon species (nb Tasmania is the only viable and sustainable area to grow Atlantic Salmon) and then, even if the Tasmanian Government allowed the importation of some degree of Salmon for propagation and population, Tassal, HAC, Petuna & VDA control all the hatchery licences Marine apart from holding all the hatchery licences Tassal, HAC, Petuna & VDA also hold all the suitable marine leases 31
32 Australia Barriers to entry extremely high Hatchery & Marine and from a return on equity / economic profit perspective the returns would not stack up for a new Tasmanian Salmon industry entrant due to: extremely high set up costs; and lack of ability to generate economies of scale to this end, even if a party was to acquire all other industry participants, they would only get around 40% of the entire industry y( (smolt, marine leases, licences etc) and would not be able to replicate Tassal s cost base (we acquired significant infrastructure at fire sale prices) Fresh Hog Australia s import protocols requires Atlantic Salmon to come into Australia with its head-off head-on allows significantly better shelf-life major retailers and wholesalers are unable to deal with such shortened shelf-life plus there is significant freight cost to be incurred from a fresh perspective to come from the other side of the world Frozen Hog does not matter from a shelf-life perspective that fish come into Australia with their head-off what does matter is that Australians will buy fresh over frozen fish 32
33 Australia Risk & Sustainability Risk We have completed significant work mitigating g our operational risks and we will continue to drive this focus Our geographical diversification is a significant risk mitigant in this regard covering all survivability issues (disease, warm water, oxygen, jellyfish etc) from a catastrophic event perspective Sustainability The Selective Breeding Program is progressing well and only growth and survivability benefits have been included in our Strategic Plan to FY2015 post FY2015 we should see an improved coefficient of variance ( CV ) and the reduction of the number of treatments for AGD (either through successful breeding practices and / or vaccine) We continue to employ global best practice both from the employees that we continue to engage, our marine and processing practices and investment in infrastructure employed On-site harvesting is global best practice from biosecurity and quality perspective Hatchery technology is global best practice whichever way you look at it Chief Sustainability Officer employed and we will continue to ensure that we employ best practice sustainable practices 33
34 Sea sites Potential sea sites Freshwater sites Processing 34


35 Australia Sales Market Salmon is an everyday protein choice the overall protein market opportunity is large targeting sales growth of 10%+ Tassal is able to dominate the Australian Salmon market by building a strong Tassal brand, leading innovation and being responsive to consumer and customer needs the value equation we offer is important Tassal Pure Tasmanian: Quick & Healthy Tasmanian Salmon Brand Pyramid 35
36 Australasia & Globally Clean, Green & Disease free Chilean production likely l to fall 40% + in 2009 and global supply down 7.5%* ( a first since 1990 s) = promising opportunities in export markets Our Biosecurity practices are best practice * (refer appendices) Hatchery water use & temperature control Harvesting harvesting on-site limited towing of stock Marine best practice technologies Processing best practice technologies EMS in place Asia is a golden opportunity given its proximity to Australia we should be able to own Asia through a combination of freshness to market yield and fish size benefits an improving write-off rate and / or depreciating AUD 36
37 Funding 37
38 Funding At 26.1% gearing remains below our target gearing range 30% - 35% Strong underlying cash flow from operations $m $22.9m $3.2m Hatchery and growth : $11m - $12m (page 16) $1.0m $8.4m $51.3m Utilised to underpin growth in inventory H Cash outflow 4.5m $32.6m Processing - $2.5m - $3m (page 19) Marine - $6 - $7m (page 17-18) Gearing 26.1% H % Net debt 30 June 2008 Capital Investment Dividend / Other Superior Gold Brand (Stamp Duty) Operating Cash Flow Net debt 31 December
39 Funding Existing banking arrangements allow us to continue our focus on delivering on our Strategic Plan with certainty surrounding ability to fund the growth Sufficient available headroom in current bank facility pool Strong relationship with Westpac Bank maintained Core facilities recently extended until 31 October 2010 Facility pricing remains competitive within the context of the current debt market Facility type Limit Used Available Overdrafts and advance facilities $ 48,500 $ 10,925 $ 37,575 Lease facilities (3-5 year maturity) $ 57,000 $ 40,411 $ 16,589 Total Facilities $ 105,500 $ 51,336 $ 54,164 39
40 Conclusion Leading Australian Atlantic Salmon producer with very high barriers to entry Existing and planned capital investment initiatives will continue to reduce cost of production, enhance Tassal s global cost competitiveness and support future earnings growth Focus on sustainably growing Atlantic Salmon share of protein market Elastic demand working with supermarkets to optimally position product Asian market presents attractive growth opportunity Competing with Norway globally with Chile struggling g Strong return focus capital spend delivering excellent returns Well capitalised balance sheet with capacity to fund growth Well positioned to maintain its earnings momentum Will continue to implement the financial and operational strategies underpinning the Strategic Plan to FY
41 Questions Have fun, work hard, stay healthy, eat salmon 41
42 Appendices 42
43 Marine - paybacks Marine Operations - FY2009 Capital Expenditure Efficiency Initiatives Efficiency Cost $'000 Payback (Yrs) ROI IRR NPV $'000 Automatic feeder $ 1, > 100% > 50% $ 873 Automatic feeder $ 1, > 100% > 50% $ 873 Lighting units x 6 $ > 300% > 400% $ 388 Underwater net washer $ > 150% > 80% $ 417 Underwater net washer $ > 150% > 80% $ 417 Underwater net washer $ > 150% > 80% $ 417 Harvest vessel - Tassal Pure Tasmania 1 $ 2, > 40% > 30% $ 769 Harvest vessel - Tassal Pure Tasmania 2 $ 1, > 40% >10% $ 2 Total $ 7,051 $ 4,156 Automatic feeders a further 2 automatic feeders are to be put to sea in FY2009. The cost of the automatic feeders is $1.1 million each Lighting during FY2008 we put in lights for 10 pens with a further 6 pens to be put under lights in FY2009. The cost to light a pen is $8,500 Underwater net washers 3 to be utilised in FY2009. The cost of an underwater net washer is $300k Harvest Vessels (On-site harvesting) FY2009 Biosecurity best practice Improve growth additional 2 to 3 days growing Improve survival no towing of nets Improve quality significant quality enhancement Tassal Pure Tasmania 1 at a cost of $2.5 million. This is the primary harvest vessel Tassal Pure Tasmania 2 at a cost of $1.4 million. This is the back-up harvest vessel and responsible for smolt deliveries and minor works with the Business Case based on this. Ultimately, it will be utilised more and more for harvesting and therefore the payback, ROI, IRR and NPV would be better if it was utilised primarily for harvesting (rather than as a back-up). 43
44 Processing - paybacks Processing further processing innovation and efficiencies continue to flow Efficiency Processing Automation Cost $'000 Implementation Payback (Yrs) ROI IRR NPV $'000 Skinning Machine $ 105 Jul > 20% > 50% $ 71 Baader Post Cleaning Kit $ 200 Jul > 10% > 10% $ 25 Pin Boning Machine $ 216 Jul > 120% > 300% $ 1,276 IPS 3000 & Multivac Packing Machine $ 1,680 Oct > 20% > 30% $ 718 Smokehouse Upgrade $ 683 Dec > 50% > 40% $ 861 Quality Improvement Equipment $ 487 Feb > 160% > 130% $ 2,353 Total $ 3,371 $ 5,304 Efficiency Processing Automation for FY2009 we are still considering a number of other efficiency related capital items 44
45 Revenue Regression Analyses Significant ifi work done on regression analysis for Supermarkets With respect to wholesale fish market industry structure is favourable With respect to supermarkets regression analysis is the key Approach taken Review past pricing / sales Determine elasticity through regression analysis Undertake scenarios of pricing strategy & funding Determine best margin approach for both Tassal & Supermarkets Supermarket Fresh Overall there was a low regression output = price is not the only factor in the buy decision However, at certain price points there was a high regression output = price points below $30kg have seen strong response Value equation critical Supermarket Retail Dual branding strategy avoid brand cannibalisation Overall there was a high regression output = strong elasticity of demand 45
46 Global Salmon Farming Chile The Chilean Salmon Industry continues to face severe biological and operational challenges due to ISA in region 10 of Chile - which h is thought h to be the consequence of poor biosecurity and unsustainable growth Market commentary suggests that there will be significant downward adjustment of the harvest and activity in region 10 for the period 2008 to 2010 to facilitate the return to a sustainable and profitable Industry maybe longer Due to the continuing ISA situation in Chile, industry participants are undertaking fundamental restructuring of their freshwater, seawater and processing facilities - effectively a minimum 3 to 5 year work out plan required Due to Chile s inability to supply, prices are now starting to improve in the global market = some industry commentary extremely bullish on price improvement Set out below is a position that Chile is endeavouring to get to compared to where the Tasmanian Industry is at Biosecurity Issues - Chile Biosecurity Position - Tasmania Work-out Plan - Solutions to be implemented Land based smolt production in a controlled environment in order to ensure the supply of high quality smolt Land based smolt supply already in place - smolt considered d some of the best in the world Land based broodstock facility for safe egg-supply Land based broodstock facility in place - eggs from Tasmanian Industry in global demand Reduce the grow-out in Region X and establish zone management with strict ISA containment measures Tasmanian Industry has around 10 grow-out regions (risk diversification) and Tasmania is split into 2 biosecurity zones (fish movement strictly controlled) 46
47 Global Salmon Farming Global l salmon supply outlook Atlantic Salmon negative supply growth of 6% expected Norway +7.5% Chile -40% UK / Canada slightly positive Coho moderate growth of 5% expected Wild sockeye catch projected down YOY 47
48 Global Salmon Farming Global supply expected to be down a first since the early 1990 s Source: Kontali, Pareto estimates 48
49 Disclaimer This presentation has been prepared by Tassal Group Limited for professional investors. The information contained in this presentation is for information purposes only and does not constitute an offer to issue, or arrange to issue, securities or other financial products. The information contained in this presentation is not investment or financial product advice and is not intended to be used as the basis for making an investment decision. The presentation has been prepared without taking into account the investment objectives, financial situation or particular need of any particular person. No representation or warranty, express or implied, is made as to the fairness, accuracy, completeness or correctness of the information, opinions and conclusions contained in the presentation. To the maximum extent permitted by law, none of Tassal Group Limited, its directors, employees or agents, nor any other person accepts any liability, including, without limitation, any liability arising out of fault or particular, no representation or warranty, express or implied is given as to the accuracy, completeness or correctness, likelihood of achievement or reasonableness of any forecasts, prospects or returns contained in this presentation nor is any obligation assumed to update such information. Such forecasts, prospects or returns are by their nature subject to significant uncertainties and contingencies. Before making an investment decision, you should consider, with or without the assistance of a financial adviser, whether an investment is appropriate in light of your particular investment needs, objectives and financial circumstances. Past performance is no guarantee of future performance. The distribution of this document is jurisdictions outside Australia may be restricted by law. Any recipient of this document outside Australia must seek advice on and observe such restrictions. 49
Austock Agribusiness
 Tassal Group Limited Austock Agribusiness Conference (Sydney Harbour Marriott Hotel) 18 March 2009 Presenter: Mark Ryan CEO and Managing Director Tassal Group Limited 1 Agenda Outline of Competitive i
HUON AQUACULTURE GROUP LIMITED
 HUON AQUACULTURE GROUP LIMITED RESULTS PRESENTATION FOR FIRST HALF FY2017 IMPORTANT NOTICE This presentation is provided by Huon Aquaculture Group Limited (ACN 114 456 781) to provide summary information
For personal use only
 31 July 2015 The Manager Listings ASX Market Announcements Australian Securities Exchange Level 4 Exchange Centre 20 Bridge Street Sydney NSW 2000 Via e-lodgement Tassal completes De Costi Seafoods Acquisition
HUON AQUACULTURE GROUP LIMITED ABN Appendix 4D Half-Year Report
 ABN 79 114 456 781 Appendix 4D Half-Year Report 1 Reporting period Reporting Period Half-year ended 31 December 2018 Previous Corresponding Period Half-year ended 31 December 2017 2 Results for announcement
Q BAKKAFROST GROUP Oslo 21 August 2018
 BAKKAFROST GROUP Oslo 21 August DISCLAIMER This presentation includes statements regarding future results, which are subject to risks and uncertainties. Consequently, actual results may differ significantly
Tassal Group Limited (TGR): Market Release Results for the Half-Year Ended 31 December 2016
: Market Release Results for the Half-Year Ended 31 December 2016") 22 February 2017 The Manager, Listings Australian Securities Exchange Company Announcements Office Level 4, Exchange Centre 20 Bridge Street Sydney, NSW 2000 Via e-lodgement Dear Sir We attach the following:
22 February 2017 The Manager, Listings Australian Securities Exchange Company Announcements Office Level 4, Exchange Centre 20 Bridge Street Sydney, NSW 2000 Via e-lodgement Dear Sir We attach the following:
BAKKAFROST INTRAFISH SEAFOOD INVESTOR FORUM London 13 September 2018
 BAKKAFROST INTRAFISH SEAFOOD INVESTOR FORUM London 13 September 2018 DISCLAIMER This presentation includes statements regarding future results, which are subject to risks and uncertainties. Consequently,
A N N U A L S H A R E H O L D E R S M E E T I N G N O V E M B E R
 A N N U A L S H A R E H O L D E R S M E E T I N G N O V E M B E R 2 0 1 7 AGENDA Welcome Chairman s review Managing Director s review Ordinary business and resolutions 2 CHAIRMAN S REVIEW Successful IPO
Clean Seas Sustainable Seafood
 Clean Seas Sustainable Seafood September 2013 Investor Update September 2013 ASX: CSS IMPORTANT INFORMATION This presentation contains general information in summary form which is current as at 26 May,
New Zealand King Salmon s Prospective Financial Information, a reconciliation of non-gaap to GAAP information and supplementary financial information
 New Zealand King Salmon s Prospective Financial Information, a reconciliation of non-gaap to GAAP information and supplementary financial information 100203342/4966012.19 A. ABOUT THIS DOCUMENT The information
RS Platou Markets. Seafood conference. 10th June 2010
 RS Platou Markets Seafood conference 10th June 2010 Agenda Introduction to Cermaq Highlights Q1 2010 and outlook full year Chile Recovery 2 Overview of Cermaq One of the global leaders in the aquaculture
Cermaq ASA Presentation for Pareto Securities Oslo, 14 th June 2012
 Cermaq ASA Presentation for Pareto Securities Oslo, 14 th June 2012 1 2020 2015 2010 2005 2000 1995 1990 1985 1980 1975 1970 1965 1960 1955 1950 Aquaculture: a sustainable growth industry Our growing population
PRESENTATION Q Oslo, 26 February 2014 John Binde, CEO Ola Loe, CFO
 PRESENTATION Q4 2013 Oslo, 26 February 2014 John Binde, CEO Ola Loe, CFO AGENDA: Highlights for the period Segment information Group financials Outlook 2 Highlights in Q4 2013: The best quarterly and yearly
Q BAKKAFROST GROUP Oslo 20 February 2018
 BAKKAFROST GROUP Oslo 20 February 2018 DISCLAIMER This presentation includes statements regarding future results, which are subject to risks and uncertainties. Consequently, actual results may differ significantly
Presentation of Cermaq
 Presentation of Cermaq North Atlantic Seafood Seminar Oslo, 8 th March 2012 Agenda Introduction to Cermaq Key results 2011 Focus on Mainstream Chile Outlook 2012 Photograph: Alf Børjesson 2 This is Cermaq
Q BAKKAFROST GROUP Oslo 19 February 2019
 BAKKAFROST GROUP Oslo 19 February 2019 DISCLAIMER This presentation includes statements regarding future results, which are subject to risks and uncertainties. Consequently, actual results may differ significantly
Tegel Group Holdings Limited
 Tegel Group Holdings Limited FY17 Interim Results Presentation 15 December 2016 TEGEL GROUP HOLDINGS LIMITED FY17 INTERIM RESULTS 1 Disclaimer This presentation contains summary information about Tegel
Prospectus. Tassal Group Limited. This Prospectus contains a public offer of 62,000,000 Shares at a price of $0.50 per Share.
 Tassal Group Limited ACN 106 067 270 Prospectus This Prospectus contains a public offer of 62,000,000 Shares at a price of $0.50 per Share. Promoter and Corporate Advisor: Mariner Corporate Finance Pty
Fiona is happy to do this slide
 Fiona is happy to do this slide DISCLAIMER This presentation contains not only a review of operations, but also some forward looking statements about Sanford Limited and the environment in which the company
HUON AQUACULTURE GROUP LIMITED ABN
 ABN 79 114 456 781 APPENDIX 4E PRELIMINARY FINAL REPORT GIVEN TO ASX UNDER LISTING RULE 4.3A FOR THE 12 MONTH PERIOD ENDED 30 JUNE 2015 1. DETAILS OF THE REPORTING PERIOD Reporting period: For the year
Harvest volume (GW) tonnes. Operating revenue NOK million. Operational EBIT NOK million Q2 11 Q3 11 Q4 11 Q1 12 Q2 12 Q2 11 Q3 11 Q4 11 Q1 12 Q2 12
 tonnes. Operating revenue NOK million. Operational EBIT NOK million Q2 11 Q3 11 Q4 11 Q1 12 Q2 12 Q2 11 Q3 11 Q4 11 Q1 12 Q2 12") The market showed strong ability to absorb 30% industry growth Prices in line with Q1 - Down 24% in Europe and ~35% in the US compared to Q2 2011 Satisfactory performance in Norway - excellent result in
The market showed strong ability to absorb 30% industry growth Prices in line with Q1 - Down 24% in Europe and ~35% in the US compared to Q2 2011 Satisfactory performance in Norway - excellent result in
Financial report Q3 2014
 Financial report Q3 2014 Austevoll Seafood ASA Financial report Q3 2014 Index Key figures for the Group... 03 Q3 2014... 04 Operating segments... 04 Cash flows... 05 Financial information as of 30 September
Athens Greece 31 March Annual 2017 Results Presentation NIREUS AQUACULTURE S.A.
 Athens Greece 31 March 2018 Annual 2017 Results Presentation NIREUS AQUACULTURE S.A. Table of Contents Pages I. Our Vision... 3 II. Profile..4-15 III. Sales by Business Sector....16 IV. Sales evolution...
Harvest volume (HOG) tons. Operational EBIT NOK million. Operational revenue NOK million Q2 10 Q3 10 Q4 10 Q1 11 Q2 11 Q2 10 Q3 10 Q4 10 Q1 11 Q2 11
 tons. Operational EBIT NOK million. Operational revenue NOK million Q2 10 Q3 10 Q4 10 Q1 11 Q2 11 Q2 10 Q3 10 Q4 10 Q1 11 Q2 11") Improved price achievement in a falling market Operational EBIT increased 13% ROACE of 26% in the quarter NIBD NOK 5.8 billion after dividend of NOK 2.9 billion High contract share in the second half of
Improved price achievement in a falling market Operational EBIT increased 13% ROACE of 26% in the quarter NIBD NOK 5.8 billion after dividend of NOK 2.9 billion High contract share in the second half of
EMPRESAS AQUACHILE S.A. RESULTS FOR 1 TH QUARTER May 2015
 EMPRESAS AQUACHILE S.A. RESULTS FOR 1 TH QUARTER 2015 May 2015 1. About Empresas AquaChile S.A. 03 2. Quarterly Summary 04 3. Analysis of Results 06 4. Balance Sheet Analysis 13 5. Cash Flow Analysis 15
For personal use only
 Tegel Group Holdings Limited FY18 Interim Results Presentation 6 December 2017 1 TEGEL GROUP HOLDINGS FY18 INTERIM RESULTS PRESENTATION Disclaimer This presentation contains summary information about Tegel
Q U A R T E R L Y R E P O R T 2 N D Q U A R T E R
 Q U A R T E R L Y R E P O R T 2 N D Q U A R T E R 2 0 0 7 1. Grieg Seafood develops as planned Grieg Seafood was listed in June, and has now 869 shareholders after 2 shares issues of MNOK 700 in total.
Highlights for the quarter Q2 / EBIT NOK 60 million pre biomass write-down
 Half year report Highlights for the quarter EBIT NOK 60 million pre biomass write-down EBIT pre fair value and biomass write-down (NOK million) 318 348 300 101 60 Mainstream results negatively impacted
For personal use only
 ASX & Media Release 30 April 2015 MARCH QUARTER CASH FLOW REPORT AND BUSINESS UPDATE YEAR TO DATE SALES DOUBLE Clean Seas Tuna Limited (ASX: CSS) is pleased to report that sales momentum is continuing
Sølvtrans Holding ASA Q Oslo, 7 November Roger Halsebakk, CEO Jon Kvalø, CFO
 Sølvtrans Holding ASA Q3 2012 Oslo, 7 November 2012 Roger Halsebakk, CEO Jon Kvalø, CFO 1 Highlights in the quarter 2 Financial review 3 Operational and market review 4 Summary and outlook 5 Appendix Highlights
P/F BAKKAFROST.
 P/F BAKKAFROST ANNUAL AND CONSOLIDATED REPORT AND ACCOUNTS YEAR TO 31 DECEMBER 2010 www.bakkafrost.com KEY FIGURES (DKK 1,000) IFRS IFRS IFRS FO-GAAP Profit and loss 2010 2009 2008 2007 Operating revenues
The answers to your questions.
 The answers to your questions. By / Ragnar Nystøyl CHRISTMAS SEMINAR Bergen, 19. November 2014 Agenda - Norwegian Production & Supply issues - Global Production & Supply issues - Market- & Price-related
Harvest volume (GW) tonnes. Operating revenue NOK million. Operational EBIT NOK million Q1 11 Q2 11 Q3 11 Q4 11 Q1 12 Q1 11 Q2 11 Q3 11 Q4 11 Q1 12
 tonnes. Operating revenue NOK million. Operational EBIT NOK million Q1 11 Q2 11 Q3 11 Q4 11 Q1 12 Q1 11 Q2 11 Q3 11 Q4 11 Q1 12") 33 % industry supply growth market prices down 33 % from Q1 2011 Strong demand increased prices from Q4 2011 Strong performance in Scotland Poor results in VAP Europe Operational EBIT of NOK 276 million
33 % industry supply growth market prices down 33 % from Q1 2011 Strong demand increased prices from Q4 2011 Strong performance in Scotland Poor results in VAP Europe Operational EBIT of NOK 276 million
NORWAY ROYA L S A L M ON PRESENTATION Q Oslo, 7 November 2017 Charles Høstlund, CEO Ola Loe, CFO 1
 PRESENTATION Q3 2017 Oslo, 7 November 2017 Charles Høstlund, CEO Ola Loe, CFO 1 AGENDA: Highlights for the period Segment information Group financials Markets Outlook 2 Highlights in Q3 2017 Operational
THIRD QUARTER / 2018
 REPORT FOR THE THIRD QUARTER 2018 HIGHLIGHTS Operationally strong quarter, with cost improvements and good price achievement. Record-high volume for sales & processing with positive contribution Total
Operating revenue NOK million Operational EBIT NOK million. Harvest volume (HOG) tonnes Q3 09 Q4 09 Q1 10 Q2 10 Q3 10
 tonnes Q3 09 Q4 09 Q1 10 Q2 10 Q3 10") Solid performance in a strong market Strong price achievement and solid results in Norway Return on Capital Employed of 18.9% in the quarter Favourable market balance expected to support a strong market
Solid performance in a strong market Strong price achievement and solid results in Norway Return on Capital Employed of 18.9% in the quarter Favourable market balance expected to support a strong market
Your Aquaculture Technology and Service Partner. Company presentation November 2014
 Company presentation November 2014 Important Information About this Company Presentation This Company Presentation has been prepared by AKVA group ASA ("AKVA group" or the "Company") for information purposes
For personal use only
 HY14 Results 15 May 2014 Disclaimer This presentation includes both information that is historical in character and information that consists of forward looking statements. Forward looking statements are
Chilean volume reduction Impact on global markets. North Atlantic Seafood Forum Steven Rafferty CFO Cermaq ASA 5 March 2009
 Chilean volume reduction Impact on global markets North Atlantic Seafood Forum Steven Rafferty CFO Cermaq ASA 5 March 2009 Context Chilean Atlantic salmon supply will drop by 50% + in 2009 Further drop
Annual Report April March 2017
 Annual Report 2016 1 April 2016-31 March 2017 THE BOARD OF DIRECTORS ANNUAL REPORT FOR FISCAL YEAR 2016 Cermaq Group AS has 18 wholly owned subsidiaries, of which Cermaq Norway AS, Alsvåg AS, Cermaq Canada
25 February The Manager Market Announcements Australian Securities Exchange Limited 20 Bridge Street SYDNEY NSW 2000.
 Level 1 157 Grenfell Street Adelaide SA 5000 GPO Box 2155 Adelaide SA 5001 Adelaide Brighton Ltd ACN 007 596 018 Telephone (08) 8223 8000 International +618 8223 8000 Facsimile (08) 8215 0030 www.adbri.com.au
Q May 12th Oslo
 Q1 2016 May 12th Oslo Lerøy Seafood Group ASA CEO Henning Beltestad CFO Sjur S. Malm Agenda Highlights Key financial figures Outlook Q1 2016 EBIT before FV adj. NOK 584.5 million EBIT/kg all inclusive
Tegel Group Holdings Limited
 Tegel Group Holdings Limited FY17 Full Year Results Presentation 27 June 2017 1 TEGEL GROUP HOLDINGS FY17 RESULTS PRESENTATION Disclaimer This presentation contains summary information about Tegel Group
Marine Harvest. Q Presentation 22 August 2018
 Marine Harvest Q2 2018 Presentation 22 August 2018 Forward looking statements This presentation may be deemed to include forward-looking statements, such as statements that relate to Marine Harvest s contracted
Santiago, May 11 th, Results Presentation 1Q18
 Santiago, May 11 th, 2018 Results Presentation 1Q18 Agenda I. Highlights II. III. Financial Statements Supply, Demand and Prices IV. Farming Operation V. Prospects 2 Highlights EBIT 1Q18 USD 18.8 million
Select Harvests Limited ( SHV )
") Select Harvests Limited ( SHV ) 2016 Annual General Meeting Growing Together 25 November 2016 Disclaimer & Basis of Preparation This presentation is provided for information purposes only and has been
Select Harvests Limited ( SHV ) 2016 Annual General Meeting Growing Together 25 November 2016 Disclaimer & Basis of Preparation This presentation is provided for information purposes only and has been
Marine Harvest. Q Presentation 10 May 2017
 Marine Harvest Q1 2017 Presentation 10 May 2017 1 Forward looking statements This presentation may be deemed to include forward-looking statements, such as statements that relate to Marine Harvest s contracted
For personal use only
 11 May 2017 The Manager Company Announcements Office ASX Limited 20 Bridge Street SYDNEY NSW 2000 GRAINCORP LIMITED: GNC INVESTOR PRESENTATION FINANCIAL HALF YEAR ENDED 31 MARCH 2017 Please find attached
Fishpool Christmas Seminar 2017 Bearish signals going into 2018
 Photo: SB1 Markets SEAFOOD SALMON FARMING Fishpool Christmas Seminar 2017 Bearish signals going into 2018 Tore A. Tønseth Phone : (+47) 24 14 74 18 Mobile : (+47) 95 80 62 77 E-mail : tore.tonseth@sb1markets.no
Inghams Group Limited. FY2018 Results Presentation
 Inghams Group Limited FY2018 Results Presentation 22 AUGUST 2018 Important notice and disclaimer Disclaimer The material in this presentation is general background information about the activities of Inghams
Investor Presentation
 Investor Presentation Full Year Results FY2018 Raj Naran, Managing Director and CEO, ALS Limited 28 May 2018 www.alsglobal.com IMPORTANT NOTICE AND DISCLAIMER This presentation has been prepared by ALS
Chile, que pasa? -an update of the situation for salmon farming in Chile, - issues and potential solutions
 Chile, que pasa? -an update of the situation for salmon farming in Chile, - issues and potential solutions Intrafish / DNB investor conference London, 4 November, 2015 Jon Hindar CEO Cermaq Group The starting
Monash IVF Group. FY16 Results Presentation 26 August 2016
 Monash IVF Group FY16 Results Presentation 26 August 2016 Disclaimer The presentation has been prepared by Monash IVF Group Limited (ACN 169 302 309) ( MVF ) (including its subsidiaries, affiliates and
SalMar ASA First quarter
 SalMar ASA First quarter 2009 1 STRONG SALMON PRICES AND SATISFACTORY EARNINGS Strong salmon prices contributed to satisfactory earnings for the SalMar Group in the first quarter 2009. While Scottish Sea
Marine Harvest. Q Presentation 14 February 2018
 Marine Harvest Q4 2017 Presentation 14 February 2018 1 Forward looking statements This presentation may be deemed to include forward-looking statements, such as statements that relate to Marine Harvest
Tassal Group. Salmon and seafood growth strategy ADD
 Vol m Food & Beverages Australia Equity research September 14, 2015 ADD Current price: Target price: A$3.82 A$4.20 Previous target: A$ Up/downside: 9.9% Reuters: Bloomberg: Market cap: Average daily turnover:
Marine Harvest. Q Presentation 24 August 2017
 Marine Harvest Q2 2017 Presentation 24 August 2017 1 Forward looking statements This presentation may be deemed to include forward-looking statements, such as statements that relate to Marine Harvest s
Interim Report Q2-18
 Interim Report Q2-18 HIGHLIGHTS Operational EBIT of NOK 181 million o Operational EBIT per kg of NOK 24.73 in Region North o Operational EBIT per kg of NOK 23.49 in Region South o Non-recurring item of
PRESENTATION Q Oslo, 19 February 2013 John Binde, CEO Ola Loe, CFO
 PRESENTATION Q4 2012 Oslo, 19 February 2013 John Binde, CEO Ola Loe, CFO AGENDA: Highlights for the period Segment information Group financials Outlook 2 Highlights in Q4 2012: Significant improvement
Cover-More Group. UBS Australasia Conference. November 2015
 Cover-More Group UBS Australasia Conference November 2015 Executive summary: FY15 overview Cover-More delivered another year of double digit earnings growth, with offshore business growing substantially.
Austevoll Seafood ASA Q1 2009
 Q1 2009 Ole Rasmus Møgster Chairman Britt Kathrine Drivenes CFO Disclaimer This Presentation has been produced by (the Company or Austevoll ) solely for use at the presentation to the market held in connection
Events after balance sheet date
 Austevoll Seafood ASA 0 Financial Report Q4 2011 Successful second fishing season for anchoveta in Peru A positive result recorded for fish farming, sale and distribution, in difficult conditions Seasonally,
Annual Report April March 2018
 Annual Report 2017 1 April 2017-31 March 2018 Photo: Kenneth Soløy The BOARD OF DIRECTORS ANNUAL REPORT for fiscal year 2017 Cermaq Group AS has 18 wholly owned subsidiaries, of which Cermaq Norway AS,
INTERIM FINANCIAL REPORT
 INTERIM FINANCIAL REPORT FOR THE SIX MONTHS ENDED 31 DECEMBER 2017 CONTENTS DIRECTORS REPORT... 5 CORPORATE INFORMATION... 8 CONSOLIDATED STATEMENT OF COMPREHENSIVE INCOME...10 FOR THE SIX MONTHS ENDED
FY2015. For personal use only. Full Year Results
 2015 For personal use only Full Year Results Create Build Operate Global Minerals Message from the Board & Executive GROUP Group PERFORMANCE Performance Our NPAT for 2015 is a solid performance and testament
Marine Harvest. Q Presentation 1 November 2017
 Marine Harvest 1 Q3 2017 Presentation 1 November 2017 Forward looking statements This presentation may be deemed to include forward-looking statements, such as statements that relate to Marine Harvest
 ASX ANNOUNCEMENT DATE: 22 February 2017 Attached is the Presentation regarding Pact s Half year Financial Results for the half year ended 31 December 2016. The Presentation will occur at 10am (Melbourne
TASSAL GROUP LIMITED ABN
 TASSAL GROUP LIMITED ABN 15 106 067 270 APPENDIX 4E PRELIMINARY FINAL REPORT for the Year ended 30 June 2018 (previous corresponding period: Year ended 30 June 2017 RESULTS FOR ANNOUNCEMENT TO MARKET Year
Business Update. USPP Conference Miami. Luis Damasceno Group CFO Michael Williams Group Finance Director & Treasurer January 2019
 Business Update USPP Conference Miami Luis Damasceno Group CFO Michael Williams Group Finance Director & Treasurer 23-25 January 2019 www.alsglobal.com IMPORTANT NOTICE AND DISCLAIMER This presentation
Q Nova Austral Financial Reporting May 2nd, 2018
 Q1-2018 Nova Austral Financial Reporting May 2nd, 2018 Agenda A. Nova Austral Pillars & Fundamentals B. Market and company updates C. Financial Report 1) Key Financial summary 2) LTM EBITDA, Revenue and
Q November 9th. Lerøy Seafood Group ASA. CEO Henning Beltestad CFO Sjur S. Malm
 Q3 2017 November 9th Lerøy Seafood Group ASA CEO Henning Beltestad CFO Sjur S. Malm Agenda Highlights Key financial figures Outlook Q3 2017 EBIT before FV adj. NOK 861 million Harvest volume 46 024 GWT
Q August 24th. Lerøy Seafood Group ASA. CEO Henning Beltestad CFO Sjur S. Malm
 Q2 2017 August 24th Lerøy Seafood Group ASA CEO Henning Beltestad CFO Sjur S. Malm Agenda Highlights Key financial figures Outlook Q2 2017 EBIT before FV adj. NOK 801 million Harvest volume 26 156 GWT
PRESENTATION Q Oslo, 15 August 2013 John Binde, CEO Ola Loe, CFO
 PRESENTATION Q2 2013 Oslo, 15 August 2013 John Binde, CEO Ola Loe, CFO AGENDA: Highlights for the period Segment information Group financials Outlook 2 Highlights in Q2 2013: Best quarterly operational
Contents. Highlights Financial key figures 4 Vision & values 6 This is Cermaq 7. Mainstream 12. Other activities 22
 Annual report Contents Highlights 2007 3 Financial key figures 4 Vision & values 6 This is Cermaq 7 CEO s COMMENTS 10 Mainstream 12 EWOS 16 EWOS innovation 20 Other activities 22 DIRECTORS REPORT 24 ANNUAL
Weekly Salmon Outlook Week
 Week 10-20 Page 1 of 8 Harvest of Atlantic salmon in Norway continued to grow in week 9. The harvest volume (23 000 tonnes wfe) was up 1000 tonnes from the previous week and 3% higher than in the corresponding
For personal use only
 RELIANCE WORLDWIDE CORPORATION LIMITED ACN 610855877 www.rwc.com FY2016 RESULTS PRESENTATION 29 August 2016 Important notice This presentation contains general information about s activities at the date
FOURTH QUARTER / 2014
 SATISFACTORY RESULT DESPITE BIOLOGICAL CHALLENGES HIGHLIGHTS IN THE FOURTH QUARTER 2014 Good salmon prices and high harvested volume produced profit growth and record operating revenues. 50% of the harvested
Investor Presentation
 Investor Presentation Results for the 6 months ended 31 December 2010 17 February 2011 Richard Allely, CEO Geoffrey Stephenson, CFO 1 2011 Half Year Results - Agenda 1. Overview of H1 FY11 Performance
THIRD QUARTER MARINE HARVEST GROUP
 / / Q3 2014 THIRD QUARTER MARINE HARVEST GROUP Strong earnings Successful start up of the feed plant Agreement to buy 40 000 tons farming capacity from Acuinova in Chile Quarterly dividend of NOK 1.10
Freshwater Fish Marketing Corporation. Five-Year Corporate Plan Summary
 Freshwater Fish Marketing Corporation Five-Year Corporate Plan Summary Corporate Plan FY2015/16 to FY2019/20 FFMC Corporate Plan FY2015/16 - FY2019/20 1/15 Freshwater Fish Marketing Corporation (herein
INTERIM PRESENTATION Second quarter, 2006
 INTERIM PRESENTATION Second quarter, 6 CEO Yngve Myhre CFO Bent M. Skisaker Agenda Operational Update Group Harvesting Processing Norway and Denmark Strategic considerations and Outlook Financials Income
For personal use only
 ASX Announcement Freedom Foods Group Limited (ASX: FNP) FY 2013 Financial Results Freedom Foods Group Limited (FNP) today released the Company s preliminary final results for the full year ended 30 th
Malcolm Jackman Elders Limited
 Malcolm Jackman Elders Limited The New Elders Refocused Reorganised Recapitalised ASX Small & Mid Cap Conference 29 October 2009 Malcolm Jackman Chief Executive Officer Chief Executive Officer 2 The New
Apex Frozen Foods Limited
 Investor Presentation Apex Frozen Foods Limited CIN: L15490AP2012PLC080067 Q1 FY19 Results Safe Harbor This presentation and the accompanying slides (the Presentation ), which have been prepared by Apex
Marine Harvest Q Presentation
 Marine Harvest Q2 2015 Presentation Forward looking statements This presentation may be deemed to include forward-looking statements, such as statements that relate to Marine Harvest s contracted volumes,
Results Presentation 3Q17
 Multiexport Foods S.A. Results Presentation 3Q17 Santiago, November 2017 Agenda I. Highlights II. III. Financial Statements Supply, Demand and Prices IV. Farming Operation V. Perspectives 2 Highlights
Marine Harvest Q Presentation
 Marine Harvest Q2 2014 Presentation Forward looking statements This presentation may be deemed to include forward-looking statements, such as statements that relate to Marine Harvest s contracted volumes,
Leading light. Full year results to 30 September November 2014
 Leading light Full year results to 30 September 2014 27 November 2014 1 Leading light Disclaimer This presentation has been prepared by TOWER Limited to provide shareholders with information on TOWER s
Financial Results Full year ended 30 June August 2018
 Yesterday Today Tomorrow Financial Results Full year ended 30 June 2018 24 August 2018 Disclaimer The material contained in this document is a presentation of information about the Group s activities current
ANALYST RESULT BRIEFING FINANCIAL PERIOD 6 MONTHS ENDING 31 MARCH MAY 2018
 ANALYST RESULT BRIEFING FINANCIAL PERIOD 6 MONTHS ENDING 31 MARCH 2018 23 MAY 2018 DISCLAIMER This presentation contains not only a review of operations, but also some forward looking statements about
FY17 Results. Robust, innovative technology. DONALD McGURK Managing Director & CEO
 Robust, innovative technology FY17 Results DONALD McGURK Managing Director & CEO MICHAEL BARTON Chief Financial Officer 6 September 2017 SARAH EMMS Manager, Investor Relations Important Notice and Disclaimer
Salmon price, demand and market trends
 Salmon price, demand and market trends Kolbjørn Giskeødegård, Director 21 November 2018 Salmon supply growth dramaticly down after 2012 2 500 2013-17: CAGR 2% 2 000 1 500 2003-12: CAGR 8% 1 000 500 0 2003
ECONOMIC AND FINANCIAL ANALYSIS
 Coral Reef Rehabilitation and Management Program Coral Triangle Initiative Project (RRP INO 46421) A. Approach and Methodology ECONOMIC AND FINANCIAL ANALYSIS 1. The economic and financial analysis of
For personal use only
 A S X A N N O U N C E M E N T DATE: 24 August 2016 FY2016 RESULTS PRESENTATION Attached is the Presentation regarding Pact s Financial Results for the year ended 30 June 2016. The Presentation will occur
1H FY19 RESULTS PRESENTATION 25 February 2019
 RELIANCE WORLDWIDE CORPORATION LIMITED ACN 610855877 1H FY19 RESULTS PRESENTATION 25 February 2019 INVESTOR PRESENTATION 1H FY19 RESULTS PAGE 0 Important Notice This presentation contains general information
Company Directory. Chief Executive Officer Mark Ryan, B.Com, CA, MAICD, FAIM. Company Secretary Monika Maedler, BEc, LLB, FCIS
 ANNUAL REPORT Company Directory Directors Allan McCallum, Dip.Ag Science, FAICD (Chairman) Trevor Gerber, B.Acc CA (SA) Christopher Leon, BScEng, MEngSci, FAICD Mark Ryan, B.Com, CA, MAICD, FAIM (Managing
Interim Results 2019 March 2019
 Interim Results 2019 March 2019 Disclaimer This presentation may contain forward-looking statements and projections. There can be no certainty of outcome in relation to the matters to which the forward-looking
2017 M ACQUA RIE AUS T R A LI A CONF ERENCE
 2017 M ACQUA RIE AUS T R A LI A CONF ERENCE Malcolm Bundey Managing Director and CEO 3 May 2017 1 IMPORTANT INFORMATION This Presentation contains the summary information about the current activities of
LIFE STARTS HERE. FY18 Full Year Results Presentation. 27 August 2018
 LIFE STARTS HERE FY18 Full Year Results Presentation 27 August 2018 Disclaimer The presentation has been prepared by Monash IVF Group Limited (ACN 169 302 309) ( MVF ) (including its subsidiaries, affiliates
Westpac 2008 Full year results
 Westpac 2008 Full year results 30 October 2008 Westpac 2008 Full year results Gail Kelly Chief Executive Officer Key messages Performed well in a challenging environment, delivering a robust financial