VANIG BUSINESS ANALYSIS
|
|
|
- Spencer Pope
- 5 years ago
- Views:
Transcription

1 VANIG BUSINESS ANALYSIS

2 About US Market Analysis Contents ASEAN Competitor Analysis Risk Analysis Financial Analysis

3 ABOUT US

4 What is Vanig Vanig is an integrated e-commerce and supply chain solution powered by Blockchain. Vanig simplifies and eliminates intermediaries and manual processes and brings in transparency to the entire Supply Chain process. Vanig s E-commerce platform is safe, secure, easy to use, benefits both buyer and seller and allows cryptocurrency payments.

5 VANIG Vanig is an e-commerce website powered by blockchain and created in order to eliminate the middleman as well as reduce cost for the consumer. The company is entering the market by using hyperledger solutions to implement transparency. Vanig is looking to bring this innovative tech solution to South East Asia. Now seems to be the perfect time for the company to enter the market since none of the major ecommerce giants in Asia have initiated the use of blockchain on their platform. HOW TO BUY VANIG tokens will be used to buy products and make secure payments on the platform. Money transfer from buyers to sellers will be near instantaneous. Buyers can still use traditional forms of payments such as credit cards, PayPal and other third party payment portals supported by the site. Although it might result in higher transaction fees.
6 Market Analysis Target Market Vanig is initially looking to target the demographic of South East Asia (ASEAN- an association of 10 Southeast Asian Nations), as it is expected to be one of the next booming e-commerce markets in APAC (Asia-Pacific). The size of ASEAN s Market is expected to reach $88 billion USD by the end of 2025 (from $5.5 billion in 2015). Driving Factors The two main driving factors of South East Asia s e-commerce boom are the growing middle class and the rapid expansion of the Internet access: The middle class population in ASEAN is estimated to reach 400 million in 2020 (from 190 million in 2012). Internet access in ASEAN is estimated to reach 600 million by 2025 (from 200 million in 2017).

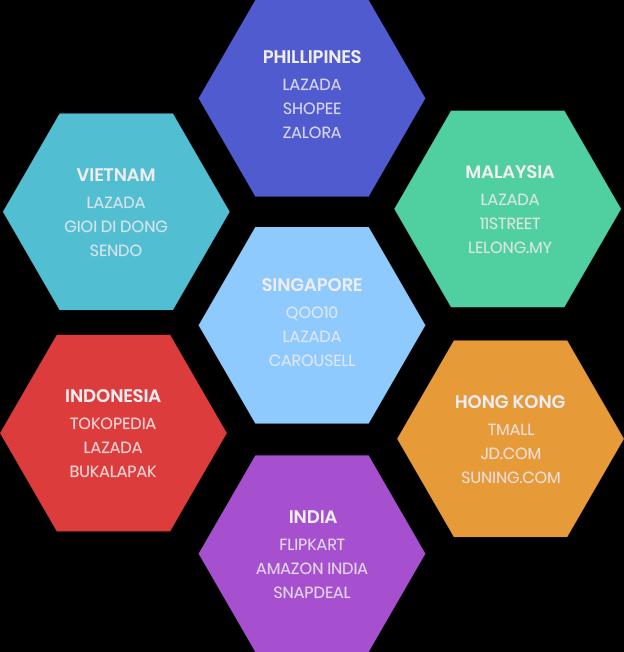
7 COMPETITOR ANALYSIS ASEAN
8 Business Model Amazon seller fees include account fees and referral fees. In 2018, the average fee for amazon sellers is estimated to be 15%, although it varies greatly based on product category. The shipping rates to Asia and the Pacific Islands also vary based on preferred shipping times and product category: Standard Category- on average $4.5 per shipment Expedited Shipping- on average $13 per shipment Priority Courier Shipping- on average $26 per shipment Amazon accepts a variety of payments such as debit and credit. The company also implemented Amazon Pay, service that allows the consumer to use the payment method already associated with the Amazon account, charging a processing fee ranging from 2.9% to 3.9%.

9 Business Model Alibaba mainly focuses on business-to-business trade but it still supports consumer trade through its e-commerce web portal Tmall (B2C), which rivals Amazon. Sellers are charged an annual fee ranging from $5000 US to $10000 US as well as a commission fee between 2% to 5%, dependent on product category. Tmall has partnered up with eight Chinese logistic companies to launch an international parcel-forwarding serving that is aimed to simplify and lower the cost of shipping online purchases from China to select Asian locations. Shipping cost varies greatly based on product category but freight consolidation helped Tmall lower their shipping cost by 30% to 50%. Regarding payment methods, Tmall supports AliPay (also part of the Alibaba Group) as well as bank cards; transaction fee is estimated to be 3% to 7%. The company also requires a management fee deposit of $2000 to $15000.
10 Business Model JD.com mainly focuses on business-to-consumer trade. Sellers are charged an initial deposit of $15000 US as well as a commission fee of 5% to 7%, dependent on product category. Although they are both major players within the e-commerce market, JD.com differentiates itself from Alibaba by running its own logistics network. Nevertheless, the company also relies on third party providers. Shipping costs also varies greatly based on product category but JD.com tries to offer free shipping on as many items as possible. Regarding payment methods, JD.com supports WeChat Payment, JD Pay as well as bank cards; transaction fee is estimated to be 5% to 8%. The company also requires a management fee deposit of $8000 to $50000.
11 Business Model Vanig will focus its model on selling directly to consumer. The revenue model will be based of multiple revenue streams: Seller Fees- a competitive 5% of each sale. Fiat Transaction Commission- fee of 1.5% to 3.5%. Monthly Subscriptions to offer Pro Features For Sellers Seller Pro Package - $50 per month in Asian countries & $ 100 per month in developed countries. Pro Seller + Store Accounts Package- $100 per month in Asian Countries & $200 per month in developed countries. Vanig plans on working with third-party shipping providers and plans on offering free shipping for orders over $25 in Asian countries, and over $50 in developed countries. Regarding payment methods, Vanig supports crypto-currency payments (no transaction fees) as well as Fiat currency payments.


12 E-Commerce Top Players

13 Market Share($B USD)

14 RISK ASSESSMENT
15 Vanig SWOT Analysis Strengths Lower fees and commissions. Integration of the blockchain innovation allowing for cryptocurrency payments. Supply Chain Benefits due to raw material and manufacturing tracking. Weaknesses Competing with e-commerce giants who have access to large capital. High level of investment required. Opportunities Adaptation of Vanig supply chain by other major players. Partnerships with other e-commerce market leaders. Establishing a Vanig store brand. Threats Competitors with better research-intensive strategies and high investment capital enter the market. Market uncertainty could result in collapse of cryptocurrency.

16 FINANCIAL ANALYSIS


17 Financial Projections Based on an Investment of 20$M USD $70,000,000 $60,000,000 $50,000,000 $40,000,000 $30,000,000 $20,000,000 $10,000,000 $- -$10,000,000 -$20,000,000 Revenue and Profit $63,572,683 $40,769,109 $25,222,683 $14,945,205 $11,469,109 $3,179,501 $1,270,205 By 2019 By 2020 By 2021 By $6,800,499 Revenue Profit before tax
18 Vanig Marketing Plan - Launch Goals and Objectives Goal: Onboard and nurture key seller partner relationships. Vanig will identify and build relationships with key sellers that can influence other sellers to want to sell their products through Vanig as well. We will do this by targeting specific successful stores regionally to be onboarded early to the platform. Providing this level of onboarding control will ensure a smooth red carpet process that all systems are ready for buyers and sellers understand how to run their shops. Key Objectives: Identify sellers to pursue and build relationships with for onboarding to platform. Invest in partners that will share our values and vision and will promote Vanig. Seek exclusive partnerships to drive buyers to Vanig as the exclusive means for purchasing from those seller partners. Create promotional marketing and sales materials to market and onboard new sellers. Sellers should be aware of Vanig s unique benefits. A. Immediate payments. B. Low seller fees. C. Rewards program.
19 4. Create in-app tips to promote seller engagement. A. Sellers - active sellers, target them to showcase our seller pro features and pre+ store features, that offers analytics, insights into products, categories, buyers, sales etc. B. Sellers - ones that haven't sold anything - target with tips on which are hot product categories and trending products. C. Sellers that haven't logged in recently / updated their product catalogue - same as above but giving them reasons, incentives to login and list their first products. 5. Invest in ad campaigns that target new sellers to join Vanig as a new seller. A. Print media. B. Social media marketing. C. Paid articles, advertisements. D. SEO and Adwords campaign. E. Influencer endorsement on social media platforms.
20 Goal: Launch and develop new regional markets and opportunities. Vanig will identify and target new markets for expansion and develop partner relationships in those markets to build a seller base before launching to buyers. Being aware of regional social media and advertising networks will be important to build appropriate and rewarding campaigns to drive new buyers and sellers into Vanig s marketplace. Key Objectives: 1. Identify key regions appropriate for expansion. 2. Develop localized language support for new launch countries. 3. Translate ad campaigns for new countries and make sure adverts are culturally and customs appropriate for new regions. 4. Identify nearly sellers for onboarding. 5. Invest in ad campaigns and influencer marketing to build new buyer traffic. Goal: Engage customer audience to grow brand awareness. Creating brand awareness will be driven through multi-channel marketing sources from print to social media and digital display to influencer outreach. We will identify key relationships with influencers, key sellers, and early adopters to increase our brand outreach to new buyers. Educational outreach will be highly important to educate new buyers on how easy it is to shop at Vanig to lower any barriers to new technology that may exist in segments.
21 Several objectives will focus on creating a rewards program to rewards early buyers for using Vanig and completing specific goals in the platform like sharing their purchases to social media. Targeted marketing for specific e- commerce states in the platform such as items left in cart, will keep buyers and sellers active in platform. This targeting will bring buyers back to our platform to complete purchases, write reviews or follow up on upsell opportunities. Key Objectives: 1. Develop educational promotions to lower adversity/barriers to new technology so buyers understand ease of shopping through Vanig. Buyers should be interested in Vanig s approach to ecommerce. A. Low cost. B. Product origin information. C. Reliability. D. Rewards program Create promotional pieces highlighting unique sellers in our ecosystem to increase sales. Identify key influencers and platforms for paid promotions and outreach.
22 4. Invest in marketing campaigns to drive new buyers to Vanig. A. Print media. B. Social media marketing. C. Paid articles, advertisements. D. SEO and Adwords campaign. E. Influencer endorsement on social media platforms. 5. Develop rewards program and marketing material to increase buyer acquisition, engagement and repeat shopping. Buyers will be rewarded for engaging with and sharing Vanig. A. Consider launch promotion of 200 tokens to first 5000 shoppers who make a purchase in the launch month. 6. In-app tips to promote buyer engagement. A. Buyers that left items in shopping cart. B. Buyers based on their browsing history, targeting deals while they are in the site in specific pages/product categories. C. Buyers that didn't visit our site for over a week - enticing them to come back with tokens to purchase again. D. Request buyers to submit reviews.
23 Goal: Develop feedback system to increase buyer/seller happiness. With a new ecosystem it will be important to invest resources into receiving, evaluating and implementing feedback from both our buyers and sellers. Vanig will rollout a system and process to request feedback actively through several mediums to collect data to inform decisions on how we operate, feature implementations, and bug fixes. Key Objectives: 1. Implement timely surveys to increase feedback engagement 2. Create in-app single question surveys that can get quick feedback without interrupting the user experience. 3. Build easy to access customer service portal that houses help docs and FAQs as well as quick chat support. 4. Develop list of feedback questions that align with company goals and objectives A. What is working? B. What isn t working? C. What can be improved? D. What new features do you look forward to? 5. Incentivize feedback with token rewards
24 Cash Flow Forecast M Market Share (in BILLION USD) Phillipines & Malaysia - Mar'19 Vietnam - Sep '19 Month Jan-19 Feb-19 Mar-19 Apr-19 May-19 Jun-19 Jul-19 Aug-19 Sep-19 Oct-19 Nov-19 Dec-19 Total Size of Target Market (Phillipines) 0.20% 0.40% 0.60% 0.80% 0.90% 1.00% 1.00% 1.00% 1.00% 1.00% $0.08 Size of Target Market (Malaysia) 0.20% 0.40% 0.60% 0.80% 0.90% 1.00% 1.00% 1.00% 1.00% 1.00% $0.08 Size of Target Market (Vietnam) 0.20% 0.30% 0.50% 0.60% $0.02 Vanig Market Share (2% +0.1%/m) $0 $0 $375,221 $750,442 $1,125,664 $1,500,885 $1,688,495 $1,876,106 $2,182,409 $2,335,561 $2,641,864 $2,795,015 $ 17,271,662 Number of Sellers $ 10,000 Additional Revenue Streams Seller Pro $50 30% Pro Seller + Store Account $100 20% Seller Comission Fees 10% $ - $ - $ 37,522 $ 75,044 $ 112,566 $ 150,088 $ 168,850 $ 187,611 $ 218,241 $ 233,556 $ 264,186 $ 279,502 $ 1,727,166 Advertising Revenue 5% $ - $ - $ - $ 37,522 $ 56,283 $ 75,044 $ 84,425 $ 93,805 $ 109,120 $ 116,778 $ 132,093 $ 139,751 $ 844,822 Total Revenue $ - $ - $ 37,522 $ 147,566 $ 212,600 $ 277,633 $ 314,524 $ 351,416 $ 414,861 $ 472,834 $ 536,280 $ 576,752 $ 3,341,988 One Time-Cost Cash Capital General Expenses Advertising/Marketing $150,000 $500,000 $500,000 $150,000 $150,000 $150,000 $150,000 $300,000 $200,000 $200,000 $200,000 $200,000 $2,850,000 E-Commerce Staff $75,000 $75,000 $75,000 $75,000 $75,000 $75,000 $75,000 $100,000 $100,000 $100,000 $100,000 $100,000 $1,025,000 Supply Chain Staff $58,000 $58,000 $58,000 $58,000 $58,000 $58,000 $58,000 $100,000 $100,000 $100,000 $100,000 $100,000 $906,000 Mixed Integration Staff $36,000 $58,000 $58,000 $58,000 $58,000 $58,000 $58,000 $75,000 $75,000 $75,000 $75,000 $75,000 $759,000 Employee Salaries $100,000 $100,000 $100,000 $100,000 $100,000 $100,000 $100,000 $130,000 $130,000 $130,000 $130,000 $130,000 $1,350,000 Rent/Lease Payments/Utlities $20,000 $20,000 $20,000 $20,000 $20,000 $20,000 $20,000 $30,000 $30,000 $30,000 $30,000 $30,000 $290,000 One Time-Cost Hyperledger Infrastructure $200, $200,000 Strategic and Market Advisors $400, $400,000 Postage, Shipping & Communication $100, $100,000 Business Insurance $500,000 $500,000 Computer Software & Equipment $500, $500,000 Travel Expenses $150,000 $150,000 Business Licenses $150, $150,000 Professional Services $250, $250,000 Furniture & Fixtures $100, $100,000 Research & Development $200, $200,000 Misceallanous $250, $250,000 Total Expenses $3,239,000 $811,000 $811,000 $461,000 $461,000 $461,000 $461,000 $735,000 $635,000 $635,000 $635,000 $635,000 $9,980,000 NET CASH FLOW -$ 3,239,000 -$ 811,000 -$ 773,478 -$ 313,434 -$ 248,400 -$ 183,367 -$ 146,476 -$ 383,584 -$ 220,139 -$ 162,166 -$ 98,720 -$ 58,248 -$ 6,638,012 CUMULATIVE CASH FLOW -$ 3,239,000 -$ 4,050,000 -$ 4,823,478 -$ 5,136,912 -$ 5,385,312 -$ 5,568,679 -$ 5,715,155 -$ 6,098,739 -$ 6,318,878 -$ 6,481,044 -$ 6,579,764 -$ 6,638,012 -
25 Market Share (in BILLION USD) Cash Flow Forecast M Singapore - Mar'20 Hong-Kong - Sep'20 Month Jan-20 Feb-20 Mar-20 Apr-20 May-20 Jun-20 Jul-20 Aug-20 Sep-20 Oct-20 Nov-20 Dec-20 Total Size of Target Market (Phillipines) 1.00% 1.00% 1.00% 1.00% 1.00% 1.00% 1.00% 1.00% 1.00% 1.00% 1.00% 1.00% Size of Target Market (Malaysia) 1.00% 1.00% 1.00% 1.00% 1.00% 1.00% 1.00% 1.00% 1.00% 1.00% 1.00% 1.00% Size of Target Market (Vietnam) 0.80% 0.80% 0.90% 1.00% 1.00% 1.00% 1.00% 1.00% 1.00% 1.00% 1.00% 1.00% Size of Target Market (Singapore) 0.20% 0.40% 0.60% 0.80% 0.90% 1.00% 1.00% 1.00% 1.00% 1.00% Size of Target Market (Hong Kong) 0.20% 0.30% 0.50% 0.70% Vanig Market Share (2% +0.1%/m) $3,591,000 $3,591,000 $4,220,533 $4,850,067 $5,302,267 $5,754,467 $5,980,567 $6,206,667 $6,570,200 $6,751,967 $7,115,500 $7,479,033 $ 67,413,267 Number of Sellers $ 10,000 Additional Revenue Streams Seller Pro $50 30% Pro Seller + Store Account $100 20% Seller Comission Fees 10% $ 359,100 $ 359,100 $ 422,053 $ 485,007 $ 530,227 $ 575,447 $ 598,057 $ 620,667 $ 657,020 $ 675,197 $ 711,550 $ 747,903 $ 6,741,327 Advertising Revenue 5% $ 179,550 $ 179,550 $ - $ 242,503 $ 265,113 $ 287,723 $ 299,028 $ 310,333 $ 328,510 $ 337,598 $ 355,775 $ 373,952 $ 3,159,637 Total Revenue $ 928,650 $ 1,058,650 $ 1,072,053 $ 1,077,510 $ 1,180,340 $ 1,283,170 $ 1,387,085 $ 1,456,000 $ 1,545,530 $ 1,642,795 $ 1,767,325 $ 1,891,855 $ 16,290,963 One Time-Cost Cash Capital General Expenses Advertising/Marketing $300,000 $300,000 $300,000 $300,000 $400,000 $400,000 $400,000 $500,000 $500,000 $500,000 $500,000 $500,000 $4,900,000 E-Commerce Staff $100,000 $100,000 $100,000 $100,000 $100,000 $100,000 $100,000 $100,000 $100,000 $125,000 $125,000 $125,000 $1,275,000 Supply Chain Staff $100,000 $100,000 $100,000 $100,000 $100,000 $100,000 $100,000 $100,000 $100,000 $125,000 $125,000 $125,000 $1,275,000 Mixed Integration Staff $100,000 $100,000 $100,000 $100,000 $100,000 $100,000 $100,000 $100,000 $100,000 $125,000 $125,000 $125,000 $1,275,000 Employee Salaries $120,000 $120,000 $120,000 $120,000 $120,000 $120,000 $120,000 $150,000 $150,000 $150,000 $150,000 $150,000 $1,590,000 Rent/Lease Payments/Utlities $50,000 $50,000 $50,000 $50,000 $50,000 $50,000 $60,000 $60,000 $60,000 $60,000 $60,000 $60,000 $660,000 One Time-Cost Hyperledger Infrastructure $400, $400,000 Strategic and Market Advisors $400, $400,000 Postage, Shipping & Communication $100, $100,000 Business Insurance $400,000 $400,000 Computer Software & Equipment $250, $250,000 Travel Expenses $150,000 $150,000 Business Licenses $150, $150,000 Professional Services $250, $250,000 Furniture & Fixtures $100, $100,000 Research & Development $250, $250,000 Misceallanous $250, $250,000 Total Expenses $3,470,000 $770,000 $770,000 $770,000 $870,000 $870,000 $880,000 $1,010,000 $1,010,000 $1,085,000 $1,085,000 $1,085,000 $13,675,000 NET CASH FLOW -$ 2,541,350 $ 288,650 $ 302,053 $ 307,510 $ 310,340 $ 413,170 $ 507,085 $ 446,000 $ 535,530 $ 557,795 $ 682,325 $ 806,855 $ 2,615,963 CUMULATIVE CASH FLOW -$ 2,541,350 -$ 2,252,700 -$ 1,950,647 -$ 1,643,137 -$ 1,332,797 -$ 919,627 -$ 412,542 $ 33,458 $ 568,988 $ 1,126,783 $ 1,809,108 $ 2,615,963 -
26 Market Share (in BILLION USD) Cash Flow Forecast M Indonesia Mar'21 India - Sep'21 Month Jan-21 Feb-21 Mar-21 Apr-21 May-21 Jun-21 Jul-21 Aug-21 Sep-21 Oct-21 Nov-21 Dec-21 Total Size of Target Market (Phillipines) 1.00% 1.00% 1.00% 1.00% 1.00% 1.00% 1.00% 1.00% 1.00% 1.00% 1.00% 1.00% $0.12 Size of Target Market (Malaysia) 1.00% 1.00% 1.00% 1.00% 1.00% 1.00% 1.00% 1.00% 1.00% 1.00% 1.00% 1.00% $0.12 Size of Target Market (Vietnam) 1.00% 1.00% 1.00% 1.00% 1.00% 1.00% 1.00% 1.00% 1.00% 1.00% 1.00% 1.00% $0.12 Size of Target Market (Singapore) 1.00% 1.00% 1.00% 1.00% 1.00% 1.00% 1.00% 1.00% 1.00% 1.00% 1.00% 1.00% Size of Target Market (Hong Kong) 0.80% 0.90% 1.00% 1.00% 1.00% 1.00% 1.00% 1.00% 1.00% 1.00% 1.00% 1.00% Size of Target Market (Indonesia) 0.20% 0.40% 0.60% 0.80% 0.90% 1.00% 1.00% 1.00% 1.00% 1.00% Size of Target Market (India) 0.20% 0.30% 0.50% 0.70% Vanig Market Share (2% +0.1%/m) $10,080,000 $10,319,167 $12,250,000 $13,941,667 $15,633,333 $17,325,000 $18,170,833 $19,016,667 $24,290,000 $26,926,667 $32,200,000 $37,473,333 $ 237,626,667 Number of Sellers $ 10,000 Additional Revenue Streams Seller Pro $50 30% $ 910,000 $ 980,000 $ 1,050,000 $ 450,000 $ 480,000 $ 510,000 $ 540,000 $ 570,000 $ 600,000 $ 675,000 $ 690,000 $ 720,000 $ 8,175,000 Pro Seller + Store Account $100 20% $ 780,000 $ 840,000 $ 900,000 $ 600,000 $ 640,000 $ 680,000 $ 720,000 $ 760,000 $ 800,000 $ 900,000 $ 920,000 $ 960,000 $ 9,500,000 Seller Comission Fees 10% $ 1,008,000 $ 1,031,917 $ 1,225,000 $ 1,394,167 $ 1,563,333 $ 1,732,500 $ 1,817,083 $ 1,901,667 $ 2,429,000 $ 2,692,667 $ 3,220,000 $ 3,747,333 $ 23,762,667 Advertising Revenue 5% $ 504,000 $ 515,958 $ 612,500 $ 697,083 $ 781,667 $ 866,250 $ 908,542 $ 950,833 $ 1,214,500 $ 1,346,333 $ 1,610,000 $ 1,873,667 $ 11,881,333 Total Revenue $ 3,202,000 $ 3,367,875 $ 3,787,500 $ 3,141,250 $ 3,465,000 $ 3,788,750 $ 3,985,625 $ 4,182,500 $ 5,043,500 $ 5,614,000 $ 6,440,000 $ 7,301,000 $ 53,319,000 One Time-Cost Cash Capital General Expenses Advertising/Marketing $1,000,000 $1,000,000 $1,000,000 $1,000,000 $1,000,000 $1,000,000 $1,000,000 $1,000,000 $1,000,000 $1,000,000 $1,000,000 $1,000,000 $12,000,000 E-Commerce Staff $100,000 $100,000 $100,000 $100,000 $100,000 $100,000 $100,000 $150,000 $150,000 $150,000 $150,000 $150,000 $1,450,000 Supply Chain Staff $100,000 $100,000 $100,000 $100,000 $100,000 $100,000 $100,000 $150,000 $150,000 $150,000 $150,000 $150,000 $1,450,000 Mixed Integration Staff $100,000 $100,000 $100,000 $100,000 $100,000 $100,000 $100,000 $150,000 $150,000 $150,000 $150,000 $150,000 $1,450,000 Employee Salaries $400,000 $400,000 $400,000 $400,000 $400,000 $400,000 $400,000 $400,000 $400,000 $400,000 $400,000 $400,000 $4,800,000 Rent/Lease Payments/Utlities $150,000 $150,000 $150,000 $150,000 $150,000 $150,000 $150,000 $150,000 $150,000 $200,000 $200,000 $200,000 $1,950,000 One Time-Cost Hyperledger Infrastructure $500, $500,000 Strategic and Market Advisors $750, $750,000 Postage, Shipping & Communication $250, $250,000 Business Insurance $300,000 $300,000 Computer Software & Equipment $500, $500,000 Travel Expenses $500,000 $500,000 Business Licenses $400, $400,000 Professional Services $1,000, $1,000,000 Furniture & Fixtures $500, $500,000 Research & Development $1,000, $1,000,000 Misceallanous $500, $500,000 Total Expenses $8,050,000 $1,850,000 $1,850,000 $1,850,000 $1,850,000 $1,850,000 $1,850,000 $2,000,000 $2,000,000 $2,050,000 $2,050,000 $2,050,000 $29,300,000 NET CASH FLOW -$ 4,848,000 $ 1,517,875 $ 1,937,500 $ 1,291,250 $ 1,615,000 $ 1,938,750 $ 2,135,625 $ 2,182,500 $ 3,043,500 $ 3,564,000 $ 4,390,000 $ 5,251,000 $ 24,019,000 CUMULATIVE CASH FLOW -$ 4,848,000 -$ 3,330,125 -$ 1,392,625 -$ 101,375 $ 1,513,625 $ 3,452,375 $ 5,588,000 $ 7,770,500 $ 10,814,000 $ 14,378,000 $ 18,768,000 $ 24,019,000 -
27 Market Share (in BILLION USD) Cash Flow Forecast M Operational & rest of world roll out depends on revenue Month Jan-21 Feb-21 Mar-21 Apr-21 May-21 Jun-21 Jul-21 Aug-21 Sep-21 Oct-21 Nov-21 Dec-21 Total Size of Target Market (Phillipines) 1.00% 1.00% 1.00% 1.00% 1.00% 1.00% 1.00% 1.00% 1.00% 1.00% 1.00% 1.00% $0.12 Size of Target Market (Malaysia) 1.00% 1.00% 1.00% 1.00% 1.00% 1.00% 1.00% 1.00% 1.00% 1.00% 1.00% 1.00% $0.12 Size of Target Market (Vietnam) 1.00% 1.00% 1.00% 1.00% 1.00% 1.00% 1.00% 1.00% 1.00% 1.00% 1.00% 1.00% $0.12 Size of Target Market (Singapore) 1.00% 1.00% 1.00% 1.00% 1.00% 1.00% 1.00% 1.00% 1.00% 1.00% 1.00% 1.00% Size of Target Market (Hong Kong) 1.00% 1.00% 1.00% 1.00% 1.00% 1.00% 1.00% 1.00% 1.00% 1.00% 1.00% 1.00% Size of Target Market (Indonesia) 1.00% 1.00% 1.00% 1.00% 1.00% 1.00% 1.00% 1.00% 1.00% 1.00% 1.00% 1.00% Size of Target Market (India) 0.50% 0.50% 0.50% 0.50% 0.50% 0.50% 0.50% 0.50% 0.50% 0.50% 0.50% 0.50% Vanig Market Share (2% +0.1%/m) $38,613,379 $38,613,379 $38,613,379 $38,613,379 $38,613,379 $38,613,379 $38,613,379 $38,613,379 $38,613,379 $38,613,379 $38,613,379 $38,613,379 $ 463,360,545 Number of Sellers $ 10,000 Additional Revenue Streams Seller Pro $50 30% $ 1,750,000 $ 1,750,000 $ 1,750,000 $ 750,000 $ 750,000 $ 750,000 $ 750,000 $ 750,000 $ 750,000 $ 750,000 $ 750,000 $ 750,000 $ 12,000,000 Pro Seller + Store Account $100 20% $ 1,500,000 $ 1,500,000 $ 1,500,000 $ 1,000,000 $ 1,000,000 $ 1,000,000 $ 1,000,000 $ 1,000,000 $ 1,000,000 $ 1,000,000 $ 1,000,000 $ 1,000,000 $ 13,500,000 Seller Comission Fees 10% $ 3,861,338 $ 3,861,338 $ 3,861,338 $ 3,861,338 $ 3,861,338 $ 3,861,338 $ 3,861,338 $ 3,861,338 $ 3,861,338 $ 3,861,338 $ 3,861,338 $ 3,861,338 $ 46,336,055 Advertising Revenue 5% $ 1,930,669 $ 1,930,669 $ 1,930,669 $ 1,930,669 $ 1,930,669 $ 1,930,669 $ 1,930,669 $ 1,930,669 $ 1,930,669 $ 1,930,669 $ 1,930,669 $ 1,930,669 $ 23,168,027 Total Revenue $ 9,042,007 $ 9,042,007 $ 9,042,007 $ 7,542,007 $ 7,542,007 $ 7,542,007 $ 7,542,007 $ 7,542,007 $ 7,542,007 $ 7,542,007 $ 7,542,007 $ 7,542,007 $ 95,004,082 One Time-Cost Cash Capital General Expenses Advertising/Marketing $1,000,000 $1,000,000 $1,000,000 $1,000,000 $1,000,000 $1,000,000 $1,000,000 $1,000,000 $1,000,000 $1,000,000 $1,000,000 $1,000,000 $12,000,000 E-Commerce Staff $250,000 $250,000 $250,000 $250,000 $250,000 $250,000 $250,000 $400,000 $400,000 $400,000 $400,000 $400,000 $3,750,000 Supply Chain Staff $250,000 $250,000 $250,000 $250,000 $250,000 $250,000 $250,000 $400,000 $400,000 $400,000 $400,000 $400,000 $3,750,000 Mixed Integration Staff $250,000 $250,000 $250,000 $250,000 $250,000 $250,000 $250,000 $400,000 $400,000 $400,000 $400,000 $400,000 $3,750,000 Employee Salaries $500,000 $500,000 $500,000 $500,000 $500,000 $500,000 $500,000 $500,000 $500,000 $500,000 $500,000 $500,000 $6,000,000 Rent/Lease Payments/Utlities $300,000 $300,000 $300,000 $300,000 $300,000 $300,000 $300,000 $300,000 $300,000 $300,000 $300,000 $300,000 $3,600,000 One Time-Cost Hyperledger Infrastructure $500, $500,000 Strategic and Market Advisors $750, $750,000 Postage, Shipping & Communication $250, $250,000 Business Insurance $250,000 $250,000 Computer Software & Equipment $500, $500,000 Travel Expenses $500,000 $500,000 Business Licenses $500, $500,000 Professional Services $500, $500,000 Furniture & Fixtures $250, $250,000 Research & Development $1,000, $1,000,000 Misceallanous $500, $500,000 Total Expenses $8,050,000 $2,550,000 $2,550,000 $2,550,000 $2,550,000 $2,550,000 $2,550,000 $3,000,000 $3,000,000 $3,000,000 $3,000,000 $3,000,000 $38,350,000 NET CASH FLOW $ 992,007 $ 6,492,007 $ 6,492,007 $ 4,992,007 $ 4,992,007 $ 4,992,007 $ 4,992,007 $ 4,542,007 $ 4,542,007 $ 4,542,007 $ 4,542,007 $ 4,542,007 $ 56,654,082 CUMULATIVE CASH FLOW $ 992,007 $ 7,484,014 $ 13,976,020 $ 18,968,027 $ 23,960,034 $ 28,952,041 $ 33,944,048 $ 38,486,055 $ 43,028,061 $ 47,570,068 $ 52,112,075 $ 56,654,082 -
SmallBizU WORKSHEET 1: REQUIRED START-UP FUNDS. Online elearning Classroom. Item Required Amount ($) Fixed Assets. 1 -Buildings $ 2 -Land $
 Fixed Assets. 1 -Buildings $ 2 -Land $") WORKSHEET 1: REQUIRED START-UP FUNDS Item Required Amount () Fixed Assets 1 -Buildings 2 -Land 3 -Initial Inventory 4 -Equipment 5 -Furniture and Fixtures 6 -Vehicles 7 Total Fixed Assets Working Capital
WORKSHEET 1: REQUIRED START-UP FUNDS Item Required Amount () Fixed Assets 1 -Buildings 2 -Land 3 -Initial Inventory 4 -Equipment 5 -Furniture and Fixtures 6 -Vehicles 7 Total Fixed Assets Working Capital
ICO Market Monthly Analysis October
 ICO Market Monthly Analysis October 2018 https://icobench.com report@icobench.com Introduction ICO Market Analysis October 2018 We are pleased to introduce you to our new ICO Market Monthly Report with
Over the counter or off exchange trading is done directly between two parties, without the supervision of an exchange.
 1 Contents A. Statement... 3 B. Vision... 4 C. Introduction... 6 D. About... 7 E. Business model and opportunities... 8 F. Ecosystem... 9 G. Roadmap... 10 H. Circulation suplay... 11 I. Team... 12 2 STATEMENT
Electrocomponents 2017 half-year financial results. 18 November 2016
 Electrocomponents 2017 half-year financial results 18 November 2016 Agenda Overview of results Lindsley Ruth Financial results and performance update David Egan Performance Improvement Plan Lindsley Ruth
EMQQ Emerging Markets Internet & Ecommerce ETF
 Emerging Markets Internet & Ecommerce ETF ETF.com segment: Equity: Emerging Markets Internet Competing ETFs: N/A Related ETF Channels: Technology, Internet, Vanilla, Emerging Markets, Equity, Sectors Find
WeChat Update Investor Web Conference Call OCTOBER 2018
 WeChat Update Investor Web Conference Call OCTOBER 2018 2 WHO WE ARE Listed ASX (IVO) Data-driven solutions that help brands, retailers and commerce businesses compete and grow in more profitable ways.
Q Earnings Call
 Q2 2018 Earnings Call Safe Harbor The information presented herein may contain forward-looking statements. Such forward-looking statements include all statements other than statements of historical fact,
Creating liquidity provisions for hedge funds Accessing new crypto wealth. Prospects for fund managers
 Creating liquidity provisions for hedge funds Accessing new crypto wealth Prospects for fund managers Illiquidity the hedge fund s achilles heel Subscription and redemption processes are heavy with paperwork,
ICO Market Analysis September
 ICO Market Analysis September 2018 https://icobench.com report@icobench.com Introduction ICO market analysis September 2018 We are pleased to introduce you to our new ICO Market Monthly Report with analytics
ABOUT THE PROJECT. Exscudo s main task is to provide an ultimate trading and exchange functionality for different client groups:
 ABOUT THE PROJECT The main goal of the project is the integration of cryptocurrencies with the world of equity and financial markets. We aim to provide professional trading and exchange tools within the
February 2018 Company Overview
 February 2018 Company Overview SQUARE.COM/INVESTORS RUSTICA Minneapolis, MN Cautionary statement This document contains forward-looking statements within the meaning of Section 27A of the Securities Act
Foxtons Interim results presentation For the period ended 30 June 2018
 Foxtons Interim results presentation For the period ended 30 June 2018 Important information This presentation includes statements that are, or may be deemed to be, forward-looking statements. These forward-looking
For personal use only
 Investor Presentation Year End Result 2013 and Outlook May 2014 2 Company overview - iproperty Group iproperty Group Limited is the leader in online advertising and other real estate services for real
ICO Market Monthly Analysis February
 ICO Market Monthly Analysis February 2019 https://icobench.com report@icobench.com Introduction ICO Market Analysis February 2019 We are pleased to introduce you to our new ICO Market Monthly Report with
ICO Market Report December December Unlock your Crypto Potential. 1 P a g e
 December 2018 Unlock your Crypto Potential 1 P a g e Contents DISCLAIMER 3 ICO MARKET STATS (DECEMBER 18) 4 HARD CAP/SOFT CAP INFO 5 NOVEMBER VS DECEMBER STATISTICS 6 TOP 5 ICOS (DECEMBER 18) 7 AMOUNT
THE ONE IN ALL APP WECHAT MATTHEW BRENNAN CHINACHANNEL.CO
 THE ONE IN ALL APP WECHAT MATTHEW BRENNAN CHINACHANNEL.CO THE REPULIC OF THE PEOPLE S REPULIC OF & AVERAGE HRS CHINESE SPEND PER MONTH USING MOBILE APPS 75.1 95.0 = 2.42 HRS PER DAY = 3.06 HRS PER
MARKET SUMMARY NEW ZEALAND. Data snapshot. Business and economic growth
 1 THE CPA AUSTRALIA ASIA-PACIFIC SMALL BUSINESS SURVEY - MARKET SUMMARY: NEW ZEALAND MARKET SUMMARY NEW ZEALAND Data snapshot Business and economic growth 90% Small businesses that expect to grow in next
MASSCRYP. Powered By MASS Crypto Based Technology
 MASSCRYP Powered By MASS Crypto Based Technology MASS Cryp Project The first decentralised advertisement platform with Cryptocurrency Mass Cryp enterprise is an innovative and unique project which creates
1H 19 Investor Presentation February 2019
 1H 19 Investor Presentation February 2019 1 About Raiz Raiz (formerly Acorns) is a mobile first micro-investing platform via mobile phone or web app, which allows customers to invest in a portfolio of
Interim results presentation 2017
 Interim results presentation 2017 Contents Key indicators Operating environment What differentiates us Highlights Bank Save Credit Continued focus Key indicators Key indicators Earnings 4 000 3 500 3 000
Algebraix Token Economics
 An Algebraix Data Whitepaper Algebraix Token Economics October 2017, Version 1.0 Pg 1 (858) 381-4800 AlgebraixData.com 9601 Amberglen Blvd Austin, TX 78729 Algebraix Token Economics This document describes
PRESS AND ANALYST CONFERENCE
 PRESS AND ANALYST CONFERENCE Metzingen April 12, 2010 Press and Analyst Conference 2010 HUGO BOSS April 12, 2010 2 / 39 AGENDA KEY FACTS 2009 FINANCIAL PERFORMANCE 2009 OUTLOOK 2010 GROWTH STRATEGY 2015
Investor Presentation
 Investor Presentation (NASDAQ: TRIP) Q4 2012 Safe Harbor Statement Forward-Looking Statements. Our presentation today, including the slides contained herein, contains "forward-looking statements" within
Financial Inclusion and Social Network
 Financial Inclusion and Social Network China Experience Young Jiang A Survey on Mobile Payments Penetration India and China are the top two countries with the highest mobile payments penetration rate 90%
Cost Estimation of a Manufacturing Company
 Cost Estimation of a Manufacturing Company Name: Business: Date: Economics of One Unit: Manufacturing Company (Only complete if you are making a product, such as a bracelet or beauty product) Economics
KEMQ KraneShares Emerging Markets Consumer Technology Index ETF
 KEMQ KraneShares Emerging Markets Consumer Technology Index ETF ETF.com segment: Equity: Emerging Markets Technology Competing ETFs: Related ETF Channels: Technology, Equal-Weighted, Smart-Beta ETFs, Broad-based,
Caesars Entertainment WeChat Marketing. China-Friendly 2.0 November, 2017
 Caesars Entertainment WeChat Marketing China-Friendly 2.0 November, 2017 Caesars Entertainment: The World s Premier Provider of Branded Resort Entertainment Since 1937 CAESARS ENTERTAINMENT OVERVIEW Facts
The Next-Generation Interactive APEC Tariff Database
 The Next-Generation Interactive APEC Tariff Database A tool to help SMEs access trading markets in Asia Pacific Initiative by USCIB, NC-APEC, US-ASEAN Business Council, TradeMoves LLC & Mercor Consulting
Global Equites declined from Concern over Trade War
 Quarterly Market Outlook: Quarter 2 2018 on 3 April 2018 Global Equites declined from Concern over Trade War Investment Outlook for 2 nd Quarter 2018 Equity Thailand U.S. Europe Japan Asia Bond Thailand
B-GUIDE: Market Outlook
 Quarterly Market Outlook: Quarter 1 2018 on 5 th January 2018 Investment Outlook for 1 st Quarter 2018 Accelerating Global Economy Supports the Rising Earnings Equity Thailand US Europe Japan Asia Bond
Six months of FY ending December 31, (0.4) (1.9) 22.5 (0.4) (0.3) (0.4) (0.1) (0.4) (0.7) (2.0) 0.9 (1.
 (1.9) 22.5 (0.4) (0.3) (0.4) (0.1) (0.4) (0.7) (2.0) 0.9 (1.") November 11, ISEKI & CO., LTD. Supplementary Information to Consolidated Financial Results (April 1, September 30, ) I. Consolidated business results for the six months ended September 30, (Billions of
November 11, ISEKI & CO., LTD. Supplementary Information to Consolidated Financial Results (April 1, September 30, ) I. Consolidated business results for the six months ended September 30, (Billions of
Global Equity Trading Volumes Surge 36% in 1 st half 2015 driven by Mainland China
 EMBARGO: :1BST/1:1CET/19:1EDT Global Equity Trading Volumes Surge 36% in 1 st half 215 driven by Mainland China Global Equity Trading Volumes Ex Mainland China Up 5% Mainland China Share Trading Vols Rise
GROWTH IN ASEAN SHOWS RESILIENCE UNDER GLOBAL LIQUIDITY INFUSION
 May-1 Nov-1 May-1 Nov-1 THIS QUARTER IN ASIA Asian Business Cycle Indicators (ABCIs), Vol.11 April July 213 Source: OECD Development Centre GROWTH IN ASEAN SHOWS RESILIENCE UNDER GLOBAL LIQUIDITY INFUSION
FY ended March 31, 2015 Restated *1. Year-on year change. Difference (forecast/ actual) FY ended December 31, December 31, 2015 Forecast *2
 FY ended December 31, December 31, 2015 Forecast *2") February 12, 2016 ISEKI & CO., LTD. Supplementary Information to Consolidated Financial Results (April 1, ) I. Consolidated business results for the fiscal year ended (Billions of yen, %) March 31, Restated
February 12, 2016 ISEKI & CO., LTD. Supplementary Information to Consolidated Financial Results (April 1, ) I. Consolidated business results for the fiscal year ended (Billions of yen, %) March 31, Restated
THIS QUARTER IN ASIA ASEAN SHOWING RESILIENCE WHILE CHINA AND INDIA WEAKENING
 Apr-9 Oct-9 Apr-1 Oct-1 Apr-9 Oct-9 Apr-1 Oct-1 THIS QUARTER IN ASIA Asian Business Cycle Indicators (ABCIs), Vol.8 April June 212 Source: OECD Development Centre ASEAN SHOWING RESILIENCE WHILE CHINA AND
MARKET SUMMARY AUSTRALIA. Data snapshot. Business and economic growth
 1 THE CPA AUSTRALIA ASIA-PACIFIC SMALL BUSINESS SURVEY - MARKET SUMMARY: AUSTRALIA MARKET SUMMARY AUSTRALIA Data snapshot Business and economic growth 90% Small businesses that expect to grow in next 12
Isle Of Wight half year business confidence report
 half year business confidence report half year report contents new company registrations closed companies (dissolved) net company growth uk company share director age director gender naming trends sic
Asia s strongest brand in banking, banking the world s strongest economies
 Credit Suisse Investor Conference Peter Wong, Chief Executive, HSBC Asia-Pacific Asia s strongest brand in banking, banking the world s strongest economies 21 March 2011 www.hsbc.com Forward-looking statements
Schroder Asian Income Monthly Fund Update
 Schroder Asian Income Monthly Fund Update Fund Performance As at 30 September 2014, SGD 1 month Year to date Since launch* Schroder Asian Income Fund (Bid-Bid) (%) -1.7 8.4 35.2 Schroder Asian Income Fund
Developing a Business Plan in 6 Easy Steps March 24,
 Developing a Business Plan in 6 Easy Steps March 24, 2015 www.scorenorwalk.org What we will discuss today Business Plan what & why 6-Step Business Plan Q&A Why Don t Small Businesses do Business Plans?
7 rules of WeChat marketing (with case studies)
") 1 7 rules of WeChat marketing (with case studies) By WalktheChat November 2018 Who am I? 2 Thomas Graziani Co-founder at WalktheChat I lived in China for 7 years, worked for large MNCs in China (Schneider
1 7 rules of WeChat marketing (with case studies) By WalktheChat November 2018 Who am I? 2 Thomas Graziani Co-founder at WalktheChat I lived in China for 7 years, worked for large MNCs in China (Schneider
AAXJ ishares MSCI All Country Asia ex Japan ETF
 ishares MSCI All Country Asia ex Japan ETF ETF.com segment: Equity: Asia-Pacific Ex-Japan - Total Market Competing ETFs: AXJL, DBAP, AXJV, FLAX Related ETF Channels: Asia-Pacific Ex-Japan, Total Market,
Investor Presentation
 Investor Presentation (NASDAQ: TRIP) Q2 2013 Safe Harbor Statement Forward-Looking Statements. Our presentation today, including the slides contained herein, contains "forward-looking statements" within
1Q of FY ending December 31, (0.2) (1.9) 11.3 (0.2) (0.2) (0.2) (0.2) (1.2) (89.2) 0.1
 (1.9) 11.3 (0.2) (0.2) (0.2) (0.2) (1.2) (89.2) 0.1") August 6, ISEKI & CO., LTD. Supplementary Information to Consolidated Financial Results (April 1, June 30, ) I. Consolidated business results for the three months ended June 30, (Billions of yen, %) Year-on
August 6, ISEKI & CO., LTD. Supplementary Information to Consolidated Financial Results (April 1, June 30, ) I. Consolidated business results for the three months ended June 30, (Billions of yen, %) Year-on
rhipe Limited (ASX code RHP) FY16 Full Year Results Presentation & FY 2017 Outlook
 FY16 Full Year Results Presentation & FY 2017 Outlook") rhipe Limited (ASX code RHP) FY16 Full Year Results Presentation & FY 2017 Outlook Dominic O Hanlon, CEO & Managing Director Mike Hill, Executive Chairman 1 This presentation has been prepared by rhipe
rhipe Limited (ASX code RHP) FY16 Full Year Results Presentation & FY 2017 Outlook Dominic O Hanlon, CEO & Managing Director Mike Hill, Executive Chairman 1 This presentation has been prepared by rhipe
27 July 2018 Interim Results
 27 July 2018 Interim Results for the half year ended 30 June 2018 Disclaimer This presentation may contain forward-looking statements, including forward-looking statements within the meaning of the United
Asian Insights Third quarter 2016 Asia s commitment in policies and reforms
 Asian Insights Third quarter 2016 Asia s commitment in policies and reforms One of the commonalities between most Asian governments is the dedicated commitment they have in using policies and initiatives
Power your way to higher yields
 Schroder Asian Income SGD Class Power your way to higher yields * Distributions at a variable percentage per annum of the net asset value per unit of the Schroder Asian Income SGD Class (the Fund ) will
Asset & Wealth Management Market Intelligence Digest Taiwan. Asset & Wealth Management Market Research Centre Asia Pacific
 Asset & Wealth Management Market Intelligence Digest Taiwan Asset & Wealth Management Market Research Centre Asia Pacific Summary table of contents Executive Summary 1.1 1.2 Introduction: Macroeconomic
Dreamscape Networks Limited (ASX: DN8) Maiden Full Year Results Presentation Year Ended 30 June 2017
 Maiden Full Year Results Presentation Year Ended 30 June 2017") Dreamscape Networks Limited (ASX: DN8) Maiden Full Year Results Presentation Year Ended 30 June 2017 1 Our Vision Providing simple, innovative and affordable Online Solutions that change lives 2 A Year
Dreamscape Networks Limited (ASX: DN8) Maiden Full Year Results Presentation Year Ended 30 June 2017 1 Our Vision Providing simple, innovative and affordable Online Solutions that change lives 2 A Year
Half-Year 2014 Analyst and Investor Presentation
 Half-Year 204 Analyst and Investor Presentation DKSH Holding Ltd. August, 204 Welcome to the DKSH Half-Year 204 Analyst and Investor Presentation Page 2 H 204: Growth in a challenging market environment
Investor Presentation
 Investor Presentation (NASDAQ: TRIP) Q3 2012 Safe Harbor Statement Forward-Looking Statements. Our presentation today, including the slides contained herein, contains "forward-looking statements" within
Power. Schroder Asian Income. your way to higher yields. p.a.
 Schroder Asian Income POTENTIAL PAYOUTS 6% PAID MONT HLY* p.a. Power your way to higher yields * It is Schroder Investment Management (Singapore) Ltd s (the Manager s ) current intention to declare distributions
Full year results presentation Year ended 31 March June 2018
 Full year results presentation Year ended 31 March 2018 7 June 2018 Disclaimer Not for publication, transmission, distribution or release, directly or indirectly, in or into any jurisdiction in which the
Introduction to Token Sales (ICO) Best Practices
 Best Practices") www.pwchk.com Introduction to Token Sales (ICO) Best Practices US$ million What is a token sale? A token sale also commonly referred to as a initial coin offering ( ICO ) * is a limited period of sale
www.pwchk.com Introduction to Token Sales (ICO) Best Practices US$ million What is a token sale? A token sale also commonly referred to as a initial coin offering ( ICO ) * is a limited period of sale
Preliminary Results. 22nd February 2018
 Preliminary Results 22nd February 2018 Mark Lewis Chief Executive Officer Matthew Price Chief Financial Officer Full year themes Diversified business delivering stable returns Doing a great job for our
SET Senior Executive Vice President Pakorn Peetathawatchai stated the Thai stock market s highlights in 2017 were as follows:
 SET News 2/2018 January 5, 2018 SET market report for December 20 BANGKOK, January 5, 2018 - The Stock Exchange of Thailand (SET) Index ended 20 at 1,753.71 points the year s closing high, up 13.7 percent
SET News 71/2017 September 8, SET market report for August SET Index closed at 1, points, up 4.7 pct from end-2016.
 SET News 71/20 September 8, 20 SET market report for August 20 - SET Index closed at 1,616.16 points, up 4.7 pct from end-2016. - Average daily securities trading value at THB 43.31 bln - Market cap at
Sustaining Resilience, Expanding Opportunities for Inclusive Growth
 1 Sustaining Resilience, Expanding Opportunities for Inclusive Growth Deputy Governor Diwa C. Guinigundo Bangko Sentral ng Pilipinas Source: Google images 2 PH emerges as growth leader in the ASEAN pack
August 2018 Company Overview
 August 2018 Company Overview SQUARE.COM/INVESTORS TWENTY MANNING Philadelphia, PA Cautionary statement This document contains forward-looking statements within the meaning of Section 27A of the Securities
German Investment Seminar 2011 Commerzbank AG New York January 10-11, 2011
 German Investment Seminar 2011 Commerzbank AG Mark Langer Chief Financial Officer Dennis Weber Head of Investor Relations New York January 10-11, 2011 German Investment Seminar, Commerzbank HUGO BOSS January
Clas Ohlson: Year-end report 1 May April 2013
 Clas Ohlson: Year-end report 1 May 2012 30 April 2013 Fourth quarter * Sales totalled SEK 1,274 M (1,272). In local currencies, growth was 3%. * Operating loss of SEK 19 M reported (profit: 10). * Loss
MARKET SUMMARY VIETNAM. Data snapshot. Business and economic growth. Small businesses that expect to grow in next 12 months (Vietnam against survey
 1 THE CPA AUSTRALIA ASIA-PACIFIC SMALL BUSINESS SURVEY - MARKET SUMMARY: VIETNAM MARKET SUMMARY VIETNAM Data snapshot Business and economic growth Small es that expect to grow in next 12 months (Vietnam
Wirecard AG Investor Presentation. 6 Months Results 2011
 Wirecard AG Investor Presentation 6 Months Results 2011 Agenda 1 2 3 Financial Data 2011 Wirecard AG 2 Key Figures 6 Months Results of Fiscal 2011/2010 6M/2011 6M/2010 Results Revenues EUR mn 147.9 123.8
Regional Financial Integration and Financial Regulatory Cooperation The Importance of Asia s Bond Markets Lotte Schou-Zibell, ADB
 Regional Financial Integration and Financial Regulatory Cooperation The Importance of Asia s Bond Markets Lotte Schou-Zibell, ADB Workshop: The Global Financial Crisis and the Reform of the Financial Regulatory
5 th ANNUAL SKBI CONFERENCE 2015ON "DIGITAL BANKING, FINANCIAL INCLUSION AND IMPACT INVESTING" P2P in China
 5 th ANNUAL SKBI CONFERENCE 2015ON "DIGITAL BANKING, FINANCIAL INCLUSION AND IMPACT INVESTING" P2P in China Dr. Rui, Oliver Meng(CFA, FRM) Professor of Finance and Accounting Director Ph.D. Program Co-director
Foreword 03. Limitations of Traditional Investment Platforms 04. PrimeLend Solution 05. How PrimeLend Works 06. Why Invest in PrimeLend 08
 Foreword 03 Limitations of Traditional Investment Platforms 04 PrimeLend Solution 05 How PrimeLend Works 06 Why Invest in PrimeLend 08 PrimeLend Services 09 Lending 10 Staking 11 Trading 11 PML: The Currency
TABLE OF CONTENT. 6. Affiliate 6.1. Career & Binary Plan. 1. Introduction / About COINZAI
 WHITEPAPER TABLE OF CONTENT 1. Introduction / About COINZAI 2. What is COINZAI? 2.1. COINZAI Eco System 2.2. Global Mission 3. Specification / Figures - Data - Facts 4. Initial Coin Offering (ICO) 4.1.
Travel Insurance and Assistance
 Travel Insurance and Assistance Worldwide research covering over 40 countries Series Prospectus Finaccord Web: www.finaccord.com. E-mail: info@finaccord.com 1 Prospectus contents Page What is the research?
MARKET RESEARCH REPORT
 Q1 MARKET RESEARCH REPORT 218 Report is prepared by Cryptology Labs: Konstantin Zherebtcov. Head of Cryptology Labs Daria Patanina. Analyst at Cryptology Labs cryptology.com Contents Total Market Capitalization
Foxtons Interim results presentation For the period ended June 2017
 Foxtons Interim results presentation For the period ended June 2017 Important information This presentation includes statements that are, or may be deemed to be, forward-looking statements. These forward-looking
Calculate Your Expenses
 Calculate Your Expenses Living Expenses Worksheet $ Mortgage payment $ Household (heat, water, etc.) $ Food (grocery and dining out) $ Car expenses (payment, gas) $ Entertainment $ Child care $ Education
Hürriyet Investor Presentation. July 2007
 Hürriyet Investor Presentation July 2007 1 Notice This presentation does not constitute an offer or invitation to purchase or subscription for any securities and no part of it shall form the basis of or
MARKET SUMMARY MALAYSIA. Data snapshot. Business and economic growth
 1 THE CPA AUSTRALIA ASIA-PACIFIC SMALL BUSINESS SURVEY - MARKET SUMMARY: MALAYSIA MARKET SUMMARY MALAYSIA Data snapshot Business and economic growth Small es that expect to grow in next 12 months (Malaysia
UNITED STATES SECURITIES AND EXCHANGE COMMISSION Washington, D.C
 UNITED STATES SECURITIES AND EXCHANGE COMMISSION Washington, D.C. 20549 FORM 20-F (Mark One) REGISTRATION STATEMENT PURSUANT TO SECTION 12(B) OR 12(G) OF THE SECURITIES EXCHANGE ACT OF 1934 OR ANNUAL REPORT
Investor Presentation
 14 MAR 2016 Investor Presentation 4Q and FY 2015 Results Hussein Hachem, CEO Bashar Obeid, CFO Management Update 4Q 2015 Results FY 2015 Results Long-term Performance Outlook & Guidance Page 1 Disclaimer
Asia Key Economic and Financial Indicators 20-Oct-16
 Asia Key Economic and Financial Indicators -Oct- ASEAN Brunei (BN) Cambodia (KH) Indonesia () Laos (LA) Malaysia () Myanmar (MM) Philippines () Singapore () Thailand () Vietnam () East Asia China (CN)
United Overseas Bank Investor Roadshow November 2006
 United Overseas Bank Investor Roadshow November 2006 Disclaimer : This material that follows is a presentation of general background information about the Bank s activities current at the date of the presentation.
David Craig CHIEF FINANCIAL OFFICER
 David Craig CHIEF FINANCIAL OFFICER 14 November 2007 Commonwealth Bank of Australia ACN 123 123 124 MORGAN STANLEY ASIA PACIFIC SUMMIT 2007 SINGAPORE Disclaimer The material that follows is a presentation
CN Xtrackers MSCI All China Equity ETF
 Xtrackers MSCI All China Equity ETF ETF.com segment: Equity: China - Total Market Competing ETFs: MCHI, GXC, ASHR, KBA, PEK Related ETF Channels: China, Total Market, Broad-based, Single Country, Vanilla,
Insurance 2020 & Beyond
 Insurance 2020 & Beyond México November, 2015 By. Stephen T. O Hearn Leader of the Global Insurance Practice Transformación del Sector Asegurador, más allá de la Regulación Research assessed 32 distinct
Spheria Australian Smaller Companies Fund
 29-Jun-18 $ 2.7686 $ 2.7603 $ 2.7520 28-Jun-18 $ 2.7764 $ 2.7681 $ 2.7598 27-Jun-18 $ 2.7804 $ 2.7721 $ 2.7638 26-Jun-18 $ 2.7857 $ 2.7774 $ 2.7690 25-Jun-18 $ 2.7931 $ 2.7848 $ 2.7764 22-Jun-18 $ 2.7771
World Bank Thailand Economic Monitor November Press Launch November 4, 2009
 World Bank Thailand Economic Monitor November 2009 Press Launch November 4, 2009 overview The Thai economy is rebounding from a rocky first half of 2009, but the medium-term outlook is uncertain. The Thai
Net Element Inc. (NASDAQ: NETE)
") NEW YORK SÃO PAULO TORONTO Research Note Inc. (NASDAQ: ) reported developments in both its Netevia platform and Unified Payments subsidiary. intends to improve reveneue generation by extending its Netevia
NEW YORK SÃO PAULO TORONTO Research Note Inc. (NASDAQ: ) reported developments in both its Netevia platform and Unified Payments subsidiary. intends to improve reveneue generation by extending its Netevia
S U M M A R Y. Table 1(a) : Monthly Import of Goods & Services Items
 : Monthly Import of Goods & Services Items") VI S U M M A R Y Table 1(a) : Monthly Import of Goods & Items (Million US$) August 2012 2011 I. Import Payments (Banks) 3,169 3,610 II. Freight & Insurance 190 217 III. Other Import unaccounted by Banks
VI S U M M A R Y Table 1(a) : Monthly Import of Goods & Items (Million US$) August 2012 2011 I. Import Payments (Banks) 3,169 3,610 II. Freight & Insurance 190 217 III. Other Import unaccounted by Banks
- SET Index closed at 1, points at the end of February, up 0.4 percent from the end of January, or up 6 percent from the end of 2014.
 SET News 29/2015 Mar 12, 2015 Thai bourse market report for February 2015 Bangkok, March 12, 2015 The Stock Exchange of Thailand (SET) main index ended February at 1,587.01 points, up 0.4 percent from
AIA MPF Happy Retirement Savings Program
 AIA MPF Happy Retirement Savings Program Make additional voluntary contributions to further grow your retirement reserve Please note: Happy Retirement Savings Program (the HRSP ) is not a savings plan.
70% 50% 2017 Rank Survey average
 1 THE CPA AUSTRALIA ASIA-PACIFIC SMALL BUSINESS SURVEY - MARKET SUMMARY: HONG KONG MARKET SUMMARY HONG KONG 5 Data snapshot Business and economic growth 90% Small es that expect to grow in next 12 months
icobench.com/report
 icobench.com/report report@icobench.com Introduction We are pleased to present special ICO Market New Year s Eve Review. New Year s Eve is an extraordinary day in the ICO world as the number of projects
June Hong Kong Jewellery& Gem Fair Exhibitor Survey Report
 June Hong Kong Jewellery& Gem Fair Exhibitor Survey Report 1 Survey Summary Total number of exhibitors: 1,979 Onsite survey Collected: 1,113 Onsite survey response rate: 56.2% [1,113 / 1,979] Online survey
Travel Insurance and Assistance
 Travel Insurance and Assistance Worldwide research covering over 40 countries Series Prospectus Finaccord Ltd., 2016 Web: www.finaccord.com. E-mail: info@finaccord.com 1 Prospectus contents Page What is
BÖRSER. Spend it, trade it, Or just receive dividends
 BÖRSER Spend it, trade it, Or just receive dividends INTRODUCTION Börser s concept wasn t created just to take advantage of the crypto boom, but instead it was created as a direct response to many existing
Benefits Communication Master Class April 2. Beyond a Two-Week Window: 10 ways to make annual enrollment a success in an era of health care reform
 Benefits Communication Master Class April 2 Beyond a Two-Week Window: 10 ways to make annual enrollment a success in an era of health care reform Thank you for joining! Benefits Communication Master Class
Presentation 22 August 2018
 Presentation 22 August 2018 Exceeded 3YP targets in 2017, but 2018 is challenging due to continued destocking, store closures and bankruptcies Profit attributable to shareholders (like-for-like) down 19%
TSXV: KASH OTCQB: HSSHF
 TSXV: KASH OTCQB: HSSHF Disclaimer and Forward-Looking Information Not for Distribution; No Offering This presentation and the material contained herein are confidential and are not to be disclosed to
Asia Key Economic and Financial Indicators 13-Jul-17
 Asia Key Economic and Financial Indicators -Jul-7 ASEAN Brunei (BN) Cambodia (KH) Indonesia () Laos (LA) Malaysia () Myanmar (MM) Philippines () Singapore () Thailand () Vietnam () East Asia China (CN)
Payment Painkillers for asian PsPs:
 Payment Painkillers for asian PsPs: identifying the opportunities and tackling the challenges for asian businesses making payments into europe the network for GloBal CommerCe PAYMENT PAINKILLERS FOR ASIAN
Presented by Chad Williams
 Presented by Chad Williams disclaimer The material in this presentation has been prepared by Red Cloud Klondike Strike Inc. ( Red Cloud ) and is general background information current as at the date of
For personal use only
 2016 Annual General Meeting 18 NOVEMBER 2016 YOUR BOARD Greg Ridder Ruslan Kogan David Shafer Harry Debney Independent, Non-Executive Chairman Founder & CEO CFO & COO Independent, Non-Executive Director
SIGNS. MICHAEL FERREIRA URBAN ANALYTICS INC. October 24, 2014
 SIGNS MICHAEL FERREIRA URBAN ANALYTICS INC. October 24, 2014 8.0 7.0 6.0 5.0 4.0 3.0 2.0 1.0 0.0-1.0 Jan-10 Mar-10 May-10 Jul-10 Sep-10 Nov-10 Jan-11 Mar-11 May-11 Jul-11 Sep-11 Nov-11 Jan-12 Mar-12 May-12