Austerity in the Aftermath of the Great Recession
|
|
|
- Alexis Greer
- 5 years ago
- Views:
Transcription
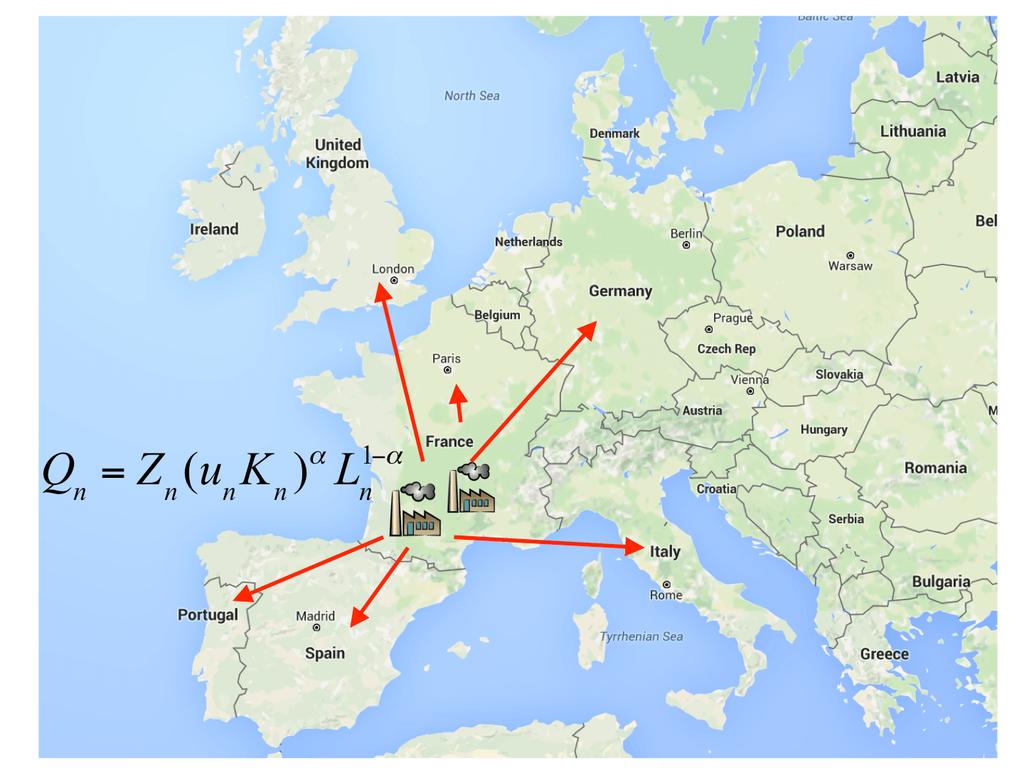
1 Austerity in the Aftermath of the Great Recession Christopher L. House University of Michigan and NBER. Christian Proebsting EPFL École Polytechnique Fédérale de Lausanne Linda Tesar University of Michigan and NBER. December 18, 2016

2 Real per Capita GDP US States 1
3 Research Design 1. Measuring austerity 2. Effects of austerity: Reduced-form estimates 3. Effects of austerity: Model-based estimates 2
4 Data Sample 28 European countries + US Unbalanced panel: Data sources: Eurostat, OECD, World Bank, BEA, National Statistical Agencies 3
5 Country Sample Country GDP Share Import Share XRT Regime Country GDP Share Import Share XRT Regime Belgium 2.6 % 31.3 % Euro Bulgaria 0.3 % 40.3 % Peg Germany 18.3 % 24.3 % Euro Denmark 1.7 % 26.9 % Peg Ireland 1.1 % 44.2 % Euro Estonia 0.1 % 42.2 % Peg Greece 1.9 % 25.5 % Euro Latvia 0.1 % 36.8 % Peg Spain 8.4 % 24.1 % Euro Lithuania 0.2 % 32.2 % Peg France 15.3 % 21.2 % Euro Czech Republic 1.0 % 37.1 % Floating Italy 12.5 % 22.0 % Euro Hungary 0.7 % 38.9 % Floating Cyprus 0.1 % 39.5 % Euro Poland 2.5 % 28.8 % Floating Luxembourg 0.2 % 56.9 % Euro Romania 0.9 % 28.2 % Floating Netherlands 4.1 % 21.0 % Euro Sweden 2.4 % 28.8 % Floating Austria 2.1 % 30.3 % Euro United Kingdom 15.4 % 23.9 % Floating Portugal 1.4 % 28.3 % Euro Norway 1.9 % 25.3 % Floating Slovenia 0.3 % 38.1 % Euro Switzerland 2.8 % 31.7 % Floating Slovak Republic 0.4 % 41.5 % Euro United States 91.5 % 13.3 % Floating Finland 1.3 % 27.5 % Euro RoW % 8.4 % Floating 4
6 Fiscal Austerity Fiscal measures Government purchases Total outlays Tax revenue and Tax rates Primary balance Identifying austerity Large changes in G or T (IMF) Narrative approach (Romer and Romer) SVAR approach (Mertens and Ravn) Forecast errors in G or T (Blanchard and Leigh) 5
7 Forecasting Government Purchase ln G i,t = ln G i,t 1 + g + γ ( ln ŶEU,t 1 ln Y i,t 1 ) + θ G ( ln Y i,t ln Ŷi,t) + ε G i,t g: EU-12 ave. GDP growth rate ( 93-05): 1.8% γ: GDP gap convergence: 3.8% θ G : Output elasticity: 0.38 (0.06) 6
8 Forecasting Government Purchases In-sample forecasts: t 2010 ln Ĝi,t = ln G i,t 1 + g + γ ( ln ŶEU,t 1 ln Y i,t 1 ) + θ G ( ) ln Y i,t ln Ŷi,t Out-of-sample forecasts: t > 2010 ln Ĝi,t = ln Ĝi,t 1 + g + γ ( ln ŶEU,t 1 ln Y i,t 1 ) + θ G ( ) ln Y i,t ln Ŷi,t 7
9 Forecasting Economic Performance GDP, Consumption and Investment ln Y i,t = ln Y i,t 1 + g Y + γ Y ( ln ŶEU,t 1 ln Y i,t 1 ) + ε Y i,t Inflation rate, Exchange rate, Net exports / GDP π i,t = π i, ε π i,t 8
 9")
10 Forecasts (1) 9
 10")
11 Forecasts (2) 10
12 Austerity & Economic Performance Average forecast error: X i, = t=2010 ( ln Xi,t ln X i,t ) Expressed in % of GDP for C, I and G X i, = α 0 + α G i, Γ controls i + ε i Controls: Forecast deviation of tax revenue in Debt-to-GDP prior to crisis (end of 2007) Change in TFP:
13 Austerity & Economic Performance X i, = α 0 + α G i, Γ controls i + ε i (1) (2) (3) (4) (5) Gov t. Purchases (0.36) (0.34) (0.31) (0.32) (0.31) Total Revenue (0.56) (0.49) Gov t Debt to GDP (0.02) (0.03) TFP (0.12) (0.14) R
14 Austerity & Economic Performance 13
15 All Countries By Currency Regime α R 2 α Fix α Fl R 2 GDP (0.31) (0.39) (0.57) Inflation (0.15) (0.20) (0.29) Consumption (0.27) (0.34) (0.49) Investment (0.23) (0.29) (0.42) NX to GDP (0.28) (0.34) (0.50) Exchange Rate (0.50) (0.46) (0.68) 14
16 Summary of Empirical Patterns 1. Low government purchases are correlated with (a)... low GDP, consumption, investment (b)... low inflation (c)... high net exports (d)... a depreciation of the exchange rate for floaters 2. Only weak relationship for most revenue measures 3. No evidence of strong spillover effects Spillover Analysis 15
17 Multi-Country DSGE Model Main Features Includes the 29 countries in the sample + RoW GHH preferences Rule-of-Thumb consumers Trade as in BKK (1994) Price rigidity (Calvo) Consumption, labor and capital taxes (const.) Financial accelerator (CF, BGG, Chicago Fed) Shocks: Government purchases, monetary policy, business credit spread 16
18 Households GHH preferences: U (c n, L n ) = 1 L 1+ 1 η n 1 1 c n κ n σ η 1 1 σ Rule-of-Thumb consumers A share χ of households spends a fixed share of their income on current consumption Aggregate consumption: c htm n,t C n Y n Y n,t C n,t = (1 χ) c n,t + χc htm n,t 17
19 18
20 18
21 18
22 18
23 18
24 18
25 18
26 18
27 Financial Market Imperferctions Nominal interest rate for business loans with (1 + i n,t ) F (λ n,t ) exp(ε F n,t) λ n,t = µ n,tk n,t NW n,t : Leverage ratio ε F n,t : Credit shock 19
28 Model Calibration Steady-state shares Relative country size Armington weights to match observed import shares Gov t purchases match observed GDP shares Effective tax rates (Mendoza et al., 1994) Share Rule of Thumb: 50% Elasticities Trade elasticity: 0.50 Price rigidity: 0.80 (quarterly) Taylor rule: φ GDP = 0.5, φ π = 1.5 Calibration 20
29 Model Simulation Government purchase shocks: As measured in empirical section Monetary policy shocks: Deviations from Taylor rule (intercept estimated for each monetary authority) Business credit spread shocks: Spreads between lending rates and central bank interest rates Simulated period: 2005:1-2014:4 Cross-sectional analysis: 2010:1-2014:4 21
30 GDP 22
31 Inflation 22
32 Net exports 22
33 Data Benchmark α α Fix α Fl α α Fix α Fl GDP (0.26) (0.31) (0.51) Inflation (0.13) (0.16) (0.25) Consumption (0.22) (0.27) (0.43) Investment (0.19) (0.23) (0.37) Net Exports over GDP (0.24) (0.27) (0.44) Exchange Rate (0.42) (0.37) (0.60) 23
34 Data G shocks only α α Fix α Fl α α Fix α Fl GDP (0.26) (0.31) (0.51) Inflation (0.13) (0.16) (0.25) Consumption (0.22) (0.27) (0.43) Investment (0.19) (0.23) (0.37) Net Exports over GDP (0.24) (0.27) (0.44) Exchange Rate (0.42) (0.37) (0.60) 23
35 Data Money shocks only α α Fix α Fl α α Fix α Fl GDP (0.26) (0.31) (0.51) Inflation (0.13) (0.16) (0.25) Consumption (0.22) (0.27) (0.43) Investment (0.19) (0.23) (0.37) Net Exports over GDP (0.24) (0.27) (0.44) Exchange Rate (0.42) (0.37) (0.60) 23
36 Model vs. Data Model matches cross-sectional dimension of data quite well! Rule-of-thumb restriction gives realistic consumption response Financial accelerator less successful in generating investment response Austerity shocks account for most of the cross-sectional variation in the data Money shocks important for response of inflation for floaters 24
37 Model Variation Data Bench- mark Low price rigidity Pass Mon Pol ZLB All GDP Inflation Fixed GDP Inflation Floaters GDP Inflation
38 Effect of a ZLB 26
39 Model Variation Data Benchmark No RoTh Sep Pref Hi Trade Elas No Trade All GDP Inflation Fixed GDP Inflation Floaters GDP Inflation
40 Model Mechanism Rule-of-Thumb consumers amplify NK multiplier through reductions in C Reductions in C lead to countervailing wealth effect on labor supply Kill off wealth effect through GHH preferences Openness lets G shocks leak out Low trade elasticity prevents exports to substitute for G 28
41 Shortfall as of 2014:4 Data Benchmark No Austerity ZLB ZLB + No Austerity Euro area GDP Inflation Floaters GDP Inflation GIIPS GDP Inflation EU10 GDP Inflation
42 Debt to GDP Debt / GDP (2009): EU10-80% GIIPS - 95% Did austerity reduce debt-to-gdp ratios? Static view: Simply sum up savings of reducing G Model: G affects GDP and hence, tax revenues Countries are linked through trade and monetary policy 30
43 Debt to GDP 31
44 Conclusion Observed divergent economic performance across Europe since Are policy reactions to blame? Measured austerity (shortfalls in G) associated with low economic activity, low inflation and positive net exports. Multi-country DSGE model with monetary responses, trade and foreign exchange regimes. Quantitative predictions of model consistent with cross-sectional and time-series patterns in the data. Output would have been 13% higher in GIIPS and 5% higher in EU10 by 2014 without austerity. 32

45 US States Back 33
46 Spillovers Following Auerbach and Gorodnichenko (2012): X i, = α 0 + α Gshock i + α Gshocki + ε i Domestic shock: Spillover shock: Gshock i = Y i Imp i Y i G i, Gshock i = N j i Imp i j Y j Y j Y i G j,
47 Spillovers Back 35
48 Description Parameter Value Source Preferences Discount factor (quarterly) β 0.99 Standard value 1 Coefficient of relative risk aversion σ 2 Standard value Frisch elasticity of labor supply η 1 Barsky et al. (1997) Share of rule-of-thumb consumers χ 0.5 Campbell and Mankiw (1989), Martin and Philippon (2014) Trade and Country Size Trade preference weights ωn j x OECD Trade in Value Added Dataset Trade demand elasticity ψ y 0.5 e.g. Heathcote and Perri (2002), Cravino (2014), Proebsting (2015) Country size N ny n x OECD Input-Output Tables Technology Capital share α 0.38 Trabandt and Uhlig (2011) Depreciation (quarterly) δ Average private investment share, X/Y = 0.197, Utilization cost a Del Negro et al. (2013) Investment adjustment cost f 2.48 Christiano et al. (2005) Elasticity of substitution between varieties ψ q 10 Standard value Price Rigidity Sticky price probability θ p 0.80 Alvarez et al. (2006) Financial Market Imperfections SS External finance premium F n(λ ss) x ECB, Global Financial Database and national sources Elasitcity external finance premium F ɛ 0.20 Brave et al. (2012) Persistence spread shock ρ F 0.99 Brave et al. (2012) Fiscal and Monetary Policy Gn Gov t purchases over final demand Yn x OECD and Eurostat Persistence government spending shock ρ G 0.93 Del Negro et al. (2013) Labor and Capital tax rates τ L, τ K x Own calculations based on National Tax Lists Consumption tax rates τ C x Own calculation based on Eurostat data Taylor rule persistence φ i 0.75 Taylor rule GDP coefficient φ GDP 0.5 Taylor rule inflation coefficient φ π 0.5 Back 36
Gernot Müller (University of Bonn, CEPR, and Ifo)
") Exchange rate regimes and fiscal multipliers Benjamin Born (Ifo Institute) Falko Jüßen (TU Dortmund and IZA) Gernot Müller (University of Bonn, CEPR, and Ifo) Fiscal Policy in the Aftermath of the Financial
Exchange rate regimes and fiscal multipliers Benjamin Born (Ifo Institute) Falko Jüßen (TU Dortmund and IZA) Gernot Müller (University of Bonn, CEPR, and Ifo) Fiscal Policy in the Aftermath of the Financial
IMPLICATIONS OF LOW PRODUCTIVITY GROWTH FOR DEBT SUSTAINABILITY
 IMPLICATIONS OF LOW PRODUCTIVITY GROWTH FOR DEBT SUSTAINABILITY Neil R. Mehrotra Brown University Peterson Institute for International Economics November 9th, 2017 1 / 13 PUBLIC DEBT AND PRODUCTIVITY GROWTH
University of Rijeka Faculty of Economics Rijeka. PhD RESEARCH PROPOSAL
 University of Rijeka Faculty of Economics Rijeka PhD RESEARCH PROPOSAL Macroeconomic effects of fiscal policy in a small open economy: case of Croatia Milan Deskar-Škrbić PhD Candidate Rijeka, October
EMPLOYMENT RATE IN EU-COUNTRIES 2000 Employed/Working age population (15-64 years)
") EMPLOYMENT RATE IN EU-COUNTRIES 2 Employed/Working age population (15-64 years EU-15 Denmark Netherlands Great Britain Sweden Portugal Finland Austria Germany Ireland Luxembourg France Belgium Greece Spain
EMPLOYMENT RATE IN EU-COUNTRIES 2 Employed/Working age population (15-64 years EU-15 Denmark Netherlands Great Britain Sweden Portugal Finland Austria Germany Ireland Luxembourg France Belgium Greece Spain
Live Long and Prosper? Demographic Change and Europe s Pensions Crisis. Dr. Jochen Pimpertz Brussels, 10 November 2015
 Live Long and Prosper? Demographic Change and Europe s Pensions Crisis Dr. Jochen Pimpertz Brussels, 10 November 2015 Old-age-dependency ratio, EU28 45,9 49,4 50,2 39,0 27,5 31,8 2013 2020 2030 2040 2050
EU BUDGET AND NATIONAL BUDGETS
 DIRECTORATE GENERAL FOR INTERNAL POLICIES POLICY DEPARTMENT ON BUDGETARY AFFAIRS EU BUDGET AND NATIONAL BUDGETS 1999-2009 October 2010 INDEX Foreward 3 Table 1. EU and National budgets 1999-2009; EU-27
EMPLOYMENT RATE Employed/Working age population (15 64 years)
") EMPLOYMENT RATE 198 26 Employed/Working age population (15 64 years 8 % Finland 75 EU 15 EU 25 7 65 6 55 5 8 82 84 86 88 9 92 94 96 98 2 4** 6** 14.4.25/SAK /TL Source: European Commission 1 UNEMPLOYMENT
EMPLOYMENT RATE 198 26 Employed/Working age population (15 64 years 8 % Finland 75 EU 15 EU 25 7 65 6 55 5 8 82 84 86 88 9 92 94 96 98 2 4** 6** 14.4.25/SAK /TL Source: European Commission 1 UNEMPLOYMENT
EU-28 RECOVERED PAPER STATISTICS. Mr. Giampiero MAGNAGHI On behalf of EuRIC
 EU-28 RECOVERED PAPER STATISTICS Mr. Giampiero MAGNAGHI On behalf of EuRIC CONTENTS EU-28 Paper and Board: Consumption and Production EU-28 Recovered Paper: Effective Consumption and Collection EU-28 -
The design of the funding scheme of social security systems and its role in macroeconomic stabilization
 The design of the funding scheme of social security systems and its role in macroeconomic stabilization Simon Voigts (work in progress) SFB 649 Motzen conference 214 Overview 1 Motivation and results 2
PUBLIC PROCUREMENT INDICATORS 2011, Brussels, 5 December 2012
 PUBLIC PROCUREMENT INDICATORS 2011, Brussels, 5 December 2012 1. INTRODUCTION This document provides estimates of three indicators of performance in public procurement within the EU. The indicators are
EMPLOYMENT RATE Employed/Working age population (15-64 years)
") 1 EMPLOYMENT RATE 1980-2003 Employed/Working age population (15-64 years 80 % Finland (Com 75 70 65 60 EU-15 Finland (Stat. Fin. 55 50 80 82 84 86 88 90 92 94 96 98 00 02 9.9.2002/SAK /TL Source: European
1 EMPLOYMENT RATE 1980-2003 Employed/Working age population (15-64 years 80 % Finland (Com 75 70 65 60 EU-15 Finland (Stat. Fin. 55 50 80 82 84 86 88 90 92 94 96 98 00 02 9.9.2002/SAK /TL Source: European
Fiscal devaluation and Economic Activity in the EU
 Fiscal devaluation and Economic Activity in the EU Piotr Ciżkowicz*, Bartosz Radzikowski**, Andrzej Rzońca*, Wiktor Wojciechowski* *Warsaw School of Economics, **Centrum for Social and Economic Research
DG TAXUD. STAT/11/100 1 July 2011
 DG TAXUD STAT/11/100 1 July 2011 Taxation trends in the European Union Recession drove EU27 overall tax revenue down to 38.4% of GDP in 2009 Half of the Member States hiked the standard rate of VAT since
Empirical appendix of Public Expenditure Distribution, Voting, and Growth
 Empirical appendix of Public Expenditure Distribution, Voting, and Growth Lorenzo Burlon August 11, 2014 In this note we report the empirical exercises we conducted to motivate the theoretical insights
The marginal cost of public funds in the EU The case of labour taxes versus green taxes Salvador Barrios, Jonathan Pycroft, Bert Saveyn
 The marginal cost of public funds in the EU The case of labour taxes versus green taxes Salvador Barrios, Jonathan Pycroft, Bert Saveyn presented by Jonathan Pycroft European Commission Directorate General
STAT/12/ October Household saving rate fell in the euro area and remained stable in the EU27. Household saving rate (seasonally adjusted)
") STAT/12/152 30 October 2012 Quarterly Sector Accounts: second quarter of 2012 Household saving rate down to 12.9% in the euro area and stable at 11. in the EU27 Household real income per capita fell by
STAT/12/152 30 October 2012 Quarterly Sector Accounts: second quarter of 2012 Household saving rate down to 12.9% in the euro area and stable at 11. in the EU27 Household real income per capita fell by
Fiscal rules in Lithuania
 Fiscal rules in Lithuania Algimantas Rimkūnas Vice Minister, Ministry of Finance of Lithuania 3 June, 2016 Evolution of National and EU Fiscal Regulations Stability and Growth Pact (SGP) Maastricht Treaty
EUROPA - Press Releases - Taxation trends in the European Union EU27 tax...of GDP in 2008 Steady decline in top corporate income tax rate since 2000
 DG TAXUD STAT/10/95 28 June 2010 Taxation trends in the European Union EU27 tax ratio fell to 39.3% of GDP in 2008 Steady decline in top corporate income tax rate since 2000 The overall tax-to-gdp ratio1
EU KLEMS Growth and Productivity Accounts March 2011 Update of the November 2009 release
 EU KLEMS Growth and Productivity Accounts March 2011 Update of the November 2009 release Description of methodology and country notes Prepared by Reitze Gouma, Klaas de Vries and Astrid van der Veen-Mooij
HOUSEHOLDS LENDING MARKET IN THE ENLARGED EUROPE. Debora Revoltella and Fabio Mucci copyright with the author New Europe Research
 HOUSEHOLDS LENDING MARKET IN THE ENLARGED EUROPE Debora Revoltella and Fabio Mucci copyright with the author New Europe Research ECFin Workshop on Housing and mortgage markets and the EU economy, Brussels,
DANMARKS NATIONALBANK
 DANMARKS NATIONALBANK WEALTH, DEBT AND MACROECONOMIC STABILITY Niels Lynggård Hansen, Head of Economics and Monetary Policy. IARIW, Copenhagen, 21 August 2018 Agenda Descriptive evidence on household debt
Approach to Employment Injury (EI) compensation benefits in the EU and OECD
 compensation benefits in the EU and OECD") Approach to (EI) compensation benefits in the EU and OECD The benefits of protection can be divided in three main groups. The cash benefits include disability pensions, survivor's pensions and other short-
Approach to (EI) compensation benefits in the EU and OECD The benefits of protection can be divided in three main groups. The cash benefits include disability pensions, survivor's pensions and other short-
The macroeconomic effects of a carbon tax in the Netherlands Íde Kearney, 13 th September 2018.
 The macroeconomic effects of a carbon tax in the Netherlands Íde Kearney, th September 08. This note reports estimates of the economic impact of introducing a carbon tax of 50 per ton of CO in the Netherlands.
THE IMPACT OF THE PUBLIC DEBT STRUCTURE IN THE EUROPEAN UNION MEMBER COUNTRIES ON THE POSSIBILITY OF DEBT OVERHANG
 THE IMPACT OF THE PUBLIC DEBT STRUCTURE IN THE EUROPEAN UNION MEMBER COUNTRIES ON THE POSSIBILITY OF DEBT OVERHANG Robert Huterski, PhD Nicolaus Copernicus University in Toruń Faculty of Economic Sciences
Summary of the CEER Report on Investment Conditions in European Countries
 Summary of the CEER Report on Investment Conditions in European Countries Ref: C17-IRB-30-03 11 th December 2017 Regulatory aspects of Energy Investment Conditions in European Countries 1 Introduction
Growth in OECD Unit Labour Costs slows to 0.4% in the third quarter of 2016
 Growth in OECD Unit Labour Costs slows to.4% in the third quarter of 26 Growth in unit labour costs (ULCs) in the OECD area slowed to.4% in the third quarter of 26 (compared with.6% in the previous quarter)
How does labour market structure affect the response of economies to shocks?
 How does labour market structure affect the response of economies to shocks? Stephen Millard Bank of England, Durham University Business School and the Centre for Macroeconomics (with Aurelijus Dabusinskas
Risky Mortgages in a DSGE Model
 1 / 29 Risky Mortgages in a DSGE Model Chiara Forlati 1 Luisa Lambertini 1 1 École Polytechnique Fédérale de Lausanne CMSG November 6, 21 2 / 29 Motivation The global financial crisis started with an increase
Saving Europe? Some Unpleasant Supply-Side Arithmetic of Fiscal Austerity
 Saving Europe? Some Unpleasant Supply-Side Arithmetic of Fiscal Austerity Enrique G. Mendoza University of Pennsylvania and NBER Linda L. Tesar University of Michigan and NBER Jing Zhang University of
On the Merits of Conventional vs Unconventional Fiscal Policy
 On the Merits of Conventional vs Unconventional Fiscal Policy Matthieu Lemoine and Jesper Lindé Banque de France and Sveriges Riksbank The views expressed in this paper do not necessarily reflect those
Consumer Credit. Introduction. June, the 6th (2013)
") Consumer Credit in Europe at end-2012 Introduction Crédit Agricole Consumer Finance has published its annual survey of the consumer credit market in 27 European Union countries (EU-27) for the sixth year
Consumer Credit in Europe at end-2012 Introduction Crédit Agricole Consumer Finance has published its annual survey of the consumer credit market in 27 European Union countries (EU-27) for the sixth year
Updates and revisions of national SUTs for the November 2013 release of the WIOD
 Updates and revisions of national SUTs for the November 2013 release of the WIOD Edited by Marcel Timmer (University of Groningen) With contributions from: Abdul A. Erumban, Reitze Gouma and Gaaitzen J.
Burden of Taxation: International Comparisons
 Burden of Taxation: International Comparisons Standard Note: SN/EP/3235 Last updated: 15 October 2008 Author: Bryn Morgan Economic Policy & Statistics Section This note presents data comparing the national
Taxation trends in the European Union Further increase in VAT rates in 2012 Corporate and top personal income tax rates inch up after long decline
 STAT/12/77 21 May 2012 Taxation trends in the European Union Further increase in VAT rates in 2012 Corporate and top personal income tax rates inch up after long decline The average standard VAT rate 1
European Advertising Business Climate Index Q4 2016/Q #AdIndex2017
 European Advertising Business Climate Index Q4 216/Q1 217 ABOUT Quarterly survey of European advertising and market research companies Provides information about: managers assessment of their business
Constraints on Exchange Rate Flexibility in Transition Economies: a Meta-Regression Analysis of Exchange Rate Pass-Through
 Constraints on Exchange Rate Flexibility in Transition Economies: a Meta-Regression Analysis of Exchange Rate Pass-Through Igor Velickovski & Geoffrey Pugh Applied Economics 43 (27), 2011 National Bank
NOTE. for the Interparliamentary Meeting of the Committee on Budgets
 NOTE for the Interparliamentary Meeting of the Committee on Budgets THE ROLE OF THE EU BUDGET TO SUPPORT MEMBER STATES IN ACHIEVING THEIR ECONOMIC OBJECTIVES AS AGREED WITHIN THE FRAMEWORK OF THE EUROPEAN
REPORT FROM THE COMMISSION TO THE EUROPEAN PARLIAMENT, THE COUNCIL, THE EUROPEAN ECONOMIC AND SOCIAL COMMITTEE AND THE COMMITTEE OF THE REGIONS
 EUROPEAN COMMISSION Brussels,.4.29 COM(28) 86 final/ 2 ANNEXES to 3 ANNEX to the REPORT FROM THE COMMISSION TO THE EUROPEAN PARLIAMENT, THE COUNCIL, THE EUROPEAN ECONOMIC AND SOCIAL COMMITTEE AND THE COMMITTEE
Lowest implicit tax rates on labour in Malta, on consumption in Spain and on capital in Lithuania
 STAT/13/68 29 April 2013 Taxation trends in the European Union The overall tax-to-gdp ratio in the EU27 up to 38.8% of GDP in 2011 Labour taxes remain major source of tax revenue The overall tax-to-gdp
First estimate for 2011 Euro area external trade deficit 7.7 bn euro bn euro deficit for EU27
 27/2012-15 February 2012 First estimate for 2011 Euro area external trade deficit 7.7 152.8 deficit for EU27 The first estimate for the euro area 1 (EA17) trade in goods balance with the rest of the world
May 2012 Euro area international trade in goods surplus of 6.9 bn euro 3.8 bn euro deficit for EU27
 108/2012-16 July 2012 May 2012 Euro area international trade in goods surplus of 6.9 3.8 deficit for EU27 The first estimate for the euro area 1 (EA17) trade in goods balance with the rest of the world
Courthouse News Service
 14/2009-30 January 2009 Sector Accounts: Third quarter of 2008 Household saving rate at 14.4% in the euro area and 10.7% in the EU27 Business investment rate at 23.5% in the euro area and 23.6% in the
Table 1. Statutory tax rates on capital income.
 Table 1. Statutory tax rates on capital income. Tax rate on retained corporate income (%) 1 Top personal tax rate on interest income (%) 2 1985 1999 Change 1985-99 1985 1998 Change 1985-98 Small Countries
June 2012 Euro area international trade in goods surplus of 14.9 bn euro 0.4 bn euro surplus for EU27
 121/2012-17 August 2012 June 2012 Euro area international trade in goods surplus of 14.9 0.4 surplus for EU27 The first estimate for the euro area 1 (EA17) trade in goods balance with the rest of the world
January 2014 Euro area international trade in goods surplus 0.9 bn euro 13.0 bn euro deficit for EU28
 STAT/14/41 18 March 2014 January 2014 Euro area international trade in goods surplus 0.9 13.0 deficit for EU28 The first estimate for the euro area 1 (EA18) trade in goods balance with the rest of the
August 2012 Euro area international trade in goods surplus of 6.6 bn euro 12.6 bn euro deficit for EU27
 146/2012-16 October 2012 August 2012 Euro area international trade in goods surplus of 6.6 12.6 deficit for EU27 The first estimate for the euro area 1 (EA17) trade in goods balance with the rest of the
Macroeconomic scenarios for skill demand and supply projections, including dealing with the recession
 Alphametrics (AM) Alphametrics Ltd Macroeconomic scenarios for skill demand and supply projections, including dealing with the recession Paper presented at Skillsnet technical workshop on: Forecasting
CFA Institute Member Poll: Euro zone Stability Bonds
 CFA Institute Member Poll: Euro zone Stability Bonds I. About the Survey... 2 a. Background... 2 b. Purpose and Methodology... 2 II. Full Results... 2 Q1: Requirement of common issuance of sovereign bonds...
World Economic Outlook Central Europe and Baltic Countries
 World Economic Outlook Central Europe and Baltic Countries Presentation by Susan Schadler and Christoph Rosenberg September 5 World growth returns to trend. (World real GDP growth, annual percent change)
Chart pack to council for cooperation on macroprudential policy
 Chart pack to council for cooperation on macroprudential policy Contents List of charts... 3 Macro and macro-financial setting... 5 Swedish macroeconomic setting... 5 Foreign macroeconomic setting... Macro-financial
2017 Figures summary 1
 Annual Press Conference on January 18 th 2018 EIB Group Results 2017 2017 Figures summary 1 European Investment Bank (EIB) financing EUR 69.88 billion signed European Investment Fund (EIF) financing EUR
Capital Controls and Optimal Chinese Monetary Policy 1
 Capital Controls and Optimal Chinese Monetary Policy 1 Chun Chang a Zheng Liu b Mark Spiegel b a Shanghai Advanced Institute of Finance b Federal Reserve Bank of San Francisco International Monetary Fund
Households capital available for renovation
 Households capital available for Methodical note Copenhagen Economics, 22 February 207 The task at hand has been twofold: firstly, we were to calculate an estimate of households average capital available
Electricity & Gas Prices in Ireland. Annex Business Electricity Prices per kwh 2 nd Semester (July December) 2016
 2016") Electricity & Gas Prices in Ireland Annex Business Electricity Prices per kwh 2 nd Semester (July December) 2016 ENERGY POLICY STATISTICAL SUPPORT UNIT 1 Electricity & Gas Prices in Ireland Annex Business
Electricity & Gas Prices in Ireland Annex Business Electricity Prices per kwh 2 nd Semester (July December) 2016 ENERGY POLICY STATISTICAL SUPPORT UNIT 1 Electricity & Gas Prices in Ireland Annex Business
The Cyprus Economy: from Recovery to Sustainable Growth. Vincenzo Guzzo Resident Representative in Cyprus
 The Economy: from Recovery to Sustainable Growth Vincenzo Guzzo Resident Representative in Growth momentum remains strong 18 : Real GDP ( billion) 1 Deviation from Pre-Crisis Level and Trend (Percent)
THE EU S ECONOMIC RECOVERY PICKS UP MOMENTUM
 THE EU S ECONOMIC RECOVERY PICKS UP MOMENTUM ECONOMIC SITUATION The EU economy saw a pick-up in growth momentum at the beginning of this year, boosted by strong business and consumer confidence. Output
CANADA EUROPEAN UNION
 THE EUROPEAN UNION S PROFILE Economic Indicators Gross domestic product (GDP) at purchasing power parity (PPP): US$20.3 trillion (2016) GDP per capita at PPP: US$39,600 (2016) Population: 511.5 million
Consumer credit market in Europe 2013 overview
 Consumer credit market in Europe 2013 overview Crédit Agricole Consumer Finance published its annual survey of the consumer credit market in 28 European Union countries for seven years running. 9 July
Prudential Policy For Peggers
 Prudential Policy For Peggers Stephanie Schmitt-Grohé Martín Uribe Columbia University May 12, 2013 1 Motivation Typically, currency pegs are part of broader reform packages that include free capital mobility.
June 2014 Euro area international trade in goods surplus 16.8 bn 2.9 bn surplus for EU28
 127/2014-18 August 2014 June 2014 Euro area international trade in goods surplus 16.8 bn 2.9 bn surplus for EU28 The first estimate for the euro area 1 (EA18) trade in goods balance with the rest of the
Quarterly Financial Accounts Household net worth reaches new peak in Q Irish Household Net Worth
 Quarterly Financial Accounts Q4 2017 4 May 2018 Quarterly Financial Accounts Household net worth reaches new peak in Q4 2017 Household net worth rose by 2.1 per cent in Q4 2017. It now exceeds its pre-crisis
The Euro and the New Member States
 The Euro and the New Member States Natalia Tamirisa International Monetary Fund Warsaw, October 29, 2007 Focus Macroeconomic challenges NMS face as they prepare to join EMU Policies that can help overcome
How to complete a payment application form (NI)
") How to complete a payment application form (NI) This form should be used for making a payment from a Northern Ireland Ulster Bank account. 1. Applicant Details If you are a signal number indemnity holder,
How to complete a payment application form (NI) This form should be used for making a payment from a Northern Ireland Ulster Bank account. 1. Applicant Details If you are a signal number indemnity holder,
Probably Too Little, Certainly Too Late. An Assessment of the Juncker Investment Plan
 Probably Too Little, Certainly Too Late. An Assessment of the Juncker Investment Plan Mathilde Le Moigne 1 Francesco Saraceno 2,3 Sébastien Villemot 2 1 École Normale Supérieure 2 OFCE Sciences Po 3 LUISS-SEP
PREZENTĀCIJAS NOSAUKUMS
 Which Structural Reforms Matter for economic growth: PREZENTĀCIJAS NOSAUKUMS Evidence from Bayesian Model Averaging Olegs Krasnopjorovs (Latvijas Banka) 2 nd Lisbon Conference on Structural Reforms 06.07.2017
Source OECD HEALTH DATA 2010, October
 Impacte de la crisi econòmica sobre la salut i els Sistemes Sanitaris a Europa Terrassa, 15 th November 2011 Josep Figueras www.healthobservatory.eu Total Health Expenditure % GDP (1975-2010) 11 % GDP
Jesús Crespo-Cuaresma Vienna University of Economics and Business. Octavio Fernández-Amador Johannes Kepler University Linz
 Business Cycle Convergence in EMU: A Second Look at the Second Moment Jesús Crespo-Cuaresma Vienna University of Economics and Business Octavio Fernández-Amador Johannes Kepler University Linz OUTLINE
Quarterly Gross Domestic Product of Montenegro 2st quarter 2016
 Government of Montenegro Statistical Office of Montenegro Quarterly Gross Domestic Product of Montenegro 2st quarter 2016 The release presents the preliminary data for quarterly gross domestic product
Quarterly Gross Domestic Product of Montenegro 3 rd quarter 2017
 MONTENEGRO STATISTICAL OFFICE R E L E A S E No: 224 Podgorica, 22 December 2017 When using the data, please name the source Quarterly Gross Domestic Product of Montenegro 3 rd quarter 2017 The release
Report Penalties and measures imposed under the UCITS Directive in 2016 and 2017
 Report Penalties and measures imposed under the Directive in 206 and 207 4 April 209 ESMA34-45-65 4 April 209 ESMA34-45-65 Table of Contents Executive Summary... 3 2 Background and relevant regulatory
DETERMINANT FACTORS OF FDI IN DEVELOPED AND DEVELOPING COUNTRIES IN THE E.U.
 Diana D. COCONOIU Bucharest University of Economic Studies, Dimitrie Cantemir Christian University, DETERMINANT FACTORS OF FDI IN DEVELOPED AND DEVELOPING COUNTRIES IN THE E.U. Statistical analysis Keywords
The Social Sectors from Crisis to Growth in Latvia
 The World Bank The Social Sectors from Crisis to Growth in Latvia March 1, 2011 Peter Harrold, Indhira Santos and Emily Sinnott, The World Bank, Brussels Overview 1. World Bank involvement in stabilization
34 th Associates Meeting - Andorra, 25 May Item 5: Evolution of economic governance in the EU
 34 th Associates Meeting - Andorra, 25 May 2012 - Item 5: Evolution of economic governance in the EU Plan of the Presentation 1. Fiscal and economic coordination: how did it start? 2. Did it work? 3. Five
Source OECD HEALTH DATA 2010, October
 Financial Crisis in the EU countries Health impact Health Systems Response A framework for decision making Lisbon, 11 th January 2012 Josep Figueras www.healthobservatory.eu Total Health Expenditure %
Downward Nominal Wage Rigidity Currency Pegs And Involuntary Unemployment
 Downward Nominal Wage Rigidity Currency Pegs And Involuntary Unemployment Stephanie Schmitt-Grohé Martín Uribe Columbia University August 18, 2013 1 Motivation Typically, currency pegs are part of broader
PENSIONS IN OECD COUNTRIES: INDICATORS AND DEVELOPMENTS
 PENSIONS IN OECD COUNTRIES: INDICATORS AND DEVELOPMENTS Marius Lüske Directorate for Employment, Labour and Social Affairs, OECD Lisbon, 28.09.2018 Marius.LUSKE@oecd.org www.oecd.org/els OUTLINE Talk based
Second estimate for the third quarter of 2008 EU27 current account deficit 39.5 bn euro 19.3 bn euro surplus on trade in services
 STAT/09/12 22 January 2009 Second estimate for the third quarter of 20 EU27 current account deficit 39.5 bn euro 19.3 bn euro surplus on trade in According to the latest revisions1, the EU272 external
Social Situation Monitor - Glossary
 Social Situation Monitor - Glossary Active labour market policies Measures aimed at improving recipients prospects of finding gainful employment or increasing their earnings capacity or, in the case of
EU Pension Trends. Matti Leppälä, Secretary General / CEO PensionsEurope 16 October 2014 Rovinj, Croatia
 EU Pension Trends Matti Leppälä, Secretary General / CEO PensionsEurope 16 October 2014 Rovinj, Croatia 1 Lähde: World Bank 2 Pension debt big (implicit debt, % of GDP, 2006) Source:Müller, Raffelhüschen
Distribution Capital and the Short and Long Run Import Demand Elasticity M.J. Crucini and J.S. Davis
 Distribution Capital and the Short and Long Run Import Demand Elasticity M.J. Crucini and J.S. Davis Discussant: Andrea Rao Board of Governors of the Federal Reserve System CD (2012): Motivation The trade
Turkish Economic Review Volume 3 March 2016 Issue 1
 www.kspjournals.org Volume 3 March 2016 Issue 1 Tax Losses due to Shadow Economy Activities in OECD Countries from 2011 to 2013: A preliminary calculation By Friedrich SCHNEIDER a Abstract. In this short
The Swedish approach to capital requirements in CRD IV
 The Swedish approach to capital requirements in CRD IV State Secretary Johanna Lybeck Lilja The aim of capital requirements Enhancing growth creating potential of a integrated, stable financial system
Explaining International Business Cycle Synchronization: Recursive Preferences and the Terms of Trade Channel
 1 Explaining International Business Cycle Synchronization: Recursive Preferences and the Terms of Trade Channel Robert Kollmann Université Libre de Bruxelles & CEPR World business cycle : High cross-country
THE FUTURE OF CASH AND PAYMENTS
 THE FUTURE OF CASH AND PAYMENTS Retail Banking Research January 2010 CONFIDENTIALITY AND COPYRIGHT This report is published by Retail Banking Research Ltd (RBR). The information and data within this report
Analysis of European Union Economy in Terms of GDP Components
 Expert Journal of Economic s (2 0 1 3 ) 1, 13-18 2013 Th e Au thor. Publish ed by Sp rint In v estify. Econ omics.exp ertjou rn a ls.com Analysis of European Union Economy in Terms of GDP Components Simona
Optimal fiscal policy
 Optimal fiscal policy Jasper Lukkezen Coen Teulings Overview Aim Optimal policy rule for fiscal policy How? Four building blocks: 1. Linear VAR model 2. Augmented by linearized equation for debt dynamics
Macroeconomic overview SEE and Macedonia
 Macroeconomic overview SEE and Macedonia Zoltan Arokszallasi Chief Analyst, Macro & FX/FI Research Erste Group Bank Erste Investors Breakfast, 29 September, Skopje 02. Oktober SEE shows mixed performance
Everything you always wanted to know about Basel II in 15 minutes
 Everything you always wanted to know about Basel II in 15 minutes (a real estate perspective) Erik Kersten Senior Policy Advisor Supervisory Policy Quantitative Risk Management Views and opinions expressed
Heterogeneous Firm, Financial Market Integration and International Risk Sharing
 Heterogeneous Firm, Financial Market Integration and International Risk Sharing Ming-Jen Chang, Shikuan Chen and Yen-Chen Wu National DongHwa University Thursday 22 nd November 2018 Department of Economics,
MICRO-LEVEL CONSEQUENCES OF FLEXIBILITY-ENHANCING REFORMS: WORK IN PROGRESS. 22 June 2015
 MICRO-LEVEL CONSEQUENCES OF FLEXIBILITY-ENHANCING REFORMS: WORK IN PROGRESS 22 June 2015 Looking beneath the positive net effects of flexibility-enhancing reforms OECD and other empirical work has documented
Regional Economic Outlook
 E U R Advanced Europe Emerging Europe Regional Economic Outlook Spring 18 Key Messages Strong economic growth but lead indicators point to a peak Much lower wage growth in most of advanced Europe than
The Architectural Profession in Europe 2012
 The Architectural Profession in Europe 2012 - A Sector Study Commissioned by the Architects Council of Europe Chapter 2: Architecture the Market December 2012 2 Architecture - the Market The Construction
Adverse macro-financial scenario for the 2018 EU-wide banking sector stress test
 16 January 2018 ECB-PUBLIC Adverse macro-financial scenario for the 2018 EU-wide banking sector stress test This document sets out the adverse macro-financial scenario that banks are required to use in
Borderline cases for salary, social contribution and tax
 Version Abstract 1 (5) 2015-04-21 Veronica Andersson Salary and labour cost statistics Borderline cases for salary, social contribution and tax (Workshop on Labour Cost Survey, Rome, Italy 5-6 May 2015)
Government spending shocks, sovereign risk and the exchange rate regime
 Government spending shocks, sovereign risk and the exchange rate regime Dennis Bonam Jasper Lukkezen Structure 1. Theoretical predictions 2. Empirical evidence 3. Our model SOE NK DSGE model (Galì and
International Seminar on Strengthening Public Investment and Managing Fiscal Risks from Public-Private Partnerships
 International Seminar on Strengthening Public Investment and Managing Fiscal Risks from Public-Private Partnerships Budapest, Hungary March 7 8, 2007 The views expressed in this paper are those of the
Council conclusions on "First Annual Report to the European Council on EU Development Aid Targets"
 COUNCIL OF THE EUROPEAN UNION Council conclusions on "First Annual Report to the European Council on EU Development Aid Targets" 3091st FOREIGN AFFAIRS Council meeting Brussels, 23 May 2011 The Council
JOINT STATEMENT. The representatives of the governments of the Member States, meeting within the Council of
 JOINT STATEMENT The representatives of the governments of the Member States, meeting within the Council of the EU, and The Swiss Federal Council, Have drawn up the following Joint Statement on company
What determines government spending multipliers?
 What determines government spending multipliers? Paper by Giancarlo Corsetti, André Meier and Gernot J. Müller Presented by Michele Andreolli 12 May 2014 Outline Overview Empirical strategy Results Remarks
zindex.cz Czech ranking of buyers best practice
 zindex.cz Czech ranking of buyers best practice E-Procurement Forum, Vienna, 2.12.2015 Jiří Skuhrovec Centre of applied economics Charles University, Prague Czech Republic Portugal Hungary Romania Estonia