Probabilistic Drought Hazard and Risk Model: A contribution of the Risk Nexus Initiative
|
|
|
- Marilynn Banks
- 5 years ago
- Views:
Transcription


1 Workshop on Developing a Drought Monitoring, Early Warning and Mitigation System for South America 8 10 August 2017 Buenos Aires, Argentina Probabilistic Drought Hazard and Risk Model: A contribution of the Risk Nexus Initiative Omar Dario Cardona / Gabriel Bernal August 9, 2017 INGENIAR Bogotá Colombia
2 The UN Risk Nexus Initiative (RNI): A new partnership Risk is the nexus between adaptation to climate change, environment management, and risk reduction policies for sustainability and resilience. RNI will go beyond the fragmented policy approaches in favor of a holistic approach to risk, which explicitly recognizes and embraces interdependence. 2
3 The UN Risk Nexus Initiative (RNI): A new partnership The principal outputs: New risk models and metrics that condense interdependence and inform investment decisions, Indicators that transcend fragmented policy approaches in order to monitor progress towards sustainability and resilience, and Enhanced risk governance based on forensic studies of risk, new conceptual frameworks, valuations of risk, and cutting edge tools of social communication. 3
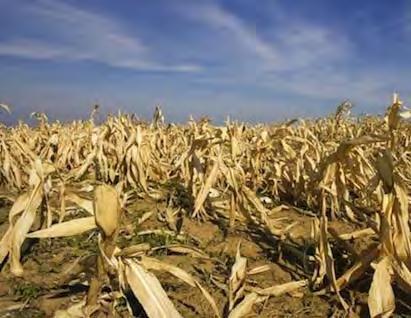
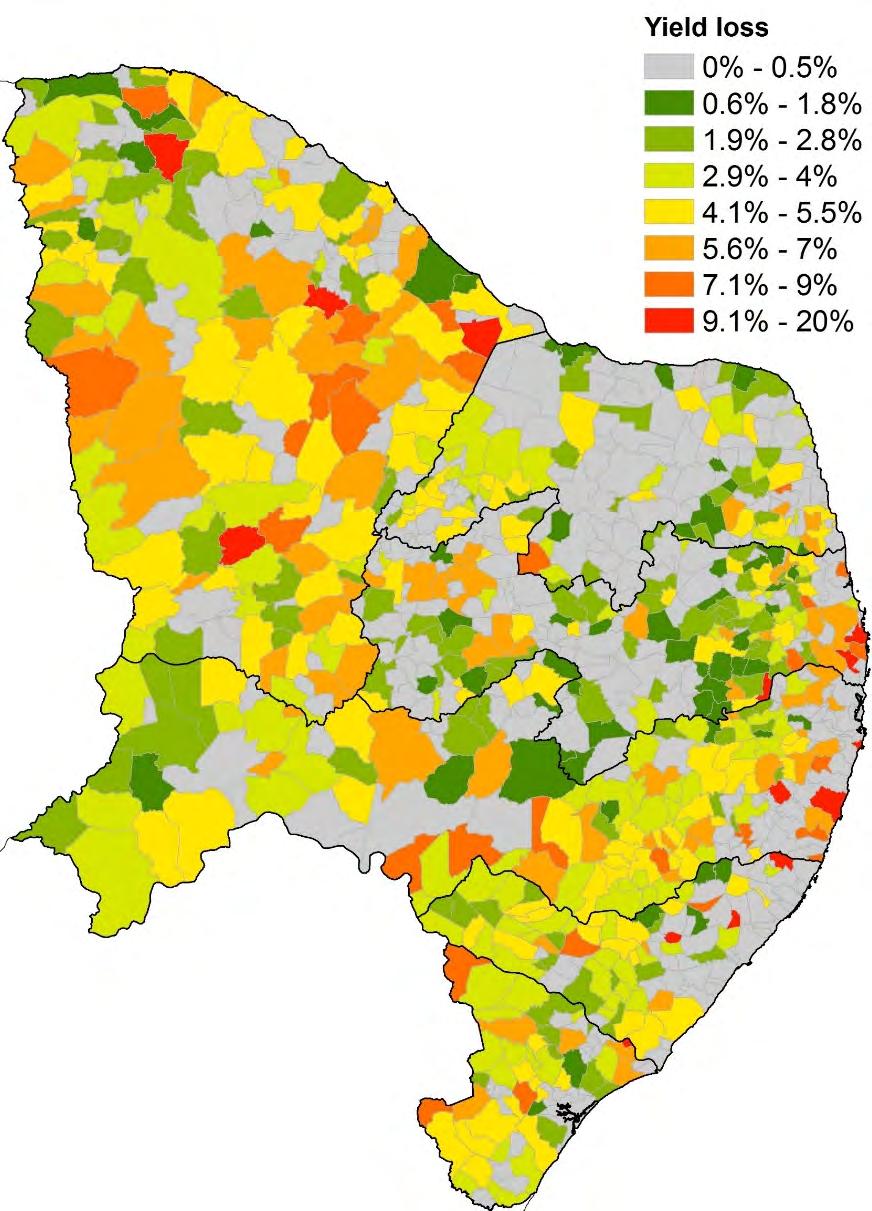
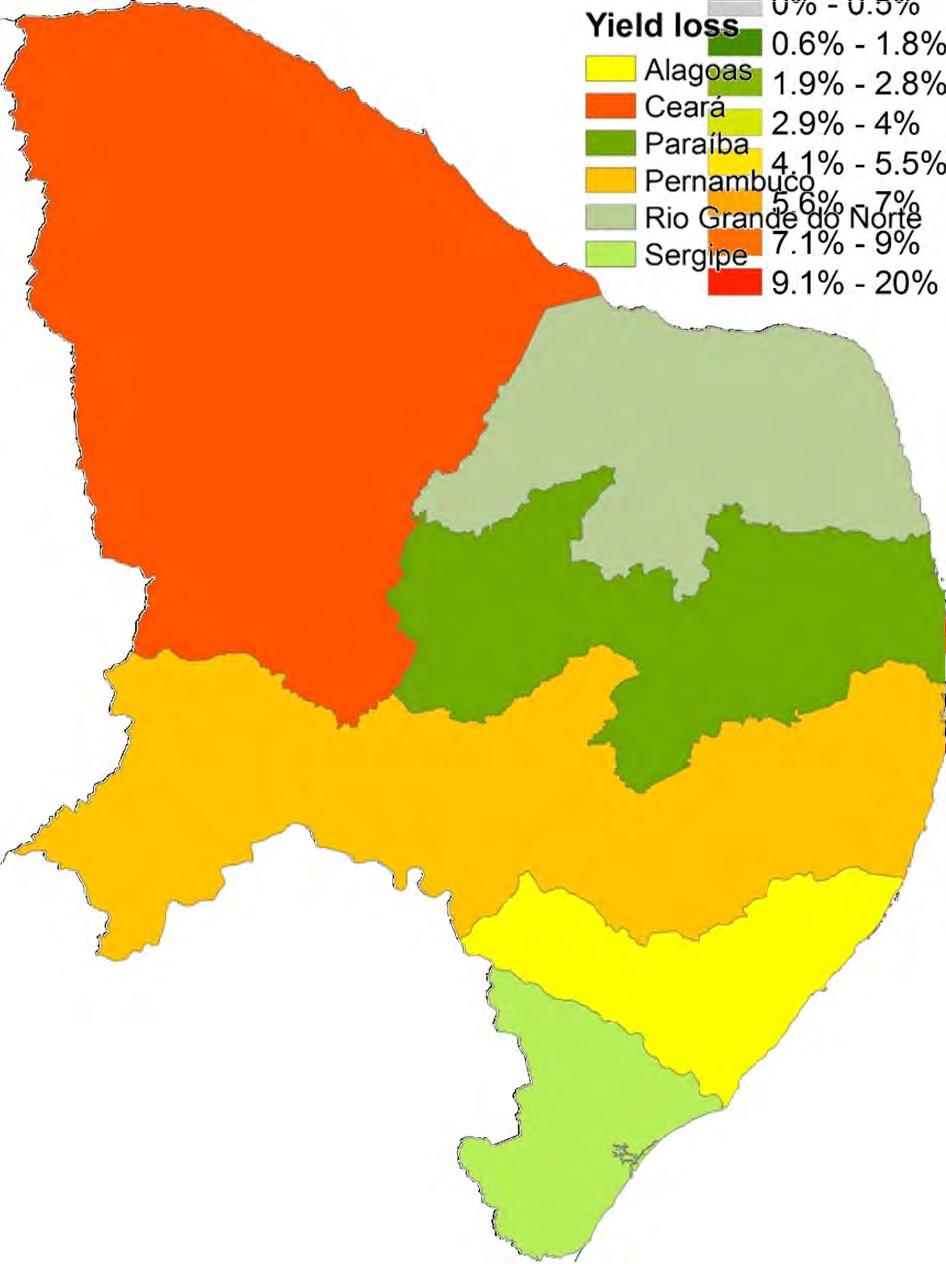
4 Drought Hazard and Risk Assessment: New component of the GRM-A The objective is to develop a drought risk model to estimate the economical losses in the agricultural sector globally (water and food stress). The proposed methodology aims to quantify the loss in production (yield) of crops exposed to droughts. Any other adverse effect of droughts is not considered within the scope of this presentation. The expected outcome is the risk assessment in terms of probabilistic metrics (AAL, PML, LEC) at country level.


 Average annual loss")
5 Probabilistic Risk Assessment HAZARD Set of stochastic scenarios Based on historical climate data Probabilistic representation Spatially distributed Time series All return periods are included Possibility of including CC trends Damage RISK EXPOSURE Cultivated land units Location Crop type and seasonality Cultivated area Production cost Loss Production Economic VULNERABILITY Crop yield response to water Crop characteristics Crop calendar Climate time series Loss in potential production Metrics Loss exceedance curve (LEC) Average annual loss (AAL) Probable maximum loss (PML)
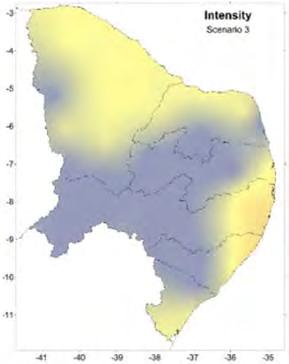
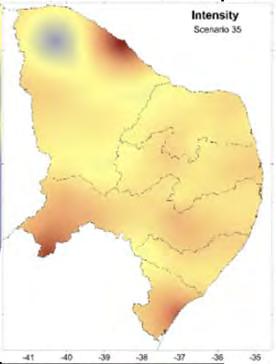
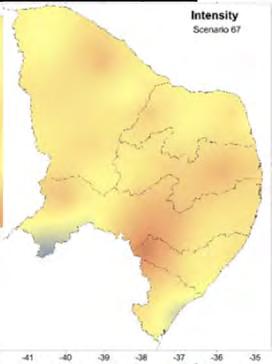
6 Hazard Historic records For example, in northeast Brazil


7 Hazard Historic records For example, in northeast Brazil
8 Hazard Simulated weather time series Simulated time series are generated stochastically from the historical information. The objective is not to forecast future weather conditions, but to generate feasible combinations of drought conditions, such as low precipitation and high temperature. Historical Simulated (not a forecast)
9 Hazard Simulated weather time series Probability distribution of each weather value, for each day Jan Feb Mar Apr May Jun Jul Aug Sep Oct Nov Dec
10 Hazard Simulated weather time series Probability distribution fitting For example, Precipitation, March 15 th Temperature, October 15 th
11 Hazard Simulated weather time series Correlation There is a certain amount of correlation, in both time and space, that cannot be neglected var var 2 var var 4 Correlation is considered by means of a covariance matrix, between days of the year (for time correlation) and stations in the study area (for space correlation) var 5 var 6 var 7 var 8 var 9 var var var
12 Hazard Simulated weather time series Simulations Correlated random numbers are generated for each day of the year, for as may years as wanted. Each simulated year has different values of the weather parameters in each day, which follow the day-specific probability distribution and the temporal and spatial correlations. Jan Feb Mar Apr May Jun Jul Aug Sep Oct Nov Dec


13 Hazard Simulated weather time series Simulations This is repeated, for example, one thousand times. Temperature [ C] Precipitation [mm/day] Simulations Max Mean Min
14 Hazard Simulated weather time series Simulations Fitness check of multi-annual averages. Precipitation [mm/day] Daily precipitation mean Historic records 1000 years Temperature mean Temperature [ C]

15 Hazard Climate change impact on hazard modelling Precipitation
16 Hazard Climate change impact on hazard modelling Temperature
17 Hazard Climate change impact on hazard modelling Select the GCM that better describes the area Difference in P [mm/d] 1 ST DEV 2 ST DEV RCP2.6 RCP4.5 RCP6 RCP MIROC5 Run 1 RCP 2.6, 4.5, 6 y 8.5 MIROC5 Run 2 RCP 2.6, 4.5 y 8.5 MIROC5 Run 3 RCP 2.6, 4.5 y 8.5 MIROC5 Mean RCP 2.6, 4.5 y Difference in T mean [ C]
18 Drought Classification Drought indices according to drought type Precipitation deciles SPI Standardized Precipitation EDI Effective drought index Precipitation RDI Reconnaissance Drought Index SPEI Standardized Precipitation Evapotranspiration Index Precipitation Temperature PDSI Palmer Drought Severity Index Precipitation, Temperature, Soil characteristics (porosity, moisture) Surface Water Supply Index Precipitation, snow, streamflow, water storage
19 Drought Indices Time scale variation Drought indicator series for 1000-years simulation
20 Drought Events An index threshold must be defined to identify drought events. Drought Classes Index value Non-drought Index 0 Mild -1 < Index<0 Moderate -1.5 < Index -1 Severe/extreme Index -1.5 Index time series Index threshold Individual drought events can be identified from the index time series


21 Drought Events Each event is unique and has its own distribution in time 2 Index Drought event Time Severity Intensity Duration 1 month Temperature Precipitation


22 Drought Events Drought index series are associated to particular stations.
23 Drought Events A regional event is identified when drought events are simultaneously identified in a substantial number of stations. 3 Scenario 1 Scenario 2 Scenario 3 Scenario 4 RDI Station RDI Station RDI Station RDI Station n RDI Station n Months
 are assumed to be: Mutually exclusive Collectively exhaustive They allow")
 Time series, at any location, of weather variables (precipitation and")
24 Drought Hazard Collection of scenarios Hazard is represented as a set of stochastic scenarios. These scenarios (events) are assumed to be: Mutually exclusive Collectively exhaustive They allow probabilistic representation: Occurrence frequency (temporal probability) Gridded statistical moments (spatial probability) Time series, at any location, of weather variables (precipitation and temperature)


25 Exposure Cultivated Land Units Exposure is defined within Cultivated Land Units. Each unit is characterized by the following properties: Geographical location and area Type of crops produced Crops production cost Participation of each crop in the total production

26 Exposure Crop calendar The Cultivated Land Units will be characterized by using the crop calendar to define crop seasonality.
27 Exposure Crop valuation Crop production costs include expenses associated with raw materials (seeds, fertilizers, irrigation), labor and machinery investments. Industrial Agricultural Electrodes Electric energy Chemicals Maintenance Workforce Lubricants Fertilizers Herbicides Pesticides Workforce Administrative Workforce

28 Exposure Soil types The geographical distribution of soil types is required as part of the exposure information.
29 Crop Yield Response to Water As crop seasonality is known, crop calendar is located in the same time-scale for each scenario. Crop development t Drought Index t Drought threshold Sowing Harvest Maturity


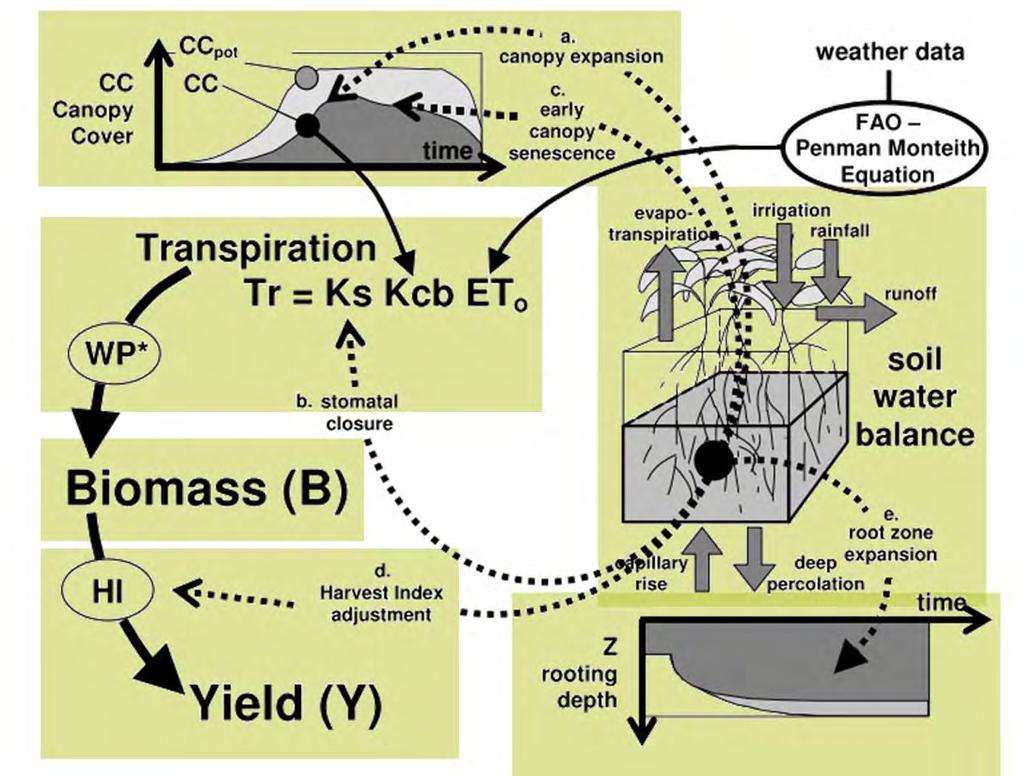
30 Vulnerability 5-steps process Soil water balance Crop development Crop transpiration Biomass production Yield (Y) from biomass (B)
31 Crop Vulnerability Crop seasonality P [mm] Sep Oct Nov Dec Jan Feb ETo [mm] T [ C] RDI B, Bx [ton/ha] 20 0 Sep Oct Nov Dec Jan Feb
32 Crop Vulnerability Crop seasonality P [mm] Sep Oct Nov Dec Jan Feb ETo [mm] T [ C] RDI Drought scenario 40 B, Bx [ton/ha] 20 0 Sep Oct Nov Dec Jan Feb


33 Crop Vulnerability Simulations Uncertainty in input parameters is included from the avaliable information and expert criteria (likelihood) Crop characteristics Inputs Soil profile Random variables
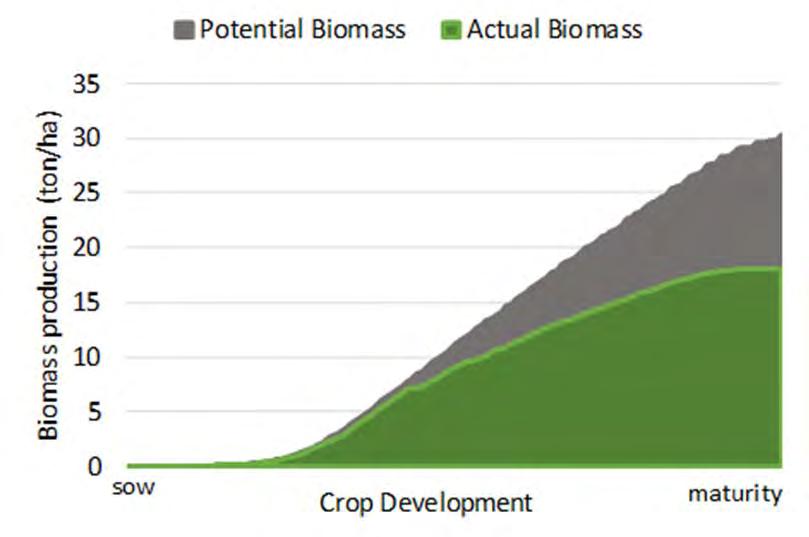
34 Crop Vulnerability Simulations Y, Yx [ton/ha] Potential yield (random variable) Actual yield (random variable) Time
35 Crop Vulnerability Simulations Y, Yx [ton/ha] Potential yield (random variable) Actual yield (random variable) Time
36 Probabilistic Risk Assessment Hazard Exposure Vulnerability Loss
37 Probabilistic Risk Assessment Hazard E( l Event 2 ( l Event ) NE E( i l j j 1 NE 2 i ) ( l j j 1 ) ) 2 Loss aggregation NE 1 NE k 1 j 2 k j cov l k, l j Exposure PDF of the loss for each scenario Vulnerability Loss Area of the cultivated unit Number of Crop Types in the unit Participation (%) of type k l i A NCT k 1 C k P Loss for scenario i k Yx k, i Y k, i Production cost of type k Potential yield of type k for scenario i Actual yield of type k for scenario i
38 Probabilistic Risk Assessment Hazard Exposure Vulnerability Risk Loss


39 Probabilistic Risk Assessment Hazard Risk Exposure Loss by scenario Vulnerability Production Economic Loss Loss Exceedance Curve
40 Probabilistic Risk Assessment Aggregation of losses
41 Probabilistic Risk Assessment Aggregation of losses
42 Probabilistic Risk Assessment Aggregation of losses
43 Probabilistic Risk Assessment Aggregation of losses
44 Probabilistic Risk Assessment PDF of the loss for one scenario f(l) p( ) L l Pr L l L f l dl
45 Probabilistic Risk Assessment f(l) f(l) L l L l Loss exceedance rate Loss exceedance probability v l N i 1 Pr ( l L E i ) F i Occurrence frequency of each scenario


46 Probabilistic Risk Assessment f(l) f(l) L l L l Loss exceedance rate v l N i 1 Loss exceedance probability Pr ( l L E i ) F i Occurrence frequency of each scenario Loss exceedance rate (#/year) Loss
47 Probabilistic Risk Assessment Loss Exceedance Curve (LEC) Sets the annual rate of excess of a given loss value v l Exceedance rate [#/year] Loss l
48 Probabilistic Risk Assessment Return period Average time needed for reaching or exceeding a loss value, considering a large enough time window Tr 1 v l It is computed as the inverse of the exceedance rate
49 Probabilistic Risk Assessment Probable Maximum Loss (PML) It is a loss that doesn t occur frequently (related to long return periods) PML Return period
50 Probabilistic Risk Assessment Average Annual Loss (AAL) It represents the amount that has to be paid annually in order to cover future expected losses. 4.50% 4.00% 3.50% 3.00% 2.50% 2.00% 1.50% 1.00% 0.50% Pérdidas por evento Pérdida acumulada 45.0% 40.0% 35.0% 30.0% 25.0% 20.0% 15.0% 10.0% 5.0% 0.00% %
51 Probabilistic Risk Assessment Average Annual Loss (AAL) It represents the amount that has to be paid annually in order to cover future expected losses. 4.50% 4.00% 3.50% 3.00% 2.50% 2.00% 1.50% 1.00% 0.50% Pérdidas por evento Pérdida acumulada 45.0% 40.0% 35.0% 30.0% 25.0% 20.0% 15.0% 10.0% 5.0% AAL 0.00% Loss and time between events: unknown 0.0%
52 Probabilistic Risk Assessment A holistic approach The LEC provides information on direct physical losses. This metrics can me amplified by incorporating other aspects related to risk. Physical risk 1st Order EFFECTS Potential damage on crops Social, economical and ecological fragilities Lack of resilience or ability to cope and recover 2nd Order EFFECTS Potential Socio-ecological and Economic Impact on Communities- Organizations
53 Probabilistic Risk Assessment A holistic approach Assessment of the influence of each variable Social aspects Xs1, Xs2,., Xsn Economic aspects Xe1, Xe2,., Xen Infrastructural aspects Xi1, Xi2,., Xin Other aspects (governability, security ) Xo1, Xo2,., Xon Weights Ws1, Ws2,., Wsn Weights We1, We2,., Wen Weights Wi1, Wi2,., Win Weights Wo1, Wo2,., Won Aggravating coefficient F N i 1 X i W i
54 Probabilistic Risk Assessment A holistic approach Total risk Total risk Aggravating coefficient R T R 1 F Physical risk metric
55 Drought Risk Assessment Expected contributions of the GRM-A To provide a suite of drought risk metrics that will enable a better characterization of risk in the agriculture sector that allow establishing investment plans and strengthen social and economic resilience. To provide a complete estimate of drought risk and in particular in those countries where agriculture makes a significant contribution to national economies. To estimate correlated risk that could lead to systemic food insecurity (multiple breadbasket failures).
Use of the Risk Driver Method in Monte Carlo Simulation of a Project Schedule
 Use of the Risk Driver Method in Monte Carlo Simulation of a Project Schedule Presented to the 2013 ICEAA Professional Development & Training Workshop June 18-21, 2013 David T. Hulett, Ph.D. Hulett & Associates,
Fall 2017 Crop Outlook Webinar
 Fall 2017 Crop Outlook Webinar Chris Hurt, Professor & Extension Ag. Economist James Mintert, Professor & Director, Center for Commercial Agriculture Fall 2017 Crop Outlook Webinar October 13, 2017 50%
Modeling Multiple Peril Crop Insurance Worldwide
 Modeling Multiple Peril Crop Insurance Worldwide Jack Seaquist CARe Seminar C-7 Philadelphia, PA June 7, 2011 www.air-worldwide.com 1 AIR Agricultural Model Applications Underwriting Risk Transfer Enterprise
Module 6 Book A: Principles of Contract Design. Agriculture Risk Management Team Agricultural and Rural Development The World Bank
 + Module 6 Book A: Principles of Contract Design Agriculture Risk Management Team Agricultural and Rural Development The World Bank + Module 6 in the Process of Developing Index Insurance Initial Idea
PRF Insurance: background
 Rainfall Index and Margin Protection Insurance Plans 2017 Ag Lenders Conference Garden City, KS October 2017 Dr. Monte Vandeveer KSU Extension Agricultural Economist PRF Insurance: background Pasture,
Revised October 17, 2016
 Revised October 17, 2016 60 ISM Manufacturing Purchasing Managers Index (September 2015 September 2016) 58 56 54 52 50 48 46 44 42 Sept-15 Oct Nov Dec Jan-16 Feb Mar Apr May Jun Jul Aug Sept Purchasing
The AIR Multiple Peril Crop Insurance Model for China
 The AIR Multiple Peril Crop Insurance Model for China Participation in China s Multiple Peril Crop Insurance (MPCI) program has dramatically increased since 2007. The growth in insurance penetration, together
The AIR Inland Flood Model for Great Britian
 The AIR Inland Flood Model for Great Britian The year 212 was the UK s second wettest since recordkeeping began only 6.6 mm shy of the record set in 2. In 27, the UK experienced its wettest summer, which
Integrated Cost Schedule Risk Analysis Using the Risk Driver Approach
 Integrated Cost Schedule Risk Analysis Using the Risk Driver Approach David T. Hulett, Ph.D. Hulett & Associates 24rd Annual International IPM Conference Bethesda, Maryland 29 31 October 2012 (C) 2012
Integrated Cost Schedule Risk Analysis Using the Risk Driver Approach
 Integrated Cost Schedule Risk Analysis Using the Risk Driver Approach Qatar PMI Meeting February 19, 2014 David T. Hulett, Ph.D. Hulett & Associates, LLC 1 The Traditional 3-point Estimate of Activity
Leading Economic Indicator Nebraska
 Nebraska Monthly Economic Indicators: December 20, 2017 Prepared by the UNL College of Business Administration, Bureau of Business Research Author: Dr. Eric Thompson Leading Economic Indicator...1 Coincident
Performance Report October 2018
 Structured Investments Indicative Report October 2018 This report illustrates the indicative performance of all Structured Investment Strategies from inception to 31 October 2018 Matured Investment Strategies
Prioritization of Climate Change Adaptation Options. The Role of Cost-Benefit Analysis. Session 8: Conducting CBA Step 7
 Prioritization of Climate Change Adaptation Options The Role of Cost-Benefit Analysis Session 8: Conducting CBA Step 7 Accra (or nearby), Ghana October 25 to 28, 2016 8 steps Step 1: Define the scope of
XML Publisher Balance Sheet Vision Operations (USA) Feb-02
 Feb-02") Page:1 Apr-01 May-01 Jun-01 Jul-01 ASSETS Current Assets Cash and Short Term Investments 15,862,304 51,998,607 9,198,226 Accounts Receivable - Net of Allowance 2,560,786
Page:1 Apr-01 May-01 Jun-01 Jul-01 ASSETS Current Assets Cash and Short Term Investments 15,862,304 51,998,607 9,198,226 Accounts Receivable - Net of Allowance 2,560,786
Current Approaches to Drought Vulnerability and Impact assessment
 Current Approaches to Drought Vulnerability and Impact assessment Experiences from risk monitoring work (GAR) and reviews of progress against the Hyogo Framework for Action John A. Harding UN Relations
Analyze the Market for a Seasonal Bias. It is recommended never to buck the seasonal nature of a market. What is a Seasonal Trend?
 The seasonal trend in a market is our way of taking the fundamental price action of a market...and then chart it year-by-year. Analyze the Market for a Seasonal Bias STEP 5 Using Track n Trade Pro charting
Water Pipe Failure Predictions under Different Climate Scenarios
 Water Pipe Failure Predictions under Different Climate Scenarios Water For a Healthy Country Flagship F. Boulaire, S. Gould, D. Beale, J. Kodikara, S. Burn and D. Marlow Presented by Scott Gould July 2010
The ERC Situation and Response Analysis Framework Reinforcing Institutional Capacity for Timely Food Security Emergency Response to Slow Onset Crises
 The ERC Situation and Response Analysis Framework Reinforcing Institutional Capacity for Timely Food Security Emergency Response to Slow Onset Crises at Scale ERC SRAF Guiding Principles Timing is Critical:
Figure 1: Change in LEI-N August 2018
 Nebraska Monthly Economic Indicators: September 26, 2018 Prepared by the UNL College of Business, Bureau of Business Research Author: Dr. Eric Thompson Leading Economic Indicator...1 Coincident Economic
Understanding Markets and Marketing
 Art Understanding Markets and Marketing Randy Fortenbery School of Economic Sciences College of Agricultural, Human, and Natural Resource Sciences Washington State University The objective of marketing
Update on the Financial Framework Review. Informal Consultation 25 July 2016
 Update on the Financial Framework Review Informal Consultation 25 July 2016 Integrated Roadmap: Alignment of Strategic Plan, Country Strategic Plan, Corporate Results Framework and Financial Framework
Risk, Insurance and Wages in General Equilibrium. A. Mushfiq Mobarak, Yale University Mark Rosenzweig, Yale University
 Risk, Insurance and Wages in General Equilibrium A. Mushfiq Mobarak, Yale University Mark Rosenzweig, Yale University 750 All India: Real Monthly Harvest Agricultural Wage in September, by Year 730 710
Sample Procurement Plan
 Sample Procurement Plan Public Disclosure uthorized Public Disclosure uthorized Public Disclosure uthorized Public Disclosure uthorized I. General 1. Project Information Regional Coordination on improved
Fourth Quarter 2016 Performance Summary
 Fourth Quarter 2016 Performance Summary Operational and Financial Highlights - 2016 Net profit rises by +2.5% to Euros 545.5 million Recurring sales (excluding Raw Materials and Others) rise by +4.5% (+4.6%
Commodity Market Instability and Development Policies
 Commodity Market Instability and Development Policies Maximo Torero m.torero@cgiar.org Friday June 26, 2015 O.C.P. Policy Center & FERDI Paris France What we learned from 2007-08? 250 200 150 100 50 0
Leading Economic Indicator Nebraska
 Nebraska Monthly Economic Indicators: September 20, 2017 Prepared by the UNL College of Business Administration, Bureau of Business Research Author: Dr. Eric Thompson Leading Economic Indicator...1 Coincident
Beginning Date: January 2016 End Date: June Managers in Zephyr: Benchmark: Morningstar Short-Term Bond
 Beginning Date: January 2016 End Date: June 2018 Managers in Zephyr: Benchmark: Manager Performance January 2016 - June 2018 (Single Computation) 11200 11000 10800 10600 10400 10200 10000 9800 Dec 2015
Spheria Australian Smaller Companies Fund
 29-Jun-18 $ 2.7686 $ 2.7603 $ 2.7520 28-Jun-18 $ 2.7764 $ 2.7681 $ 2.7598 27-Jun-18 $ 2.7804 $ 2.7721 $ 2.7638 26-Jun-18 $ 2.7857 $ 2.7774 $ 2.7690 25-Jun-18 $ 2.7931 $ 2.7848 $ 2.7764 22-Jun-18 $ 2.7771
Growing emphasis on insurance systems
 Growing emphasis on insurance systems Roger C Stone, University of Southern Queensland, Australia. World Meteorological Organisation, Commission for Agricultural Meteorology. IDMP Geneva September 14-16,
Beginning Date: January 2016 End Date: September Managers in Zephyr: Benchmark: Morningstar Short-Term Bond
 Beginning Date: January 2016 End Date: September 2018 Managers in Zephyr: Benchmark: Manager Performance January 2016 - September 2018 (Single Computation) 11400 - Yorktown Funds 11200 11000 10800 10600
Leading Economic Indicator Nebraska
 Nebraska Monthly Economic Indicators: June 21, 2017 Prepared by the UNL College of Business Administration, Bureau of Business Research Author: Dr. Eric Thompson Leading Economic Indicator...1 Coincident
Manager Comparison Report June 28, Report Created on: July 25, 2013
 Manager Comparison Report June 28, 213 Report Created on: July 25, 213 Page 1 of 14 Performance Evaluation Manager Performance Growth of $1 Cumulative Performance & Monthly s 3748 3578 348 3238 368 2898
1. (35 points) Assume a farmer derives utility from Income in the following manner
 Assume a farmer derives utility from Income in the following manner") Exam 3 AGEC 421 Advanced Agricultural Marketing Spring 2012 Instructor: Eric Belasco Name Belasco Key 1. (35 points) Assume a farmer derives utility from Income in the following manner where is income
Exam 3 AGEC 421 Advanced Agricultural Marketing Spring 2012 Instructor: Eric Belasco Name Belasco Key 1. (35 points) Assume a farmer derives utility from Income in the following manner where is income
Leading Economic Indicator Nebraska
 Nebraska Monthly Economic Indicators: July 24, 2015 Prepared by the UNL College of Business Administration, Department of Economics Authors: Dr. Eric Thompson, Dr. William Walstad Leading Economic Indicator...1
Leading Economic Indicator Nebraska
 Nebraska Monthly Economic Indicators: July 29, 2016 Prepared by the UNL College of Business Administration, Department of Economics Authors: Dr. Eric Thompson, Dr. William Walstad Leading Economic Indicator...1
Flood Risk Management and Columbia River Treaty Review
 Flood Risk Management and Columbia River Treaty 2014 2024 Review Lower Columbia River Estuary Partnership 2013 Science to Policy Summit: The Columbia River Treaty May 10, 2013 Matt Rea Treaty Review Program
Balance-of-Period TCC Auction
 Balance-of-Period TCC Auction Proposed Credit Policy Sheri Prevratil Manager, Corporate Credit New York Independent System Operator Credit Policy Working Group May 29, 2015 2000-2015 New York Independent
Leading Economic Indicator Nebraska
 Nebraska Monthly Economic Indicators: June 17, 2016 Prepared by the UNL College of Business Administration, Department of Economics Authors: Dr. Eric Thompson, Dr. William Walstad Leading Economic Indicator...1
Fundamentals of Catastrophe Modeling. CAS Ratemaking & Product Management Seminar Catastrophe Modeling Workshop March 15, 2010
 Fundamentals of Catastrophe Modeling CAS Ratemaking & Product Management Seminar Catastrophe Modeling Workshop March 15, 2010 1 ANTITRUST NOTICE The Casualty Actuarial Society is committed to adhering
World Sugar Market Outlook
 World Sugar Market Outlook 28 th of September 216 Platts conference New Delhi Benoît Boisleux 1 Jan-15 Feb-15 Mar-15 Apr-15 May-15 Jun-15 Jul-15 Aug-15 Sep-15 Oct-15 Nov-15 Dec-15 Jan-16 Feb-16 Mar-16
FDD FIRM STORAGE SERVICE NORTHERN NATURAL GAS COMPANY
 FDD FIRM STORAGE SERVICE NORTHERN NATURAL GAS COMPANY FIRM STORAGE SERVICE OPTIONS Northern s firm storage service is provided pursuant to the FDD Rate Schedule located in Northern s FERC Gas Tariff. The
Energy Yield Reconciliation in Monthly O&M Reports
 Energy Yield Reconciliation in Monthly O&M Reports Claire Puttock, Lee Cameron & Alex Clerc April 15, 2016 EWEA Technology Workshop, Bilbao Contents Introduction to variance explanation Motivation Key
Index Insurance: Financial Innovations for Agricultural Risk Management and Development
 Index Insurance: Financial Innovations for Agricultural Risk Management and Development Sommarat Chantarat Arndt-Corden Department of Economics Australian National University PSEKP Seminar Series, Gadjah
Leading Economic Indicator Nebraska
 Nebraska Monthly Economic Indicators: August 19, 2016 Prepared by the UNL College of Business Administration, Department of Economics Authors: Dr. Eric Thompson, Dr. William Walstad Leading Economic Indicator...1
Improving Your Crop Marketing Skills: Basis, Cost of Ownership, and Market Carry
 Improving Your Crop Marketing Skills: Basis, Cost of Ownership, and Market Carry Nathan Thompson & James Mintert Purdue Center for Commercial Agriculture Many Different Ways to Price Grain Today 1) Spot
Midterm Exam. b. What are the continuously compounded returns for the two stocks?
 University of Washington Fall 004 Department of Economics Eric Zivot Economics 483 Midterm Exam This is a closed book and closed note exam. However, you are allowed one page of notes (double-sided). Answer
GRAIN HEDGE POSITION REPORT
 GRAIN HEDGE POSITION REPORT CROP: Corn DATE: April 16, 2006 LONG POSITION SHORT POSITION Total Grain on Hand 753896 Grain in Transit Total Offsite Grain Total Stocks 753896 Unpriced Grain Storage 106375
Crops Marketing and Management Update
 Crops Marketing and Management Update Grains and Forage Center of Excellence Dr. Todd D. Davis Assistant Extension Professor Department of Agricultural Economics Vol. 2018 (3) March 11, 2018 Topics in
Sample Procurement Plan
 Sample Procurement Plan Public Disclosure uthorized Public Disclosure uthorized Public Disclosure uthorized Public Disclosure uthorized I. General 1. Project Information Project Name: Country: Project
The AIR Typhoon Model for South Korea
 The AIR Typhoon Model for South Korea Every year about 30 tropical cyclones develop in the Northwest Pacific Basin. On average, at least one makes landfall in South Korea. Others pass close enough offshore
Crops Marketing and Management Update
 Crops Marketing and Management Update Grains and Forage Center of Excellence Dr. Todd D. Davis Assistant Extension Professor Department of Agricultural Economics Vol. 2018 (2) February 14, 2018 Topics
(RISK.03) Integrated Cost and Schedule Risk Analysis: A Draft AACE Recommended Practice. Dr. David T. Hulett
 Integrated Cost and Schedule Risk Analysis: A Draft AACE Recommended Practice. Dr. David T. Hulett") (RISK.03) Integrated Cost and Schedule Risk Analysis: A Draft AACE Recommended Practice Dr. David T. Hulett Author Biography David T. Hulett, Hulett & Associates, LLC Degree: Ph.D. University: Stanford
(RISK.03) Integrated Cost and Schedule Risk Analysis: A Draft AACE Recommended Practice Dr. David T. Hulett Author Biography David T. Hulett, Hulett & Associates, LLC Degree: Ph.D. University: Stanford
Repo Market and Market Repo Rate as a Collateralized Benchmark Rate 1
 Repo Market and Market Repo Rate as a Collateralized Benchmark Rate 1 Golaka C Nath 2 1. Introduction 2. Repo Market Structure Collateralized markets have grown significantly over the years and surpassed
Executive Summary. July 17, 2015
 Executive Summary July 17, 2015 The Revenue Estimating Conference adopted interest rates for use in the state budgeting process. The adopted interest rates take into consideration current benchmark rates
WESTWOOD LUTHERAN CHURCH Summary Financial Statement YEAR TO DATE - February 28, Over(Under) Budget WECC Fund Actual Budget
 Budget WECC Fund Actual Budget") WESTWOOD LUTHERAN CHURCH Summary Financial Statement YEAR TO DATE - February 28, 2018 General Fund Actual A B C D E F WECC Fund Actual Revenue Revenue - Faith Giving 1 $ 213 $ 234 $ (22) - Tuition $ 226
WESTWOOD LUTHERAN CHURCH Summary Financial Statement YEAR TO DATE - February 28, 2018 General Fund Actual A B C D E F WECC Fund Actual Revenue Revenue - Faith Giving 1 $ 213 $ 234 $ (22) - Tuition $ 226
June Economic Activity Index ( GDB-EAI )
") June 2014 Economic Activity Index ( GDB-EAI ) General Commentary June 2014 In June 2014, the GDB-EAI registered a 1.0% year-over-year (y-o-y) reduction, after showing a 1.1% y-o-y decrease in June 2014.
June 2014 Economic Activity Index ( GDB-EAI ) General Commentary June 2014 In June 2014, the GDB-EAI registered a 1.0% year-over-year (y-o-y) reduction, after showing a 1.1% y-o-y decrease in June 2014.
Understanding the Principles of Investment Planning Stochastic Modelling/Tactical & Strategic Asset Allocation
 Understanding the Principles of Investment Planning Stochastic Modelling/Tactical & Strategic Asset Allocation John Thompson, Vice President & Portfolio Manager London, 11 May 2011 What is Diversification
Leading Economic Indicator Nebraska
 Jan 12 Feb 12 Mar 12 Apr 12 May 12 Jun 12 Jul 12 Nebraska Monthly Economic Indicators: February 17, 2012 Prepared by the UNL College of Business Administration, Department of Economics Authors: Dr. Eric
Dryland Bermuda Enterprise Budget - Hay Only 1000 acres farmed, 160 acres for this budget. OSU Name. OKLAHOMA COOPERATIVE Farm Description
 Dryland Bermuda Enterprise Budget - Hay Only 1000 acres farmed, 160 acres for this budget OSU Name OKLAHOMA COOPERATIVE Farm Description EXTENSION SERVICE Total PRODUCTION Units Price Quantity $/Acre Hay
Cost Estimation of a Manufacturing Company
 Cost Estimation of a Manufacturing Company Name: Business: Date: Economics of One Unit: Manufacturing Company (Only complete if you are making a product, such as a bracelet or beauty product) Economics
Using projections to manage your programs
 Using projections to manage your programs To project total provider reimbursements To do what ifs based on caseloads or other metrics To project amounts of admin & support available for spending Based
Looking at a Variety of Municipal Valuation Metrics
 Looking at a Variety of Municipal Valuation Metrics Muni vs. Treasuries, Corporates YEAR MUNI - TREASURY RATIO YEAR MUNI - CORPORATE RATIO 200% 80% 175% 150% 75% 70% 65% 125% Average Ratio 0% 75% 50% 60%
Soybeans face make or break moment Futures need a two-fer to avoid losses By Bryce Knorr, senior grain market analyst
 Soybeans face make or break moment Futures need a two-fer to avoid losses By Bryce Knorr, senior grain market analyst A year ago USDA shocked the market by cutting its forecast of soybean production, helping
Leading Economic Indicator Nebraska
 Nebraska Monthly Economic Indicators: January 17, 2014 Prepared by the UNL College of Business Administration, Department of Economics Authors: Dr. Eric Thompson, Dr. William Walstad Graduate Research
Our Efforts in Agricultural Market in SEA
 Our Efforts in Agricultural Market in SEA -Case of Myanmar & Thailand- Mar 16 th 2018 Ken Gohara Alternative Solutions Section Commercial Risk Solutions Department 1 Corporate Profile Name : Sompo Japan
CAT301 Catastrophe Management in a Time of Financial Crisis. Will Gardner Aon Re Global
 CAT301 Catastrophe Management in a Time of Financial Crisis Will Gardner Aon Re Global Agenda CAT101 and CAT201 Revision The Catastrophe Control Cycle Implications of the Financial Crisis CAT101 - An Application
February Economic Activity Index ( GDB-EAI )
") February 2015 Economic Activity Index ( GDB-EAI ) General Commentary February 2015 In February 2015, the GDB-EAI registered a 1.6% year-over-year (y-o-y) reduction, and a month-over-month (m-o-m) increase
February 2015 Economic Activity Index ( GDB-EAI ) General Commentary February 2015 In February 2015, the GDB-EAI registered a 1.6% year-over-year (y-o-y) reduction, and a month-over-month (m-o-m) increase
Global Resilience Risk
 Global Resilience Risk An Insurers Perspective WEC Energy Summit 16 March 2016 Jamie Summons, Head of Weather Solutions, Asia Pacific Swiss Re Weather Market Capability Global presence, market leadership
CERVEJAS AMERICANAS. Distributing Beer in Brazil. MIT Center for Transportation Studies Cambridge, MA & Amaxon Beer Company Miami, FL
 CERVEJAS AMERICANAS Distributing Beer in Brazil MIT Center for Transportation Studies Cambridge, MA & Amaxon Beer Company Miami, FL Matthew Burt, Sanjeev Kalanidhi, Hector Lozano, Gokhan Usanmaz and Wen
Leading Economic Indicator Nebraska
 Nebraska Monthly Economic Indicators: August 15, 2014 Prepared by the UNL College of Business Administration, Department of Economics Authors: Dr. Eric Thompson, Dr. William Walstad Graduate Research Assistants:
What s new in LDI Expanding the toolkit
 Pensions Conference 2012 Steven Catchpole What s new in LDI Expanding the toolkit 1 June 2012 Introduction The LDI toolkit is expanding Several new tools are becoming more common: Swaptions Gilt total
Review of Registered Charites Compliance Rates with Annual Reporting Requirements 2016
 Review of Registered Charites Compliance Rates with Annual Reporting Requirements 2016 October 2017 The Charities Regulator, in accordance with the provisions of section 14 of the Charities Act 2009, carried
What is disaster risk? Progression of approaches. It s not that simple! Increasing disaster losses due to temperature rises and climate change?!
 Increasing disaster losses due to temperature rises and climate change?! A Climate Risk Management Approach to Adaptation to Climate Change and Disaster Reduction Kamal Kishore Bureau for Crisis Prevention
PHOENIX ENERGY MARKETING CONSULTANTS INC. HISTORICAL NATURAL GAS & CRUDE OIL PRICES UPDATED TO July, 2018
 Jan-01 $12.9112 $10.4754 $9.7870 $1.5032 $29.2595 $275.39 $43.78 $159.32 $25.33 Feb-01 $10.4670 $7.8378 $6.9397 $1.5218 $29.6447 $279.78 $44.48 $165.68 $26.34 Mar-01 $7.6303 $7.3271 $5.0903 $1.5585 $27.2714
Pricing Considerations Cattle Pricing and Risk Management
 Pricing Considerations Cattle Pricing and Risk Management Risk Market Outlook Profit Target or Breakeven Derrell S. Peel Agricultural Economics Department Cash High risk/highest return potential Bullish
Ex Ante Tool for Risk Sensitive Development Planning: Probabilistic Catastrophic Hazard Risk Assessment
 Enhancing Knowledge and capacity for the management of disaster risks for a resilient future in Asia and the Pacific Ex Ante Tool for Risk Sensitive Development Planning: Probabilistic Catastrophic Hazard
1.1. Low yield environment
 1. Key developments The overall macroeconomic environment remains very challenging for the European insurance and pension sector. The yields have been further compressed and are substantially below the
DEVELOP THE RIGHT PLAN FOR YOU.
 DEVELOP THE RIGHT PLAN FOR YOU. The Agricultural Risk Consulting Group LLC Developing and Implementing Sound Risk Management Solutions (866) 574-2724 agriskconsulting.net What should you look for in a
MANAGING NATURAL GAS PRICE VOLATILITY
 MANAGING NATURAL GAS PRICE VOLATILITY May 2008 Page 1 141 W Jackson Blvd Suite 1521 Chicago, IL 60604 312.373.8250 info@riskmgmt.net TABLE OF CONTENTS Section 1 Macro Economic Influences on Commodity Pricing
Mechanics of Cash Flow Forecasting
 Texas Association Of State Senior College & University Business Officers July 13, 2015 Mechanics of Cash Flow Forecasting Susan K. Anderson, CEO Anderson Financial Management, L.L.C. 130 Pecan Creek Drive
Key IRS Interest Rates After PPA
 Key IRS Rates - After PPA - thru 2011 Page 1 of 10 Key IRS Interest Rates After PPA (updated upon release of figures in IRS Notice usually by the end of the first full business week of the month) Below
Factor Leave Accruals. Accruing Vacation and Sick Leave
 Factor Leave Accruals Accruing Vacation and Sick Leave Factor Leave Accruals As part of the transition of non-exempt employees to biweekly pay, the UC Office of the President also requires standardization
Modeling the Tradeoff between Inventory and Capacity to Optimize Return on Assets in Production Scheduling
 Modeling the Tradeoff between Inventory and Capacity to Optimize Return on Assets in Production Scheduling Authors: Advisor: Cindy Wu & Jose A Gonzalez Duhart Dr. Bruce Arntzen MIT SCM Research Fest May
The AIR Crop Hail Model for the United States
 The AIR Crop Hail Model for the United States Large hailstorms impacted the Plains States in early July of 2016, leading to an increased industry loss ratio of 90% (up from 76% in 2015). The largest single-day
OTHER DEPOSITS FINANCIAL INSTITUTIONS DEPOSIT BARKAT SAVING ACCOUNT
 WEIGHTAGES JAN FEB MAR APR MAY JUN JUL AUG SEPT OCT NOV DEC ANNOUNCEMENT DATE 19.Dez.14 27.Jän.15 24.Feb.15 26.Mär.15 27.Apr.15 26.Mai.15 25.Jun.15 28.Jul.15 26.Aug.15 23.Sep.15 27.Okt.15 25.Nov.15 MUDARIB
High Resolution Catastrophe Modeling using CUDA
 High Resolution Catastrophe Modeling using CUDA Dag Lohmann, Stefan Eppert, Guy Morrow KatRisk LLC, Berkeley, CA http://www.katrisk.com March 2014, Nvidia GTC Conference, San Jose Acknowledgements This
INDIAN INSTITUTE OF SCIENCE STOCHASTIC HYDROLOGY. Lecture -5 Course Instructor : Prof. P. P. MUJUMDAR Department of Civil Engg., IISc.
 INDIAN INSTITUTE OF SCIENCE STOCHASTIC HYDROLOGY Lecture -5 Course Instructor : Prof. P. P. MUJUMDAR Department of Civil Engg., IISc. Summary of the previous lecture Moments of a distribubon Measures of
Illinois Job Index Note: BLS revised its estimates for the number of jobs and seasonal adjustment method at the beginning of 2010.
 Illinois Job Index Release Data Issue 4/21/2010 Jan 1990 / Mar 2010 Note: BLS revised its estimates for the number of jobs and seasonal adjustment method at the beginning of 2010. For April Illinois Job
February Economic Activity Index ( GDB-EAI )
") February 2014 Economic Activity Index ( GDB-EAI ) General Commentary February 2014 In February 2014, the GDB-EAI registered a 2.4% year-over-year (y-o-y) reduction (the lowest since May 2013), after showing
February 2014 Economic Activity Index ( GDB-EAI ) General Commentary February 2014 In February 2014, the GDB-EAI registered a 2.4% year-over-year (y-o-y) reduction (the lowest since May 2013), after showing
Financial & Business Highlights For the Year Ended June 30, 2017
 Financial & Business Highlights For the Year Ended June, 17 17 16 15 14 13 12 Profit and Loss Account Operating Revenue 858 590 648 415 172 174 Investment gains net 5 162 909 825 322 516 Other 262 146
Homeowners Ratemaking Revisited
 Why Modeling? For lines of business with catastrophe potential, we don t know how much past insurance experience is needed to represent possible future outcomes and how much weight should be assigned to
North Atlantic Coast Comprehensive Study: Resilient Adaption to Increasing Risk
 North Atlantic Coast Comprehensive Study: Resilient Adaption to Increasing Risk U.S. Army Corps of Engineers Coastal Storm Risk Management Planning Center of Expertise Amy M. Guise, USACE 21 November 2013
African Risk Capacity (ARC): Sovereign Disaster Risk Solutions
: Sovereign Disaster Risk Solutions") African Risk Capacity (ARC): Sovereign Disaster Risk Solutions Protecting Livelihoods & Development Gains Cost-effective contingency funding protects livelihoods and development gains 1 A Household Coping
African Risk Capacity (ARC): Sovereign Disaster Risk Solutions Protecting Livelihoods & Development Gains Cost-effective contingency funding protects livelihoods and development gains 1 A Household Coping
Beginning Date: January 2016 End Date: February Managers in Zephyr: Benchmark: Morningstar Short-Term Bond
 Beginning Date: January 2016 End Date: February 2018 Managers in Zephyr: Benchmark: Manager Performance January 2016 - February 2018 (Single Computation) 11200 11000 10800 10600 10400 10200 10000 9800
Uncertainty aspects in process safety analysis
 Uncertainty aspects in process safety analysis A.S. Markowski*,M.S. Mannan**, A.Bigoszewska* and D. Siuta* *Process and Ecological Safety Division Faculty of Process and Environmental Engineering Technical
Resilience in Florida
 Resilience in Florida Parametric Insurance as a Solution to Protection Gaps in Insurance Coverage Instructor: Alok Jha Instructor ID: 1339258 (ID provided by Florida Department of Financial Services) Course
Comprehensive Monthly Financial Report July 2013
 Comprehensive Monthly Financial Report July 2013 MONTHLY FINANCIAL REPORT PERFORMANCE AT A GLANCE ALL FUNDS SUMMARY GENERAL FUND REV VS EXP PROPERTY TAXES SALES TAXES FRANCHISE FEES UTILITY FUND REV VS
Forecasting Emerging Markets Equities the Role of Commodity Beta
 Forecasting Emerging Markets Equities the Role of Commodity Beta Huiyu(Evelyn) Huang Grantham, Mayo, Van Otterloo& Co., LLC June 23, 215 For presentation at ISF 215. The opinions expressed here are solely
May Economic Activity Index ( FAFAA-EAI )
") May 2016 Economic Activity Index ( FAFAA-EAI ) About the interpretation of the FAFAA-EAI The FAFAA-EAI is an indicator of general economic activity, not a direct measurement of real GNP. The annual growth
May 2016 Economic Activity Index ( FAFAA-EAI ) About the interpretation of the FAFAA-EAI The FAFAA-EAI is an indicator of general economic activity, not a direct measurement of real GNP. The annual growth
The risk of losses because the fair value of the Group s assets and liabilities varies with changes in market conditions.
 4. Market risk 51 4.1. Definition 51 4.2. Policy and responsibility 52 4.3. Monitoring 52 4.4. Use of models 52 4.5. Interest rate risk 54 4.5.1. Floor risk 54 4.6. Exchange rate risk 54 4.7. Equity market