Pettis County Missouri 2018 Hazard Mitigation Plan
|
|
|
- Brook Audra Scott
- 5 years ago
- Views:
Transcription


1 Pettis County Missouri 2018 Hazard Mitigation Plan
2 CONTRIBUTORS Jurisdictional Representatives Pettis County Hazard Mitigation Planning Committee Jurisdictional Representatives Pettis County Mitigation Planning Committee Name Title Jurisdiction/Agency/Organization Trisha Rooda Emergency Management Director Pettis County/City of Sedalia Brent Hampy Commissioner Pettis County David Dick Commissioner Pettis County Nathan Cooley GIS Planner Pioneer Trails RPC Rodney Edington Superintendent Green Ridge R-VIII Tom Durrill Operator City of Green Ridge Mark Jackson Deputy EM Pettis County/City of Sedalia Karen Crafton City Clerk City of La Monte Johnathan Peterson Principal Smithton R-VI Kevin Bond Pettis Co. Sherriff Pettis County Amy Fagg Superintendent Pettis County R-V Patrice Cook Principal Pettis County R-XII Tonya Brandkemp City Clerk City of Houstonia Steve Triplett Assistant superintendent Sedalia 200 James Theisen 911 Director Pettis County Stakeholder Representatives Stakeholder Representatives Pettis County Mitigation Planning Committee Name Title Agency/Organization Greg Hanall Deputy Chief Sedalia Fire Department John Cline Sargent Pettis County Sherriff Richie Simons Building/Grounds Sedalia 200 Tom Bailey COO Bothwell Regional Health Ja Hickman Citizen Bothwell Regional Health Damian Lemens Citizen Wireless Investments LLC Eddie S. Citizen Rea Funeral Chapel Phillip Fracica Chief Medical Officer Bothwell Regional Health Christopher Waley Assessor Pettis County Marsha Boeschen Collector Pettis County Brett N Maintenance Director Pettis County Luke Goosen IT Director Pettis County Sherry Jo Painter-Torres Admin. Assistant Clerk Pettis County B.S. Price Citizen Hughesville i
3 Travis Moore Superintendent Pettis County R-XII Stephen Galliher Citizen Pettis County At large Kevin Shaw City Admin Sedalia Ronnie Olliver Mayor City of Green Ridge John DeGunia Police Chief Sedalia Police Department Thomas Mayes Citizen City of Sedalia Brenda Ardrey Citizen City of Sedalia Nick LaStruda County Clerk Pettis County Mike Ditzfeild Fire Chief Sedalia Fire Department ii
4 TABLE OF CONTENTS Contributors... i Table of Contents... iii Executive Summary... iv Prerequisites... v Model Resolution... vi 1 Introduction And Planning Process Planning Area Profile And Capabilities Risk Assessment Flooding (Flash & Ravine) Dam Failure Drought Tornado Thunderstorm/Lighting/High Winds/Hail Winter Weather/Snow/Ice/Severe Cold Extreme Heat Earthquake Land Subsidence/Sinkholes Wildfire Levee Failure Mitigation Strategy Plan Maintenance Process Appendix A: References Appendix B: Planning Process Appendix C: Adoption Resolutions Appendix D: Invite List Appendix E: Action Work Sheets and STAPLEE Scores Appendix F: Public Survey Appendix G: Questionnaires iii
5 Executive Summary The purpose of hazard mitigation is to reduce or eliminate long-term risk to people and property from hazards. Pettis County and participating jurisdictions and school/special districts developed this multijurisdictional local hazard mitigation plan update to reduce future losses from hazard events to the County and its communities and school/special districts. The plan is an update of a plan that was approved in The plan and the update were prepared pursuant to the requirements of the Disaster Mitigation Act of 2000 to result in eligibility for the Federal Emergency Management Agency (FEMA) Hazard Mitigation Assistance Grant Programs. The Pettis County Multi-Hazard Mitigation Plan is a multi-jurisdictional plan that covers the following 13 jurisdictions that participated in the planning process: Pettis County City of Green Ridge City of Houstonia Village of Hughesville City of La Monte City of Sedalia Pettis Co. R-V School District Green Ridge R-VIII School District Sedalia 200 School District Smithton R-VI School District All local jurisdictions and school districts within Pettis County participated in at least part of the planning process. However, three jurisdictions did not complete the full participation requirements and/or adopt the final FEMA approved plan through resolution thus excluding them from this hazard mitigation plan. The three jurisdictions failing to meet all requirements were City of Smithton, Pettis County R-XII School District, and La Monte R-IV School District. Pettis County and the entities listed above developed a Multi-Jurisdictional Hazard Mitigation Plan that was approved by FEMA in February 2013 (hereafter referred to as the 2013 Hazard Mitigation Plan). This current planning effort serves to update that previously approved plan. The plan update process followed a methodology prescribed by FEMA, which began with the formation of a Mitigation Planning Committee (MPC) comprised of representatives from Pettis County and participating jurisdictions. The MPC updated the risk assessment that identified and profiled hazards that pose a risk to Pettis County and analyzed jurisdictional vulnerability to these hazards. The MPC also examined the capabilities in place to mitigate the hazard damages, with emphasis on changes that have occurred since the previously approved plan was adopted. The MPC determined that the planning area is vulnerable to several hazards that are identified, profiled, and analyzed in this plan. Riverine and flash flooding, winter storms, severe thunderstorms/hail/lightning/high winds, and tornadoes are among the hazards that historically have had a significant impact. iv
6 Based upon the risk assessment, the MPC updated goals for reducing risk from hazards. The goals are listed below: 1. Protect the Lives and Livelihoods of all Citizens. 2. Ensure continued operation of government and emergency function in a disaster. 3. Preserve and maintain property, infrastructure, businesses, and jurisdiction vitality. 4. Manage growth through sustainable principles and practices To advance the identified goals, the MPC developed recommended mitigation actions, which are detailed in Chapter 4 of this plan. The MPC developed an implementation plan for each action, which identifies priority level, background information, and ideas for implementation, responsible agency, timeline, cost estimate, potential funding sources, and more. Prerequisites This plan has been reviewed by and adopted with resolutions or other documentation of adoption by all listed participating jurisdictions and schools/special districts. The documentation of each adoption is included in Appendix C, and a model resolution is included on the following page. The following jurisdictions participated in the development of this plan and have adopted the multijurisdictional plan: Pettis County City of Green Ridge City of Houstonia Village of Hughesville City of La Monte City of Sedalia Pettis County R-5 School District Sedalia 200 School District Smithton R-6 School District Green Ridge R-8 School District v
7 Model Resolution for Adoption (LOCAL GOVERNING BODY/SCHOOL DISTRICT), Missouri RESOLUTION NO. A RESOLUTION OF THE (LOCAL GOVERNING BODY /SCHOOL DISTRICT) ADOPTING THE PETTIS COUNTY MULTI-JURISDICTIONAL HAZARD MITIGATION PLAN WHEREAS the (local governing body/school district) recognizes the threat that natural hazards pose to people and property within the (local governing body/school district); and WHEREAS the (local governing body/school district ) has participated in the preparation of a multijurisdictional local hazard mitigation plan, hereby known as the (plan name), hereafter referred to as the Plan, in accordance with the Disaster Mitigation Act of 2000; and WHEREAS the Plan identifies mitigation goals and actions to reduce or eliminate long-term risk to people and property in the (local governing body/school district) from the impacts of future hazards and disasters; and WHEREAS the (local governing body) recognizes that land use policies have a major impact on whether people and property are exposed to natural hazards, the (local governing body/school district) will endeavor to integrate the Plan into the comprehensive planning process; and WHEREAS adoption by the (local governing body/school district) demonstrates their commitment to hazard mitigation and achieving the goals outlined in the Plan. NOW THEREFORE, BE IT RESOLVED BY THE (LOCAL GOVERNMENT/SCHOOL DISTRICT), in the State of Missouri, THAT: In accordance with (local rule for adopting resolutions), the (local governing body/school district) adopts the final FEMA-approved Plan. ADOPTED by a vote of in favor and against, and abstaining, this day of. By (Sig): Print name: ATTEST: By (Sig.): Print name: APPROVED AS TO FORM: By (Sig.): Print name: vi
8 1 INTRODUCTION AND PLANNING PROCESS 1 INTRODUCTION AND PLANNING PROCESS Purpose Background and Scope Plan Organization Planning Process Multi-Jurisdictional Participation The Planning Steps Purpose 1 INTRODUCTION AND PLANNING PROCESS Every year in the United States, natural disasters take the lives of hundreds of people and injure thousands more. Nationwide, taxpayers pay billions of dollars annually to help communities recover from hazard events. Most disasters that occur are predictable and much of the damage caused by these events can be alleviated or even eliminated with proper planning. The Pettis County Multi-Jurisdiction Natural Hazard Mitigation plan is an effort to reduce the impact of natural hazards on citizens and property, by outlining actions that will mitigate the hazards effects and break the cycle of repetitive losses due to disasters. Hazard mitigation as defined by the Federal Emergency Management Agency (FEMA) is any action taken to eliminate or reduce the long-term risk to human life and property from natural and technological hazards. Because Missouri is prone to several types of natural disasters, mitigation planning becomes imperative in preventing human and economic loss. Hazard mitigation planning is the process through which hazards that threaten communities are identified, likely impacts of those hazards are determined, mitigation goals are set and appropriate strategies to lessen impacts are determined, prioritized and implemented. Information in this plan will be used to help guide and coordinate mitigation activities and decisions for local land use policy in future development plans. Proactive mitigation planning will help reduce the cost of disaster response and recovery to the community and its property owners by protecting critical facilities, reducing liability exposure, and minimizing overall community impacts and disruption. This plan is designed to provide a general blueprint for hazard mitigation activities and is structured to serve as the basis for specific hazard mitigation efforts for multiple hazards. The Pettis County mitigation plan complies with the State Emergency Management Agency and FEMA planning guidance; FEMA regulations, rules, guidelines and checklists; Code of Federal Regulations; and existing Federal and State laws; and such other reasonable criterion as the President/Governor, Federal/State congresses and SEMA/FEMA may establish in consultation with City/County governments while the plan is being developed. This plan was prepared pursuant to the requirements of the Disaster Mitigation Act of 2000 (Public Law ) and the implementing regulations set forth by the Interim Final Rule published in the Federal Register on February 26, 2002, (44 CFR 201.6) and finalized on October 31,
9 (Hereafter, these requirements and regulations will be referred to collectively as the Disaster Mitigation Act). The regulations established the requirements for local hazard mitigation plans are in the Robert T. Stafford Disaster Relief and Emergency Act (Public Law ) 1.2 Background & Scope The Pettis County Natural Hazards Mitigation Plan documents Pettis County s hazard mitigation planning process, identifies relevant hazards and risks and outlines the strategy the County and participating jurisdictions will use to decrease hazard vulnerability and increase resiliency and sustainability. This plan was updated in 2018, building off the framework of the 2013 versions of this plan. Information in this plan will be used to help guide and coordinate mitigation activities and decisions for local land use policy in future development plans. Proactive mitigation planning will help reduce the cost of disaster response and recovery to the community and its property owners by protecting critical facilities, reducing liability exposure, and minimizing overall community impacts and disruption. 1.3 Plan Organization Chapter 1: Introduction and Planning Process Chapter 2: Planning Area Profile and Capabilities Chapter 3: Risk Assessment Chapter 4: Mitigation Strategy Chapter 5: Plan Implementation and Maintenance Appendices Table 1.1 Chapter 1 Chapter 2 Chapter 3 Chapter 4 Chapter 5 Changes Made in Plan Update Changes made to timeline and representatives Changes made to capabilities of jurisdictions and ability to mitigate Updated statistics, reviewed hazards, added land subsidence/sinkholes Updated Mitigation Strategy to reflect capabilities of Jurisdictions Updated procedures of maintenance and implementation to reflect jurisdictions requirements. 1.2
10 1.4 Planning Process 44 CFR Requirement 201.6(c)(1): [The plan shall document] the planning process used to develop the plan, including how it was prepared, who was involved in the process, and how the public was involved. The planning process began in August of Initial planning work began with utilizing modern technology to encourage maximum participation. The Pettis County 2013 Natural Hazard Mitigation Plan was posted on the Pioneer Trails Website ( for public review along with a point of contact for comments and questions about the 2013 plan and the update process. In order to comply with the Sunshine Law, all public meeting notices were posted in the Main Entrance to the Pioneer Trails RPC office and website. tifications were also sent to Emergency Managers, Mayor s, Emergency Responders, Area Hospitals, School District Superintendents and Safety Directors of Higher Education Institutions. Mailings and other communications were distributed on a schedule that allowed officials sufficient time to review the draft prior to the next hazard mitigation update public meeting. Cities that were not represented at public meetings were contacted during the planning process to provide data and input on the plan update. Public Meetings were held in October 2017, vember 2017, December 2017, and January Public Meeting Number 1 Wednesday October 11, 2017 Pettis County Public Safety Building 319 S. Lamine Sedalia, MO The first public meeting introduced the public to the Hazard Mitigation update process. The four-phase process was described and outline and a timeframe for the update was discussed. The initial public meeting was an overview of the first two phases of hazard mitigation planning, resource allocation and identifying hazards. Utilizing FEMA guidelines, specifically FEMA-386, worksheet packets were generated and provided to attendees. Meeting attendees were asked to fill out the worksheets and respond back to provide input into the update. Public Meeting Number 2 Tuesday vember 7, 2017 Pettis County Public Safety Building 319 S. Lamine Sedalia, MO need to be introduced or revised. Public Meeting Number 3 Tuesday December 5, 2017 Pettis County Public Safety Building 319 S. Lamine Sedalia, MO The second public meeting reviewed the resources available in Pettis County as well as hazard identification. The third phase of the hazard mitigation process was also introduced and discussed. Attendees reviewed goals, objectives and strategies from the 2013 plan to discuss actions that were accomplished in regards to hazard mitigation and what goals The third hazard mitigation public meeting reviewed the Questionnaires, and clarified questions regarding the layout of the mitigation plan to date. Public Meeting Number 4 Tuesday January 9, 2018 Pettis County Public Safety Building 319 S. Lamine Sedalia, MO Meeting number four reviewed the Pettis hazard mitigation plan to date and emphasized the importance of returning signed resolutions from all jurisdictions. 1.3
11 Table 1.2 Jurisdictional Representatives Pettis County Mitigation Planning Committee Name Title Jurisdiction/Agency/Organization Trisha Rooda Emergency Management Director Pettis County/City of Sedalia Brent Hampy Commissioner Pettis County David Dick Commissioner Pettis County Nathan Cooley GIS Planner Pioneer Trails RPC Rodney Edington Superintendent Green Ridge R-VIII Tom Durrill Operator City of Green Ridge Mark Jackson Deputy EM Pettis County/City of Sedalia Karen Crafton City Clerk City of La Monte Johnathan Peterson Principal Smithton R-VI Kevin Bond Pettis Co. Sherriff Pettis County Amy Fagg Superintendent Pettis County R-V Patrice Cook Principal Pettis County R-XII Tonya Brandkemp City Clerk City of Houstonia Steve Triplett Assistant superintendent Sedalia 200 James Theisen 911 Director Pettis County Multi-Jurisdictional Participation 44 CFR Requirement 201.6(a)(3): Multi-jurisdictional plans may be accepted, as appropriate, as long as each jurisdiction has participated in the process and has officially adopted the plan. The Plan serves as a written document of the planning process. Active participation of local jurisdiction representatives and stakeholders in the hazard mitigation planning process is essential if the Plan is to have value. To be eligible for mitigation funding, local governments must adopt the FEMA-approved update of the Plan. The participation of the local government stakeholders in the planning process is considered critical to successful implementation of this plan. Each jurisdiction that is seeking approval for the Plan must have its governing body adopt the updated plan, regardless the degree of modifications. PTRPC collaborated with the local governments in Pettis County to assure participation in the planning process and the development of a plan that represents the needs and interests of Pettis County and its local jurisdictions. Appendix C contains resolutions for jurisdictions adopting the Plan. County Commissioners, incorporated communities, public school and special districts, and various other stakeholders in mitigation planning were invited to a kick-off meeting for the Plan update on October 11, At this meeting it was explained that the Disaster Mitigation Act (DMA) requires each jurisdiction participating in the planning process officially adopt the plan. The criteria for participation that each jurisdiction must meet in order to be considered a participant in the Plan was established at this meeting and include the following: Participation in at least two (2) MPC meetings, by either direct participation or authorized representation; Each participating jurisdiction must provide to the MPC sufficient information to support plan development by completion and return of Data Collection Questionnaires and 1.4
12 validating/correcting critical facility inventories; Identification and Cost/Benefit Review of Mitigation Actions; Review and comment on plan drafts; Provide documentation to show time donated to the planning effort In order to be included in the plan as a participating jurisdiction, each jurisdiction was required to send a representative to two (2) meetings and completion of data collection questionnaire as minimum requirements. If, however, a representative was not able to attend at least two meetings they were encouraged to arrange for a one-to-one meeting with PTRPC staff or contact the PTRPC office to obtain information presented at any of the planning meetings. Although not required, a set of standards for participation were developed in order for each jurisdiction to participate in the planning process and account for the variability of resources within each jurisdiction. This set of standards included; identifying and cost/benefit review of mitigation actions, reviewing and commenting on plan draft materials, and providing documentation to show time donated to the planning effort. Jurisdictions that met at least one (1) of the minimum requirements and any combination of additional three standards are considered to have satisfactorily participated in the planning process. Table 1.3 shows the representation of each participating jurisdiction at the planning meetings and the provision of responses to the Data Collection Questionnaire. All jurisdictions 44 CFR Requirement 201.6(a)(3): Multi-jurisdictional plans may be accepted, as appropriate, as long as each jurisdiction has participated in the process and has officially adopted the plan. 1.6 participating in the Plan reviewed or commented on the draft Plan, participated in the update/development of mitigation actions, or documented the donation of time. Meeting sign-in sheets are located in Appendix B. Table 1.3 Jurisdiction Kick-off Meeting Hazard Mitigation Planning Participation by Jurisdiction Meeting #2 Meeting #3 Meeting #4 Data Questionnaire Completed Update/Develop Mitigation Actions Adopted HMP Through Resolution Pettis County X X X X X X X City of Green Ridge X X X X X X City of Houstonia X X X X X Village of Hughesville X X X X X City of La Monte X x X X X X City of Sedalia X X X X X X X Green Ridge R-VIII X X X X X Pettis Co. R-V X X X X X Sedalia 200 X X X X X X Smithton R-VI X X X X X 1.5
13 1.4.2 Planning Steps FEMA s Local Mitigation Planning Handbook (March 2013), Local Mitigation Plan Review Guide (October 1, 2011), and Integrating Hazard Mitigation into Local Planning: Case Studies and Tools for Community Officials (March 1, 2013) were used as the source for developing the Plan update Process. The development of the plan followed the 10-step planning process adapted from FEMA s Community Rating System (CRS) and Flood Mitigation Assistance programs. The 10-step process allows the Plan to meet funding eligibility requirements of the Hazard Mitigation Grant Program, Pre-Disaster Mitigation Program, Community Rating System, and Flood Mitigation Assistance Program. Table 1.4 shows how the CRS process aligns with the Nine Task Process outlined in the 2013 Local Mitigation Planning Handbook. Following Table 1.4 is a summary of how PTRPC staff used the Nine Task Process to develop the update to the Plan Table 1.4 Pettis County Mitigation Plan Update Process Community Rating System (CRS) Planning Steps (Activity 510) Step 1. Organize Step 2. Involve the public Step 3. Coordinate Step 4. Assess the hazard Step 5. Assess the problem Step 6. Set goals Step 7. Review possible activities Step 8. Draft an action plan Step 9. Adopt the plan Step 10. Implement, evaluate, revise Step 1: Organize the Planning Team (Handbook Tasks 1 & 2) Local Mitigation Planning Handbook Tasks (44 CFR Part 201) Task 1: Determine the Planning Area and Resources Task 2: Build the Planning Team 44 CFR 201.6(c)(1) Task 3: Create an Outreach Strategy 44 CFR 201.6(b)(1) Task 4: Review Community Capabilities 44 CFR 201.6(b)(2) & (3) Task 5: Conduct a Risk Assessment 44 CFR 201.6(c)(2)(i) 44 CFR 201.6(c)(2)(ii) & (iii) Task 6: Develop a Mitigation Strategy 44 CFR 201.6(c)(3)(i); 44 CFR 201.6(c)(3)(ii); and 44 CFR 201.6(c)(3)(iii) Task 8: Review and Adopt the Plan Task 7: Keep the Plan Current Task 9: Create a Safe and Resilient Community 44 CFR 201.6(c)(4) In March 2017, PTRPC entered into cooperative agreements with SEMA and Pettis County to prepare this multi-jurisdictional plan for public entities in Pettis County. Discussions on the development of the Pettis County Multi-Jurisdictional Natural Hazard Mitigation Plan began in August 2017 with an introductory scoping meeting attended by PTRPC staff. This meeting was conducted to discuss the timeline for developing the hazard mitigation plan, the planning process, identification of stakeholders and community organizations to include in the planning process and a date for the kick-off meeting for 1.6
14 October 11, 2017 to initiate participation of jurisdictions and public entities in the planning process. The PTRPC staff identified prospective participant representatives and stakeholders and a contact list was prepared for mailing an invitation letter to the kick-off Meeting. The list of invitees included local elected officials, municipal government staff, county government staff, emergency services personnel, public school administrators, members from health and social services organizations, and volunteer organizations. A complete list of invitees is in Appendix D. The MPC met on several occasions from August 2017 through March 2018 to collaborate on the development of the Plan update. Participants assisted in data collection; reviewed and revised the Plan s goals, objectives and mitigation strategies; and provided reviews and comments on the Plan throughout the update process. Communication with MPC members occurred throughout the planning process through face-to-face meetings, phone interviews, and correspondence in addition to committee meetings. Table 1.5 shows the meeting schedule and items discussed for MPC meetings. Table 1.5 Schedule of Hazard Mitigation Meetings Meeting Topic Date Informational Meeting Prospective participants and stakeholders identified, contact list to be prepared. Schedule Kick-Off Meeting, date, time, and location. 8/2017 Kick-off Meeting Planning Meeting #2 Planning Meeting #3 Draft invitation letters Raising awareness for mitigation strategy/ increase countywide preparedness to natural hazards The Disaster Mitigation Act of 2000 Mitigation Planning Process Local Plan Participation Project Timeline Reviewed the resources available in Pettis County as well as hazard identification. The third phase of the hazard mitigation process was also introduced and discussed. Discuss actions that were accomplished in regards to hazard mitigation and what goals need to be introduced or revised Reviewed Questionnaires. Answered question regarding definitions in mitigation plans. Discussed actions completed and revised sections. 10/11/ /7/ /5/
15 Planning Meeting #4 Reviewed Questionnaires. Reviewed hazard mitigation plan draft. Reviewed jurisdiction resolutions Answered questions regarding resolutions 1/9/2018 Step 2: Plan for Public Involvement (Handbook Task 3) 44 CFR Requirement 201.6(b): An open public involvement process is essential to the development of an effective plan. In order to develop a more comprehensive approach to reducing the effects of natural disasters, the planning process shall include: (1) An opportunity for the public to comment on the plan during the drafting stage and prior to plan approval. It was determined meeting dates and invitations were posted on the PTRPC website along with drafts of the Plan for public comment during the drafting stage and prior to submission of the Plan to SEMA for approval. A final draft of the Plan was posted on the PTRPC website starting in February 2018 prior to being submitted to SEMA for approval. It was also discussed at the kick-off meeting that informal solicitation of public input would be sought by members of the MPC through announcements at gatherings and other public meetings, such as board of alderman and local emergency planning committee meetings. This plan for public involvement did not result in any public comment on the Plan. The reasons for lack of public comment are likely due to lack of effectiveness of legal notices and web postings. The MPC also decided to use a public survey to get more response from the public. The survey was distributed to all jurisdictions to make available to their residents. An online survey was also made available through SurveyMonkey and a link then posted on the county web site and Pettis Co. EMA social media pages. Eighty-eight survey responses were collected via SurveyMonkey. Paper surveys that were received from the public totaled
16 Potential Magnitude Likelihood The following tables show survey responses and other comments. A copy of the public survey is included in Appendix F. Jurisdiction Pettis Co R-XII Flooding Dam failure Earthquake Sinkholes Drought Extreme Temps Severe Tstorm Severe Winter Tornadoes Wild Fire Flooding Dam failure Earthquake Sinkholes Drought Extreme Temps Severe Tstorm Severe Winter Tornadoes Wild Fire Pettis Co. R-XII COMMENTS: -- more knowledgeable to community on shelters/ when open/ when to seek shelter --schools have mass text; why can t tornadoes be mass texted to community --ensure adequate warning systems are in place in all areas, so people have enough warning in case of emergency -- Department stores built with safe rooms 1.9
17 Potential Magnitude Likelihood Jurisdiction Green Ridge Flooding Dam failure Earthquake Sinkholes Drought Extreme Temps Severe Tstorm Severe Winter Tornadoes Wild Fire Flooding Dam failure Earthquake Sinkholes Drought Extreme Temps Severe Tstorm Severe Winter Tornadoes Wild Fire Green Ridge Comments: --power & obstruction free roads; city can maintain its self from most events --Would like to see planning for natural disaster response done with the community for those who want to help in case of an event. --Tornado shelter LEAKS 1.10
18 Potential Magnitude Likelihood Jurisdiction La Monte Hughesville Smithton R-VI Monkey Average Flooding Dam failure Earthquake Sinkholes Drought Extreme Temps Severe Tstorm Severe Winter Tornadoes Wild Fire Flooding Dam failure Earthquake Sinkholes Drought Extreme Temps Severe Tstorm Severe Winter Tornadoes Wild Fire Hughesville Comments: - improve law enforcement system -Tornado site at the school always had water standing in it. I feel the hazard is more from that than the tornado. Fix existing on and we should be fine. -water/sewer lines old & cannot find Smithton R-VI Comments: - bigger storm shelters so they can hold larger amount of people in dangerous situations - People to collect large limbs after a disaster event 1.11
: An open public involvement process is essential to the development of an effective plan.")
19 Step 3: Coordinate with Other Departments and Agencies and Incorporate Existing Information (Handbook Task 3) 44 CFR Requirement 201.6(b): An open public involvement process is essential to the development of an effective plan. In order to develop a more comprehensive approach to reducing the effects of natural disasters, the planning process shall include: (2) An opportunity for neighboring communities, local and regional agencies involved in hazard mitigation activities, and agencies that have the authority to regulate development, as well as businesses, academia and other private and non-profit interests to be involved in the planning process. (3) Review and incorporation, if appropriate, of existing plans, studies, reports, and technical information. As stated in Section 1.4, neighboring communities, businesses, academia, and other non-profit interests were notified via and letters, a notification was sent to adjacent county Emergency Management Directors, Chambers of Commerce, local and regional agencies, such as; OACAC, Health Departments, American Red Cross, Ambulance Districts, and the University of Missouri Extension office. A complete listing of agencies invited to participate in the planning process and what meetings they were invited to attend is included in Appendix D. Coordination with FEMA Risk MAP Project There was no coordination with FEMA RiskMAP projects during the update of this plan, as ongoing efforts were preliminary. Figure
20 Integration of Other Data, Reports, Studies, and Plans A significant amount of information has been updated and revised based on the review of existing plans, studies, and reports. A few examples of information included are as listed below, a complete list of references can be found in Appendix A. Pettis County Emergency Operations Plan Current Missouri State Hazard Mitigation Plan State department of Natural Resources (DNR) National inventory of Dams (NID) Missouri Department of Conservation (MDC) Local comprehensive plans Economic Development Plans US Department of Agriculture (USDA) Step 4: Assess the Hazard: Identify and Profile Hazards (Handbook Task 5) At the third MPC meeting profiles of identified hazards from the 2013 Plan were presented. Storm event data from the National Center for Environmental Information for the five-year period since the adoption of the 2013 Plan were included in the hazard profiles. The presentation incorporated data from studies, reports, and technical information available through internet research. During the process of identifying hazards the MPC reviewed: Previous disaster declarations in the county Hazards in the most recent State Hazard Mitigation Plan Hazards identified in the previously approved hazard mitigation plan. The MPC was asked to prioritize the identified hazards based on probability of occurrence, human impact, property impact, and likely functional downtime of facilities and businesses. Additional information about the conclusions drawn at this meeting can be found in the Risk Assessment chapter of the Plan. Step 5: Assess the Problem: Identify Assets and Estimate Losses Identified assets in the planning area include population, structures, critical facilities and infrastructure, and other important assets that may be at risk to hazards. The inventory of assets for each jurisdiction was derived from parcel data from the Pettis County Assessor, the Pettis County Structures dataset, local jurisdiction data collection questionnaires, and HAZUS MH 2.2. Potential losses to existing development were estimated based on hazard event scenarios. In most cases the county assessor s appraised improved values were used to estimate structure losses in impacted areas for structure occupancy types. The methodology for estimating losses varies by hazard. Loss estimates are included in each hazard profile of the Risk Assessment chapter. 1.13
21 Step 6: Set Goals (Handbook Task 6) The MPC conducted a discussion session during their second meeting to review and update the Plan goals. To ensure that the goals developed for this update were comprehensive and supported State goals, the 2013 State Plan goals were reviewed. The MPC also reviewed the goals from current surrounding county plans. In the 2013 Plan, the organization of the actions included broad goals and a set of objectives linking the actions to the goals. The MPC opted to keep the goals from the 2013 Plan. The plan updates goals and objectives area as follows: Goal 1: Protect the lives and livelihoods of all citizens. Objective 1.1 Provide sufficient warning systems Objective Decrease the occurrence and impact of flooding Objective 1.3 Increase knowledge of safety measures among employers and the general public Goal 2: Manage growth through sustainable principles and practices. Objective 2.1 Reduce and prevent degradation of, or conflicts with, natural resources Goal 3: Ensure continued operation of government and emergency functions during and after a disaster. Objective 3.1 Strengthen critical structures and infrastructure Objective 3.2 Strengthen multi-jurisdictional cooperation among emergency agencies Goal 4: Preserve and maintain property, infrastructure, business, and jurisdiction vitality. Objective 4.1 Reduce or prevent impacts from hazards on private property Objective 4.2 Reduce or prevent impacts from hazards on public property Step 7: Review Possible Mitigation Actions and Activities The focus of the MPC meeting on December 5, 2017 was update of the mitigation strategy. For a comprehensive range of mitigation actions to consider, the MPC reviewed the following information during the meeting: A list of actions proposed in the previous mitigation plan, the current State Plan, and approved plans in surrounding counties, Key issues from the risk assessments, including the Problem Statements concluding each hazard profile and vulnerability analysis, State priorities established for Hazard Mitigation Assistance grants, and input during meetings, responses to Data Collection Questionnaires. Jurisdiction representatives on the MPC were encouraged to review the details of the risk assessment vulnerability analysis specific to their jurisdiction. They were also provided a link to the FEMA s publication, Mitigation Ideas: A Resource for Reducing Risk to Natural Hazards (January 2013). 1.14
22 This document was developed by FEMA as a resource for identification of a range of potential mitigation actions for reducing risk to natural hazards and disasters. Step 8: Draft an Action Plan At the final MPC meeting on January 9, 2018 all proposed actions were subjected to a cost/benefit review using a modified STAPLEE scoring method. The STAPLEE scoring method is discussed in the Mitigation Strategy chapter. The method was used to develop a priority score for proposed actions. Several lower scoring actions were discarded. This meeting also included action worksheets to clarify what department or position would be responsible for implementing the action, potential funding sources, timeline, and local planning mechanisms for implementation. The action plans are listed for each jurisdiction in the Mitigation Strategy chapter. Step 9: Adopt the Plan (Handbook Task 8) Once the Plan is approved by SEMA and FEMA then the governing body of each jurisdiction must adopt the plan by resolution to be eligible for hazard mitigation assistance. Adoption resolutions will be collected and submitted with the final plan to SEMA and FEMA. Adoption resolutions are included in Appendix C. Step 10: Implement, Evaluate, and Revise the Plan (Handbook Tasks 7 & 9) At the final MPC meeting on January 9, 2018 the MPC developed and agreed upon an overall strategy for plan implementation and for monitoring and maintaining the plan over time. The overall strategy has been updated and is presented in the Plan Maintenance chapter. 1.15
23 2 PLANNING AREA PROFILE AND CAPABILITIES 2 PLANNING AREA PROFILE AND CAPIBILITIES Pettis County Planning Area Profile Geography, Geology, and Topography Climate Population/Demographics History Occupations Agriculture FEMA Hazard Mitigation Assistance Grants in Planning Area Jurisdictional Profiles and Mitigation Capabilities Pettis County City of Green Ridge City of Houstonia Village of Hughesville City of La Monte City of Sedalia Special Districts Public School District Profiles & Mitigation Capabilities PLANNING AREA PROFILE AND CAPABILITIES 2.1 Pettis County Area Profile Pettis County is located in west central Missouri and is a neighbor to seven other counties. Population in Pettis County is 42,213, according to 2016 Census Bureau estimates. Pettis County population has gained 2810 people, +6.7%, since the 2000 census when 39,403 people resided in Pettis County. This is compared to the population growth of Missouri of 7% and the United States of 9.7% during the same time period. The 2015 American Community Survey 5-Year Estimate (ACS), puts Pettis County s median household income at 39,928 in The 2000 Census shows a median household income for Pettis County to be 31,822. The increase for median household income, $8010, is a 20.3% increase from the 2000 census. The average estimated home value in Pettis County is $101,400, according to the 2015 ACS. Compared to the average home value in Missouri, $138,400, Pettis County s average home value is 26.78% lower than that of Missouri and 43.67% lower than the national estimated home value of $176,400. Home values have increased from $93,200 in 2010, to the current average $101,400, an 8.07% increase. 2.1

24 Figure 2.1 Pettis County Base Map 2.2

25 2.1.2 Geography, Geology and Topography Pettis County encompasses square miles in the rural part of Missouri, 45mi to the east of Kansas City and 20mi south of the Missouri River, and averages 61.9 people per square mile in The largest populated area within Pettis County is Sedalia. Figure 2.2 State topographic relief Soils There is a total of seven soil associations in Pettis County including the Dockery-Tangle nooklamine Association, Pershing-Green ton-dockery Association, Hartwell Association, BluelickGoss-Pembroke Association, Maplewood-Paintbrush-Eldon Association, Arispe-MacksburgGreenton Association, Eldon- Paintbrush-Bahner Association. The Dockery-Tanglenook-Lamine Association landscape association consists of flood plains along streams that dissect the county. This association makes up about 3 percent of the county. It is about 48 percent Dockery soidl, 22 percent Tanglenook and similar soils, 18 percent Lamine soils and 12 percent minor soils. Dockery soils are somewhat poorly drained. They are on flood plains adjacent ot stream channels. Thanglenook soil are poorly drained. 2.3
26 They are on high stream flood plains few feet higher than the adjacent bottom land. Lamine soils are somewhat poorly drained. They are on high stream flood plains a few feet high that the adjacent bottom land. Pershing-Greenton-Dockery Association landscape consists of branching ridge tops with sloping areas between them that form the beginnings of a dissected drainage pattern. This association makes up about 6 percent of the county. It is about 32 percent Pershing and similar soils, 22 percent Greenton and similar soils, 11 percent Dockery soils, and 35 percent minor soils. Pershing soils are gently sloping and moderately sloping. They formed in loess. They are on ridge tops, side slopes and foot slopes. Greenton soils are moderately sloping and strongly sloping. They formed in a thing mantle of loess underlain by shale and limestone residuum. They are on side slopes. Dockery soils are nearly level. They formed in alluvium. They are on flood plains. Hartmwell Association landscape consists of long, brnachning ridge tops and extremely long side slopes that are very gently sloping. Foot slopes below the side slopes are adjacent to small flood plains that converge downward in the landscape toward larger streams. This association makes up about 15 percent of the county. Ti is about 84 percent Hartwell soils and 16 percent minor soils; Hartwell soils are on ridge tops, side slopes and foot slopes. Bluelick-Goss-Pembroke Association landscape consists of long main ridge tops with numerous lateral side ridges sloping areas between the side ridges. The ridge tops begin a branching pattern of drainage that converges to form small drainage ways connecting with larger streams. Strongly sloping to steep areas with prominent drainage patterns border these bottomland areas. This association makes up about 19 percent of the county. It is about 25 percent Bluelick soils, 22 percent Goss and similar soils, 20 percent Pembroke soils, and 33 percent minor soils. Bluelick soils are gently sloping to strongly sloping. They are comprised of loess in the underlying cherty limestone residuum. They are on ridge tops and side slopes. Goss Soils are moderately steep and steep. They formed in cherty limestone or dolomite residuum. They are on side slopes. Pembroke soils are gently sloping to strongly sloping. They formed in loess. They are on ridge tops, side slopes and foot slopes. Maplewood-Paintbrush-Eldon Association landscape consists of long main ridge tops with numerous lateral side ridges separated by long side slopes and narrow banking drainage ways. This association makes up about 18 percent of the county. It is about 28 percent Maplewood and similar soils, 26 percent paintbrush and similar soils, 12 percent Eldon and similar soils, and 34 percent minor soils. Maplewood soils are gently sloping and are somewhat poorly drained. They formed in loess and in the underlying cherty limestone and dolomite residuum. They are one ridge tops and side slopes. Eldon soils are moderately sloping and strongly clopping and are well drained. They formed in cherry limestone and dolomite residuum. They are on side slopes. Arispe-Macksburg-Greenton Association landscape consists of long, broad, branching main ridges with numerous lateral side ridges. Long, concave side slopes between the main ridges begin a pattern of branching drainage that converges to form small flood plains. This association makes up about 32 percent of the county. It is about 52 percent Arispe soils, 25 percent Macksburg soils, 11 percent Greenton Soils, and 12 percent minor soils. Macksburg soils are gently sloping. They formed in loess. They are on ridge tops. Greenton soils are gently sloping and moderately sloping. They formed in a thing mantle of loess and in the underlying limestone and shale residuum. They are on side slopes. 2.4
27 Eldon-Paintbrugh-Bahner Association The landscape of this association consists of long main ridge tops with numerous lateral side ridges. Sloping areas between the side ridges begin a branching pattern of drainage that converges to form small flood plains adjacent to larger streams. Strongly-sloping to steep areas with prominent drainage patterns border these bottomland areas. This association makes up about 7 percent of the county. It is about 48 percent Eldon and similar soils, 20 percent Paintbrush soils, 10 percent Bahner soils, and 22 percent minor soils. Eldon soils are moderately sloping and strongly sloping and are well drained. They are on side slopes. Paintbrush soils are gently sloping and moderately sloping and are moderately well drained. They are on ridge tops and side slopes. Bahner soils are gently sloping and moderately sloping and are moderately well drained. They are on ridge tops and side slopes Climate National Center for Environmental Information data shows Pettis County having a moderate climate where average high temperatures range from 41F, winter, to 86F degrees in the summer. July averages the warmest temperature at 87 degrees. January s average high temperature of 38 degrees makes if the coldest month of the year. Average low temperatures range from 18 to 66 degrees. Annual precipitation in Pettis County on average is 44.3 inches. Eighty-six percent of the annual precipitation falls in the form of rain with the summer season averaging the most, in, or 36% of the total. Winter precipitation averages 6.1 inches. *As of this writing ( ) the data on climate is the most recent data available to us from the website ( which is from when future data becomes available to us we will implement it in future updates to this plan. Table 2.1 NCEI Monthly rmal for Sedalia, Pettis County, Month: Jan Feb Mar Apr May Jun Jul Aug Sep Oct v Dec Annual rmal Max Temp (⁰F) rmal Min Temp rmal Mean Temp rmal Precipitation (in) Source: 2.5
28 Jan Feb Mar Apr May Jun Jul Aug Sep Oct v Dec rmal Max Temp rmal Min Temp rmal Mean Temp Population/Demographics Table 2.2 Jurisdiction Pettis County Population by Jurisdiction ACS % POP Est. Change Change Pettis Co.- Unincorporated 16,596 18, % Green Ridge % Houstonia % Hughesville % La Monte 1,064 1, % Sedalia 20,339 21,489 1, % Pettis Co. Total 39,403 42,213 2, % Source: U.S. Bureau of the Census, Decennial Census Pettis County s most at-risk populations are for the most part, on par with state and national averages. Children under age 5 in the county, comprising 6.9% of the total population, is slightly higher compared to state and national averages of 6.2%. The county has a slightly higher elderly population, or those above the age of 65, at 15.3% of the population, which matches Missouri s percentage but is higher than the national percentage of 14.5%. In addition, Pettis County s median age is 37.5 compared to the national age of 37.7 and the state average at
29 Pettis County contains 18,204 housing units, 2,200 of which are vacant, at an average household size of 2.52, which is lower than both the state and national averages. Table 2.3 provides the number of Pettis County residents within specific age groups and a comparison of percentages with the state of Missouri and the United States. Table 2.3 Pettis County Population Age Composition, Missouri/United States Comparison Age Group # of People Percent of Population Missouri Percent United States Percent Under 5 2, % 6.2% 6.2% 5 to 9 years 2, to 14 years 3, to 19 years 2, to 24 years 2, to 34 years 5, to 44 years 4, to 54 years 5, to 59 years 2, to 64 years 2, to 74 years 3, to 84 years 1, years and over 1, % 2% 1.9% Total Population 42,193 6,059, ,745,538 Median Age (years) Source: U.S. Census Bureau, Table 2.4 provides additional demographic and economic indicators for Pettis County, and incorporated communities compared to the state of Missouri and the United States. The county as a whole had slightly lower percentages of unemployment but higher families living below the poverty level than the state of Missouri or the United States. In terms of education, the percentage of population in the county that is a high school graduate, 83.1%, was less than Missouri or the United States, 88.8% and 87% respectfully. The percentage of the county population that spoke a language other than English in the home, 10.4%, is higher than Missouri, 6%, however, it was considerably less than the United States, 21.1%. Table 2.4 Unemployment, Poverty, Education, and Language Percentage Demographics for Pettis County Jurisdiction Total in Labor Force Percent Population Unemployed Percent Families Below Poverty Level Percent Population High School Grad Percent Population Bachelor degree or higher Percent Population Language other than English Pettis County 20, % 12.8% 83.1% 17.2% 10.4% Green Ridge
30 Houstonia Hughesville La Monte Sedalia 10, Missouri 3,055, United States 160,818, % 11.0% 87.0% 30.3% 21.1% Source: U.S. Census Bureau, History Pettis County is one of 115 counties and county equivalent cities in Missouri. Organized in January 26, 1833, it took its name from Spencer Pettis, the third Congressman from Missouri, elected in 1828, when the entire State made but one congressional district. He is remembered for his duel with Major Thomas Biddle, which resulted in the death of both. The Territory of Pettis County was taken from the counties of Cooper and Saline; at one time the southern boundary of Saline County passed through the present city of Sedalia. During the Civil War sentiment was greatly divided and a large number of the armsbearing people entered one or the other of the contending armies. With the exception of the attack upon Sedalia during the Price raid in 1864, the county saw little of war except the occasional passage of troops. However, the county seat was a large military post and depot. A few of the personal feuds which so greatly marred some other portions of the estate did exist in this County. Pettis County is a strong rural county, but Sedalia was closely tied to the railroad lines passing through it. Those times are almost forgotten, except for the annual Ragtime Festival held to commemorate the partnership in Sedalia of music publisher John Stark and ragtime composer Scott Joplin Occupations Table 2.5 Management, Business, Science, & Arts Occupations Occupation Statistics, Pettis County Missouri Service Occupations Sales & Office Occupations Natural Resource Construction & Maintenance Occupations Production, Transportation & Material Moving Occupation Jurisdiction Pettis County 27.2% 18.6% 21.8% 9.4% 23.0% Green Ridge 23.6% 26.9% 17.9% 9.4% 22.2% Houstonia 24.2% 14.1% 22.2% 11.1% 28.3% Hughesville 20.3% 14.1% 20.3% 10.9% 33.4% La Monte 12.7% 17.3% 19.9% 9.4% 40.7% Sedalia 25.5% 21.8% 23.2% 6.3% 23.3% Source: U.S. Census, 2016 American Community Survey, 5-year Estimates. 2.8
31 2.1.7 Agriculture According to the United States Department of Agriculture (USDA) 2012 Agricultural Census, there were 1,311 farms covering 419,697 acres in Pettis County. The average farm size was 320 acres, which was slightly larger than the average farm size in Missouri at 285 acres, with a market value of $177,001,000 of agricultural products sold. The average market value of products sold per farm was $135,019. Of the total, 69% was from livestock sales and 31% came from crop sales. 2.9
32 Disaster Number FEMA Hazard Mitigation Assistance Grants in Planning Area Project Number Project Title Subgrantee Type Status Date Approved 206.2: Safe Room (Tornado and Sedalia Skyline Severe Wind School Tornado Pettis Shelter) - Public Saferoom (County) Structures Closed 5/28/ Pettis County Hughesville Tornado Saferoom Pettis County Maplewood Tornado Saferoom Project Pettis County LaMonte Tornado Saferoom Project Pettis County Smithton Tornado Saferoom Project Pettis County Houstonia Tornado Saferoom Pettis (County) Pettis (County) Pettis (County) Pettis (County) Pettis (County) 206.2: Safe Room (Tornado and Severe Wind Shelter) - Public Structures Closed 6/18/ : Safe Room (Tornado and Severe Wind Shelter) - Public Structures Closed 5/28/ : Safe Room (Tornado and Severe Wind Shelter) - Public Structures Closed 8/25/ : Safe Room (Tornado and Severe Wind Shelter) - Public Structures Closed 5/28/ : Safe Room (Tornado and Severe Wind Shelter) - Public Structures Closed 5/28/2013 Date Closed Approved Net Federal Share Obligated n Federal Share Properties BCR 5/28/2 013 $398,503 $298,877 $99, /28/2 013 $276,252 $207,189 $69, /12/2 013 $352,968 $264,725 $88, /17/2 010 $367,000 $275,250 $91, /28/2 013 $305,117 $228,838 $76, /28/2 013 $272,116 $204,087 $68,
33 Pettis County Sedalia Pettis & Ohio Saferoom Pettis County Green Ridge Tornado Saferoom Project MO State Fairgrounds Warning Siren System Pettis (County) Pettis (County) MISSOURI DEPARTMEN T OF AGRICULTUR E 206.2: Safe Room (Tornado and Severe Wind Shelter) - Public Structures Closed 5/28/ : Safe Room (Tornado and Severe Wind Shelter) - Public Structures Closed 5/28/ : Warning Systems (as a Component of a Planned, Adopted, and Exercised Risk Reduction Plan) Closed 4/1/2014 5/28/2 013 $387,212 $290,409 $96, /28/2 013 $260,885 $195,664 $65, /21/2 014 $88,800 $66,600 $22,
34 2.2 Jurisdictional Profiles and Mitigation Capabilities This section will include individual profiles for each participating jurisdiction. It will also include a discussion of previous mitigation initiatives in the planning area. There will be a summary table indicating specific capabilities of each jurisdiction that relate to their ability to implement mitigation opportunities. The unincorporated county is profiled first, followed by the incorporated communities, the special districts, and the public-school districts Unincorporated Pettis County Pettis County is classified as a 4th class county. Its county seat is Sedalia. The County is governed by a three-member County Commission, led by the presiding Commissioner. The County government is divided into the following departments and divisions: Assessor s Office, Auditor s Office, Circuit Court Clerk, County Clerk, County Commission, Public Administrator s Office, Prosecuting Attorney s Office, Recorder, Sheriff s Department, and Treasurer s Office. The county and its cities collaborate on numerous issues such as infrastructure, law enforcement, and emergency services. MoDOT and the county and cities collaborate concerning transportation issues. The Missouri Department of Conservation (MDC) and local firefighters work together to safeguard the county s forested areas. Mitigation Initiatives/Capabilities Staff capabilities to mitigate the impact of natural hazards include the County Commission and the Pettis County/Sedalia Emergency Management Agency. The Pettis County / City of Sedalia Emergency Management Agency is responsible for developing and updating annually a Pettis County/City of Sedalia Emergency Operation Plan which lays a framework that will allow Pettis County and the City of Sedalia to save lives, minimize injuries, protect property and the environment, preserve functioning civil government, and maintain economic activities essential to the survival and recovery from natural and manmade disasters. This plan was developed through the collaborative efforts of the Pettis County/City of Sedalia Emergency Management Agency, other governmental and private entities throughout Pettis County and the city of Sedalia Table 2.6 is based on data that have been collected by distribution of the Data Collection Questionnaire to each of the participating communities. Table 2.6 Pettis County, Unincorporated Mitigation Capabilities Capabilities Status Including Date of Document or Policy Planning Capabilities Comprehensive Plan Builder's Plan Capital Improvement Plan City Emergency Operations Plan N/A County Emergency Operations Plan Yes, 12/2016 Local Recovery Plan N/A County Recovery Plan Yes, 12/2016 City Mitigation Plan N/A 2.12
35 County Mitigation Plan Yes, 2/2013 Debris Management Plan Yes, 12/2016 Economic Development Plan Transportation Plan Yes, 12/2016 Land-use Plan Flood Mitigation Assistance (FMA) Plan Yes Watershed Plan Yes, 2004 Firewise or other fire mitigation plan N/A Critical Facilities Plan (Mitigation/Response/Recovery) N/A Policies/Ordinance Zoning Ordinance Building Code Floodplain Ordinance Yes Subdivision Ordinance Tree Trimming Ordinance Nuisance Ordinance Storm Water Ordinance Drainage Ordinance Site Plan Review Requirements Historic Preservation Ordinance Landscape Ordinance Program Zoning/Land Use Restrictions Codes Building Site/Design Hazard Awareness Program National Flood Insurance Program Yes, CID Community Rating System (CRS) program under the National Flood Insurance Program (NFIP)? National Weather Service (NWS) Storm Ready Certification Yes, 2015 Firewise Community Certification N/A Building Code Effectiveness Grading (BCEGs) ISO Fire Rating N/A Economic Development Program Yes Land Use Program Public Education/Awareness Yes Property Acquisition Planning/Zoning Boards Stream Maintenance Program Tree Trimming Program NO 2.13
36 Engineering Studies for Streams (Local/County/Regional) Mutual Aid Agreements Studies/Reports/Maps Hazard Analysis/Risk Assessment (City) Hazard Analysis/Risk Assessment (County) Evacuation Route Map Critical Facilities Inventory Vulnerable Population Inventory Land Use Map Staff/Department Building Code Official Building Inspector Mapping Specialist (GIS) Engineer Development Planner Public Works Official Emergency Management Coordinator NFIP Floodplain Administrator Bomb and/or Arson Squad Emergency Response Team Hazardous Materials Expert Local Emergency Planning Committee County Emergency Management Commission Sanitation Department Transportation Department Economic Development Department Housing Department Historic Preservation n-governmental Organizations (NGOs) American Red Cross Salvation Army Veterans Groups Local Environmental Organization Homeowner Associations Neighborhood Associations Chamber of Commerce Community Organizations (Lions, Kiwanis, etc. Financial Resources Apply for Community Development Block Grants Fund projects thru Capital Improvements funding Yes N/A Yes Yes Yes Yes Yes Yes Yes Yes Yes Yes Yes Yes Yes Yes Yes Yes Yes Yes Yes Yes Yes Yes Yes 2.14
37 Authority to levy taxes for specific purposes Fees for water, sewer, gas, or electric services Impact fees for new development Incur debt through general obligation bonds Incur debt through special tax bonds Incur debt through private activities Withhold spending in hazard prone areas Source: Data Collection Questionnaire, 2018 Yes Yes Yes Yes Yes Yes City of Green Ridge The City of Green Ridge is located to the southeast of Sedalia and has a Mayor/5-person City Council local government. The population of Green Ridge has seen a 48% increase from 2000 to 2016 according the U.S. Census Bureau. One outdoor warning siren FEMA storm shelter Zoning Ordinance Nuisance Ordinance Zoning/Land use restrictions ISO fire rating of six The City of Green Ridge s population of 65 and older accounts for 12% of the total. Housing structures built in 1939 and before account for 15.3%, and mobile homes accounting for 2.2%. Table 2.7 is based on the Data Collection Questionnaire distributed to each jurisdiction. Table 2.7 Capabilities Comprehensive Plan Builder's Plan Capital Improvement Plan City Emergency Operations Plan County Emergency Operations Plan Local Recovery Plan County Recovery Plan City Mitigation Plan County Mitigation Plan Debris Management Plan City of Green Ridge Mitigation Capabilities Planning Capabilities Status Including Date of Document or Policy N/A N/A Yes Yes Economic Development Plan Transportation Plan Land-use Plan 2.15
38 Flood Mitigation Assistance (FMA) Plan Watershed Plan Firewise or other fire mitigation plan Critical Facilities Plan (Mitigation/Response/Recovery) Policies/Ordinance Zoning Ordinance Building Code Floodplain Ordinance Subdivision Ordinance Tree Trimming Ordinance Nuisance Ordinance Storm Water Ordinance Drainage Ordinance Site Plan Review Requirements Historic Preservation Ordinance Landscape Ordinance Program Zoning/Land Use Restrictions Codes Building Site/Design Hazard Awareness Program National Flood Insurance Program Community Rating System (CRS) program under the National Flood Insurance Program (NFIP)? Yes Yes Yes National Weather Service (NWS) Storm Ready Certification Firewise Community Certification Building Code Effectiveness Grading (BCEGs) ISO Fire Rating Rating: 6 Economic Development Program Land Use Program Public Education/Awareness Property Acquisition Planning/Zoning Boards Yes Stream Maintenance Program Tree Trimming Program Engineering Studies for Streams (Local/County/Regional) Mutual Aid Agreements Studies/Reports/Maps Hazard Analysis/Risk Assessment (City) Hazard Analysis/Risk Assessment (County) N/A 2.16
39 Evacuation Route Map Critical Facilities Inventory Vulnerable Population Inventory Land Use Map Staff/Department Building Code Official Building Inspector Mapping Specialist (GIS) Engineer Development Planner Public Works Official Emergency Management Coordinator NFIP Floodplain Administrator Bomb and/or Arson Squad Emergency Response Team Hazardous Materials Expert Local Emergency Planning Committee County Emergency Management Commission Sanitation Department Transportation Department Economic Development Department Housing Department Historic Preservation n-governmental Organizations (NGOs) American Red Cross Salvation Army Veterans Groups Local Environmental Organization Homeowner Associations Neighborhood Associations Chamber of Commerce Community Organizations (Lions, Kiwanis, etc. Financial Resources Apply for Community Development Block Grants Fund projects thru Capital Improvements funding Authority to levy taxes for specific purposes Fees for water, sewer, gas, or electric services Impact fees for new development Incur debt through general obligation bonds Incur debt through special tax bonds Incur debt through private activities Yes Yes Yes Yes Yes Yes Yes Yes 2.17
40 Withhold spending in hazard prone areas Source: Data Collection Questionnaire, City of Houstonia The City of Houstonia is situated in the northwest corner of Pettis County. The local government is by mayor/city council. Houstonia has seen a 19.6% decline In population since 2000 according to the U.S. Census Bureau. Two outdoor warning sirens FEMA approved storm shelter The City of Houstonia s population of 65 and older accounts for 10.7% of the total. Housing structures built in 1939 and before accounts for 35.6%, and has 19.5% of the housing structures being mobile homes. Table 2.8 is based on the Data Collection Questionnaire distributed to each jurisdiction. Capabilities Comprehensive Plan Builder's Plan Capital Improvement Plan City Emergency Operations Plan County Emergency Operations Plan Local Recovery Plan County Recovery Plan City Mitigation Plan County Mitigation Plan Debris Management Plan City of Houstonia Mitigation Capabilities Status Including Date of Document or Policy Planning Capabilities N/A N/A Yes Yes Economic Development Plan Transportation Plan Land-use Plan Flood Mitigation Assistance (FMA) Plan Watershed Plan Firewise or other fire mitigation plan Critical Facilities Plan (Mitigation/Response/Recovery) Policies/Ordinance Zoning Ordinance Building Code Floodplain Ordinance Subdivision Ordinance Tree Trimming Ordinance Nuisance Ordinance 2.18
41 Storm Water Ordinance Drainage Ordinance Site Plan Review Requirements Historic Preservation Ordinance Landscape Ordinance Zoning/Land Use Restrictions Codes Building Site/Design Hazard Awareness Program National Flood Insurance Program Program Community Rating System (CRS) program under the National Flood Insurance Program (NFIP)? National Weather Service (NWS) Storm Ready Certification Firewise Community Certification Building Code Effectiveness Grading (BCEGs) ISO Fire Rating Economic Development Program Land Use Program Public Education/Awareness Property Acquisition Planning/Zoning Boards Stream Maintenance Program Tree Trimming Program N/A Engineering Studies for Streams (Local/County/Regional) Mutual Aid Agreements Studies/Reports/Maps Hazard Analysis/Risk Assessment (City) Hazard Analysis/Risk Assessment (County) Evacuation Route Map Critical Facilities Inventory Vulnerable Population Inventory Land Use Map Staff/Department Building Code Official Building Inspector Mapping Specialist (GIS) Engineer Development Planner Public Works Official N/A 2.19
42 Emergency Management Coordinator NFIP Floodplain Administrator Bomb and/or Arson Squad Emergency Response Team Hazardous Materials Expert Local Emergency Planning Committee County Emergency Management Commission Sanitation Department Transportation Department Economic Development Department Housing Department Historic Preservation n-governmental Organizations (NGOs) American Red Cross Salvation Army Veterans Groups Local Environmental Organization Homeowner Associations Neighborhood Associations Chamber of Commerce Community Organizations (Lions, Kiwanis, etc. Financial Resources Apply for Community Development Block Grants Fund projects thru Capital Improvements funding Authority to levy taxes for specific purposes Fees for water, sewer, gas, or electric services Impact fees for new development Incur debt through general obligation bonds Incur debt through special tax bonds Incur debt through private activities Withhold spending in hazard prone areas Source: Data Collection Questionnaire, 2018 Yes Yes Yes Yes Yes Yes Village of Hughesville The Village of Hughesville is located in the northcentral region of the county between Sedalia and Houstonia. The Census Bureau shows the population of Hughesville has increased by 5.4% since 2000 to 184 in Outdoor warning siren The Village of Hughesville s population of 65 and older accounts for 16.8% of the total. Housing structures built in 1939 and before accounts for 14.3%, and 19% of the housing structures are of the mobile home type 2.20
43 Table 2.9 Capabilities Comprehensive Plan Builder's Plan Capital Improvement Plan City Emergency Operations Plan County Emergency Operations Plan Local Recovery Plan County Recovery Plan City Mitigation Plan County Mitigation Plan Debris Management Plan Village of Hughesville Mitigation Capabilities Status Including Date of Document or Policy Planning Capabilities Yes Yes Yes Yes Economic Development Plan Transportation Plan Land-use Plan Flood Mitigation Assistance (FMA) Plan Watershed Plan Firewise or other fire mitigation plan Critical Facilities Plan (Mitigation/Response/Recovery) Policies/Ordinance Zoning Ordinance Building Code Floodplain Ordinance Subdivision Ordinance Tree Trimming Ordinance Nuisance Ordinance Storm Water Ordinance Drainage Ordinance Site Plan Review Requirements Historic Preservation Ordinance Landscape Ordinance Program Zoning/Land Use Restrictions Codes Building Site/Design Hazard Awareness Program National Flood Insurance Program Community Rating System (CRS) program under the National Flood Insurance Program (NFIP)? Yes Yes Yes Yes Yes Yes Yes Yes Yes 2.21
44 National Weather Service (NWS) Storm Ready Certification Firewise Community Certification Building Code Effectiveness Grading (BCEGs) ISO Fire Rating Economic Development Program Land Use Program Public Education/Awareness Property Acquisition Planning/Zoning Boards Stream Maintenance Program Tree Trimming Program Yes Yes Engineering Studies for Streams (Local/County/Regional) Mutual Aid Agreements Studies/Reports/Maps Hazard Analysis/Risk Assessment (City) Hazard Analysis/Risk Assessment (County) Evacuation Route Map Critical Facilities Inventory Vulnerable Population Inventory Land Use Map Staff/Department Building Code Official Building Inspector Mapping Specialist (GIS) Engineer Development Planner Public Works Official Emergency Management Coordinator NFIP Floodplain Administrator Bomb and/or Arson Squad Emergency Response Team Hazardous Materials Expert Local Emergency Planning Committee County Emergency Management Commission Sanitation Department Transportation Department Economic Development Department Housing Department Historic Preservation Yes 2.22
45 n-governmental Organizations (NGOs) American Red Cross Salvation Army Veterans Groups Local Environmental Organization Homeowner Associations Neighborhood Associations Chamber of Commerce Community Organizations (Lions, Kiwanis, etc. Financial Resources Apply for Community Development Block Grants Fund projects thru Capital Improvements funding Authority to levy taxes for specific purposes Fees for water, sewer, gas, or electric services Impact fees for new development Incur debt through general obligation bonds Incur debt through special tax bonds Incur debt through private activities Withhold spending in hazard prone areas Yes Yes City of La Monte The City of La Monte is situating along Highway 50 to the west of Sedalia. La Monte has a mayor and four-person city council style of local government and a population that is slowly increasing. Since 2000, La Monte s population has increased by 5.9%, according the U.S. Census Bureau. 1 Outdoor warning siren FEMA Approved Storm Shelter Significant English as a Second language population The City of La Monte s population of 65 and older accounts for 10.5% of the total. Housing structures built in 1939 and before account for 4.7% of the total, with 4.7% of the housing structures are mobile homes. Table 2.10 Capabilities Comprehensive Plan Builder's Plan Capital Improvement Plan City Emergency Operations Plan County Emergency Operations Plan Local Recovery Plan City of La Monte Mitigation Capabilities Status Including Date of Document or Policy Planning Capabilities N/A 2.23
46 County Recovery Plan City Mitigation Plan County Mitigation Plan Debris Management Plan Economic Development Plan Transportation Plan Land-use Plan Flood Mitigation Assistance (FMA) Plan Watershed Plan Firewise or other fire mitigation plan Critical Facilities Plan (Mitigation/Response/Recovery) Policies/Ordinance Zoning Ordinance Building Code Floodplain Ordinance Subdivision Ordinance Tree Trimming Ordinance Nuisance Ordinance Storm Water Ordinance Drainage Ordinance Site Plan Review Requirements Historic Preservation Ordinance Landscape Ordinance Program Zoning/Land Use Restrictions Codes Building Site/Design Hazard Awareness Program National Flood Insurance Program N/A Yes Yes Yes Yes Yes Yes Yes Yes Yes Yes Community Rating System (CRS) program under the National Flood Insurance Program (NFIP)? National Weather Service (NWS) Storm Ready Certification Firewise Community Certification Building Code Effectiveness Grading (BCEGs) ISO Fire Rating Rating: 7 Economic Development Program Land Use Program Public Education/Awareness Property Acquisition Planning/Zoning Boards Yes Stream Maintenance Program Tree Trimming Program Yes Yes Yes Yes 2.24
47 Engineering Studies for Streams (Local/County/Regional) Mutual Aid Agreements Studies/Reports/Maps Hazard Analysis/Risk Assessment (City) Hazard Analysis/Risk Assessment (County) Evacuation Route Map Critical Facilities Inventory Vulnerable Population Inventory Land Use Map Staff/Department Building Code Official Building Inspector Mapping Specialist (GIS) Engineer Development Planner Public Works Official Emergency Management Coordinator NFIP Floodplain Administrator Bomb and/or Arson Squad Emergency Response Team Hazardous Materials Expert Local Emergency Planning Committee County Emergency Management Commission Sanitation Department Transportation Department Economic Development Department Housing Department Historic Preservation n-governmental Organizations (NGOs) American Red Cross Salvation Army Veterans Groups Local Environmental Organization Homeowner Associations Neighborhood Associations Chamber of Commerce Community Organizations (Lions, Kiwanis, etc. Financial Resources Apply for Community Development Block Grants Fund projects thru Capital Improvements funding Yes N/A Yes Yes Yes Yes Yes Yes Yes Yes Yes 2.25
48 Authority to levy taxes for specific purposes Fees for water, sewer, gas, or electric services Impact fees for new development Incur debt through general obligation bonds Incur debt through special tax bonds Incur debt through private activities Withhold spending in hazard prone areas Yes City of Sedalia The City of Sedalia is centrally located in Pettis County and serves as the county seat. Overseeing the local government in Sedalia is a Mayor and 8-person City Council. The Census Bureau shows the population of Sedalia has increased by 5.4% since 2000 to 21,489 in Outdoor sirens, four of which are located on the Missouri State Fair grounds. Comprehensive Plan Economic Development plan Watershed plan Zoning ordinance NFIP participate Land us program The City of Sedalia s population of 65 and older accounts for 15% of the total population. Housing structures built in 1939 and before account for 27.7% of the total, with 1.1% of the housing structures being mobile homes. Table 2.11 is based on the Data Collection Questionnaire distributed to each jurisdiction. City of Sedalia Mitigation Capabilities Capabilities Status Including Date of Document or Policy Planning Capabilities Comprehensive Plan Yes, 10/1/2012 Builder's Plan Capital Improvement Plan Yes, 3/20/2017 City Emergency Operations Plan Yes, 10/1/2012 County Emergency Operations Plan Yes, 10/1/2012 Local Recovery Plan Yes, 10/1/2012 County Recovery Plan Yes, 10/1/2012 City Mitigation Plan Yes, 10/1/2012 County Mitigation Plan Yes, 10/1/2012 Debris Management Plan Yes, 12/1/2016 Economic Development Plan Yes, 8/15/2016 need copy Transportation Plan Yes, 2016 Land-use Plan Yes, 2008 Flood Mitigation Assistance (FMA) Plan 2.26
49 Watershed Plan Yes, 2013, need copy Firewise or other fire mitigation plan N/A Critical Facilities Plan (Mitigation/Response/Recovery) Yes, 10/1/2012 Policies/Ordinance Zoning Ordinance Yes Building Code Version: 2015 Floodplain Ordinance Yes, 2014 Subdivision Ordinance Yes Tree Trimming Ordinance Yes Nuisance Ordinance Yes Storm Water Ordinance Yes Drainage Ordinance Yes Site Plan Review Requirements Yes Historic Preservation Ordinance Yes Landscape Ordinance Yes Program Zoning/Land Use Restrictions Yes Codes Building Site/Design Yes Hazard Awareness Program Yes National Flood Insurance Program Yes, CID: Community Rating System (CRS) program under the National Flood Insurance Program (NFIP)? N/A National Weather Service (NWS) Storm Ready Certification Yes Firewise Community Certification N/A Building Code Effectiveness Grading (BCEGs) Class 9 ISO Fire Rating Rating: 3 Economic Development Program Yes Land Use Program Yes Public Education/Awareness Yes Property Acquisition Planning/Zoning Boards Yes Stream Maintenance Program Yes Tree Trimming Program Yes Engineering Studies for Streams (Local/County/Regional) Mutual Aid Agreements Studies/Reports/Maps Hazard Analysis/Risk Assessment (City) Hazard Analysis/Risk Assessment (County) Evacuation Route Map Yes Yes, need copy Yes, need copy Yes 2.27
50 Critical Facilities Inventory Yes, need copy Vulnerable Population Inventory Land Use Map Yes, need copy Staff/Department Building Code Official Yes, FT Building Inspector Yes, FT Mapping Specialist (GIS) Yes, PT Engineer Yes, Contract Development Planner Yes, FT Public Works Official Yes, FT Emergency Management Coordinator Yes, PT NFIP Floodplain Administrator Yes, PT Bomb and/or Arson Squad Bomb-- Arson-- Yes Emergency Response Team Yes, FT Hazardous Materials Expert Yes, FT Local Emergency Planning Committee Yes, PT County Emergency Management Commission Yes, PT Sanitation Department Yes, FT Transportation Department Yes, FT Economic Development Department Yes, PT Housing Department Yes, FT Historic Preservation Yes, PT n-governmental Organizations (NGOs) American Red Cross Yes Salvation Army Yes Veterans Groups Yes Local Environmental Organization Yes Homeowner Associations Yes Neighborhood Associations Yes Chamber of Commerce Yes Community Organizations (Lions, Kiwanis, etc. Yes Financial Resources Apply for Community Development Block Grants Yes Fund projects thru Capital Improvements funding Yes Authority to levy taxes for specific purposes Yes Fees for water, sewer, gas, or electric services Yes Impact fees for new development Yes Incur debt through general obligation bonds Yes Incur debt through special tax bonds Yes Incur debt through private activities Yes Withhold spending in hazard prone areas Yes 2.28
51 Table 2.12 Capabilities Mitigation Capabilities Summary for Pettis County Status Including Date of Document or Policy Pettis County Green Ridge Houstonia Hughesville La Monte Sedalia Planning Capabilities Comprehensive Plan N/A Yes, 10/1/2012 Builder's Plan Capital Improvement Plan Yes Yes, 3/20/2017 City Emergency Operations Plan N/A Yes Yes, 10/1/2012 County Emergency Operations Plan Yes, 12/2016 N/A N/A N/A N/A Yes, 10/1/2012 Local Recovery Plan N/A Yes, 10/1/2012 County Recovery Plan Yes, 12/2016 N/A N/A N/A N/A Yes, 10/1/2012 City Mitigation Plan N/A Yes Yes Yes Yes Yes, 10/1/2012 County Mitigation Plan Yes, 2/2013 Yes Yes Yes Yes Yes, 10/1/2012 Debris Management Plan Yes, 12/2016 Yes, 12/1/2016 Economic Development Plan Yes, 8/15/2016 Transportation Plan Yes, 12/2016 Yes, 2016 Land-use Plan Yes, 2008 Flood Mitigation Assistance (FMA) Plan Yes Watershed Plan Yes, 2004 Yes, 2013, Firewise or other fire mitigation plan N/A N/A Critical Facilities Plan Yes, 10/1/2012 Policies/Ordinance Zoning Ordinance Yes Yes Yes Yes Building Code Yes Version: 2015 Floodplain Ordinance Yes Yes Yes, 2014 Subdivision Ordinance Yes Yes Tree Trimming Ordinance Yes Yes Yes Nuisance Ordinance Yes Yes Yes Yes 2.29
52 Storm Water Ordinance Yes Yes Drainage Ordinance Yes Yes Yes Site Plan Review Requirements Yes Yes Historic Preservation Ordinance Yes Landscape Ordinance Yes Yes Yes Program Zoning/Land Use Restrictions Yes Yes Yes Yes Codes Building Site/Design Yes Yes Yes Hazard Awareness Program Yes Yes National Flood Insurance Program Yes, Yes Yes, CID: Community Rating System (CRS) program under the National Flood Insurance Program (NFIP)? NO N/A National Weather Service (NWS) Storm Ready Certification Yes, 2015 Yes Firewise Community Certification N/A N/A Building Code Effectiveness Grading (BCEGs) Class 9 ISO Fire Rating N/A Rating: 6 N/A N/A Rating: 7 Rating: 3 Economic Development Program Yes Yes Land Use Program Yes Public Education/Awareness Yes Yes Property Acquisition Planning/Zoning Boards Yes Yes Yes Stream Maintenance Program Yes Yes Tree Trimming Program Yes Yes Engineering Studies for Streams (Local/County/Regional) Mutual Aid Agreements Yes Yes Yes Studies/Reports/Maps 2.30
53 Hazard Analysis/Risk Assessment (City) N/A Yes, need copy Hazard Analysis/Risk Assessment (County) Yes N/A N/A N/A N/A Yes, need copy Evacuation Route Map Yes Yes Critical Facilities Inventory Yes Yes Yes, need copy Vulnerable Population Inventory Yes Land Use Map Yes Yes, need copy Staff/Department Building Code Official Yes, FT Building Inspector Yes Yes, FT Mapping Specialist (GIS) Yes Yes, PT Engineer Yes, Contract Development Planner Yes, FT Public Works Official Yes Yes Yes Yes Yes, FT Emergency Management Coordinator Yes Yes Yes, PT NFIP Floodplain Administrator Yes Yes Yes, PT Bomb and/or Arson Squad Bomb-- Arson-- Yes Emergency Response Team Yes, FT Hazardous Materials Expert Yes Yes, FT Local Emergency Planning Committee Yes Yes, PT County Emergency Management Commission Yes Yes Yes Yes, PT Sanitation Department Yes, FT Transportation Department Yes Yes, FT Economic Development Department Yes Yes, PT Housing Department Yes, FT Historic Preservation Yes Yes, PT n-governmental Organizations (NGOs) American Red Cross Yes Yes Salvation Army Yes Yes 2.31
54 Veterans Groups Yes Yes Yes Yes Local Environmental Organization Yes Homeowner Associations Yes Yes Neighborhood Associations Yes Yes Chamber of Commerce Yes Yes Yes Community Organizations Yes Yes Yes Financial Resources Apply for Community Development Block Grants Yes Yes Yes Yes Fund projects thru Capital Improvements funding Yes Yes Authority to levy taxes for specific purposes Yes Yes Yes Yes Fees for water, sewer, gas, or electric services Yes Yes Yes Yes Yes Impact fees for new development Yes Yes Incur debt through general obligation bonds Yes Yes Yes Yes Incur debt through special tax bonds Yes Yes Yes Incur debt through private activities Yes Yes Yes Withhold spending in hazard prone areas Yes Yes Yes Source: Data Collection Questionnaires,
55 2.2.7 Special Districts Sewer and Water Facilities Table 2.13 Pettis County Water/Sewer Facilities Jurisdiction Municipal Water Municipal Sewer Green Ridge Yes Yes Houstonia Yes Hughesville Yes La Monte Yes Yes Sedalia Yes Yes Source: Data Collection Questionnaires, 2018 Pettis County has one public water and sewer district that is shared among parts of Johnson, Pettis, and Saline counties. This district coves roughly the northwest quarter of Pettis County. The county continues to improve its ability to service residents and businesses with public water and sewer. Electricity and Natural Gas Electricity is provided to residents of Pettis County by one of four providers. The majority of Pettis County is covered by Kansas City Power & Light Greater Missouri Operations (KCP&L GMO) and KCP&L, the remaining areas are covered by Union cooperative with a small section covered by Ameren UE. Solid Waste Disposal Solid waste disposal in Pettis County is collected by either WCA Waste Corporation or Ditzfeld Container & Trash Service. Solid waste is then transported to the Central Missouri Landfill, located near Sedalia, MO. Law Enforcement The Pettis County Sheriffs department, led by Sheriff Kevin Bond, is responsible for law enforcement at the county level and works with communities that lack the resources for their own police department. Jurisdictions that employ their own police department are Sedalia, La Monte, Green Ridge, and Smithton. Emergency Medical Services Emergency medical services in Pettis County are provided by Pettis County Ambulance District. The Pettis County Ambulance District covers all of Pettis County and employs about 70 professionals and operates 11 ambulances from three stations across Pettis County. 2.33
56 Fire Protection Fire Protection for Pettis County is provided by seven departments, some funded by due and other funded by collected taxes. Departments funded through a tax are: Pettis County Fire Protection District (6 stations) Sedalia Fire La Monte Fire Departments funded through dues include: Green Ridge Houstonia Hughesville Lake Creek Table 2.14 Pettis County Fire Protection District Stations Station Number Address Clarendon Rd, Sedalia McVey, Sedalia 3 Hwy BB, Longwood 4 Hwy O, Beaman Hwy V, Sedalia kemp Rd., Sedalia Source: pettiscofire.com, 2018 Emergency Services (E-911) E-911 service calls in Pettis County are received by the Pettis County Sheriff s Office Center. The Pettis County Sheriff s Office Center is the Public Safety Answering Point (PSAP) for Pettis County Missouri. The Pettis County Sheriff s Office Center provide emergency dispatch services for all of Pettis County, Missouri, outside the city limits of Sedalia. Sedalia services are dispatched through the City of Sedalia Operations Support Bureau. The Pettis County Sheriff s Office Center dispatch s for the following law enforcement and fire department agencies: Pettis County Sheriff s Office Green Ridge Police Department La Monte Police Department Missouri State Highway Patrol Local Pettis County Troopers Smithton Police Department Pettis County Fire Department Green Ridge Fire Department Houstonia Fire Department 2.34
57 Hughesville Fire Department Lake Creek Fire Department La Monte Fire Department Smithton Fire Department Public School Profiles and Mitigation Capabilities Table 2.15 School District: Green Ridge R-VIII Building Name Bldg Address Bldg Enrollment Green Ridge High 401 W Pettis St., Green Ridge 173 Green Ridge Elementary 402 W Pettis St., Green Ridge 201 Source: School data questionnaire, mcds.dese.mo.gov Table 2.16 School District: Pettis Co. R-V Building Name Bldg Address Bldg Enrollment rthwest High Highway H, Hughesville 164 rthwest Elementary 407 W Tuck, Houstonia 186 Source: School data questionnaire, mcds.dese.mo.gov Table 2.17 School District: Smithton R-VI Building Name Bldg Address Bldg Enrollment Smithton High 505 S Myrtle, Smithton 270 Smithton Elementary 506 S Myrtle, Smithton 306 Source: School data questionnaire, mcds.dese.mo.gov Table 2.18 School District: Sedalia 200 Building Name Bldg Address Bldg Enrollment Smith-Cotton High 2010 Tiger Pride Boulevard, Sedalia 1483 Smith-Cotton Junior High 312 East Broadway, Sedalia 1071 Sedalia Middle School 2205 S Ingram, Sedalia 389 Heber Hunt Elementary 600 S Warren, Sedalia 482 Parkview Elementary 1901 S New York, Sedalia 480 Horace Mann Elementary 1100 W 16th, Sedalia 314 Skyline Elementary 2505 W 32nd St., Sedalia 496 Washington Elementary 610 S Engineer, Sedalia 257 Early Childhood Center 2255 S Ingram, Sedalia

58 Source: School data questionnaire, mcds.dese.mo.gov Figure 2.3 Pettis County School Districts 2.36
59 Table 2.19 Capability Planning Elements Summary of Pettis County School District Capabilities Green Ridge R-VIII Smithton R-VI Pettis Co. R- V Master Plan Yes Capital Improvement Plan, in progress Yes School Emergency Plan Yes, 2016 Yes, 2016 Yes Yes Shelter in place protocols Yes Yes Yes Evacuation protocols Yes Yes, 2016 Yes Yes Weapons Policy Yes, 2017 Yes, 2016 Yes Yes Personnel Resources Full-time building official (i.e. Principal) Yes Yes Yes Yes Emergency Manager Yes Yes Grant Writer Public Information Officer Yes Financial Resources Capital improvements project funding Yes Yes Local funds Yes Yes Yes Sedalia 200 General obligation bonds Yes Yes Special tax bonds Yes Yes Private activities/donations Yes Yes State and federal funds Yes Yes Yes Additional Capabilities Public Address/Emergency Alert System Yes Yes Yes NOAA weather radio in buildings? Yes Yes Yes Yes FEMA Tornado Shelter/Saferoom Yes Yes Yes Yes, not all buildings Campus police/resource Officer Yes Source: School data questionnaire,
60 3 RISK ASSESSMENTS 3.1 Hazard Identification Review of Existing Plans Review Disaster Declaration History Research Additional Sources Hazards Identifies Multi-Jurisdictional Risk Assessment Assets at Risk Total Exposure of Population & Structures Critical Facilities & Infrastructure Other Assets Land Use & Development Development since Previous Plan Update Future Land Use & Development Hazard Profiles, Vulnerability, & Problem Statements Flooding (Flash & Ravine) Hazard Profile Vulnerability Problem Statement Dam Failure Hazard Profile Vulnerability Problem Statement Drought Hazard Profile Vulnerability Problem Statement Tornado Hazard Profile Vulnerability Problem Statement Thunderstorm/High Winds/Lightning/Hail Hazard Profile Vulnerability Problem Statement Winter Weather/Snow/Ice/Severe Cold Hazard Profile Vulnerability Problem Statement Extreme Heat Hazard Profile Vulnerability Problem Statement RISK ASSESSMENT 3.1
61 3.4.8 Earthquake Hazard Profile Vulnerability Problem Statement Land Subsidence Hazard Profile Vulnerability Problem Statement Wildfire Hazard Profile Vulnerability Problem Statement Levee Failure Hazard Profile Vulnerability Problem Statement RISK ASSESSMENT 44 CFR Requirement 201.6(c)(2): [The plan shall include] A risk assessment that provides the factual basis for activities proposed in the strategy to reduce losses from identified hazards. Local risk assessments must provide sufficient information to enable the jurisdiction to identify and prioritize appropriate mitigation actions to reduce losses from identified hazards. The goal of the risk assessment is to estimate the potential loss in the planning area, including loss of life, personal injury, property damage, and economic loss, from a hazard event. The risk assessment process allows communities and school/special districts in the planning area to better understand their potential risk to the identified hazards. It will provide a framework for developing and prioritizing mitigation actions to reduce risk from future hazard events. This is an update of the Pettis County Hazard Mitigation Plan adopted in February According to the U.S. Census Bureau July 1, 2016 population estimates, the population of Pettis Count increased from 42,201 in 2010 to 42,213 at the time of the 2016 population estimate. Since 2013, Pettis County has since remained a class 4 county in Missouri. According to Missouri Revised statutes (RSMO ), All counties which have attained the second classification prior to August 13, 1988, and which would otherwise return to the third classification after August 13, 1988, because of changes in assessed valuation shall remain a county in the second classification and shall operate under the laws of this state applying to the second classification.. This chapter is divided into four main parts: Section 3.1 Hazard Identification identifies the hazards that threaten the planning area and provides a factual basis for elimination of hazards from further consideration; 3.2
62 Section 3.2 Assets at Risk provides the planning area s total exposure to natural hazards, considering critical facilities and other community assets at risk; Section 3.3 Future Land Use and Development discusses areas of planned future development Section 3.4 Hazard Profiles and Vulnerability Analysis provides more detailed information about the hazards impacting the planning area. For each hazard, there are three sections: 1) Hazard Profile provides a general description and discusses the threat to the planning area, the geographic location at risk, potential severity/magnitude/extent, previous occurrences of hazard events, probability of future occurrence, risk summary by jurisdiction, impact of future development on the risk; 2) Vulnerability Assessment further defines and quantifies populations, buildings, critical facilities, and other community/school or special district assets at risk to natural hazards; 3) Problem Statement briefly summarizes the problem and develops possible solutions. 3.1 Hazard Identification Requirement 201.6(c)(2)(i): [The risk assessment shall include a] description of the type of allnatural hazards that can affect the jurisdiction. The Plan profiles all natural hazards that can affect Pettis County. The natural hazards that can affect the county have been identified in the 2013 Pettis County Plan and the 2013 Missouri State Plan. Natural hazards are naturally occurring climatological, hydrological or geologic events that have a negative effect on people and the built environment. Natural hazards identified in the 2013 Pettis County Plan included: Dam Failure Drought Earthquakes Extreme Heat Wildfire Flooding (Flash and River) Land Subsidence/ Sinkholes Levee Failure Thunderstorm/High Winds/Lightning/Hail Tornado Winter Weather/Snow/Ice/Sever Cold new natural hazards have been identified since the adoption of the previous plan. The 2013 Missouri State Plan combines severe cold from severe winter weather hazard and heatwave into an extreme temperature hazard. The Plan will follow the 2013 Missouri State Plan and incorporate this change. The 2013 Missouri State Plan also addresses human-caused and technological hazards; however, these will not be included in this plan update. 3.3
63 3.1.1 Review of Existing Plans The MPC reviewed the hazards identified in the previously approved plan, as well as the hazards identified in the state plan at the vember 11, 2017 meeting. The hazards identified in the 2013 Pettis County Plan are identified in the 2013 Missouri State Plan. The State Plan also includes levee failure as well as structural and urban fire in addition to wildfire. Human-caused and technological hazards identified in the State Plan include: CBRNE Attack Civil Disorder Cyber Disruption Hazardous Materials Mass Transportation Accidents Nuclear Power Plants Public Health Emergencies/Environmental Issues Special Events Terrorism Utility Interruptions and System Failures In Missouri, local plans customarily include only natural hazards, as only natural hazards are required by federal regulations to be included. The MPC was informed that they may decide to include technological hazards and human-caused threats in the plan, although this is not required by federal regulations. The MPC determined to include only natural hazards. The MPC agreed that human-caused and technological hazards are addressed in a Regional Homeland Security Oversight Committee (RHSOC) Threat and Hazard Identification Risk Assessment (THIRA) and that including only natural hazards would meet the needs of local entities participating in the plan update Review of Disaster Declaration History From 1990 to present, Pettis County has experienced severe storms, tornadoes, flooding, an ice storm and severe winter storms. All of these natural hazard events triggered federal disaster declarations. Federal and/or state declarations may be granted when the severity and magnitude of an event surpasses the ability of the local government to respond and recover. Disaster assistance is supplemental and sequential. When the local government s capacity has been surpassed, a state disaster declaration may be issued, allowing for the provision of state assistance. If the disaster is so severe that both the local and state governments capacities are exceeded; a federal emergency or disaster declaration may be issued allowing for the provision of federal assistance. FEMA also issues emergency declarations, which are more limited in scope and do not include the long-term federal recovery programs of major disaster declarations. Determinations for declaration type are based on scale and type of damages and institutions or industrial sectors affected. 3.4
64 Table 3.1, Disaster Number FEMA Disaster Declarations that include Pettis County, Missouri, 1990-Present Description Declaration Date/Incident Period Individual Assistance (IA) / Public Assistance (PA) 4238 Severe storms, tornadoes, straight-line winds, & flooding 7 August, 2015 / 15 May-7 July, 2015 PA Severe storms, tornadoes & flooding Severe winter storm & snowstorm Severe storms & flooding 1403 Ice storm 995 Severe storms, tornadoes & flooding Severe storms, tornadoes & flooding Flooding & severe storm 9-May-11 / 19 April-6 June, March 2011 / 31 Jan-5 Feb June 2008 / 1 June-13 Aug April 2006 / 30 Mar-3 April March 2006 / 8 Mar-13 Mar February / 29 Jan-13 Feb July 1993 / 10 June-25 Oct 1993 IA / PA PA PA IA / PA IA / PA IA / PA IA / PA Source: Federal Emergency Management Agency, Additional Research Sources A variety of sources were researched for data on natural hazards. Primary sources included FEMA, SEMA, National Centers for Environmental Information (NCEI) and National Oceanic and Atmospheric Administration (NOAA). The U.S. Geological Survey (USGS) and the Center for Earthquake Research and Information (CERI) were major sources for earthquake information. The Missouri Department of Natural Resources (MDNR) Dam Safety Division provided information concerning dams and the Missouri Department of Conservation (MDC). Other information sources included county officials; existing city, county, regional and state plans; and information from local officials. The additional sources of data on locations and past impacts of hazards in Pettis County include: Missouri Hazard Mitigation Plans (2010 and 2013) Pettis County Hazard Mitigation Plan (2013) Federal Emergency Management Agency (FEMA) Missouri Department of Natural Resources (MDNR) National Drought Mitigation Center Drought Reporter US Department of Agriculture s (USDA) Risk Management Agency Crop Insurance Statistics National Agricultural Statistics Service Data Collection Questionnaires completed by each jurisdiction State of Missouri GIS data 3.5
65 Environmental Protection Agency Flood Insurance Administration Hazards US (HAZUS) Missouri Department of Transportation Missouri Division of Fire Marshal Safety Missouri Public Service Commission National Fire Incident Reporting System (NFIRS) National Oceanic and Atmospheric Administration s (NOAA) National Centers for Environmental Information (NCIE); Pipeline and Hazardous Materials Safety Administration County and local Comprehensive Plans to the extent available County Emergency Management County Flood Insurance Rate Map, FEMA Flood Insurance Study, FEMA SILVIS Lab, Department of Forest Ecology and Management, University of Wisconsin 3.7 U.S. Army Corps of Engineers U.S. Department of Transportation United States Geological Survey (USGS) Various articles and publications available on the internet U.S. Army Corps of Engineers U.S. Department of Transportation United States Geological Survey (USGS) Various articles and publications available on the internet The only centralized source of data for many of the weather-related hazards is the National Oceanic and Atmospheric Administration s (NOAA) National Centers for Environmental Information (NCEI). Although it is usually the best and most current source, there are limitations to the data which should be noted. The NCEI documents the occurrence of storms and other significant weather phenomena having sufficient intensity to cause loss of life, injuries, significant property damage, and/or disruption to commerce. In addition, it is a partial record of other significant meteorological events, such as record maximum or minimum temperatures or precipitation that occurs in connection with another event. Some information appearing in the NCEI may be provided by or gathered from sources outside the National Weather Service (NWS), such as the media, law enforcement and/or other government agencies, private companies, individuals, etc. An effort is made to use the best available information but because of time and resource constraints, information from these sources may be unverified by the NWS. Those using information from NCEI should be cautious as the NWS does not guarantee the accuracy or validity of the information. The NCEI damage amounts are estimates received from a variety of sources, including those listed above in the Data Sources section. For damage amounts, the NWS makes a best guess using all available data at the time of the publication. Property and crop damage figures should be considered as a broad estimate. Damages reported are in dollar values as they existed at the time of the storm event. They do not represent current dollar values. The database currently contains data from January 1950 to August 2017, as entered by the NWS. Due to changes in the data collection and processing procedures over time, there are unique periods of record available depending on the event type. The following timelines show the different time spans for each period of unique data collection and processing procedures. 3.6
66 1. Tornado: From 1950 through 1954, only tornado events were recorded. 2. Tornado, Thunderstorm Wind and Hail: From 1955 through 1992, only tornado, thunderstorm wind and hail events were keyed from the paper publications into digital data. From 1993 to 1995, only tornado, thunderstorm wind and hail events have been extracted from the Unformatted Text Files.. 3. All Event Types (48 from Directive ): From 1996 to present, 48 event types are recorded as defined in NWS Directive te that injuries and deaths caused by a storm event are reported on an area-wide basis. When reviewing a table resulting from an NCEI search by county, the death or injury listed in connection with that county search did not necessarily occur in that county Hazards Identified The natural hazards that can possibly or have affected Pettis County are profiled below. All hazards do not affect every jurisdiction participating in the Plan. Table 3.2 provides a summary of the jurisdictions that may be affected by each hazard. An x in the table indicates that jurisdictions are affected by the hazard, and a "-" indicates the hazard is not applicable to that jurisdiction. Table 3.2 Jurisdiction Tornado/ T-Storm Hazards Identified for Each Jurisdiction Floods Severe Winter Weather Drought Extreme Temperatures Dam Failure Wildfires Earthquake Pettis Co X X X X X X X X Green Ridge X X X X X X - X Houstonia X X X X X - - X Hughesville X X X X X - - X La Monte X X X X X - - X Sedalia X X X X X X - X Green Ridge R-VIII X X X X X Sedalia 200 X X X X X Smithton R-VI X - X X X Pettis Co. R-V X - X X X Multi-Jurisdictional Risk Assessment The risk assessment assesses each participating jurisdiction s vulnerability to each hazard that can affect the planning area. Many of the hazards identified in the risk assessment have the same probability of occurrence throughout the planning area. The hazards that vary across the planning area in terms of risk include dam failure, flood, and wildland fire. These differences are detailed in each hazard profile under geographic location and vulnerability. 3.7
67 Pettis County s climate is mostly uniform. With an average population increase of about 6.7%, since 2000, building construction within urban areas has increased as well. Population estimates show that Pettis County is growing and should continue to in the future. Growth management will need to be utilized in urban areas. Growth mitigation capabilities of each jurisdiction are profiled in section Naturally, the urbanized areas of Pettis County have a greater density of important assets, which are more vulnerable to weather-related hazards. This increase in vulnerability, however, can be mitigated through updated building codes and code enforcement as well as land use planning. These capabilities and resources to mitigate the impact of natural hazards vary across jurisdictions in the planning area. These differences will be discussed in greater detail in the vulnerability sections of each hazard. 3.2 Assets at Risk This section assesses the planning area population, structures, critical facilities and infrastructure, and other important assets that may be at risk to hazards. The inventory of assets for each jurisdiction were derived from parcel data from the Pettis County Assessor, the Pettis County Structures dataset downloaded from Missouri Spatial Data information Service (MSDIS), local jurisdiction data collection questionnaires, and HAZUS MH 2.2. Minimal development has occurred in Pettis County since the previous update Total Exposure of Population and Structures Unincorporated County and Incorporated Cities In the following three tables, population data is based on 2016 ACS estimate data. Building counts and building exposure values are based on parcel data provided by the Pettis County Assessor. Contents exposure values were calculated by factoring a multiplier to the building exposure values based on usage type. The multipliers were derived from the HAZUS MH 2.1 and are defined below in Table 3.3. Land values have been purposely excluded from consideration because land remains following disasters, and subsequent market devaluations are frequently short term and difficult to quantify. Another reason for excluding land values is that state and federal disaster assistance programs generally do not address loss of land (other than crop insurance). It should be noted that the total valuation of buildings is based on county assessors data which may not be current. In addition, government owned properties are usually taxed differently or not at all, and so may not be an accurate representation of true value. te that public school district assets and special districts assets are included in the 3.10 total exposure tables assets by community and county. Table 3.3 shows the total population, building count, estimated value of buildings, estimated value of contents and estimated total exposure to parcels for the unincorporated county and each incorporated city. Table 3.4 that follows provides the building value exposures for the county and each city in the planning area broken down by usage type. Finally, Table 3.5 provides the building count total for the county and each city in the planning area broken out by building usage types (residential, commercial, industrial, and agricultural). 3.8
68 Table 3.3 Jurisdiction Maximum Population & Parcel Exposure by Jurisdiction Parcel Parcel Count Exposure ($) 2016 Population ACS Est. Contents Exposure ($) Total Exposure ($) Pettis County (Unincorporated) 18,130 15,097 $838,534,770 $495,912,200 $1,334,446,970 Green Ridge $10,067,170 $5,554,105 $15,621,275 Houstonia $3,976,750 $1,667,160 $5,643,910 Hughesville $3,827,120 $2,133,270 $5,960,390 La Monte 1, $19,296,970 $12,193,260 $31,490,230 Sedalia 21,489 10,234 $628,913,520 $523,592,545 $1,152,506,065 Pettis County Totals 41,653 26,324 1,504,616,300 1,041,052,540 2,545,668,840 Contents Exposure derived by applying multiplier to Building Exposure based on HAZUS MH 2.1 standard contents multipliers per usage type as follows: Residential (50%), Commercial (100%), Industrial (150%), Agricultural (100%). For purposes of these calculations, government, school, and utility were calculated at the commercial contents rate. Table 3.4 Parcel Values/Exposure by Usage Type Jurisdiction Residential ($) Commercial ($) Agriculture ($) Total Exposures Pettis County (Unincorporated) $752,201,890 $79,684,790 $190,305,550 $1,022,192,230 Green Ridge $9,910,380 $883,140 $21,310 $10,814,830 Houstonia $3,165,800 $72,970 $11,290 $3,250,060 Hughesville $3,961,100 $149,480 $3,240 $4,113,820 La Monte $19,207,700 $2,416,950 $172,460 $21,797,110 Sedalia $536,370,650 $254,601,810 $805,410 $791,777,870 Pettis County Totals 1,324,817, ,809, ,319,260 1,853,945,920 Source: Parcel Count and Parcel Exposure, Pettis County Assessor s Office Database 3.9
69 Table 3.5 Parcel Count by Usage Type Jurisdiction Residential Commercial Agricultural Total Pettis County (Unincorporated) 7, ,065 15,097 Green Ridge Houstonia Hughesville La Monte Sedalia 9,107 1, ,234 Pettis County Totals 17,595 1,552 7,177 26,324 Source: Parcel Count and Parcel Exposure, Pettis County Assessor s Office Database Even though schools and special districts total assets are included in the tables above, additional discussion is needed, based on the data that is available from the districts completion of the Data Collection Questionnaire and district maintained websites. The number of enrolled students at the participating public school districts is provided in Table 3.6 below. Additional information includes the number of buildings, building values (building exposure) and contents value (contents exposure). These numbers will represent the total enrollment and building count for the public school districts regardless of the county in which they are located. t all questionnaires received had completed information. Questionnaires can be found in appendix E. Table 3.6 Enrollment and Building Exposure by Jurisdiction-Public School Districts Public School District Enrollment Building Count Building Exposure ($) Contents Exposure ($) Total Exposure ($) Pettis County R-V $0 Smithton R-VI $15,378,861 $2,818,737 $18,197,598 Green Ridge R-VIII $10,118,578 $14,860,854 $24,979,432 Sedalia $153,858,000 $23,808,622 $177,666,622 Source: Enrollment numbers from Building Enrollment spreadsheet found online at: The Building Exposure, Contents Exposure, and Total Exposure amounts come from the completed Data Collection Questionnaires from Public School Districts. In general, the school districts obtain this information from their insurance coverage amounts. 3.10
70 3.2.2 Critical and Essential Facilities and Infrastructure This section will include information from the Data Collection Questionnaire and other sources concerning the vulnerability of participating jurisdictions critical, essential, high potential loss, and transportation/lifeline facilities to identified hazards. Definitions of each of these types of facilities are provided below. Critical Facility: Those facilities essential in providing utility or direction either during the response to an emergency or during the recovery operation. Essential Facility: Those facilities that if damaged, would have devastating impacts on disaster response and/or recovery. High Potential Loss Facilities: Those facilities that would have a high loss or impact on the community. Transportation and lifeline facilities: Those facilities and infrastructure critical to transportation, communications, and necessary utilities. Table 3.7 includes a summary of the inventory of critical and essential facilities and infrastructure in the planning area. The list was compiled from the Data Collection Questionnaire as well as other internet based publications. Questionnaires can be found in appendix E. 3.11
71 Airport Bus Facility Communications Tower Electric Power Facility Emergency Operations Fire Service Government Housing Shelters Hwy. Bridge Hospital/Health Care Military Natural Gas Facility Nursing Home Police Station Potable Water Facility Rail Sanitary Pump Stations School Facilities Storm water Pump Stations Tier II Chemical Facility Wastewater Facility Total Table 3.7 Inventory of Critical/Essential Facilities & Infrastructure by Jurisdiction Jurisdiction Pettis County Green Ridge X X -- X X X X X X Houstonia X X X Hughesville La Monte Sedalia X X X X X X X X X X X X X X X X X Totals 3.12
 Structurally Deficient (SD): This term was previously defined in https://www.fhwa.dot.gov/bridge/0650dsup.")
72 Table 3.8 Pettis County Bridges of Pettis County Total Good Rating Fair Rating Poor Rated Structurally Deficient (22.3%) Structurally Deficient (SD): This term was previously defined in as having a condition rating of 4 or less for Item 58 (Deck), Item 59 (Superstructure), Item 60 (Substructure), or Item 62 (Culvert), OR having an appraisal rating of 2 or less for Item 67 (Structural Condition) or Item 71 (Waterway Adequacy) Beginning with the 2018 data archive, this term will be defined in accordance with the Pavement and Bridge Condition Performance Measures final rule, published in January of 2017, as a classification given to a bridge which has any component [Item 58, 59, 60, or 62] in Poor or worse condition [code of 4 or less]. Figure 3.1 Pettis County Bridges 3.13
73 3.2.3 Other Assets Assessing the vulnerability of the planning area to disaster also requires data on the natural, historic, cultural, and economic assets of the area. This information is important for many reasons. These types of resources warrant a greater degree of protection due to their unique and irreplaceable nature and contribution to the overall economy. Knowing about these resources in advance allows for consideration immediately following a hazard event, which is when the potential for damages is higher. The rules for reconstruction, restoration, rehabilitation, and/or replacement are often different for these types of designated resources. The presence of natural resources can reduce the impacts of future natural hazards, such as wetlands and riparian habitats which help absorb floodwaters. Losses to economic assets like these (e.g., major employers or primary economic sectors) could have severe impacts on a community and its ability to recover from disaster. Threatened and Endangered Species: Table 3.9 shows Federally Threatened, Endangered, Proposed and Candidate Species in the county. Table 3.9 Endangered/Threatened Species in Pettis County Common Name Scientific Name Status Gray Bat Myotis grisescens Endangered Indiana Bat Myotis sodalis Endangered rthern Long-eared Bat Myotis septentrionalis Threatened Mead's Milkweed Asclpias meadii Threatened Natural Resources: The Missouri Department of Conservation (MDC) provides a database of lands the MDC owns, leases, or manages for public use. Table 3.10 provides the names and locations of parks and conservation areas in the planning area. 3.14
74 Table 3.10 Conservation Areas in Pettis County Area Name Address Closest City Bothwell Lodge SHS Bothwell State Park Road Sedalia Perry Memorial CA NE 1200 Rd JOCO Concordia Pinhook Access Pin Hood Rd Sedalia State Fair Grounds HWY 65 & 16th Street Sedalia J. N. Turkey Kearn Memorial Wildlife Area SE 1201 Rd JOCO Green Ridge Hartwell CA Route AA Green Ridge Burns Tract Hope Dale Rd Green Ridge W. R. Kearn Memorial CA S Hope Dale Rd Green Ridge Bryson's Hope CA S Hope Dale Rd Green Ridge Grandfather Prairie CA W Mather Rd Sedalia Friendlt Prairie CA W Manila Rd Sedalia Paint Brush Paririe CA E Manila Rd Sedalia Drovers Prairie CA S Hoffman Rd Sedalia Kahrs-Boger Park S Route M Sedalia Parks in Pettis County Park Name Address Jurisdiction Liberty Park 3rd Street and HWY 65 Sedalia Centennial Park 16 th Street & New York Sedalia Housel Park Howard and Hurley streets Sedalia Hubbard Park Johnson and Missouri streets Sedalia Kata Park 24th Street and Grand Sedalia Vermont Park Vermont and 14th Street Sedalia Clover Dell Park West 32 nd Street Sedalia Historic Resources: The National Register of Historic Places is the official list of registered cultural resources worthy of preservation. It was authorized under the National Historic Preservation Act of 1966 as part of a national program. The purpose of the program is to coordinate and support public and private efforts to identify, evaluate, and protect our historic and archeological resources. The National Register is administered by the National Park Service under the Secretary of the Interior. Properties listed in the National Register include districts, sites, buildings, structures and objects that are significant in American history, architecture, archeology, engineering, and culture. Properties in Pettis County listed in the National Register of Historic Places are listed in Table
75 Table 3.11 National Register of Historic Places in Pettis County Property Location Date Listed Bois d'arc Cooperative Dairy Farm Historic District Hughesville vicinity 9/27/1991 Building at 217 W Main Street W Main St, Sedalia 10/24/1996 G and G Veterinary Hospital W Main St, Sedalia 4/15/2011 Gentry, William H., House Sedalia vicinity 11/14/1997 Harris House W 6th St, Sedalia 7/10/1979 Heard, John T. and Lillian, House W Broadway, Sedalia 4/15/2011 Hillview Cooperative Dairy Farm Historic District Hughesville vicinity 9/27/1991 Hotel Bothwell E 4th St., Sedalia 9/8/1989 Hubbard, C. C., High School N Osage Ave., Sedalia 7/3/1997 Jones, Henry, Farmstead Sedalia vicinity 12/3/2008 McVey School Sedalia vicinity 10/14/1999 Missouri, Kansas and Texas Railroad Depot E 3rd St., Sedalia 3/28/1979 Missouri/Sedalia Trust Co. S Ohio, Sedalia 3/29/1983 Missouri State Fairgrounds Historic District Sedalia 6/28/1991 Osage Farms Type 315:13 Government Farmhouse Hughesville vicinity 9/27/1991 Osage Farms Unit. 1 Historic District Hughesville vicinity 9/27/1991 Osage Farms Unit. 25 Historic District Hughesville vicinity 9/27/1991 Osage Farms Unit. 26 Historic District Hughesville vicinity 9/27/1991 Osage Farms Unit. 30 Historic District Hughesville vicinity 9/27/1991 Osage Farms Unit. 31 Historic District Hughesville vicinity 9/27/1991 Osage Farms Unit. 41 Historic District Houstonia vicinity 9/27/1991 Osage Farms Unit. 43 Historic District Hughesville vicinity 9/27/1991 Osage Farms Unit. 5 and. 6 Historic District Houstonia vicinity 9/27/1991 Osage Farms Unit. 8 and. 9 Historic District Houstonia vicinity 9/27/1991 Sedalia Commercial Historic District Sedalia updated 2/14/17 Sedalia Public Library Sedalia 1/10/1980 Thomson, Gen. David, House Hughesville vicinity 10/4/1982 Source: Missouri Department of natural Resources Missouri National Register Listings by County
76 Economic Resources: Table 3.12 shows major non-government employers in the planning area. Table 3.12 Major n-government Employers in Pettis County Employer Name Average Employees Tyson Foods Sedalia 200 School District 500+ Bothwell Regional Health Center 500+ Waterloo Industries 250+ State Fair Community College 250+ Wal-Mart 250+ Duke Manufacturing 250+ Maxion Wheels 250+ Inter-State Studios 250+ Four Seasons Living Center 250+ Gardener Denver 250+ Fall River Health & Safety 100+ Center for Human Services 100+ WireCo World Group 100+ Pittsburgh Corning 100+ General Cable 100+ Woods Supermarket 100+ Menards 100+ Green Ridge School District 65+ Source: Pettis County completed questionnaires Agriculture-Related Jobs in Pettis County: Pettis county agriculture plays a big part in the county s economy. Pettis County was the number eleventh county in Missouri for Total Market Value sold in Pettis was also number six in the value of the livestock sold, with poultry and eggs making up about 69% of the revenue totaling an estimated $122,542,000 and crop sales, $54,467,000, making up the remaining 31%. Table 3.13 shows more information on agriculture in Pettis County. 3.17
77 Table 3.13 Pettis County % Change Number of Farms 1,311 1,398-6 Land in Farms 419, , Average Farm Size Market Value of Products Sold Crop Sales 54,467,000 52,648, Livestock Sales 122,542, ,690,00 +9 Total 177,010, Average per Farm 135, Government Payments Government Payments 5,117,000 3,907, Average Payment per Farm 7,661 5, Land Use and Development Development since Previous Plan Update Table 3.14 Pettis County Population Growth Jurisdiction 2016 ACS Est Population Change % Change Pettis County 42,213 39,403 2, % Green Ridge % Houstonia % Hughesville % La Monte 1,131 1, % Sedalia 21,489 20,339 1, % Source: U.S. Bureau of the Census, Decennial Census; Population Statistics are for entire incorporated areas as reported by the Census bureau Population growth or decline is generally accompanied by increases or decreases in the number of housing units. Increases in population add to the built environment and increase risk and exposure to hazard events, the same correlation can be found with a decline in population as well. 3.18
78 Table 3.15 Pettis County Change in Housing Units, Jurisdiction Housing units 2016 ACS Housing units ACS # Change ACS % Change Pettis County 18,204 16,963 1, % Green Ridge % Houstonia % Hughesville % La Monte % Sedalia 10,196 9, % Source: U.S. Census Bureau, Pettis County as a whole has seen an increase in population and in number of housing units. There was only on community that saw a fall in both population and housing units. Green Ridge, Hughesville and Smithton all saw housing units decline but population rise. New development in Sedalia, a steel mill, will minimally increase the jurisdictions vulnerability to identifies assets. City of Green Ridge The City of Green Ridge is a rural community of about 445 residents a small increase from Although the Green Ridge population has grown, 9.6%, the number of housing units has slipped by 2.17%. Minimal development has occurred since the last plan update but the building of a new bus barn is planned during this planning cycle. City of Houstonia The City of Houstonia is the second smallest community included in this plan, population 221, and has seen the largest decline in population, -19.6%, and housing units, , since the 2000 census. With both of the previous factors in decline, development has been negligible. Village of Hughesville The Village of Hughesville has an estimated population of 184, a slight increase since 2000, 174. However, the number of housing units has seen a slight decrease from 69 to 63. new development has happened since the last plan. City of La Monte Since the 2000 census, the City of La Monte, the second largest jurisdiction, has experienced a population increase of almost 6%, from 1064 to La Monte also had the largest percentage increase, 14.75%, in housing units which total 549 in the 2016 ACS estimate. The additional housing units up the vulnerability for La Monte although this increase is relatively small. large projects are currently planned that would increase La Monte s vulnerability. City of Sedalia Sedalia is the largest urbanized city in Pettis County and has experienced a steady population increase of about 72 people per year since 2000, or a 5.4% increase from 20,339 to 21,489. The number of housing units in Sedalia has increased along with the population, totaling 10,196 for the 2016 ACS estimate, a 7.6% increase from 9,419 in Two projects planned within the next five years include a new police station and regional sewage lift station. These assets, mainly the police station project, and the increase in housing units increase the overall vulnerability for Sedalia since the last mitigation plan. 3.19
79 3.3.2 Future Land Use & Development Table 3.16 Building Permits Issued by the City of Sedalia by Year Year All Permits Single Family Apartment/Duplex Commercial Industrial Signs Commercial Addition/ Repair Dwelling Addition/ Repair Source: Sedalia questionnaire. 3.4 Hazard Profiles, Vulnerability, and Problem Statements Each hazard will be analyzed individually in a hazard profile in section The profile will consist of a general hazard description, location, severity/magnitude/extent, previous events, future probability, a discussion of risk variations between jurisdictions, and how anticipated development could impact risk. At the end of each hazard profile will be a vulnerability assessment, followed by a summary problem statement. Hazard Profiles Requirement 201.6(c)(2)(i): [The risk assessment shall include a] description of the location and extent of all natural hazards that can affect the jurisdiction. The plan shall include information on previous occurrences of hazard events and on the probability of future hazard events. The level of information presented in the profiles will vary by hazard based on the information available. With each update of this plan, new information will be incorporated to provide better evaluation and prioritization of the hazards that affect the planning area. Detailed profiles for each of the identified hazards include information categorized as follows: Hazard Description: This section consists of a general description of the hazard and the types of impacts it may have on a community or school/special district. Geographic Location: This section describes the geographic location of the hazard in the planning area. Where available, use maps to indicate the specific locations of the planning area that are vulnerable to the subject hazard. For some hazards, the entire planning area is at risk. Severity/Magnitude/Extent: This includes information about the severity, magnitude, and extent of a hazard. For some hazards, this is accomplished with description of a value on an established scientific scale or measurement system, such as an EF2 tornado on the Enhanced Fujita Scale. Severity, magnitude, and extent can also include the speed of onset and the duration of hazard events. Describing the severity/magnitude/extent of a hazard is not the same as describing its potential impacts on a community. Severity/magnitude/extent defines the characteristics of the hazard regardless of the people and property it affects. 3.20
80 Previous Occurrences: This section includes available information on historic incidents and their impacts. Historic event records form a solid basis for probability calculations. Probability of Future Occurrence: The frequency of recorded past events is used to estimate the likelihood of future occurrences. Probability was determined by dividing the number of recorded events by the number of years and multiplying by 100. This gives the percent chance of the event happening in any given year. For events occurring more than once annually, the probability will be reported 100% in any given year, with a statement of the average number of events annually. Vulnerability Assessments Requirement 201.6(c)(2)(ii) :[The risk assessment shall include a] description of the jurisdiction s vulnerability to the hazards described in paragraph (c)(2)(i) of this section. This description shall include an overall summary of each hazard and its impact on the community. Requirement 201.6(c)(2)(ii)(A) :The plan should describe vulnerability in terms of the types and numbers of existing and future buildings, infrastructure, and critical facilities located in the identified hazard areas. Requirement 201.6(c)(2)(ii)(B) :[The plan should describe vulnerability in terms of an] estimate of the potential dollar losses to vulnerable structures identified in paragraph (c)(2)(i)(a) of this section and a description of the methodology used to prepare the estimate. Requirement 201.6(c)(2)(ii)(C): [The plan should describe vulnerability in terms of] providing a general description of land uses and development trends within the community so that mitigation options can be considered in future land use decisions. Requirement 201.6(c)(2)(ii): (As of October 1, 2008) [The risk assessment] must also address National Flood Insurance Program (NFIP) insured structures that have been repetitively damaged in floods. Following the hazard profile for each hazard will be the vulnerability assessment. The vulnerability assessment further defines and quantifies populations, buildings, critical facilities, and other community assets at risk to damages from natural hazards. The vulnerability assessments will be based on the best available county-level data, which is in the Missouri Hazard Mitigation Plan (2010). The county-level assessments in the State Plan were based on the following sources: Statewide GIS data sets compiled by state and federal agencies; and FEMA s HAZUS-MH loss estimation software. The vulnerability assessments in the Pettis County plan will also be based on: Written descriptions of assets and risks provided by participating jurisdictions; Existing plans and reports; NOAA/NCEI Storm event Database; Personal interviews with planning committee members and other stakeholders; and Other sources as cited. In the Vulnerability Assessment, the following sub-headings will be addressed: 3.21
81 Potential Losses to Existing Development: Including types and numbers, of buildings, critical facilities. Previous and Future Development: This section will include information on how changes in development have impacted the community s vulnerability to this hazard. It also includes a description of any changes in development that occurred in known hazard prone areas since the previous plan have increased or decreased the community s vulnerability, and any anticipated future development in the county, and how that would impact hazard risk in the planning area. Hazard Summary by Jurisdiction: For hazard risks that vary by jurisdiction, this section will provide an overview of the variation and the factual basis for that variation. For example, a community that has adopted more recent building codes and constructed safe rooms would be less vulnerable to the impact of tornados. Problem Statements Each hazard analysis must conclude with a brief summary of the problems created by the hazard in the planning area, and possible ways to resolve those problems. Jurisdiction-specific information in those cases where the risk varies across the planning area is included. 3.22
82 3.4.1 Flooding (Flash & River) Hazard Profile Hazard Description A flood is partial or complete inundation of normally dry land areas. Riverine flooding is defined as the overflow of rivers, streams, drains, and lakes due to excessive rainfall, rapid snowmelt, or ice. There are several types of riverine floods, including headwater, backwater, interior drainage, and flash flooding. Riverine flooding is defined as the overflow of rivers, streams, drains, and lakes due to excessive rainfall, rapid snowmelt or ice melt. The areas adjacent to rivers and stream banks that carry excess floodwater during rapid runoff are called floodplains. A floodplain is defined as the lowland and relatively flat area adjoining a river or stream. The terms base flood and 100- year flood refer to the area in the floodplain that is subject to a one percent or greater chance of flooding in any given year. Floodplains are part of a larger entity called a basin, which is defined as all the land drained by a river and its branches. Flooding caused by dam and levee failure is discussed in Section and Section respectively. It will not be addressed in this section. A flash flood occurs when water levels rise at an extremely fast rate as a result of intense rainfall over a brief period, sometimes combined with rapid snowmelt, ice jam release, frozen ground, saturated soil, or impermeable surfaces. Flash flooding can happen in Special Flood Hazard Areas (SFHAs) as delineated by the National Flood Insurance Program (NFIP), and can also happen in areas not associated with floodplains. Ice jam flooding is a form of flash flooding that occurs when ice breaks up in moving waterways, and then stacks on itself where channels narrow. This creates a natural dam, often causing flooding within minutes of the dam formation. In some cases, flooding may not be directly attributable to a river, stream, or lake overflowing its banks. Rather, it may simply be the combination of excessive rainfall or snowmelt, saturated ground, and inadequate drainage. With no place to go, the water will find the lowest elevations areas that are often not in a floodplain. This type of flooding, often referred to as sheet flooding, is becoming increasingly prevalent as development outstrips the ability of the drainage infrastructure to properly carry and disburse the water flow. Most flash flooding is caused by slow-moving thunderstorms or thunderstorms repeatedly moving over the same area. Flash flooding is a dangerous form of flooding which can reach full peak in only a few minutes. Rapid onset allows little or no time for protective measures. Flash flood waters move at very fast speeds and can move boulders, tear out trees, scour channels, destroy buildings, and obliterate bridges. Flash flooding can result in higher loss of life, both human and animal, than slower developing river and stream flooding. In certain areas, aging storm sewer systems are not designed to carry the capacity currently needed to handle the increased storm runoff. Typically, the result is water backing into basements, which damages mechanical systems and can create serious public health and safety concerns. This combined with rainfall trends and rainfall extremes all demonstrate the high probability, yet generally unpredictable nature of flash flooding in the planning area. 3.23
83 Although flash floods are somewhat unpredictable, there are factors that can point to the likelihood of flash floods occurring. Weather surveillance radar is being used to improve monitoring capabilities of intense rainfall. This, along with knowledge of the watershed characteristics, modeling techniques, monitoring, and advanced warning systems has increased the warning time for flash floods. Geographic Location The follow figures show the 100-year floodplain around and critical facilities within the jurisdictions in Pettis County. Figures detail the floodplain around incorporated areas while Figures show critical facilities for each jurisdiction. 3.24

84 Figure

85 Figure

86 Figure

87 Figure

88 Figure

89 Figure

90 Figure

91 Figure

92 Figure

93 Figure
94 Table 3.17 Pettis County NCEI Flooding Events by Location, Location Event Dates # of Event Days Pettis County 6/28/1997, 7/30/1998, 8/7/1999, 7/11/2000, 12/28/ Green Ridge 6/28/ Sedalia 7/30/1998, 8/7/1999, 7/11/ Source: National Climatic Data Center NCEI Table 3.18 Pettis County NCEI Flash Flooding Events by Location, Location Event Dates # of Event Days 6/20/1998, 7/26/1998, 5/26/2000, 4/10/2001, 6/4/2001, Pettis 5/10/2003, 1/4/2005, 1/12/2005, 6/10/2007, 6/29/2007, County 9/12/2008, 6/15/2009, 7/11/2010, 5/20/2013, 8/7/2013, 18 4/3/2014, 7/1/2015, 8/1/2016, Green Ridge 1/12/2005, 7/11/2010, 2 Houstonia 4/10/2001, 8/1/ Hughesville 5/20/ La Monte 8/1/ Sedalia 6/20/1998, 7/26/1998, 6/4/2001, 1/4/2005, 6/29/2007, 9/12/2008, 6/15/ Source: National Climatic Data Center Severity/Magnitude/Extent Missouri has a long and active history of flooding over the past century, according to the 2013 State Hazard Mitigation Plan. Flooding along Missouri s major rivers generally results in slow-moving disasters. River crest levels are forecast several days in advance, allowing communities downstream sufficient time to take protective measures, such as sandbagging and evacuations. Nevertheless, floods exact a heavy toll in terms of human suffering and losses to public and private property. By contrast, flash flood events in recent years have caused a higher number of deaths and major property damage in many areas of Missouri. Flooding presents a danger to life and property, often resulting in injuries, and in some cases, fatalities. Floodwaters themselves can interact with hazardous materials. Hazardous materials stored in large containers could break loose or puncture as a result of flood activity. Examples are bulk propane tanks. When this happens, evacuation of citizens is necessary. Public health concerns may result from flooding, requiring disease and injury surveillance. Community sanitation to evaluate flood-affected food supplies may also be necessary. Private water and sewage sanitation could be impacted, and vector control (for mosquitoes and other entomology concerns) may be necessary. When roads and bridges are inundated by water, damage can occur as the water scours materials around bridge abutments and gravel roads. Floodwaters can also cause erosion undermining road beds. In some instances, steep slopes that are saturated with water may cause mud or rock slides onto roadways. These damages can cause costly repairs for state, county, and city road and bridge maintenance departments, see Figure 3.1 for 3.35
95 bridges in planning area. When sewer back-up occurs, this can result in costly clean-up for home and business owners as well as present a health hazard. National Flood Insurance Program (NFIP) Participation Table 3.19 provides details on NFIP participation for the communities in the planning area. Table 3.20 contains the number of policies in force, amount of insurance in force, number of closed losses, and total payments for each jurisdiction, where applicable. The time period represented by the data for closed losses. Jurisdictions, included in this plan, that do not participate in NFIP do not contain any floodplain within their boundaries and do not currently have the appropriate support staff. Table 3.19 Community ID # Community Name NFIP Participation in Pettis County Initial FIRM Identified Current Effective Map Date Regular Emergency Program Entry Date City of La Monte N/A (NSFHA) 8/24/ # Pettis County 5/1/1994 5/1/1994 5/1/ # City of Sedalia 9/18/1985 1/5/1996 9/18/1985 **The City of Houstonia was sanctioned for NFIP participation 9/19/1976.** Source: Table 3.20 Pettis County NFIP Policy & Claim Statistics as of Community Name Total Losses Open Losses Closed Losses Total Payments Pettis County $197, Sedalia $49, Source: bsa.nfipstat.fema.gov/reports/1040.htm#
96 Repetitive Loss/Severe Repetitive Loss Properties Repetitive Loss Properties are those properties with at least two flood insurance payments of $5,000 or more in a 10-year period. According to the Flood Insurance Administration, jurisdictions included in the planning area have a combined total of 0 repetitive loss properties. There are zero severe repetitive loss properties within the planning area. A SRL property is defined it as a single family property (consisting of one-to-four residences) that is covered under flood insurance by the NFIP; and has (1) incurred flood-related damage for which four or more separate claims payments have been paid under flood insurance coverage with the amount of each claim payment exceeding $5,000 and with cumulative amounts of such claims payments exceeding $20,000; or (2) for which at least two separate claims payments have been made with the cumulative amount of such claims exceeding the reported value of the property. Previous Occurrences Table 3.21 Pettis County NCEI Flooding Events by Location, Location Event Dates # of Event Days Pettis County 6/28/1997, 7/30/1998, 8/7/1999, 7/11/2000, 5 12/28/2005 Green Ridge 6/28/ Sedalia 7/30/1998, 8/7/1999, 7/11/ Source: National Climatic Data Center Table 3.22 Pettis County NCEI Flash Flooding Events by Location, Location Event Dates # of Event Days 6/20/1998, 7/26/1998, 5/26/2000, 4/10/2001, 6/4/2001, Pettis 5/10/2003, 1/4/2005, 1/12/2005, 6/10/2007, 6/29/2007, County 9/12/2008, 6/15/2009, 7/11/2010, 5/20/2013, 8/7/2013, 18 4/3/2014, 7/1/2015, 8/1/2016, Green Ridge 1/12/2005, 7/11/2010, 2 Houstonia 4/10/2001, 8/1/ Hughesville 5/20/ La Monte 8/1/ Sedalia 6/20/1998, 7/26/1998, 6/4/2001, 1/4/2005, 6/29/2007, 9/12/2008, 6/15/ Source: National Climatic Data Center Probability of Future Occurrence There have been 23 occurrences, or events, of flooding in Pettis County from 1997 to 2016 in the NCEI storm event database. Out of those 23 events, 18 were flash flooding events while the remaining five events were of the riverine flooding type. Using a 20-year period of record this equates to 1.15 flash floods a year and less than one riverine flood per year. Due to this there is a 100% probability of a flash flood occurrence in any given year, ravine floods are far less common in the planning area and have a probability of 25% chance for occurrence a year. 3.37
97 Vulnerability Vulnerability Overview Periods of heavy rain, falling at the rate of one inch per hour, can flood low water crossings throughout the county making many roads impassable. This creates a severe threat to motorists that attempt to drive through flood waters over the roadway. Riverine flooding occurs less frequently than flash flooding, however, property damage is still possible. Areas in low lying areas outside of the floodplain are frequently flooded. Flooding of streets has been reported in several of the communities and many highways are susceptible to flooding. Potential Losses to Existing Development Table 3.23 Pettis County Building Count (HAZUS-MH 2.1) Residential Commercial Industrial Agriculture Religion Government Education Total 5, ,567 Table 3.24 Total Direct Building Loss and Income Loss for Flooding in Pettis County Structural Damage Contents Damage Inventory Loss Total Direct Loss Total Income Loss Total Direct & Income Loss Calc Loss Ratio $10,215, $9,405, $330, $19,951, $40, $19,991, Impact of Previous and Future Development Future development could impact flash and riverine flooding in the planning area. Development in low-lying areas near rivers and streams or where interior drainage systems are not adequate to provide drainage during heavy rainfall events will be at risk to flash flooding. Future development would also increase impervious surfaces causing additional water run-off and drainage problems during heavy rainfall events. Hazard Summary by Jurisdiction It should be noted that all of these communities can be impacted by flooding of major roads and low water crossings in the areas proximate to their corporate limits. Several incorporated areas in the county are susceptible to street flooding during periods of heavy rain as evidenced by the previous occurrences. The greatest impact of flooding is in the unincorporated part of the county. Due to the topography and many streams in the county, numerous low water crossings are damaged and create a significant hazard to public safety during flood events. Problem Statement Floods are frequent events and have the potential to costly through damages and fatal to residents in the county. Participation in the NFIP enables residents to purchase flood insurance. Street flooding in incorporated areas can be addressed through storm water management projects and enforce storm water management regulations. 3.38
98 3.4.2 Dam Failure Hazard Profile Hazard Description A dam is defined as a barrier constructed across a watercourse for the purpose of storage, control, or diversion of water. Dams are typically constructed of earth, rock, concrete, or mine tailings. Dam failure is the uncontrolled release of impounded water resulting in downstream flooding, affecting both life and property. Dam failure can be caused by any of the following: 1. Overtopping - inadequate spillway design, debris blockage of spillways or settlement of the dam crest. 2. Piping - internal erosion caused by embankment leakage, foundation leakage and deterioration of pertinent structures appended to the dam. 3. Erosion - inadequate spillway capacity causing overtopping of the dam, flow erosion, and inadequate slope protection. 4. Structural Failure - caused by an earthquake, slope instability or faulty construction. According to the State Plan, Missouri had some 5,423 recorded dams in 2013, the largest number of man-made dams of any state in the country. Missouri s topography allows lakes to be built easily and inexpensively, which accounts for the high number of dams. Despite the large number of dams, there are only 682 (about 13 percent) state regulated dams, with an additional 66 federally regulated dams. Federal dams in Missouri are primarily regulated by two federal agencies; the U.S. Army Corps of Engineers (USACE), and the U.S. Department of Agriculture Forest Service. The remaining 4,495 dams are unregulated. Dams that fall under state regulation are non-federally regulated dams that are more than 35 feet in height. Most nonfederal dams are privately owned structures built either for agricultural, water supply or recreational use. The Department of Natural Resources (MDNR) Water Resources Center maintains the Dam and Reservoir Safety Program in Missouri. The program ensures that dams over 35 feet in height are safely constructed, operated, and maintained pursuant to Chapter 236 of Revised Statutes of Missouri. The Department of Natural Resources provides information about regulated and unregulated dams in Missouri. The information includes details of the dam dimensions, date of construction, approximate reservoir volume, contributing drainage basin area and hazard classification. In addition, USACE maintains the National Inventory of Dams (NID). The information in the NID database matches the list from the MDNR website with some additional details for dams in Pettis County. Although both agencies provide a hazard classification for dams, the dam classification systems differ. The Missouri Dam and Reservoir Safety Council Rules and Regulations uses three classes of downstream environmental zone used when considering permits. The downstream environment zone is the area below the dam that would become inundated should the dam fail. Inundation is defined as water two feet or more over the submerged ground outside of the stream channel. These classes are based on the number of structures and types of development contained within the inundation area as presented in Table The downstream environment zone classification is also used to prescribe the frequency of inspection. 3.39
99 Pettis County has two dams that fall into the Class I category; they are Spring Fork Lake Dam and the Windsor Farrington Park Lake Dam. These are shown in more detail in Figures Table 3.25 Hazard Class Class I Class II MoDNR Dam Hazard Classification Definitions Definition The area downstream from the dam that would be affected by inundation contains ten (10) or more permanent dwellings or any public building. Inspection of these dams are required every two years. The area downstream from the dam that would be affected by inundation contains one to nine permanent dwelling, or one (1) or more campgrounds with permanent water, sewer and electrical services or one (1) or more industrial buildings. Inspection of these dams must occur once every three years. area downstream from the dam that would be affected by inundation contains one to nine permanent dwelling, or one (1) or more campgrounds with permanent water, sewer and electrical services or one (1) or more industrial buildings. Inspection of these dams must occur once every three years. The area downstream from the dam that would be affected by inundation does not contain any of Class III the structures identified for Class I or Class II dams. Inspection of these dams must occur once every five years. Source: Missouri Department of Natural Resources, Dams in the NID are classified according to hazard potential, an indicator of the consequences of dam failure. A dam s hazard potential classification, presented in Table 3.26, does not indicate its condition. Dams assigned the high hazard potential classification are those where failure will potentially result in loss of human life. Significant hazard potential are those dams where failure results in no probable loss of human life but can cause economic loss. Dams assigned the low hazard potential classification are those where failure or results in no probable loss of human life and low economic or environmental losses. Losses are principally limited to the owner s property. Table 3.26 Hazard Class Low Hazard Significant High Hazard Source: National Inventory of Dams Definition Failure results only in minimal property damage. Failure could possibly result in the loss of life and appreciable property damage. If the dam were to fail, lives would be lost and extensive property damage could result. There is not a direct correlation between the State Hazard classification and the NID classifications. However, most dams that are in the State s Classes I and II are considered NID High Hazard Dams. Geographic Location Dams in Planning Area: There are a total of 28 dams in Pettis County recorded by the National Inventory of Dams (NID) database. Out of the 28 dams only one is regulated, the Spring Fork Dam in southern Pettis County. Of the twenty-eight dams in Pettis, six are classified as a high hazard dam according to the NID, Windsor Farrington Park Lake, Hermora Lake, Rubydo Lake, Hayes Lake, Spring Fork Lake, and Daum Lake dams. Figure 3.12 shows the location of dams within Pettis County. 3.40

100 Figure
101 Table 3.27 Dam Name Emergency Action Plan (EAP) Dam Height (Ft) High Hazard Dams in Pettis County Last Inspection Date River Max Storage (Acre-Ft) Nearest Downstream City Distance To Nearest City (Miles) Dam Owner Daum Lake N/A Clinton 12 Harold Daum Hayes Lake N/A Private Hermora Lake N/A Otterville 6 Dick G Mansees Rubydo Lake N/A Redbird 14 Dick G Mansees Spring Fork Lake /26/2014 Sedalia 7 City of Sedalia Windsor Farrington Park Lake /16/1980 Sources: Missouri Department of Natural Resources, and National Inventory of Dams, the end of 2015, the Missouri DNR anticipates having Emergency Action Plans, including inundation maps for all state-regulated Class 1 and Class 2 dams. Contact the DNR Dam and Reservoir Safety Program at to request the inundation maps for your county to show geographic locations at risk, extent of failure and to perform GIS analysis of those assets at risk to dam failure. Figures 3.13 & 3.14 shows a closer view of each Class I hazard dam. 3.42

102 Figure

103 Figure
104 Severity/Magnitude/Extent The impact on the downstream community, dependent upon what is downstream could be very serious. The adverse impacts of future dam failures affecting Pettis County at the high hazard level are shown below. Intersecting almost all the issues above is the issue of public education about dams. The ordinary citizen is unaware that the beautiful lakes on which he or she boats, skis or fishes are only there because of manmade dams. Developers build in dam break flood inundation areas knowing nothing about the potential that an upstream dam has, to cause devastation should it fail. In fact, some developers and zoning officials are completely unaware of dams within their community. Even if citizens understand and are aware of dams, they still can be overly confident in the infallibility of these manmade structures. Living in dam break flood-prone areas is a risk. Many dam owners do not realize their responsibility and liability toward the downstream public and environment. The adverse impacts of future dam failures affecting Pettis County at the high hazard level are shown below. Without mitigation measures: Life Catastrophic Property Catastrophic Emotional Catastrophic Financial Catastrophic With mitigation measures: Life Negligible Property Negligible Emotional Negligible Financial Negligible Comments: One large dam holding back a high volume of water could destroy life and property for several miles downstream. It can be stated that the severity/magnitude of dam failure would be similar in some cases to the impacts associated with flood events (see the flood hazard vulnerability analysis and discussion). Based on the hazard class definitions, failure of any of the High Hazard/Class I dams could result in a serious threat of loss of human life, serious damage to residential, industrial or commercial areas, public utilities, public buildings, or major transportation facilities. Catastrophic failure of any high hazard dams has the potential to result in greater destruction due to the potential speed of onset and greater depth, extent, and velocity of flooding. te that for this reason, dam failures could flood areas outside of mapped flood hazards. See 2013 State Plan page for additional information Previous Occurrences There is no record of a dam failure within Pettis county over the 26-year period from 1975 to Seven-teen dam failures were recorded in the state of Missouri for the same time period. This does not include the Taum Sauk failure in 2005 or the Moon Valley Lake Dam failure in 2008 since the comprehensive data collected by Stanford University was not updated past According to this data, the annual probability calculates to a 65% (17/26 = 0.65 or 65%) probability in any given year for at least one dam failure event somewhere in the State of Missouri. However, with over 5,000 dams in the State, this translates to an overall low probability per dam structure. 3.45
105 Probability of Future Occurrence There are no records of dam failure in Pettis County. Since there are zero recorded events in the planning area, a calculation of a probability percent is not possible. According to information from the 2013 State Plan, Missouri s percentage of high hazard dams in the DNR inventory puts the State at about the national average for that category. However, if development occurs downstream of dams the percentage of high hazard dams will increase. Additionally, the probabilities of dam failure increases as many of the smaller and privately owned dams continue to deteriorate without the benefit of further regulation or improvements. Regular inspection and maintenance schedules for dams greatly reduce the probability of dam failure. Vulnerability Vulnerability Overview Vulnerability to dam Failure in Pettis County is limited to structures and critical facilities located in dam inundation zones. A failure at the Spring Fork Lake dam would not cause a large amount of damage due to the area downstream is farm and woodlands. If the failure happened during the growing season damages could occur to crops planted in the farm land in the inundation area. If the Winsor Farrington Park Lake dam were to experience a break, minimal property damage would be incurred as only one structure lies within the inundation area. The remainder of the inundation area is either wooded or farmland or pastures. school district facilities are located within inundation areas or downstream environments form existing dams. critical facilities are located within inundation areas also. Impact of Previous and Future Development It is possible that future development will occur in the downstream environment of dams within the county; however, no major development is expected due to the slow growth of Pettis County and its jurisdictions. Hazard Summary by Jurisdiction Pettis County, Sedalia, and the City of Green Ridge are the only jurisdictions in the county vulnerable to dam failure. school district facilities are located within inundation areas or downstream environments form existing dams. Problem Statement Out of the six high risk dams located in Pettis County, none are located in the direct vicinity of a jurisdiction but risk is higher to those living around these structures. Residents near a Class I or Class II hazard dams should become familiar with the dam s emergency action plans, if available. Emergency plans written for dams include procedures for notification and coordination with local law enforcement and other governmental agencies, information on the potential inundation area, plans for warning and evacuation, and procedures for making emergency repairs. 3.46
106 3.4.3 Drought Hazard Profile Hazard Description Drought is generally defined as a condition of moisture levels significantly below normal for an extended period of time over a large area that adversely affects plants, animal life, and humans. A drought period can last for months, years, or even decades. There are four types of drought conditions relevant to Missouri, according to the State Plan, which are as follows. Meteorological drought is defined in terms of the basis of the degree of dryness (in comparison to some normal or average amount) and the duration of the dry period. A meteorological drought must be considered as region-specific since the atmospheric conditions that result in deficiencies of precipitation are highly variable from region to region. Hydrological drought is associated with the effects of periods of precipitation (including snowfall) shortfalls on surface or subsurface water supply (e.g., streamflow, reservoir and lake levels, ground water). The frequency and severity of hydrological drought is often defined on a watershed or river basin scale. Although all droughts originate with a deficiency of precipitation, hydrologists are more concerned with how this deficiency plays out through the hydrologic system. Hydrological droughts are usually out of phase with or lag the occurrence of meteorological and agricultural droughts. It takes longer for precipitation deficiencies to show up in components of the hydrological system such as soil moisture, streamflow, and ground water and reservoir levels. As a result, these impacts also are out of phase with impacts in other economic sectors. Agricultural drought focus is on soil moisture deficiencies, differences between actual and potential evaporation, reduced ground water or reservoir levels, etc. Plant demand for water depends on prevailing weather conditions, biological characteristics of the specific plant, its stage of growth, and the physical and biological properties of the soil. Socioeconomic drought refers to when physical water shortage begins to affect people. Data sources: Geographic Location Droughts are regional climatic events that can impact large areas and multiple counties. The entire county is at risk to the impacts of drought. However, drought most directly impacts the agricultural sector, so areas within the county where there is extensive agricultural land use can experience significant impacts. The major agricultural activity in the county is livestock, which accounts for 69% of sales. Due to the large amount of livestock, and their needs, in the region, an extreme drought can have a devastating effect if water supplies run short in an extended drought period. 3.47

107 Severity/Magnitude/Extent The National Drought Monitor Center at the University of Nebraska at Lincoln summarized the potential severity of drought as follows. Drought can create economic impacts on agriculture and related sectors, including forestry and fisheries, because of the reliance of these sectors on surface and subsurface water supplies. In addition to losses in yields in crop and livestock production, drought is associated with increases in insect infestations, plant disease, and wind erosion. Droughts also bring increased problems with insects and disease to forests and reduce growth. The incidence of forest and range fires increases substantially during extended droughts, which in turn place both human and wildlife populations at higher levels of risk. Income loss is another indicator used in assessing the impacts of drought because so many sectors are affected. Finally, while drought is rarely a direct cause of death, the associated heat, dust and stress can all contribute to increased mortality. Figure 3.15 Drought Monitor Map The Palmer Index has proven most effective in identifying long-term drought of more than several months. However, the Palmer Index has been less effective in determining conditions over a matter of weeks. It uses a 0 as normal, and drought is shown in terms of negative numbers; for example, negative 2 is moderate drought, negative 3 is severe drought, and negative 4 is extreme drought. Palmer's algorithm also is used to describe wet spells, using corresponding positive numbers. 3.48
108 According to the MDNR Missouri Drought Plan revised in 2002, Missouri s Drought Response System is divided into four phases based on Palmer index values: Phase I: Advisory Phase Requires a drought monitoring and assessment system to provide enough lead time for state and local planners to take appropriate action; Phase II: Drought Alert When the PDSI reads -1.0 to -2.0, and stream flows, reservoir levels, and groundwater levels are below normal over a several month period, or when the Drought Assessment Committee (DAC) determines that Phase II conditions exist based on other drought determination methods; Phase III: Conservation Phase When the PDSI reads -2.0 to -4.0, and stream flows, reservoir levels, and groundwater levels continue to decline, along with forecasts indicating an extended period of belownormal precipitation, or when the DAC determines that Phase III conditions exist based on other drought determination models; Phase IV: Drought Emergency When the PDSI is lower than -4.0, or when the DAC determines that Phase IV conditions exist based on other drought determination methods. Palmer also developed a formula for standardizing drought calculations for each individual location based on the variability of precipitation and temperature at that location. The Palmer index can therefore be applied to any site for which sufficient precipitation and temperature data is available. Green Ridge, La Monte, Houstonia, and Hughesville all rely on wells These communities could have problems with public water in the event of a long term drought. The impact of drought on deeper public wells would not be significant unless the drought was of such severity to reduce groundwater levels. 3.49
109 Previous Occurrences Table 3.28 Pettis County Previous Drought Occurrence 4/1/2000 7/1/2012 8/1/2012 9/1/ /1/2012 1/1/2013 April 2000 was the driest on record in the state of Missouri, according to the Midwestern Climate Center. Drought Monitor showed most of northern and western Missouri in a severe drought. According to the Missouri State Climatologist, was the 5th driest July-through-April period on record. The areas hardest hit by the long-term drought were along Missouri's northern border, where rainfall deficits had reached 15 to 20 inches. Dry conditions, which started in the spring, intensified during the month of July. Drought conditions expanded across Missouri, with D2 conditions at the beginning of the month, increasing to D3 conditions by the end of the month. Most locations by the end of the month, had yearly rainfall deficits of 10 to 15 inches. Dry conditions, which started in the spring, intensified during the month of August. Drought D2 and D3 conditions at the beginning of the month, increased to D3 and D4 conditions by the end of the month. Most locations by the end month continued yearly rainfall deficits in the 10 to 15 inch range. The remnants of Hurricane Isaac, brought some much needed relief to drought conditions across the area, on the 1st of September. This helped improve drought conditions from D4 and D3 to D3 and D2. Rainfall totals with the remnants of Isaac, ranged from around one inch near the Iowa border, to around 7 inches in the Kansas City Metropolitan area. The drought continued across west central and northwest Missouri through the month of October, with slight improvement noted, especially across north central and central portions of the state. Rainfall deficits for the year were in the 10 to 15 inch range. Drought D1 to D2 conditions prevailed across the county. Sedalia received 4.60 inches of rain. There have been several storm systems that have impacted the region in the last half of January. Most of the precipitation from these systems has fallen along and southeast of a Kansas City to Kirksville line. This has resulted in some improvement to the drought across portions of central to northern and northeastern Missouri. Moderate to severe D1 to D2 drought conditions prevailed across the county. Probability of Future Occurrence Over the 20-year record period, Pettis County was in drought for 11 months. There are a total of 240 months in the record period. The calculated risk percent from the number of months of drought and total number of months in the record period equates to the annual average percentage of 4.6% probability of drought occurrence in the county. Although drought is not predictable, long-range outlooks and predicted impacts of climate change could indicate an increased chance of drought. 3.50
110 Vulnerability Vulnerability Overview The agriculture sector is particularly vulnerable to drought. Periods of dry weather can reduce stock ponds and force the early sale of livestock. Crop production can be disrupted and vegetative diseases can spread reducing yields. Cities that operate water wells can experience water shortages during persistent drought periods. Those that rely on private wells are likely be impacted by reductions in the groundwater supply. Potential Losses to Existing Development There are no anticipated structural losses, loss of life, or injuries associated with this hazard. Impact of Future Development Increases in acreage planted with crops would add to exposure to drought-related agricultural losses. In addition, increases in population result in increased demand for treated water, adding additional strain on water supply systems. Impact of Climate Change A new analysis, performed for the Natural Resources Defense Council, examined the effects of climate change on water supply and demand in the contiguous United States. The study found that more than 1,100 counties will face higher risks of water shortages by mid-century as a result of climate change. Two of the principal reasons for the projected water constraints are shifts in precipitation and potential evapotranspiration (PET). Climate models project decreases in precipitation in many regions of the U.S., including areas that may currently be described as experiencing water shortages of some degree. The Natural Resources Defense Council developed a new water supply sustainability index. The risk to water sustainability is based on the following criteria: Projected water demand as a share of available precipitation Groundwater use as a share of projected available precipitation Susceptibility to drought Projected increase in freshwater withdrawals Projected increase in summer water deficit The risk to water sustainability for counties meeting two of the criteria are classified as moderate, while those meeting three of the criteria are classified as high, and those meeting four or more are classified as extreme. Counties meeting less than two criteria are considered to have low risk to water sustainability. According to the Natural Resources Defense Council, without climate change the water supply sustainability index for Pettis County is low. With climate change, the water supply sustainability index increases to moderate (NRDC). 3.51
111 Hazard Summary by Jurisdiction Although the probability of drought is the same for the entire county, farming and livestock enterprises in the unincorporated parts of the county would feel the greatest impact. These impacts are mitigated somewhat by the purchase of crop insurance. major waterways travel through Pettis County, leaving jurisdictions to rely on groundwater for all their water needs. Communities are susceptible to water shortages due to groundwater reduction; other communities with no source are more at risk to extreme water shortages in the event of a drought. School and special districts would be the least impacted by drought; however, those districts in communities with single source wells or none at all may experience water shortages prior to those in larger communities. Problem Statement Although drought most likely will not cause structural damage, the impact is greatest on the agriculture sector and if persistent enough, could cause reductions in groundwater and water shortages in communities that provide potable water services. Potential solutions to mitigate the impact of drought would be for communities to develop an ordinance to restrict the use of public water resources for non-essential usage, such as landscaping, washing cars, filling swimming pools, etc. during extreme drought periods. School and special districts can also implement water conservation measures at all district facilities. 3.52
112 3.4.4 Tornado Hazard Profile Hazard Description The NWS defines a tornado as a violently rotating column of air extending from a thunderstorm to the ground. It is usually spawned by a thunderstorm and produced when cool air overrides a layer of warm air, forcing the warm air to rise rapidly. Often, vortices remain suspended in the atmosphere as funnel clouds. When the lower tip of a vortex touches the ground, it becomes a tornado. High winds not associated with tornadoes are profiled separately in this document in Section 3.4.5, Thunderstorm/High Wind/Hail/Lightning. Essentially, tornadoes are a vortex storm with two components of winds. The first is the rotational winds that can measure up to 500 miles per hour, and the second is an uplifting current of great strength. The dynamic strength of both these currents can cause vacuums that can overpressure structures from the inside. Although tornadoes have been documented in all 50 states, most of them occur in the central United States due to its unique geography and presence of the jet stream. The jet stream is a high-velocity stream of air that separates the cold air of the north from the warm air of the south. During the winter, the jet stream flows west to east from Texas to the Carolina coast. As the sun moves north, so does the jet stream, which at summer solstice flows from Canada across Lake Superior to Maine. During its move northward in the spring and its recession south during the fall, the jet stream crosses Missouri, causing the large thunderstorms that breed tornadoes. A typical tornado can be described as a funnel-shaped cloud in contact with the earth s surface that is anchored to a cloud, usually a cumulonimbus. This contact on average lasts 30 minutes and covers an average distance of 15 miles. The width of the tornado (and its path of destruction) is usually about 300 yards. However, tornadoes can stay on the ground for upward of 300 miles and can be up to a mile wide. The National Weather Service, in reviewing tornadoes occurring in Missouri between 1950 and 1996, calculated the mean path length at 2.27 miles and the mean path area at 0.14 square mile. The average forward speed of a tornado is 30 miles per hour but may vary from nearly stationary to 70 miles per hour. The average tornado moves from southwest to northeast, but tornadoes have been known to move in any direction. Tornadoes are most likely to occur in the afternoon and evening, but have been known to occur at all hours of the day and night. Geographic Location There are no specific locations for future occurrences, as the threat is county wide. 3.53
113 Severity/Magnitude/Extent Tornadoes are the most violent of all atmospheric storms and are capable of tremendous destruction. Wind speeds can exceed 250 miles per hour and damage paths can be more than one mile wide and 50 miles long. Tornadoes have been known to lift and move objects weighing more than 300 tons a distance of 30 feet, toss homes more than 300 feet from their foundations, and siphon millions of tons of water from water bodies. Tornadoes also can generate a tremendous amount of flying debris or missiles, which often become airborne shrapnel that causes additional damage. If wind speeds are high enough, missiles can be thrown at a building with enough force to penetrate windows, roofs, and walls. However, the less spectacular damage is much more common. Tornado magnitude is classified according to the EF- Scale (or the Enhance Fujita Scale, based on the original Fujita Scale developed by Dr. Theodore Fujita, a renowned severe storm researcher). The EF- Scale (see Table 3.30) attempts to rank tornadoes according to wind speed based on the damage caused. This update to the original F Scale was implemented in the U.S. on February 1, Table 3.29 Enhanced F Scale for Tornado Damage F-Number FUJITA SCALE DERIVED EF SCALE OPERATIONAL EF SCALE Fastest ¼-mile (mph) 3 Second Gust (mph) EF-Number 3 Second Gust (mph) EF-Number 3 Second Gust (mph) Over 200 Source: The National Weather Service, The wind speeds for the EF scale and damage descriptions are based on information on the NOAA Storm Prediction Center. The damage descriptions are summaries. For the actual EF scale, it is necessary to look up the damage indicator (type of structure damaged) and refer to the degrees of damage associated with that indicator. Information on the Enhanced Fujita Scale s damage indicators and degrees or damage is located online at
114 Table 3.30 Enhanced Fujita Scale Scale Wind Speed (mph) Relative Frequency Potential Damage EF % Light. Peels surface off some roofs; some damage to gutters or siding; branches broken off trees; shallowrooted trees pushed over. Confirmed tornadoes with no reported damage (i.e. those that remain in open fields) are always rated EF0). EF % Moderate. Roofs severely stripped; mobile homes overturned or badly damaged; loss of exterior doors; windows and other glass broken. Considerable. Roofs torn off well-constructed houses; foundations of frame homes shifted; mobile homes EF % complete destroyed; large trees snapped or uprooted; light object missiles generated; cars lifted off ground. Severe. Entire stores of well-constructed houses destroyed; severe damage to large buildings such as EF % shopping malls; trains overturned; trees debarked; heavy cars lifted off the ground and thrown; structures with weak foundations blown away some distance. EF % Devastating. Well-constructed houses and whole frame houses completely levelled; cars thrown and small missiles generated. EF5 >200 <0.1% Explosive. Strong frame houses levelled off foundations and swept away; automobile-sized missiles fly through the air in excess of 300 ft.; steel reinforced concrete structure badly damaged; high rise buildings have significant structural deformation; incredible phenomena will occur. Source: NOAA Storm Prediction Center, Enhanced weather forecasting has provided the ability to predict severe weather likely to produce tornadoes days in advance. Tornado watches can be delivered to those in the path of these storms several hours in advance. Lead time for actual tornado warnings is about 30 minutes. Tornadoes have been known to change paths very rapidly, thus limiting the time in which to take shelter. Tornadoes may not be visible on the ground if they occur after sundown or due to blowing dust or driving rain and hail. Previous Occurrences Table 3.31 shows NCEI reported tornado events and damages since 1993 in the planning area. Prior to that date, only really destructive tornadoes were recorded. It is necessary to go back as far as possible because of the random and intermittent nature of tornado events. Consult the event narratives for descriptions of notable storm events, and include the information in the plan. There are limitations to the use of NCEI tornado data that must be noted. For example, one tornado may contain multiple segments as it moves geographically. A tornado that crosses a county line or state line is considered a separate segment for the purposes of reporting to the NCEI. 3.55
115 Also, a tornado that lifts off the ground for less than 5 minutes or 2.5 miles is considered a separate segment. If the tornado lifts off the ground for greater than 5 minutes or 2.5 miles, it is considered a separate tornado. Tornadoes reported in Storm Data and the Storm Events Database is in segments. Table 3.31 Recorded Tornadoes in Pettis County, Location Date Time Magnitude Deaths Injuries Property Damage Crop Damage La Monte 3/6/ :13 EF0 0 0 $0.00 $0.00 La Monte 5/20/ :57 EF1 0 0 $20, $0.00 Pettis Co. 5/25/ :52 EF0 0 0 $0.00 $0.00 Sedalia 5/25/ :22 EF $4,000, $0.00 Sedalia 5/20/ :46 EF0 0 0 $8, $0.00 Hughesville 9/12/ :44 EF0 0 0 $5, $0.00 Green Ridge 3/30/ :24 F1 1 0 $450, $0.00 La Monte 3/12/ :57 F2 0 0 $0.00 $0.00 Houstonia 3/12/ :07 F2 0 0 $0.00 $0.00 Green Ridge 3/12/ :12 F2 1 6 $2,500, $0.00 Pettis Co. 3/12/ :57 F1 0 0 $0.00 $0.00 La Monte 3/12/ :49 F0 0 0 $0.00 $0.00 Sedalia 3/9/2006 0:19 F0 0 0 $5, $0.00 Houstonia 10/29/ :16 F1 0 0 $300, $0.00 Sedalia 5/6/ :55 F0 0 2 $2, $0.00 La Monte 5/4/ :35 F0 0 0 $5, $0.00 La Monte 4/10/ :45 F1 0 0 $50, $0.00 Totals 2 28 $7,345, $0.00 Source: National Climate Data Center, Probability of Future Occurrence According to the NCEI storm records, there have been 13 tornado events from 1993 to Based on the past occurrences of tornadoes in Pettis County, there is a 54% probability that the county will experience a tornado in any given year. 3.56

116 Figure 3.16 Tornado Paths Vulnerability Vulnerability Overview The 2013 State Plan used a methodology to the vulnerability of each county in the state to determine each county s vulnerability to tornadoes. While this approach attempts to prioritize tornado vulnerable counties, it does not identify any particular geographic patterns to tornado risk. The state s analysis combined annualized losses and frequency of occurrence to determine the greatest likelihood of being impacted by a tornado. The state s vulnerability rating ranged from very high, high, and moderate. The vulnerability rating for Pettis County was rated at moderate risk. 3.57

117 Figure 3.17 Tornado Alley Potential Losses to Existing Development During the 24 year period from 1993 to 2017, a total of $7,345,000 in property losses equates to $272,037 in average annual losses in the county. The most common tornado events recorded in the county are F0 and F1 magnitude events. One of the 19 tornado events on record the highest magnitude tornado recorded was an EF2. There was also some F2 magnitude tornadoes recorded in the NCEI data. Previous and Future Development During the 24 year period from 1993 to 2017, a total of $7,345,000 in property losses were incurred. This equates to $272,037 in average annual losses in the county. This value indicates that potential future losses in the county will remain moderately low. Future development and any increase in population will increase exposure to damage; however not much is expected in the near future. 3.58
118 Hazard Summary by Jurisdiction Although tornado events are area-wide hazard, communities with a greater percentage of structures built prior to 1939, or the high concentration of mobile homes, are considered to be more vulnerable to the impact of high wind and hail damage. Jurisdiction % of Housing Built 1939 or Earlier % of housing is mobile home Green Ridge 15.3% 2.2% Houstonia 35.6% 19.5% Hughesville 14.3% 19% La Monte 4.7% 4.7% Sedalia 27.7% 1.1% Problem Statement Tornadoes are the most violent of all atmospheric storms and are capable of tremendous destruction. Wind speeds can exceed 250 miles per hour and damage paths can be more than one mile wide and 50 miles long. Significant tornado events in Pettis County have resulted in two deaths, 28 injuries, and $7,345,000 in property damage over the last 24 years. Information in the 2013 State Plan indicates that Pettis County has a low vulnerability to tornados based on frequency of occurrence and previous damages. The risk of property damage, injury, and death in the county can be mitigated by Constructing FEMA saferooms in facilities that house vulnerable populations such as nursing homes government buildings, and schools. Additionally, identifying safe refuge areas in public buildings, nursing homes, and other facilities that house vulnerable populations that do not have a safe room will lower the vulnerability. Retrofitting school district facilities with protective filming of windows and installation of blast proof doors will provide more protection for students and staff at school facilities. Additional warnings and alerts will also provide the public and schools more time to take cover during tornado. Cities can adopt or update and enforce IBC 2012 building codes that include construction techniques such as roof tie down straps to mitigate damage to future development. 3.59
119 3.4.5 Thunderstorm/High Winds/Lightning/Hail Hazard Profile Hazard Description Thunderstorms A thunderstorm is defined as a storm that contains lightning and thunder which is caused by unstable atmospheric conditions. When cold upper air sinks and warm moist air rises, storm clouds or thunderheads develop resulting in thunderstorms. This can occur singularly, as well as in clusters or lines. The National Weather Service defines a thunderstorm as severe if it includes hail that is one inch or more, or wind gusts that are at 58 miles per hour or higher. At any given moment across the world, there are about 1,800 thunderstorms occurring. Severe thunderstorms most often occur in Missouri in the spring and summer, during the afternoon and evenings, but can occur at any time. Other hazards associated with thunderstorms are heavy rains resulting in flooding (discussed separately in Section 3.4.1) and tornadoes (discussed separately in Section 3.4.4). High Winds A severe thunderstorm can produce winds causing as much damage as a weak tornado. The damaging winds of thunderstorms include downbursts, microbursts, and straight-line winds. Downbursts are localized currents of air blasting down from a thunderstorm, which induce an outward burst of damaging wind on or near the ground. Microbursts are minimized downbursts covering an area of less than 2.5 miles across. They include a strong wind shear (a rapid change in the direction of wind over a short distance) near the surface. Microbursts may or may not include precipitation and can produce winds at speeds of more than 150 miles per hour. Damaging straightline winds are high winds across a wide area that can reach speeds of 140 miles per hour. Lightning All thunderstorms produce lightning which can strike outside of the area where it is raining and is has been known to fall more than 10 miles away from the rainfall area. Thunder is simply the sound that lightning makes. Lightning is a huge discharge of electricity that shoots through the air causing vibrations and creating the sound of thunder. Hail According to the National Oceanic and Atmospheric Administration (NOAA), hail is precipitation that is formed when thunderstorm updrafts carry raindrops upward into extremely cold atmosphere causing them to freeze. The raindrops form into small frozen droplets. They continue to grow as they come into contact with super-cooled water which will freeze on contact with the frozen rain droplet. This frozen droplet can continue to grow and form hail. As long as the updraft forces can support or suspend the weight of the hailstone, hail can continue to grow before it hits the earth. 3.60

120 At the time when the updraft can no longer support the hailstone, it will fall down to the earth. For example, a ¼ diameter or pea sized hail requires updrafts of 24 miles per hour, while a 2 ¾ diameter or baseball sized hail requires an updraft of 81 miles per hour. According to the NOAA, the largest hailstone in diameter recorded in the United States was found in Vivian, South Dakota on July 23, It was eight inches in diameter, almost the size of a soccer ball. Soccer-ball-sized hail is the exception, but even small pea-sized hail can do damage. Geographic Location Thunderstorms/high winds/hail/lightning events are an area-wide hazard that can happen anywhere in the county. Although these events occur similarly throughout the planning area, they are more frequently reported in more urbanized areas. In addition, damages are more likely to occur in more densely developed urban areas, such as Sedalia. Figure 3.18 shows lightning frequency in the state, Pettis County spans multiple flash-density zones and could see from 4-8 flashes. Figure 3.18 Source: National Weather Service,

121 Figure 3.19 shows wind zones in the United States. Figure 3.19 Source: FEMA 320, Taking Shelter from the Storm, 3rd edition, Severity/Magnitude/Extent Severe thunderstorm losses are usually attributed to the associated hazards of hail, downburst winds, lightning and heavy rains. Losses due to hail and high wind are typically insured losses that are localized and do not result in presidential disaster declarations. However, in some cases, impacts are severe and widespread and assistance outside state capabilities is necessary. Hail and wind also can have devastating impacts on crops. Severe thunderstorms/heavy rains that lead to flooding are discussed in the flooding hazard profile. Hailstorms cause damage to property, crops, and the environment, and can injure and even kill livestock. In the United States, hail causes more than $1 billion in damage to property and crops each year. Even relatively small hail can shred plants to ribbons in a matter of minutes. Vehicles, roofs of buildings and homes, and landscaping are also commonly damaged by hail. Hail has been known to cause injury to humans, occasionally fatal injury. 3.62
122 In general, assets in the County vulnerable to thunderstorms with lightning, high winds, and hail include people, crops, vehicles, and built structures. Although this hazard results in high annual losses, private property insurance and crop insurance usually cover the majority of losses. Considering insurance coverage as a recovery capability, the overall impact on jurisdictions is reduced. Most lightning damages occur to electronic equipment located inside buildings. But structural damage can also occur when a lightning strike causes a building fire. In addition, lightning strikes can cause damages to crops if fields or forested lands are set on fire. Communications equipment and warning transmitters and receivers can also be knocked out by lightning strikes. Based on information provided by the Tornado and Storm Research Organization (TORRO), Table 3.32 below describes typical damage impacts of the various sizes of hail. Table 3.32 Hailstorm Intensity Scale Tornado & Strom Research Organization Hailstorm Intensity Scale Intensity Category Diameter (mm) Diameter (inches) Size Description Typical Damage Impacts Hard Hail Pea damage Potentially Damaging Mothball Slight general damage to plants/crops Severe Walnut Severe Squash ball Destructive Golf ball Destructive Hen's egg Severe damage to fruit and crops, damage to glass and plastic structures, paint and wood scored Widespread glass damage, vehicle bodywork damage Wholesale destruction of glass, damage to tiled roofs, significant risk of injuries Bodywork of grounded aircraft dented, brick walls pitted Destructive Tennis ball Severe roof damage, risk of serious injuries Destructive Softball Severe damage to aircraft bodywork Super Hailstorm Grapefruit Super Hailstorm > Melon Extensive structural damage. Risk of severe or even fatal injuries to persons caught in the open Extensive structural damage. Risk of severe or even fatal injuries to persons caught in the open Source: Tornado and Storm Research Organization (TORRO), Department of Geography, Oxford Brookes University tes: In addition to hail diameter, factors including number and density of hailstones, hail fall speed and surface wind speeds affect severity
123 Straight-line winds are defined as any thunderstorm wind that is not associated with rotation (i.e., is not a tornado). It is these winds, which can exceed 100 miles per hour, which represent the most common type of severe weather. They are responsible for most wind damage related to thunderstorms. Since thunderstorms do not have narrow tracks like tornadoes, the associated wind damage can be extensive and affect entire (and multiple) counties. Objects like trees, barns, outbuildings, high-profile vehicles, and power lines/poles can be toppled or destroyed, and roofs, windows, and homes can be damaged as wind speeds increase. The tables below (Tables 3.33 through Table 3.35) summarize past crop damages as indicated by crop insurance claims between the years of 2007 and The tables illustrate the magnitude of the impact on the planning area s agricultural economy. There were no recorder crop insurance claims caused by lightning in the same time period. Table 3.33 Crop Insurance Claims Paid in Pettis County for Thunderstorms, Crop Year Crop Name Cause of Loss Description Insurance Paid 2016 Wheat/Corn/Soybean/Sorghum Excess Moisture /Precip. /Rain $239, Wheat/Corn/Soybean/Sorghum Excess Moisture /Precip. /Rain $9,247, Wheat/Corn/Soybean/Sorghum Excess Moisture /Precip. /Rain $70, Wheat/Corn/Soybean/Sorghum Excess Moisture /Precip. /Rain $357, Corn/Soybeans Excess Moisture /Precip. /Rain $210, Wheat/Corn/Soybean/Sorghum Excess Moisture /Precip. /Rain $345, Wheat/Corn/Soybean/Sorghum Excess Moisture /Precip. /Rain $1,629, Wheat/Corn/Soybean/Sorghum Excess Moisture /Precip. /Rain $1,518, Wheat/Corn/Soybean/Sorghum Excess Moisture /Precip. /Rain $2,167, Corn/Soybeans/Wheat Excess Moisture /Precip. /Rain $68, Total - - $15,855, Source: USDA Risk Management Agency, Insurance Claims, Table 3.34 Crop Insurance Claims Paid in Pettis County form High Winds, Crop Year Crop Name Cause of Loss Description Insurance Paid 2015 Soybeans Wind/Excess Wind $7, Corn Wind/Excess Wind $84, Corn Wind/Excess Wind $1, Total - - $93, Source: USDA Risk Management Agency, Insurance Claims,
124 Table 3.35 Crop Insurance Claims Paid in Pettis County for Hail, Crop Year Crop Name Cause of Loss Description Insurance Paid 2016 Wheat/Soybeans Hail $6, Corn/Soybeans Hail $90, Soybeans/Wheat Hail $161, Wheat Hail $22, Corn/Wheat/Soybeans Hail $32, Corn Hail $22, Corn Hail $20, Wheat Hail $33, Soybeans Hail $3, Total - - $394, USDA Risk Management Agency, Insurance Claims, The onset of thunderstorms with lightning, high wind, and hail is generally rapid. Duration is less than six hours and warning time is generally six to twelve hours. Nationwide, lightning kills 75 to 100 people each year. Lightning strikes can also start structural and wildland fires, as well as damage electrical systems and equipment. Previous Occurrences Table 3.36 NCEI Reported Events with $3000 or more in Damages from Thunderstorm Winds, 7/1997-7/2017 Location Date Magnitude Deaths Injuries Property Damage Crop Damage Sedalia 8/18/ kts. EG 0 0 $3,000 0 Sedalia 6/18/ kts. E 0 0 $20,000 0 Sedalia 7/3/ kts. EG 0 0 $10,000 0 Sedalia 7/5/ kts. EG 0 0 $30,000 0 Sedalia 6/25/ kts. EG 0 0 $10,000 $10,000 Longwood 5/26/ kts EG 0 0 $10,000 $5,000 Houstonia 2/25/ $5,000 0 Dresden 2/25/ $5,000 La Monte 11/22/ kts EG 0 0 $100,000 0 Source:
125 Table 3.37 NCEI Reported Events with Damages from Hail, 7/1997-7/2017 Location Date Magnitude Deaths Injuries Property Damage Crop Damage Sedalia 3/16/ in. 0 0 $2,000,000 0 Source: Table 3.38 NCEI Reported Events with Damages from Lightning, 7/1997-7/2017 Location Date Magnitude Deaths Injuries Property Damage Crop Damage Sedalia 5/8/ $30,000 0 Green Ridge 5/8/ $10,000 0 Source: Limitations to the use of NCEI reported lightning events include the fact that only lightning events that result in fatality, injury and/or property and crop damage are in the NCDC. Damages have been reported in Pettis County for high wind events per the NCEI database, for the years ranging from 1997 through Probability of Future Occurrence The probability for lightning events cannot be determined due to the lack of data and incidents available through the NCEI. There have been 56 thunderstorm events, over a 20-year period, reported to the NCEI from 7/1997 7/ This averages out to 2.8 events in any given year for a 100% probability of occurrence. There have been 66 hail events reported to the NCEI over a 20-year period, averaging 3.3 events per year for a 100% probability of occurrence. There have been ten occurrences, events, of high winds in Pettis county over the 20- year period, this gives a 50% chance of occurrence of an event any given year. Figure 3.20 is based on hailstorm data from It shows the probability of hailstorm occurrence (1 diameter or larger) based on number of reports per year. Pettis County is in the 3 to 6 and the 6 to 8 zone. 3.66

126 Figure 3.20 Vulnerability Vulnerability Overview Thunderstorms, high wind, hail, and lightning pose varying risk for jurisdictions in Pettis County. Downbursts resulting from thunderstorms can be just as damaging as an EF-1 tornado. Thunderstorms and high winds have resulted in 3 injuries in Pettis County and have produced $488,250 in property damage along with $20,000 in crop damage. Poorly built structures, barns, outbuildings are more vulnerable to the impact of high winds during thunderstorms. Both high winds and hail can damage roofs. Hail can also damage crops and dent cars and trucks. Total hail damage recorded in the NCEI database for Pettis County from is $2,000,000 for one event in Lightning can cause wildfires and structural fires, damage electrical utilities causing power outages, and sometimes fatalities. Pettis County has seen three lighting events cause property damage to the amount of $40,
127 Potential Losses to Existing Development The average annual loss determined from historical losses for thunderstorms, high wind, hail and lightning are indicators of the potential losses to existing development. High wind events in the County have damaged critical facilities, schools, local governments, and private property. Potential annual losses throughout the county are: thunderstorm - $19,300 hail - $111,111, high winds -$3,361 and lightning -< $2, Previous and Future Development Growth in Pettis County is occurring at a slow rate, with Sedalia currently seeing the most growth in terms of population and housing built. Additional development in these areas results in the exposure of more households and businesses vulnerable to damages from high winds, hail, and lightning. Hazard Summary by Jurisdiction Although thunderstorms/high winds/lightning/hail events are area-wide, demographics of jurisdictions with high percentages of housing built before 1939 are susceptible. Jurisdiction % of Housing Built 1939 or Earlier Green Ridge 15.3% Houstonia 35.6% Hughesville 14.3% La Monte 4.7% Sedalia 27.7% Problem Statement Poorly built structures, barns, and outbuildings are more vulnerable to the impact of high winds during thunderstorms. High winds can topple utility poles and lead to power outages. Both high winds and hail can damage roofs. Hail can also damage crops and dent cars and trucks. People are also at risk to injury and death during high wind events. Crop insurance mitigates the risk to farmers and the agriculture sector within the county. Lightning events have caused structural fires and can strike electrical utilities leading to power outages. The risk of property damage, injury, and death in the county can be mitigated by identifying safe refuge areas in public buildings, nursing homes and other facilities that house vulnerable populations that do not have a safe room. Retrofitting school district facilities with protective filming of windows and installation of blast proof doors will provide more protection for students and staff at school facilities. Additional warnings and alerts will also provide the public and schools more time to take cover during high wind events. Education and hazard awareness programs in public schools would also increase public safety in the event of severe thunderstorm events. 3.68
128 3.4.6 Winter Weather/Snow/Ice/Severe Cold Hazard Profile Hazard Description A major winter storm can last for several days and be accompanied by high winds, freezing rain or sleet, heavy snowfall, and cold temperatures. The National Weather Service describes different types of winter storm events as follows. Blizzard Winds of 35 miles per hour or more with snow and blowing snow reducing visibility to less than ¼ mile for at least three hours. Blowing Snow Wind-driven snow that reduces visibility. Blowing snow may be falling snow and/or snow on the ground picked up by the wind. Snow Squalls Brief, intense snow showers accompanied by strong, gusty winds. Accumulation may be significant. Snow Showers Snow falling at varying intensities for brief periods of time. Some accumulation is possible. Freezing Rain Measurable rain that falls onto a surface with a temperature below freezing. This causes it to freeze to surfaces, such as trees, cars, and roads, forming a coating or glaze of ice. Most freezing-rain events are short lived and occur near sunrise between the months of December and March. Sleet Rain drops that freeze into ice pellets before reaching the ground. Sleet usually bounces when hitting a surface and does not stick to objects. Geographic Location The entire county is vulnerable to heavy snow, ice, extreme cold temperatures, and freezing rain. Figure 3.21 depicts the average number of hours per year with freezing rain. Pettis County is in a zone that can expect 9 12 hours of freezing rain per year. 3.69

129 Figure 3.21 Average Number of Days with Freezing Rain Source: Severity/Magnitude/Extent Severe winter storms include extreme cold, heavy snowfall, ice, and strong winds which can push the wind chill well below zero degrees in the planning area. Heavy snow can bring a community to a standstill by inhibiting transportation (in whiteout conditions), weighing down utility lines, and by causing structural collapse in buildings not designed to withstand the weight of the snow. Repair and snow removal costs can be significant. Ice buildup can collapse utility lines and communication towers, as well as make transportation difficult and hazardous. Ice can also become a problem on roadways if the air temperature is high enough that precipitation falls as freezing rain rather than snow. Extreme cold often accompanies severe winter storms and can lead to hypothermia and frostbite in people without adequate clothing protection. Cold can cause fuel to congeal in storage tanks and supply lines, stopping electric generators. Cold temperatures can also overpower a building s heating system and cause water and sewer pipes to freeze and rupture. Extreme cold also increases the likelihood for ice jams on flat rivers or streams. When combined with high winds from winter storms, extreme cold becomes extreme wind chill, which is hazardous to health and safety. The National Institute on Aging estimates that more than 2.5 million Americans are elderly and especially vulnerable to hypothermia, with the isolated elders being most at risk. About 10 percent of people over the age of 65 have some kind of bodily temperature-regulating defect, and 3-4 percent of all hospital patients over 65 are hypothermic. 3.70
130 Also at risk are those without shelter, those who are stranded, or who live in a home that is poorly insulated or without heat. Other impacts of extreme cold include asphyxiation (unconsciousness or death from a lack of oxygen) from toxic fumes from emergency heaters; household fires, which can be caused by fireplaces and emergency heaters; and frozen/burst pipes. Buildings with overhanging tree limbs are more vulnerable to damage during winter storms when limbs fall. Businesses experience loss of income as a result of closure during power outages. In general heavy winter storms increase wear and tear on roadways though the cost of such damages is difficult to determine. Businesses can experience loss of income as a result of closure during winter storms. Overhead power lines and infrastructure are also vulnerable to damages from winter storms. In particular ice accumulation during winter storm events damage to power lines due to the ice weight on the lines and equipment. Damages also occur to lines and equipment from falling trees and tree limbs weighted down by ice. Potential losses could include cost of repair or replacement of damaged facilities, and lost economic opportunities for businesses. Secondary effects from loss of power could include burst water pipes in homes without electricity during winter storms. Public safety hazards include risk of electrocution from downed power lines. Specific amounts of estimated losses are not available due to the complexity and multiple variables associated with this hazard. Standard values for loss of service for utilities reported in FEMA s 2009 BCA Reference Guide, the economic impact as a result of loss of power is $126 per person per day of lost service. Wind can greatly amplify the impact of cold ambient air temperatures. Provided by the National Weather Service, Figure 3.22 below shows the relationship of wind speed to apparent temperature and typical time periods for the onset of frostbite. 3.71

131 Figure 3.22 Winter storms, cold, frost and freeze take a toll on crop production in the planning area. Table 3.39 showing the USDA s Risk Management Agency payments for insured crop losses in the planning area as a result of cold conditions and snow from 2007 to Table 3.39 Crop Insurance Claims Paid in Pettis County as a Result of Cold Conditions and Snow Crop Year Crop Name Cause of Loss Description Insurance Paid 2016 Wheat Cold Wet Weather/Cold Winter/Freeze $9, Wheat/Corn/Soybeans Cold Wet Weather/Cold Winter $79, Wheat/Corn/Soybeans Cold Wet Weather/Cold Winter/Freeze $221, Wheat/Corn/Soybeans Cold Wet Weather/Cold Winter $156, Corn Cold Wet Weather/Cold Winter $6, Wheat/Corn/Soybeans/Sorghum Cold Wet Weather/Cold Winter/Freeze $507, Wheat/Corn/Soybeans Cold Wet Weather/Cold Winter/Freeze $318, Wheat/Corn/Soybeans/Sorghum Cold Wet Weather $199, Wheat/Corn Cold Wet Weather/Cold Winter/Freeze $35, Wheat/Corn/Soybeans Cold Wet Weather/Cold Winter/Freeze $197, Total $1,731, Source: USDA Risk Management Agency,
132 Previous Occurrences Table 3.40 NCEI Pettis County Winter Weather Events Summary, Type of Event Number of Occurrences # of Deaths # of Injuries Property Damage Crop Damage Blizzard Cold/Wind Chill Extreme Cold/Wind Frost/Freeze Heavy Snow Ice Storm $105,000 0 Winter Storm $8,000 0 Winter Weather Total $113,000 0 Source: NCEI, data accessed 11/2/2017 Table 3.41 table Winter Storm Events In Pettis County Event Date Narrative Blizzard 2/1/2011 Blizzard conditions were observed across the county, with frequent wind gusts up to 45 mph, visibilities less than 1/4 of a mile, and heavy snow of up to 21.3 inches, measured in Sedalia. Travel was nearly impossible, with the blowing and drifting snow, and the very low visibilities. Cold/Wind Chill 1/6/2014 A polar plunge of arctic air slammed into Kansas, bringing wind chill values to around 30 degrees below zero for the morning of January 6. Heavy Snow 2/4-5/2014 A major winter storm trekked through Kansas and Missouri on February 4 and 5. By the time the storm finished it dropped around 6-10 of snow across the entire area. rtherly winds on the back side of this system gusted up to 30 mph and produced substantial blowing and drifting. Many areas reported drifts of 2 to 3 feet. Ice Storm 1/30/2002 A long-lived major ice and snow storm blasted much of northwest, northern and central Missouri from late Tuesday, January 29th, until Thursday, January 31st. Ice accumulations of over an inch were observed from the Kansas City metropolitan area, east and north through Moberly Missouri. At one point 409,504 total customers were without electrical power in the CWA, with some residents without power up to two weeks. For the Kansas City area, the ice storm was ranked as the worst ever. 3.73
133 Probability of Future Occurrence The probability for all of the different types of winter weather are included as one probability, since one storm generally includes multiple types of events. There were 41 severe winter weather events in Pettis County from 1997 to This equates to a 100% probability of occurrence in any given year in the planning area. Vulnerability Vulnerability Overview Severe winter storms include extreme cold, heavy snowfall, ice, and strong winds which can push the wind chill well below zero degrees in the planning area. Heavy snow can bring a community to a standstill by inhibiting transportation (in whiteout conditions), weighing down utility lines, and by causing structural collapse in buildings not designed to withstand the weight of the snow. Repair and snow removal costs can be significant. Ice buildup can collapse utility lines and communication towers, as well as make transportation difficult and hazardous. People over 65 and those living in poverty have an increased risk of hypothermia and frostbite due to extreme cold and wind chill In the 2013 State Plan, seven factors were considered in determining overall severe winter storm vulnerability as follows: housing density, likelihood of occurrence, building exposure, crop exposure, average annual property loss ratio, average annual crop insurance claims and social vulnerability. The state ranked each of these criteria using a scale from one to five, one being lowest and five being the highest, to rank each county s vulnerability to severe winter weather. Pettis County received a vulnerability rating of medium-high. Potential Losses to Existing Development During the 20 year period from 1997 to 2017, a total of three events caused $113,000 in property damage losses. This number, equally distributed over the 20 year period, puts estimated losses at $5,650 on average for annual losses countywide. Previous and Future Development Increased development and any resulting increase in population will increase exposure to damage from severe winter weather; however not much growth is expected. Future commercial development can expect functional downtime and decreased revenues during periods of severe winter weather. Road construction in the county will increase the need for snow removal and salt to keep transportation lifelines open during periods of severe winter weather. 3.74
134 Hazard Summary by Jurisdiction Severe winter weather can cause power outages and put structures at risk to fires when individuals in homes resort to fuel heaters. The risk of extreme cold deaths and frostbite varies among segments of the populations. People over 65, those living below the poverty level, and Mobile home parks or areas with high density populations have an increased vulnerability to severe winter weather. Table 3.42 Jurisdiction % of population below the Poverty Level % Population over 65 years of age % Mobile Home Housing Units Pettis County 17.3% 13.2% 5.8% City of Green Ridge 0% 13.2 % 2.9% City of Houstonia 8.4% 13% 18.7% Village of Hughesville 6.1% 24.8% 0 City of La Monte 15.4% 10.7% 31% City of Sedalia 4.1% 13.6% 0 Source: 2010 Census; American Community Survey 5 year estimates; United States Census Bureau Problem Statement Heavy snow can bring a community to a standstill by inhibiting transportation (in whiteout conditions), weighing down utility lines, and by causing structural collapse in buildings not designed to withstand the weight of the snow. Repair and snow removal costs can be significant. Ice buildup can collapse utility lines and communication towers, as well as make transportation difficult and hazardous. People over 65 and those living in poverty have an increased risk of hypothermia and frostbite due to extreme cold and wind chill. Providing heating and cooling centers in the county would be beneficial to the population as a good percentage live in poverty. These facilities, which could be advertised online or through the news, would provide individuals who are at risk refuge from periods of extreme cold. Public works departments and road districts can develop snow removal plans and maintain adequate snow removal equipment and salt to quickly open roads after periods of heavy snow and freezing rain. The County and cities can work with local electric providers to develop vegetation management programs in rights of way to minimize damages to falling tree limbs laden with ice resulting from ice storms to minimize power outages throughout the county. 3.75

135 3.4.7 Extreme Heat Hazard Profile Hazard Description Extreme temperature events, both hot and cold, can impact human health and mortality, natural ecosystems, agriculture and other economic sectors. The remainder of this section profiles extreme heat. Extreme cold events are profiled in combination with Winter Storm in Section According to information provided by FEMA, extreme heat is defined as temperatures that hover 10 degrees or more above the average high temperature for the region and last for several weeks. Ambient air temperature is one component of heat conditions, with relative humidity being the other. The relationship of these factors creates what is known as the apparent temperature. The Heat Index chart shown in Figure 3.23 uses both of these factors to produce a guide for the apparent temperature or relative intensity of heat conditions. Figure 3.23 Source: Geographic Location Extreme heat is an area-wide hazard event, and that the risk of extreme heat does not vary across the planning area. 3.76
136 Severity/Magnitude/Extent Extreme heat can cause stress to crops and animals. According to USDA Risk Management Agency, losses to insurable crops during the 10-year time period from 2007 to 2016 were $1,176, Extreme heat can also strain electricity delivery infrastructure overloaded during peak use of air conditioning during extreme heat events. Another type of infrastructure damage from extreme heat is road damage. When asphalt is exposed to prolonged extreme heat, it can cause buckling of asphalt-paved roads, driveways, and parking lots. From , there were 3,496 fatalities in the U.S. attributed to summer heat. This translates to an annual national average of 146 deaths. During the same period, 0 deaths were recorded in the planning area, according to NCEI data. The National Weather Service stated that among natural hazards, no other natural disaster not lightning, hurricanes, tornadoes, floods, or earthquakes causes more deaths. Those at greatest risk for heat-related illness include infants and children up to five years of age, people 65 years of age and older, people who are overweight, and people who are ill or on certain medications. However, even young and healthy individuals are susceptible if they participate in strenuous physical activities during hot weather. In agricultural areas, the exposure of farm workers, as well as livestock, to extreme temperatures is a major concern. Table 3.43 lists typical symptoms and health impacts due to exposure to extreme heat. Table 3.43 Heat Index Typical Health Impacts of Extreme Heat Disorder 80-90⁰ F Fatigue possible with prolonged exposure and/or physical activity ⁰ F ⁰ F Sunstroke, heat cramps, and heat exhaustion possible with prolonged exposure and/or physical activity Heatstroke/sunstroke highly likely with continued exposure Source: National Weather Service Heat Index Program, The National Weather Service has an alert system in place (advisories or warnings) when the Heat Index is expected to have a significant impact on public safety. The expected severity of the heat determines whether advisories or warnings are issued. A common guideline for issuing excessive heat alerts is when for two or more consecutive days: (1) when the maximum daytime Heat Index is expected to equal or exceed 105 degrees Fahrenheit ( F); and the night time minimum Heat Index is 80 F or above. A heat advisory is issued when temperatures reach 105 degrees and a warning is issued at 115 degrees. Previous Occurrences Table 3.44 Extreme Heat Occurrence between Date Event Type Deaths Injuries Property Damage Crop Damage 8/6/2007 Excessive Heat /18/2012 Excessive Heat Source:

137 Figure 3.24 Source: Figure 3.24 shows Pettis County as having 4-7 heat related deaths from 2000 to To be considered heat related, heat only had to be a contributing factor to the cause of death and not the main or only cause. Table 3.44 shows data that pertains only to the two excessive heat events that the NCEI reported and during those events there were no fatalities directly caused by the excessive heat. 3.78
138 Probability of Future Occurrence If a 20-year period is used, the probability that an extreme heat event will occur in Pettis County in any given year is 10%, or once every 10 years. Data limitations can indicate that extreme heat events could be underreported in the NCEI. Vulnerability Vulnerability Overview High humidity, which often accompanies heat in Missouri, can make the effects of heat even more harmful. While heat-related illness and death can occur from exposure to intense heat in just one afternoon, heat stress on the body has a cumulative effect. Consequently, the persistence of a heat wave increases the threat to public health. The people most at risk are children under five years of age and adults over the age of 65 as well as people who work outdoors. The agriculture sector can also suffer crop loss during periods of extreme heat. Extreme heat may also cause buckling of roads. Potential Losses to Existing Development Based on information in the 2013 Plan and DHSS, four to seven heat related deaths may occur within Pettis County over the next 13 years. Impact of Future Development Population growth can result in increases in the age-groups that are most vulnerable to extreme heat. Population growth also increases the strain on electricity infrastructure, as more electricity is needed to accommodate the growing population. Hazard Summary by Jurisdiction Those at greatest risk for heat-related illness and deaths include children up to five years of age, people 65 years of age and older, people who are overweight, and people who are ill or on certain medications. To determine jurisdictions within the planning area with populations more vulnerable to extreme heat, demographic data was obtained from the 2010 Census on population percentages in each jurisdiction comprised of those under age 5 and over age 65. Data was not available for overweight individuals and those on medications vulnerable to extreme heat. Table 3.45 below summarizes vulnerable populations in the participating jurisdictions. te that school and special districts are not included in the table because students and those working for the special districts are not customarily in these age groups. 3.79
139 Table 3.45 County Population Under Age 5 and Over Age 65, 2010 Census Data Jurisdiction Population Under 5 yrs. Under 5 yrs. % Population 65 yrs. or more 65+ % Pettis County 3, % 6, % Green Ridge % % Houstonia % % Hughesville % % La Monte % % Sedalia 1, % 3, % Source: U.S. Census Bureau, includes entire population of each city or county All Schools in the planning area have proper air-conditioning and follow proper procedures in the event of extreme heat. Problem Statement Older and younger segments of the population are more vulnerable to the impact of extreme heat. In addition people living below the poverty level may be more vulnerable during periods of extreme heat due to a lack of air conditioning or utilities in their homes. Institutionalized populations, such as those living in nursing homes, become more vulnerable to extreme heat due to power outages. To help reduce the risk of death, heating and cooling centers should be promoted and known to the public, especially to those who have young children or are over the age of 65. Collaborating with local community organizations to continue to donate fans and offer weatherization programs would mitigate the impact on vulnerable populations in the county. 3.80
140 3.4.8 Earthquakes Hazard Profile Hazard Description An earthquake is a sudden motion or trembling that is caused by a release of energy accumulated within or along the edge of the earth s tectonic plates. Earthquakes occur primarily along fault zones and tears in the earth's crust. Along these faults and tears in the crust, stresses can build until one side of the fault slips, generating compressive and shear energy that produces the shaking and damage to the built environment. Heaviest damage generally occurs nearest the earthquake epicenter, which is that point on the earth's surface directly above the point of fault movement. The composition of geologic materials between these points is a major factor in transmitting the energy to buildings and other structures on the earth's surface. Geographic Location The greatest hazard to Pettis County comes from the New Madrid Seismic Zone situated in southeast Missouri. The potential of high magnitude earthquakes occurring along the New Madrid fault presents risk that does not vary across the planning area. The Nemaha uplift in central Kansas is also prone to seismic activity; however, the center of the Humbolt fault zone near the Nemaha Uplift only produces lower magnitude seismic events do to its distance from Pettis County Missouri. Figure 3.25, next page, shows the highest projected Modified Mercalli intensities by county from a potential magnitude 7.6 earthquake whose epicenter could be anywhere along the length of the New Madrid Seismic Zone. The secondary maps in Figure 3.25 show the same regional intensities for 6.7 and 8.6 earthquakes, respectively 3.81

141 Figure 3.25 New Madrid Earthquake Impact Zones Source: State-Hazard-Analysis/Annex_F_Earthquakes.pdf 3.82

142 3.83
 the Richter Magnitude Scale is a")
143 Figure 3.26 illustrates seismicity in the United States. Figure 3.26 US Seismic Map Source: United States Geological Survey Severity/Magnitude/Extent The extent or severity of earthquakes is generally measured in two ways: 1) the Richter Magnitude Scale is a measure of earthquake magnitude; and 2) the Modified Mercalli Intensity Scale is a measure of earthquake severity. The two scales are defined a follows. Richter Magnitude Scale The Richter Magnitude Scale was developed in 1935 as a device to compare the size of earthquakes. The magnitude of an earthquake is measured using a logarithm of the maximum extent of waves recorded by seismographs. Adjustments are made to reflect the variation in the distance between the various seismographs and the epicenter of the earthquakes. On the Richter scale, magnitude is expressed in whole numbers and decimal fractions. For example, comparing a 5.3 and a 6.3 earthquake shows that the 6.3 quake is ten times bigger in magnitude. Each whole number increase in magnitude represents a tenfold increase in measured amplitude because of the logarithm. Each whole number step in the magnitude scale represents a release of approximately 31 times more energy. 3.84
144 Modified Mercalli Intensity Scale The intensity of an earthquake is measured by the effect of the earthquake on the earth's surface. The intensity scale is based on the responses to the quake, such as people awakening, movement of furniture, damage to chimneys, etc. The intensity scale currently used in the United States is the Modified Mercalli (MM) Intensity Scale. It was developed in 1931 and is composed of 12 increasing levels of intensity. They range from imperceptible shaking to catastrophic destruction, and each of the twelve levels is denoted by a Roman numeral. The scale does not have a mathematical basis, but is based on observed effects. Its use gives the laymen a more meaningful idea of the severity. Previous Occurrences There is no Historical record of an earthquake occurrence in Pettis County. Probability of Future Occurrence Without a historical record of earthquakes in Pettis County it is not possible to calculate a precise probability of earthquake occurrences. According to the United States Geological Survey, Pettis County s probability of receiving an earthquake of 5.0 or higher is at 0%. Figure
145 3.86
146 Vulnerability Vulnerability Overview Ground shaking is the most damaging effect from earthquakes. Ground shaking will impact all structures and critical infrastructure such as roads and electrical transmission systems. The greatest earthquake risk to Pettis County is the New Madrid fault in the boot-heel region of Missouri. A 7.6 magnitude earthquake would result in poorly built buildings damaged slightly; considerable quantities of dishes, glassware and windows are broken; people having trouble walking; pictures falling off walls; objects falling from shelves; plaster in walls cracking; and furniture overturned. Damage to structures will occur but will vary on the quality of construction. In addition, some underground utilities may be damaged. Some injuries may occur but fatalities are unlikely. Potential Losses to Existing Development Table 3.46 Pettis County Building Count (HAZUS-MH 2.1) Residential Commercial Industrial Agriculture Religion Government Education Total 5, ,567 Table 3.47 Estimated Values for the Key Occupancies (Uses) for Pettis County* 3.87
147 Residential Commercial Industrial Agriculture Religion Government Education Total $3,115,585 $603,582 $202,010 $36,209 $52,855 $35,819 $265,143 $4,311,203 * Amounts in thousands of dollars Table 3.48 HAZUS-MH Earthquake Loss Estimation: 2% Probability of Exceedance in 50 Years Scenario Structural Damage n-structural Damage Contents Damage /Inventory Loss Loss Ratio (%) Income Loss Total Loss to Buildings $14,737,000 $43,231,000 $15,727, $19,734,000 $93,429,000 Impact of Future Development Future development is not expected to increase the risk other than contributing to the overall exposure of what could become damaged as a result of an event. Problem Statement Based on likely damage from a 7.6 magnitude earthquake along the New Madrid fault, older poorly built structures will suffer slight damage. Potential damages to future development can be mitigated by adopting and enforcing at least IBC 2012 building codes. Updating and enforcing building codes throughout Pettis County would mitigate the impact on future development from an earthquake event. 3.88
148 3.4.9 Land Subsidence/Sinkholes Hazard Profile Hazard Description Sinkholes are common where the rock below the land surface is limestone, carbonate rock, salt beds, or rocks that naturally can be dissolved by ground water circulating through them. As the rock dissolves, spaces and caverns develop underground. The sudden collapse of the land surface above them can be dramatic and range in size from broad, regional lowering of the land surface to localized collapse. However, the primary causes of most subsidence are human activities: underground mining of coal, groundwater or petroleum withdrawal, and drainage of organic soils. In addition, sinkholes can develop as a result of subsurface void spaces created over time due to the erosion of subsurface limestone (karst). Land subsidence occurs slowly and continuously over time, as a general rule. On occasion, it can occur abruptly, as in the sudden formation of sinkholes. Sinkhole formation can be aggravated by flooding. In the case of sinkholes, the rock below the surface is rock that has been dissolving by circulating groundwater. As the rock dissolves, spaces and caverns form, and ultimately the land above the spaces collapse. In Missouri, sinkhole problems are usually a result of surface materials above openings into bedrock caves eroding and collapsing into the cave opening. These collapses are called cover collapses and geologic information can be applied to predict the general regions where collapse will occur. Sinkholes range in size from several square yards to hundreds of acres and may be quite shallow or hundreds of feet deep. According to the U.S. Geological Survey (USGS), the most damage from sinkholes tends to occur in Florida, Texas, Alabama, Missouri, Kentucky, Tennessee, and Pennsylvania. Fifty-nine percent of Missouri is underlain by thick, carbonate rock that makes Missouri vulnerable to sinkholes. Sinkholes occur in Missouri on a fairly frequent basis. Most of Missouri s sinkholes occur naturally in the State s karst regions (areas with soluble bedrock). They are a common geologic hazard in southern Missouri, but also occur in the central and northeastern parts of the State. Missouri sinkholes have varied from a few feet to hundreds of acres and from less than one to more than 100 feet deep. The largest known sinkhole in Missouri encompasses about 700 acres in western Boone County southeast of where Interstate 70 crosses the Missouri River. Sinkholes can also vary is shape like shallow bowls or saucers whereas other have vertical walls. Some hold water and form natural ponds. Geographic Location Figures show the locations of known land subsidence areas. All locations occur in the rural area of Pettis County. 3.89


149 Figure 3.28 Figure

150 Figure 3.30 Severity/Magnitude/Extent Sinkholes vary in size and location, and these variances will determine the impact of the hazard. A sinkhole could result in the loss of a personal vehicle, a building collapse, or damage to infrastructure such as roads, water, or sewer lines. Groundwater contamination is also possible from a sinkhole. Because of the relationship of sinkholes to groundwater, pollutants captured or dumped in sinkholes could affect a community s groundwater system. Sinkhole collapse could be triggered by large earthquakes. Sinkholes located in floodplains can absorb floodwaters but make detailed flood hazard studies difficult to model. 3.90
151 The 2013 State Plan included only seven documented sinkhole notable events. The plan stated that sinkholes are common to Missouri and the probability is high that they will occur in the future. To date, Missouri sinkholes have historically not had major impacts on development nor have they caused serious damage. Thus, the severity of future events is likely to be low. Previous Occurrences Sinkholes are a regular occurrence in Missouri, but rarely are events of any significance. Despite the regular occurrences, there have been no major recent documented occurrences of sinkholes opened in Pettis County. Probability of Future Occurrence The probability cannot be calculated due to the lack of information regarding known sinkhole events in Pettis County. Vulnerability Vulnerability Overview Sinkholes in Missouri are a common feature where limestone and dolomite outcrop. Dolomite is a rock similar to limestone with magnesium as an additional element along with the calcium normally present in the minerals that form the rocks. While some sinkholes may be considered a slow changing nuisance; other more sudden, catastrophic collapses can destroy property, delay construction projects, contaminate ground water resources, and damage underground utilities. The entire county is underlain with limestone and dolomite bedrock. Potential Losses to Existing Development existing development is at risk of damage. Impact of Previous and Future Development Future development over abandoned mines and in areas of known risk to sinkhole formation in the planning area will increase vulnerability to this hazard. Population and development in these areas, will increase exposure to sinkhole occurrence. There are currently no regulations prohibiting construction over or near known sinkholes. Future development may also change storm runoff patterns and cause expansion or formation of sinkholes. Hazard Summary by Jurisdiction The risk of sinkhole damage for individual communities and school districts is limited to the amount of exposure of buildings and infrastructure. Some parts of the county are more at risk for potential sinkhole formations more than other areas. There are no jurisdictions with existing structures that are at risk of sinkholes. It is unlikely that school, and special districts, will be affected by sinkholes due to the localized nature of their exposure. 3.91
152 Problem Statement It is likely that more sinkholes will occur as development occurs within the county. Sinkholes can be remediated with fill material. Once a sinkhole has been remediated building should be prohibited at the site. Existing sinkholes can expand if surface runoff erodes the edges of the sinkhole. Storm water runoff should be diverted away from known sinkholes. The county and jurisdictions should adopt regulations prohibiting construction at least 30 feet from known sinkholes. Information about identifying potential sinkhole formation and promoting Missouri FAIR plan sinkhole insurance can be included in public outreach and hazard awareness programs. Undeveloped land that is in a sinkhole risk area can be used for park space or other recreational purposes. 3.92
153 Wildfire Hazard Profile Hazard Description The fire incident types for wildfires include: 1) natural vegetation fire, 2) outside rubbish fire, 3) special outside fire, and 4) cultivated vegetation, crop fire. The Forestry Division of the Missouri Department of Conservation (MDC) is responsible for protecting privately owned and state-owned forests and grasslands from wildfires. To accomplish this task, eight forestry regions have been established in Missouri for fire suppression. The Forestry Division works closely with volunteer fire departments and federal partners to assist with fire suppression activities. Currently, more than 900 rural fire departments in Missouri have mutual aid agreements with the Forestry Division to obtain assistance in wildfire protection if needed. Most of Missouri fires occur during the spring season between February and May. The length and severity of both structural and wildland fires depend largely on weather conditions. Spring in Missouri is usually characterized by low humidity, and high winds. These conditions result in higher fire danger. In addition, due to the recent lack of moisture throughout many areas of the state, conditions are likely to increase the risk of wildfires. Drought conditions can also hamper firefighting efforts, as decreasing water supplies may not prove adequate for firefighting. It is common for rural residents burn their garden spots, brush piles, and other areas in the spring. Some landowners also believe it is necessary to burn their forests in the spring to promote grass growth, kill ticks, and reduce brush. Therefore, spring months are the most dangerous for wildfires. The second most critical period of the year is fall. Depending on the weather conditions, a sizeable number of fires may occur between mid-october and late vember. Geographic Location Absent demographic information indicating otherwise, the risk of structural fire probably does not vary widely across the planning area. However, damages due to wildfires would be higher in communities with more wildland urban interface (WUI) areas. The term refers to the zone of transition between unoccupied land and human development and needs to be defined in the plan. Within the WUI, there are two specific areas identified: 1) Interface and 2) Intermix. The interface areas are those areas that abut wildland vegetation and the Intermix areas are those areas that intermingle with wildland areas. Severity/Magnitude/Extent Wildfires damage the environment, killing some plants and occasionally animals. Firefighters have been injured or killed, and structures can be damaged or destroyed. The loss of plants can heighten the risk of soil erosion and landslides. Although Missouri wildfires are not the size and intensity of those in the Western United States, they could impact recreation and tourism in and near the fires. Wildland fires in Missouri have been mostly a result of human activity rather than lightning or some other natural event. Wildfires in Missouri are usually surface fires, burning the dead leaves on the ground or dried grasses. 3.93
154 They do sometimes torch or crown out in certain dense evergreen stands like eastern red cedar and shortleaf pine. However, Missouri does not have the extensive stands of evergreens found in the western US that fuel the large fire storms seen on television news stories. While very unusual, crown fires can and do occur in Missouri native hardwood forests during prolonged periods of drought combined with extreme heat, low relative humidity, and high wind. Tornadoes, high winds, wet snow and ice storms in recent years have placed a large amount of woody material on the forest floor that causes wildfires to burn hotter and longer. These conditions also make it more difficult for fire fighters suppress fires safely. Often wildfires in Missouri go unnoticed by the general public because the sensational fire behavior that captures the attention of television viewers is rare in the state. Yet, from the standpoint of destroying homes and other property, Missouri wildfires can be quite destructive. Previous Occurrences There NCEI storm event database shows zero occurrence of wildfire overt the past 20-year period. However, the Missouri Department of Conservation wildfire reporting data search yields 260 entries for the past 20-year period. Of the 260 entries only 10, all of which occurred in 2002, have been 50 acres or larger. Over half of these reported wildfires, 222, burned 10 acres or less. The largest wildfire reported through MDC was 700 acres. Probability of Future Occurrence The probability of future occurrence for a wildfire of any size is 100% as there have been 260 fires reported over the 20-year period. The probability of having a fire that burned 10 acres or less is 100%, fires that burn between 11 and 49 acres is also 100% as 28 such fires were reported in the past 20 years. The probability for the largest fires, those burning 50 acres or more, is significantly lower at 50%, as only 10 fires have burned 50 or more acres. Vulnerability Vulnerability Overview Wildfires occur throughout wooded and open vegetation areas of Missouri They can occur any time of the year, but mostly occur during long, dry hot spells. Any small fire, if not quickly detected and suppressed, can get out of control. Most wildfires are caused by human carelessness or negligence. However, some are precipitated by lightning strikes and in rare instances, spontaneous combustion. Structures and people in WUI areas in the county and cities are more vulnerable to the impact of wildfires due to the level of fuel mixed with structures. 3.94

155 Potential Losses to Existing Development Figure
156 Impact of Future Development It is anticipated that there will be future development in WUI areas throughout unincorporated areas of the county. Future growth in WUI areas of the county will increase the risk and exposure to wildfires. It is expected that WUI development in cities will be mitigated by development regulations reducing the risk to wildfire hazard. Hazard Summary by Jurisdiction The vulnerability across the jurisdictions for wildland fires does not vary greatly. Absent demographic factors or other variations in housing construction, risk of structural fire probably does not vary greatly across the planning area. Without mitigation measures: Life:... negligible Property:... negligible Emotional:... negligible Financial:... negligible With mitigation measures: Life:... negligible Property:... negligible Emotional:... negligible Financial:... negligible Problem Statement Wildfire events can destroy, damage, and threaten structures in hazard prone areas. The unincorporated part of the county has the highest risk and exposure to wildfires. County officials and the fire department can promote fire resistant construction materials and landscape design techniques to mitigate the risk to wildfire in future development. Information about these materials and techniques are included in the MDC publication, Living with Wildfire. Including this information in education and awareness programs for the public may potentially mitigate wildfire damage in the county. 3.96
157 Levee Failure Hazard Profile Hazard Description Levees are earth embankments constructed along rivers and coastlines to protect adjacent lands from flooding. Floodwalls are concrete structures, often components of levee systems, designed for urban areas where there is insufficient room for earthen levees. When levees and floodwalls and their appurtenant structures are stressed beyond their capabilities to withstand floods, levee failure can result in injuries and loss of life, as well as damages to property, the environment, and the economy. Levees can be small agricultural levees that protect farmland from high-frequency flooding. Levees can also be larger, designed to protect people and property in larger urban areas from less frequent flooding events such as the 100-year and 500-year flood levels. For purposes of this discussion, levee failure will refer to both overtopping and breach as defined in FEMA s Publication So You Live Behind a Levee ( Following are the FEMA publication descriptions of different kinds of levee failure. Overtopping: When a Flood Is Too Big Overtopping occurs when floodwaters exceed the height of a levee and flow over its crown. As the water passes over the top, it may erode the levee, worsening the flooding and potentially causing an opening, or breach, in the levee. Breaching: When a Levee Gives Way A levee breach occurs when part of a levee gives way, creating an opening through which floodwaters may pass. A breach may occur gradually or suddenly. The most dangerous breaches happen quickly during periods of high water. The resulting torrent can quickly swamp a large area behind the failed levee with little or no warning. Earthen levees can be damaged in several ways. For instance, strong river currents and waves can erode the surface. Debris and ice carried by floodwaters and even large objects such as boats or barges can collide with and gouge the levee. Trees growing on a levee can blow over, leaving a hole where the root wad and soil used to be. Burrowing animals can create holes that enable water to pass through a levee. If severe enough, any of these situations can lead to a zone of weakness that could cause a levee breach. In seismically active areas, earthquakes and ground shaking can cause a loss of soil strength, weakening a levee and possibly resulting in failure. Seismic activity can also cause levees to slide or slump, both of which can lead to failure. Geographic Location Missouri is a state with many levees. Currently, there is no single comprehensive inventory of levee systems in the state. Levees have been constructed across the state by public entities and private entities with varying levels of protection, inspection oversight, and maintenance. The lack of a comprehensive levee inventory is not unique to Missouri. There are two concurrent nation-wide levee inventory development efforts, one led by the United State Army Corps of Engineers (USACE) and one led by Federal Emergency Management Agency (FEMA). The National Levee 3.97
158 Database (NLD), developed by USACE, captures all USACE related levee projects, regardless of design levels of protection. The Midterm Levee Inventory (MLI), developed by FEMA, captures all levee data (USACE and non- USACE) but primarily focuses on levees that provide 1% annual-chance flood protection on FEMA Flood Insurance Rate Maps (FIRMs). Severity/Magnitude/Extent Levy failure is typically an additional or secondary impact of another disaster such as flooding or earthquake. The main difference between levee failure and losses associated with riverine flooding is magnitude. Levy failure often occurs during a flood event, causing destruction in addition to what would have been caused by flooding alone. In addition, there would be an increased potential for loss of life due to the speed of onset and greater depth, extent, and velocity of flooding due to levee breach. Agricultural levees and levees that are not designed to provide flood protection from at least the 1- percent annual chance flood likely do exist in the planning area. However, none of these levees are shown on the Preliminary DFIRM, nor are they enrolled in the USACE Levee Safety Program. As a result, an inventory of these types of levees is not available for analysis. Additionally, since these types of levees do not provide protection from the 1-percent annual chance flood, losses associated with overtopping or failure are captured in the Flood Section of this plan. The USACE regularly inspects levees within its Levee Safety Program to monitor their overall condition, identify deficiencies, verify that maintenance is taking place, determine eligibility for federal rehabilitation assistance (in accordance with P.L ), and provide information about the levees on which the public relies. Inspection information also contributes to effective risk assessments and supports levee accreditation decisions for the National Flood Insurance Program administered by the Federal Emergency Management Agency (FEMA). The USACE now conducts two types of levee inspections. Routine Inspection is a visual inspection to verify and rate levee system operation and maintenance. It is typically conducted each year for all levees in the USACE Levee Safety Program. Periodic Inspection is a comprehensive inspection led by a professional engineer and conducted by a USACE multidisciplinary team that includes the levee sponsor. The USACE typically conducts this inspection every five years on the federally authorized levees in the USACE Levee Safety Program. Both Routine and Periodic Inspections result in a rating for operation and maintenance. Each levee segment receives an overall segment inspection rating of Acceptable, Minimally Acceptable, or Unacceptable. Levee System Inspection Ratings Acceptable -- All inspection items are rated as Acceptable. Minimally Acceptable -- One or more levee segment inspection items are rated as Minimally Acceptable or one or more items are rated as Unacceptable and an engineering determination concludes that the Unacceptable inspection items would not prevent the segment/system from performing as intended during the next flood event. Unacceptable -- One or more levee segment inspection items are rated as Unacceptable and would prevent the segment/system from performing as intended, or a serious deficiency noted in past inspections (previous Unacceptable items in a Minimally Acceptable overall rating) has not been corrected within the established timeframe, not to exceed two years. 3.98
159 There are no levees within the planning area according to the National Levee Database (NLD). Previous Occurrences With no levees in the panning area, no levee breaches or incidents in the planning area are listed in the 2010 and 2013 State Plan. Probability of Future Occurrence Probabilities cannot be calculated due to the lack of data regarding levee failure in the Pettis County planning area. Vulnerability Vulnerability Overview It is not possible to conduct a comprehensive GIS-based analysis of state-owned facilities to determine those that may be in areas protected by levees. The US Army Corps of Engineers is in the process of compiling a levee inventory which will include GIS data of levee protected areas. As this inventory becomes more complete, it will enable a more comprehensive analysis of state-owned facilities that might be vulnerable to this hazard. Potential Losses to Existing Development Potential loss of existing development would be the same as flooding in section Impact of Previous and Future Development Previous and future development can be would be similar to flooding in section Hazard Summary by Jurisdiction Hazards to the jurisdictions in Pettis County are minimal since all levees in the county do not offer flood protection. Problem Statement Flooding is the most common hazard associated with levee failure, breach or overtopping. Levee failure, breach, or overtopping can result not only in loss of life, but also considerable loss of capital investment, loss of income, and property damage. Maintaining levees integrity will help prevent possible levee failures. 3.99
160 4 MITIGATION STRATEGY 4 MITIGATION STRATEGY Goals Identification & Analysis of Mitigation Actions Implementation of Mitigation Actions Action Worksheets Mitigation Strategy 44 CFR Requirement 201.6(c)(3): The plan shall include a mitigation strategy that provides the jurisdiction s blueprint for reducing the potential losses identified in the risk assessment, based on existing authorities, policies, programs and resources, and its ability to expand on and improve these existing tools. This section presents the mitigation strategy updated by the Mitigation Planning Committee (MPC) based on the updated risk assessment. The mitigation strategy was developed through a collaborative group process. The process included review of general goal statements to guide the jurisdictions in lessening disaster impacts as well as specific mitigation actions to directly reduce vulnerability to hazards and losses. The following definitions are taken from FEMA s Local Hazard Mitigation Review Guide (October 1, 2012). Mitigation Goals are general guidelines that explain what you want to achieve. Goals are longterm policy statements and global visions that support the mitigation strategy. The goals address the risk of hazards identified in the plan. Mitigation Actions are specific actions, projects, activities, or processes taken to reduce or eliminate long-term risk to people and property from hazards and their impacts. Implementing mitigation actions helps achieve the plan s mission and goals. 4.1 Goals 44 CFR Requirement 201.6(c)(3)(i): [The hazard mitigation strategy shall include a] description of mitigation goals to reduce or avoid long-term vulnerabilities to the identified hazards. This planning effort is an update to Pettis County s existing hazard mitigation plan approved by FEMA in Therefore, the goals from the 2013 Pettis County Hazard Mitigation Plan were reviewed to see if they were still valid, feasible, practical, and applicable to the defined hazard impacts. The MPC conducted a discussion session during their second meeting to review and update the plan goals. To ensure that the goals developed for this update were comprehensive and supported State goals, the current State Hazard Mitigation Plan goals were reviewed. The MPC also reviewed the goals from current surrounding county plans. Pettis County s Mitigation goals were derived from conferences with county commissioners, emergency management director, jurisdiction stakeholder, as well as the key planning documents (i.e. Emergency Operations Plan).These meetings were conducted during the development of the Pettis County Hazard Mitigation Plan. 4.1
161 Four main goals: Goal 1: Protect the lives and livelihoods of all citizens. Goal 2: Manage growth through sustainable principles and practices. Goal 3: Ensure continued operation of government and emergency functions during and after a disaster. Goal 4: Preserve and maintain property, infrastructure, business, and jurisdiction vitality. 4.2 Identification and Analysis of Mitigation Actions 44 CFR Requirement 201.6(c)(3)(ii): The mitigation strategy shall include a section that identifies and analyzes a comprehensive range of specific mitigation actions and projects being considered to reduce the effects of each hazard, with particular emphasis on new and existing buildings and infrastructure. During the third MPC meeting, the results of the risk assessment update were provided to the MPC members for review and the key issues were identified for specific hazards. Changes in risk since adoption of the previously approved plan were discussed. The second meeting concluded with the distribution of a list of possible mitigation actions to prompt discussions within and among the jurisdictions. The list included actions from the previously approved plan. Actions from the previous plan included on-going actions and actions upon which progress had not been made. The MPC discussed SEMA s identified funding priorities and the types of mitigation actions generally recognized by FEMA. The MPC determined to include problem statements in the plan update at the end of each hazard profile, which had not been done in the previously approved plan. The problem statements summarize the risk to the planning area presented by each hazard, and include possible methods to reduce that risk. Use of the problem statements allowed the MPC to recognize new and innovative strategies for mitigate risks in the planning area. The focus of Meeting number four was to update the mitigation strategy. For a comprehensive range of mitigation actions to consider, the MPC reviewed the following information during Meeting number four: A list of actions proposed in the previous mitigation plan, the current State Plan, and approved plans in surrounding counties, Key issues from the risk assessments, including the Problem Statements concluding each hazard profile and vulnerability analysis, State priorities established for Hazard Mitigation Assistance grants, and Public input during meetings, responses to Data Collection Questionnaires, and other efforts to involve the public in the plan development process. 4.2
162 For the fourth meeting, individual jurisdictions, including school and special districts, developed final mitigation strategy for submission to the MPC. They were encouraged to review the details of the risk assessment vulnerability analysis specific to their jurisdiction. They were also provided a link to the FEMA s publication, Mitigation Ideas: A Resource for Reducing Risk to Natural Hazards (January 2013). This document was developed by FEMA as a resource for identification of a 44 CFR Requirement 201.6(c)(3)(ii): The mitigation strategy shall include a section that identifies and analyzes a comprehensive range of specific mitigation actions and projects being considered to reduce the effects of each hazard, with particular emphasis on new and existing buildings and infrastructure. 4.3 range of potential mitigation actions for reducing risk to natural hazards and disasters. The MPC reviewed the actions from the previously approved plan for progress made since the plan had been adopted, using worksheets included in Appendix E of this plan. Prior to Meeting number three, the list of actions for each jurisdiction was ed to that jurisdiction s MPC representative along with the worksheets. Each jurisdiction was instructed to provide information regarding the Action Status with one of the following status choices: Completed, with a description of the progress, t Started/Continue in Plan Update, with a discussion of the reasons for lack of progress, In Progress/Continue in Plan Update, with a description of the progress made to date or Deleted, with a discussion of the reasons for deletion. Based on the status updates, there were zero completed actions, zero deleted actions, and eleven continuing actions. Table 4.1 Jurisdiction Completed Actions Deleted Actions Continuing Actions New Actions Pettis County, City of Green Ridge, City of Houstonia, Village of Hughesville, City of La Monte, City of Sedalia, Green Ridge R-VIII, Pettis County R-V, Sedalia 200, Smithton R-VI ne ne Implementation of Mitigation Actions 44 CFR Requirement 201.6(c)(3)(ii): The mitigation strategy shall include an action strategy describing how the actions identified in paragraph (c)(2)(ii) will be prioritized, implemented, and administered by the local jurisdiction. Prioritization shall include a special emphasis on the extent to which benefits are maximized according to a cost benefits review of the proposed projects and their associated costs. Jurisdictional MPC members were encouraged to meet with others in their community to finalize the actions to be submitted for the updated mitigation strategy. Throughout the MPC consideration and discussion, emphasis was placed on the importance of a benefit-cost analysis in determining project priority. 4.3
163 The Disaster Mitigation Act requires benefit-cost review as the primary method by which mitigation projects should be prioritized. The MPC decided to pursue implementation according to when and where damage occurs, available funding, political will, jurisdictional priority, and priorities identified in the Missouri State Hazard Mitigation Plan. The benefit/cost review at the planning stage primarily consisted of a qualitative analysis, and was not the detailed process required for grant funding application. For each action, the plan sets forth a narrative describing the types of benefits that could be realized from action implementation. The cost was estimated as closely as possible, with further refinement to be supplied as project development occurs. FEMA s STAPLEE methodology was used to assess the costs and benefits, overall feasibility of mitigation actions, and other issues impacting project. During the prioritization process, the MPC used worksheets to assign scores. The worksheets posed questions based on the STAPLEE elements as well as the potential mitigation effectiveness of each action. Scores were based on the responses to the questions as follows: Definitely YES = 3 points Maybe yes = 2 Probably no = 1 Definitely NO = 0 The following questions were asked for each proposed action. S: Is the action socially acceptable? T: Is the action technically feasible and potentially successful? A: Does the jurisdiction have the administrative capability to successfully implement this action? P: Is the action politically acceptable? L: Does the jurisdiction have the legal authority to implement the action? E: Is the action economically beneficial? E: Will the project have an environmental impact that is either beneficial or neutral? (score 3 if positive and 2 if neutral) Will the implemented action result in lives saved? Will the implanted action result in a reduction of disaster damage? The final scores are listed below in the analysis of each action. The worksheets are attached to this plan as Appendix E. The STAPLEE final score for each action, absent other considerations, such as a localized need for a project, determined the priority. Low priority action items were those that had a total score of between 0 and 24. Moderate priority actions were those scoring between 25 and 29. High priority actions scored 30 or above. A blank STAPLEE worksheet is shown in Figure
164 Figure 4.1 STAPLEE Worksheet, blank Action Title: Jurisdiction: Action ID: STAPLEE Criteria S: Is it Socially acceptable? T: Is it Technically feasible and potentially successful? A: Does the jurisdiction have the administrative capacity to execute this action? P: Is it Politically acceptable? Evaluation Rating Definitely YES = 3 Maybe YES = 2 Probably NO = 1 Definitely NO = 0 Score L: Is there Legal authority to implement? E: Is it Economically beneficial? E: Will the project have either a neutral or positive impact on the natural environment? (score a 3 if positive impact, 2 if neutral impact) Will historic structures be saved or protected? Could it be implemented quickly? STAPLEE Score Mitigation Effectiveness Criteria Evaluation Rating Score Will the implemented action result in lives saved? Will the implemented action result in a reduction of disaster damages? Mitigation Effectiveness Score Assign from 5-10 points based on the likelihood that lives would be saved. Assign from 5-10 points based on the relative reduction of disaster damages. Total Score (STAPLEE Score + Mitigation Effectiveness Score): Priority Level: High (30+ points) Medium (25-29 points) Low (less than 25 points) Completed by (name/title/phone #): 4.5
165 4.4 Action Worksheets Goal 1: Protect the lives and livelihoods of all citizens Name of Jurisdiction: Problem being Mitigated: Hazard(s) Addressed: Action/Project Number: Name of Action or Project: Action or Project Description: Estimated Cost: Benefits: Responsible Organization/Department: Action/Project Priority: Timeline for Completion: Potential Fund Sources: Local Planning Mechanisms to be Used in Implementation, if any: Action Status Action Worksheet Risk / Vulnerability Pettis County Insufficient warning capabilities in the unincorporated potions of Pettis County. Pettis County does own seven sirens, outside of those owned by municipalities, but potions of the planning area s population do not have enough warning for hazards. Tornado, Flood, Dam Failure, Wildfire Action or Project P1.1-Pettis County Unincorporated Pettis County warning system inventory & identification Identify areas in need of additional warning systems to serve population clusters that are not currently served. Studies vary in cost, inventory and mapping of current warning systems can range from $500 - $3,000 depending on the type of inventory being taken & participation. Reduce loss of life and livelihoods of residents in unincorporated portions of Johnson County by providing enough warning to either evacuate or seek shelter from natural hazards. Plan for Implementation Pettis County EMA Director, Pettis County Commission Progress Report High 1-2 Years Gov t programs/private funds/internal revenue Comprehensive Plan, Hazard analysis New 4.6
166 Name of Jurisdiction: Problem being Mitigated: Hazard(s) Addressed: Action/Project Number: Name of Action or Project: Action or Project Description: Estimated Cost: Benefits: Responsible Organization/Department: Action/Project Priority: Timeline for Completion: Potential Fund Sources: Action Worksheet City of La Monte Risk / Vulnerability Insufficient warning system to allow all residents warning of natural hazards. Currently there is one outdoor warning siren for tornadoes but no other warning sirens in place to alert residents who may be out of range for the sound or within a building that is insulated from sound. Tornado, Flood, Dam Failure, Wildfire Action or Project P1.1-La Monte Warning systems Identify groups and populations that do not benefit from the one outdoor warning sirens due to proximity or location. Study the effectiveness of the current system to all locations across the jurisdiction to determine effectiveness and implement additional warning systems such as cable override in areas that are underserved. Studies vary in cost, inventory and mapping of current warning systems can range from $500 - $3,000 depending on the type of inventory being taken, and participation. Lower loss of life and livelihood of the residents of La Monte from natural disasters Plan for Implementation La Monte emergency management coordinator, La Monte Mayor, La monte City Council members High 1-2 Years Gov t programs/private funds/internal revenue Local Planning Mechanisms to be Used in Implementation, if any: Action Status Progress Report New 4.7
167 Name of Jurisdiction: Problem being Mitigated: Hazard(s) Addressed: Action/Project Number: Name of Action or Project: Action or Project Description: Estimated Cost: Benefits: Responsible Organization/Department: Action/Project Priority: Timeline for Completion: Potential Fund Sources: Action Worksheet Pettis County R-V Risk / Vulnerability Insufficient warning and alert systems in school buildings. Tornado, Flood, Dam Failure, Wildfire Action or Project P1.2-PettisR5 Warning systems Acquire public address systems in school buildings to work with weather radios giving more time to take shelter from natural hazards. Kenwood Mobile VHF 6.0Watt Full Key Radio - $377/Unit; NOAA mobile weather radio $45/unit, Providing advanced warning of natural hazards that might affect school district Increasing the time students and staff can take appropriate actions to reduce loss of life and injury. Plan for Implementation Pettis County R-V School Board, Pettis County R-V Principals High 1-5 Years Gov t programs/private funds/internal revenue Local Planning Mechanisms to be Used in Implementation, if any: Action Status Progress Report School Emergency Plan New 4.8
168 Name of Jurisdiction: Problem being Mitigated: Hazard(s) Addressed: Action/Project Number: Name of Action or Project: Action or Project Description: Estimated Cost: Benefits: Responsible Organization/Department: Action/Project Priority: Timeline for Completion: Potential Fund Sources: Local Planning Mechanisms to be Used in Implementation, if any: Action Status Report of Progress Action Worksheet Pettis County Risk / Vulnerability Insufficient ordinances and programs to reduce the impacts of lash and ravine flooding throughout county. Flooding, ravine and flash Action or Project P1.3-Pettis Reduce Flooding Impact Educate property owners and County governing bodies to hazard areas, mitigation policy and deficient ordinances and measures implemented by the county. Jurisdictional Storm Water programs typically cost monthly as follows: Vacant Lot.08 /1,000 sq. ft. Light Development.12 /1,000 sq. ft., Moderate Development.16 /1,000 sq. ft., Heavy Development.24 /1,000 sq. ft., Very Heavy Development.32 /1,000 sq. ft. according to the EPA Decrease the impact flooding has on jurisdictions and their residents through ordinances and safe storm water practices. Plan for Implementation Pettis County EMA Director/Pettis County floodplain manager High Continuous Gov t programs/private funds/internal revenue Participation in NFIP, Debris Management Plan, Floodplain Ordinances, Storm Water Ordinances. Progress Report Continuing in Progress Project is ongoing. Continuous efforts for promoting environmentally sound practices for watershed and for participation in NFIP. Jurisdictions have been encouraged to identify and map flood hazard areas to allow for zoning and regulations that will limit building of structures and reduce potential loss of property and life. 4.9
169 Action Worksheet Name of Jurisdiction: Problem being Mitigated: Hazard(s) Addressed: Action/Project Number: Pettis County Risk / Vulnerability Insufficient public awareness and mitigation strategies in place in the county. Tornados, flood, winter, drought, extreme heat, earthquakes, dam and levee failure, wildfires, sinkholes Action or Project P1.4-Pettis Name of Action or Project: Public Awareness Disperse hazard area maps and community shelter area maps to the Action or Project public and combining ways to promote FEMA safety tips and mitigation Description: techniques. Increase in social media presence and from the County EMA and County emergency services during seasonal hazards. Estimated Cost: Public awareness campaign and outreach can cost an average of $9,000 for materials, time and social media ads and posting. Benefits: Reduce loss of life and livelihoods of residents in Pettis County by making the public more aware of the natural hazards they can face on any given year. Plan for Implementation Responsible Pettis County EMA Director, County emergency service department Organization/Department: Action/Project Priority: Medium Timeline for Completion: Seasonal/Annual Potential Fund Sources: Internal revenue Local Planning Mechanisms to be Used in Implementation, if any: Action Status Progress Report Community Emergency Action Plan New 4.10
170 Action Worksheet Name of Jurisdiction: Problem being Mitigated: Hazard(s) Addressed: Action/Project Number: Green Ridge R-VIII School District Risk / Vulnerability Insufficient warning of incoming hazardous event. Tornado, Flood, Winter event, Earthquake, Thunderstorm Action or Project P1.5-GreenRidgeR8 Name of Action or Project: Warning system education Provide staff, parents, students, and other community patrons Action or Project Description: information of warning systems School will provide storm shelter information, siren descriptions, and contact information to promote sign up for Nixle warning system notifications Estimated Cost: Nixel is free for residents. Advanced features require subscription from some organizations, like law enforcement agencies. Benefits: Many people will have adequate information of hazards from Nixle warning systems. District patrons will be better prepared when storms arrive to the area. Plan for Implementation Responsible Green Ridge School Superintendent, Green Ridge district Principles Organization/Department: Action/Project Priority: High Timeline for Completion: By May 2019 Potential Fund Sources: Internal revenue/government funding sources Local Planning Mechanisms to be Used in Implementation, if any: Action Status Progress Report N/A New 4.11
171 Action Worksheet Name of Jurisdiction: Problem being Mitigated: Green Ridge R-VIII Risk / Vulnerability Increased protect to commercial structures and other district assets Hazard(s) Addressed: Action/Project Number: Action or Project Wildfire P1.6-Green Ridge R8 Name of Action or Project: Action or Project Description: Estimated Cost: Benefits: Responsible Organization/Department: Action/Project Priority: Timeline for Completion: Potential Fund Sources: Local Planning Mechanisms to be Used in Implementation, if any: Action Status Report of Progress Property Protection Implement use of environmentally sound, fire resistant materials during remodels and new construction of both existing structures and planned construction of new maintenance building. Replacement Galvanized steel door $418 each, fireproof rock wall blanket building material $ /ton, ACM aluminum composite siding $15/Sq. meter, replace existing roof with either tile or metal $7/Sq. Ft. Protection of property and prevention of occurrences of damage to current and new structures. Plan for Implementation Green Ridge School Board, Principals, Superintendent Medium 1-5 Years Internal Funds, Government Funding Sources, Bonds School Emergency Plan Progress Report Ongoing, reviewed annually As budgets allow remodels and new construction projects are encouraged to utilize environmentally-sound and fire-resistant materials. 4.12
172 Action Worksheet Name of Jurisdiction: Problem being Mitigated: Hazard(s) Addressed: Action/Project Number: Name of Action or Project: Action or Project Description: Estimated Cost: Benefits: Responsible Organization/Department: Action/Project Priority: Timeline for Completion: Potential Fund Sources: Local Planning Mechanisms to be Used in Implementation, if any: Action Status Report of Progress Pettis County R-V Risk / Vulnerability Protection of district buildings, building contents, and other district assts. Wildfire Action or Project P1.6-Pettis R5 Property Protection Implement the use of environmentally-sound, fire-resistant materials when upgrades or retrofits to district buildings are required. Replacement Galvanized steel door $418 each, fireproof rock wall blanket building material $ /ton, ACM aluminum composite siding $15/Sq. meter, replace existing roof with either tile or metal $7/Sq. Ft. Protection of property and reduction of occurrences and damage from fire to existing structures. Plan for Implementation Pettis R5 School Board, Principals, Superintendent Medium 1-5 Years Internal Funds, Government Funding Sources School Emergency Plan Progress Report Ongoing As budgets allow remodels and new construction projects are evaluated to utilize environmentally-sound and fire-resistant materials compared to cost and effectiveness. 4.13
173 Action Worksheet Name of Jurisdiction: Problem being Mitigated: Smithton R-VI Risk / Vulnerability Protection to jurisdictional buildings and assets from fire. Hazard(s) Addressed: Action/Project Number: Action or Project Wildfire P1.6-SmithtonR6 Name of Action or Project: Action or Project Description: Estimated Cost: Benefits: Responsible Organization/Department: Action/Project Priority: Timeline for Completion: Potential Fund Sources: Local Planning Mechanisms to be Used in Implementation, if any: Action Status Report of Progress Property Protection Implement the use of environmentally-sound, fire-resistant materials when new construction and building upgrades are required. Replacement Galvanized steel door $418 each, fireproof rock wall blanket building material $ /ton, ACM aluminum composite siding $15/Sq. meter, replace existing roof with either tile or metal $7/Sq. Ft. Protection of property and reduction of occurrence of damage. Plan for Implementation Smithton School Board, Principals, Superintendent Medium 1-5 Years Internal Funds, Government Funding Sources School Emergency Plan Progress Report Ongoing As budgets allow remodels and new construction projects are evaluated to utilize environmentally-sound and fire-resistant materials compared to cost and effectiveness. 4.14
174 Action Worksheet Name of Jurisdiction: Problem being Mitigated: City of Sedalia Risk / Vulnerability Building vulnerability to fire and wildfire. Hazard(s) Addressed: Action/Project Number: Action or Project Wildfire P1.6-Sedalia Name of Action or Project: Action or Project Description: Estimated Cost: Benefits: Responsible Organization/Department: Action/Project Priority: Timeline for Completion: Potential Fund Sources: Property Protection Utilize environmentally-sound, fire-resistant materials during remodel and new construction planned for jurisdictional owned critical facilities and city buildings. Replacement Galvanized steel door $418 each, fireproof rock wall blanket building material $ /ton, ACM aluminum composite siding $15/Sq. meter, replace existing roof with either tile or metal $7/Sq. Ft. Reduces the damage of structures and assets owned and operated by the jurisdiction in the event of fire and wildfire. Plan for Implementation Sedalia City Council Medium 1-5 Years, as funds become available Internal Funds, Government Funding Sources, Bonds, HMGP, Financing Local Planning Mechanisms to be Used in Implementation, if any: Action Status Progress Report N/A New 4.15
175 Action Worksheet Name of Jurisdiction: Problem being Mitigated: Pettis County Risk / Vulnerability Adequate financial protection from flooding through flood insurance Hazard(s) Addressed: Action/Project Number: Action or Project Flooding P1.7-Pettis County Name of Action or Project: Action or Project Description: Estimated Cost: Benefits: Responsible Organization/Department: Action/Project Priority: Timeline for Completion: Potential Fund Sources: Local Planning Mechanisms to be Used in Implementation, if any: Action Status Report of Progress Property protection through NFIP Pettis County will continue compliance with the NFIP by adopting and enforcing floodplain management requirements, including regulation new construction in Special Flood Hazard area. Yearly NFIP Premium Reduce risk of financial loss to property and county and residential assets through the NFIP. Plan for Implementation Pettis County Floodplain Manager Medium Annual Review Internal Funds County Ordnances and regulations, Flood Plain Management Progress Report Continuing Flood plain regulations undergo review as needed and amended as necessary. Pettis County continues to participate in the NFIP and compiles with program regulations. 4.16
176 Action Worksheet Name of Jurisdiction: Problem being Mitigated: La Monte Risk / Vulnerability Losses from flooding events. Hazard(s) Addressed: Action/Project Number: Action or Project Flood P1.7-LaMonte Name of Action or Project: Action or Project Description: Property protection through NFIP The City of La Monte will continue compliance with the NFIP by adopting and enforcing floodplain management requirements, including regulation new construction in Special Flood Hazard area. Estimated Cost: Up to approximately $1000 Benefits: Allows residents access to flood insurance providing security and assurance during flooding events. Plan for Implementation Responsible La Monte City emergency management director Organization/Department: Action/Project Priority: Medium Timeline for Completion: Annual Review Potential Fund Sources: Internal Funds Local Planning Mechanisms to be Used in Implementation, if any: Action Status Report of Progress Floodplain ordinance Progress Report Continuing The City of La Monte continues to participate in NFIP as well as comply with program regulations. 4.17
177 Action Worksheet Name of Jurisdiction: Problem being Mitigated: Sedalia Risk / Vulnerability Protect residential structures Hazard(s) Addressed: Action/Project Number: Action or Project Flooding P1.7-Sedalia Name of Action or Project: Action or Project Description: Estimated Cost: Benefits: Responsible Organization/Department: Action/Project Priority: Timeline for Completion: Potential Fund Sources: Local Planning Mechanisms to be Used in Implementation, if any: Action Status Report of Progress Property Protection The City of Sedalia will continue compliance with the NFIP by adopting and enforcing floodplain management requirements, including regulation new construction in Special Flood Hazard area. Annual dues Protection of property and prevention of occurrences of damage through NFIP regulation enforcement and financial security through insurance. Plan for Implementation Sedalia NFIP floodplain manager Medium Annual Review Internal Funds Floodplain ordinance Progress Report Continuing Flood plain regulations undergo review as needed and amended as necessary. The City of Sedalia continues to participate in the NFIP Program and abide by program regulations. 4.18
178 Action Worksheet Name of Jurisdiction: Problem being Mitigated: Hazard(s) Addressed: Action/Project Number: Name of Action or Project: Action or Project Description: Estimated Cost: Benefits: Responsible Organization/Department: Action/Project Priority: Timeline for Completion: Potential Fund Sources: Pettis County Risk / Vulnerability Loss of employment and commercial facilities Tornados, flood, winter, drought, extreme heat, earthquakes, dam and levee failure, wildfires, sinkholes Action or Project P1.8-Pettis County Commercial Facilities Implement up to date commercial and industrial disaster plans that are coordinated with community disaster plans. Annual meetings to coordinate and discuss participation, identify gaps, and develop solutions can be expected to range from $500 - $3000 depending on venue and proper training materials. Protection of property and reduction of occurrences of damage to facilities. Plan for Implementation Pettis County EMA Director, County Commission High 1 year, schedule for review is dependent on employer requirements Internal Funds, Government programs, private funding Local Planning Mechanisms to be Used in Implementation, if any: Action Status Progress Report N/A New 4.19
179 Action Worksheet Name of Jurisdiction: Problem being Mitigated: Hazard(s) Addressed: Action/Project Number: Name of Action or Project: Action or Project Description: Estimated Cost: Benefits: Responsible Organization/Department: Action/Project Priority: Timeline for Completion: Potential Fund Sources: City of Sedalia Risk / Vulnerability Loss of employment and commercial facilities in the City of Sedalia. Tornados, flood, winter, drought, extreme heat, earthquakes, dam and levee failure, wildfires, sinkholes Action or Project P1.8-Sedalia Commercial Facilities Enforce and develop up to date commercial and industrial disaster plans that are coordinated with community disaster plans with new industries being developed in the jurisdiction with existing employers. Annual meetings to coordinate and discuss participation, identify gaps, and develop solutions can be expected to range from $500 - $3000 depending on venue and proper training materials. Reduces financial loss to residents and asset loss of employers and industries located in Sedalia. Plan for Implementation Sedalia EMA Director, Sedalia City Council High 1-5 Years Internal Funds, Government programs, private funding Local Planning Mechanisms to be Used in Implementation, if any: Action Status Progress Report N/A New 4.20
180 Goal 2: Manage growth through sustainable principles and practices Action Worksheet Name of Jurisdiction: Problem being Mitigated: Hazard(s) Addressed: Action/Project Number: Name of Action or Project: Action or Project Description: City of La Monte Risk / Vulnerability Reduce and prevent degradation of, or conflicts with natural resources Flood, Drought, Dam/Levee Failure Action or Project P2.1-LaMonte Natural Resource Protection Reduce the effects of flash flooding and drought by promoting construction and use practices that facilitate rainwater percolation into local water tables. Estimated Cost: Culvert installation for redirection of flash flooding averages to $12,500 per instillation for trenching, fill, and pipe according to the DOT. Benefits: Reduction in soil erosion, loss of crops and Pettis County natural resources. Plan for Implementation Responsible La Monte EM Coordinator, La Monte Floodplain Manager, MODOT, La Organization/Department: Monte City Council Action/Project Priority: Medium Timeline for Completion: 1-3 Years Potential Fund Sources: MODOT program funds, city funds, utility revenue Local Planning Mechanisms to be Used in Implementation, if any: Action Status Report of Progress MODOT approved local drainage plans Progress Report New Design engineer applying best practices offered through MODOT, and approved storm water detention and percolation techniques. 4.21
181 Action Worksheet Name of Jurisdiction: Problem being Mitigated: Hazard(s) Addressed: Action/Project Number: Name of Action or Project: Action or Project Description: Pettis County Risk / Vulnerability Reduce and prevent degradation of, or conflicts with natural resources Flood, Drought, Dam/Levee Failure, Wildfire Action or Project P2.2-Pettis Drought Management Enforce and comply with up to date best practices for drought resistant farming. Estimated Cost: Agri-Agriculture Emergency Planning/Response Training - $16,500 Benefits: Reduction in loss of crops and Pettis County natural resources. Plan for Implementation Responsible Pettis EMA Director, Pettis County Floodplain Manager Organization/Department: Action/Project Priority: High Timeline for Completion: Annually in conjunction with crop rotations Potential Fund Sources: Government program funds, private funding, internal funds Local Planning Mechanisms to be Used in Implementation, if any: Action Status Report of Progress LEPC, County Emergency Management Plan Progress Report Continuing Farmers are provided information to participate in farming best practices offered through Missouri Ag extension. 4.22
182 Action Worksheet Name of Jurisdiction: Problem being Mitigated: Pettis County Risk / Vulnerability Reduce and prevent degradation of, or conflicts with natural resources Hazard(s) Addressed: Flood, Dam/Levee Failure Action or Project Action/Project Number: Name of Action or Project: Action or Project Description: Dam Management Work with MO DNR to identify primary maintenance techniques for earthen dams and encourage their use. Estimated Cost: Agri-Agriculture Emergency Planning/Response Training - $16,500, Seminar training from MO DNR typically cost time and mileage as most information is provided through DNR at no cost. Information regarding Earthen dams and technics can be found on the MO DNR website. Benefits: Reduction in loss of crops and Pettis County and reduces impact and potential loss of natural resources. Plan for Implementation Responsible Pettis EMA Director, Pettis County Floodplain Manager Organization/Department: Action/Project Priority: High Timeline for Completion: Continuous Potential Fund Sources: Government program funds, private funding, internal funds Local Planning Mechanisms to be Used in Implementation, if any: Action Status Progress Report N/A New 4.23
183 Goal 3: Ensure continued operation of government and emergency functions during and after a disaster Action Worksheet Name of Jurisdiction: Problem being Mitigated: Hazard(s) Addressed: Action/Project Number: Name of Action or Project: Action or Project Description: Pettis County Risk / Vulnerability Strengthen critical structures and infrastructures Tornado, Flood, Winter, Earthquake, Dam/Levee Failure, Wildfire, Sinkholes Action or Project P3.1-Pettis Strengthen Critical Structures Implement upgrades or retrofits for critical buildings and infrastructures. Estimated Cost: Estimated infrastructure budget $500,000 Benefits: Protection of property and prevention of occurrences of damage due to older building not originally designed to withstand natural disasters or have deteriorated over time. Plan for Implementation Responsible Pettis County EMA Director, Special District Officials (Fire Chief, Police Organization/Department: Chief), Pettis County Ambulance Board Action/Project Priority: High Timeline for Completion: 1-5 Years Potential Fund Sources: Government program funds, private funding, internal funds Local Planning Mechanisms to be Used in Implementation, if any: Action Status Report of Progress Emergency management plan, County comprehensive plan Progress Report Ongoing Projects undergo an annual review and report. Any problem areas or maintenance found is then delegated for mitigation. 4.24
184 Action Worksheet Name of Jurisdiction: Problem being Mitigated: Hazard(s) Addressed: Action/Project Number: Name of Action or Project: Action or Project Description: Estimated Cost: Benefits: Responsible Organization/Department: Action/Project Priority: Timeline for Completion: Potential Fund Sources: Local Planning Mechanisms to be Used in Implementation, if any: Action Status Report of Progress Pettis County Risk / Vulnerability Strengthen multi-jurisdictional cooperation among emergency services Tornados, Flood, Winter, Earthquakes, Dam/Levee Failure, Wildfires, Sinkholes Action or Project P3.2-Pettis Multi-Jurisdictional Cooperation Purchase, certify and install interoperable communications equipment among jurisdictional agencies and special districts. $10,750 to purchase, certify and install interoperable communications equipment Create a reliable and robust communications network among the various entities to allow for more efficient hazard mitigation practices. Plan for Implementation Pettis County EMA, Special District Directors. Medium 6-12 months Internal funding, RHSOC funding Emergency Management Plans, THIRA Progress Report New County EMA Directors and affiliates participate in regional RHSOC and review agreements between agencies annually. 4.25
185 Action Worksheet Name of Jurisdiction: Problem being Mitigated: Hazard(s) Addressed: Action/Project Number: Name of Action or Project: Action or Project Description: Estimated Cost: Benefits: Responsible Organization/Department: Action/Project Priority: Timeline for Completion: Potential Fund Sources: Local Planning Mechanisms to be Used in Implementation, if any: Action Status Report of Progress Houstonia Risk / Vulnerability Connecting multi-jurisdictional communications among emergency agencies Tornados, Flood, Winter, Earthquakes, Dam/Levee Failure, Wildfires, Sinkholes Action or Project P3.2-Houstonia Multi-Jurisdictional Connection Purchase, certify and install interoperable communications equipment among jurisdictional agencies and special districts. $34,410 to purchase, certify and install interoperable communications equipment Create a more functional and supportive network among the various entities to allow for more efficient hazard mitigation practices. Plan for Implementation Houstonia EMD, Special District Directors. Medium 6-12 months Internal funding, RHSOC funding Emergency Management Plans, THIRA Progress Report New County EMA Directors and affiliates participate in regional RHSOC and review agreements between agencies annually. 4.26
186 Action Worksheet Name of Jurisdiction: Problem being Mitigated: Hazard(s) Addressed: Action/Project Number: Name of Action or Project: Action or Project Description: Estimated Cost: Benefits: Responsible Organization/Department: Action/Project Priority: Timeline for Completion: Potential Fund Sources: Green Ridge R-VIII Risk / Vulnerability Currently no police presence is on school campuses to mitigate during natural disasters. Tornados, Flood, Winter, Earthquakes, Dam/Levee Failure, Wildfires, Sinkholes Action or Project P3.3-Green Ridge R8 Multi-Jurisdictional Cooperation Identify, review, and implement mechanisms to foster collaboration among jurisdictions, school districts, and special districts. Annual meetings to coordinate and discuss participation, identify gaps, and develop solutions can be expected to range from $100-$500 depending on venue, plus time and mileage Create a more functional and supportive network among the various entities to allow for more efficient hazard mitigation practices. Plan for Implementation Special Jurisdiction (Police), Green Ridge District officials and School Board Medium 6-12 months Internal funding, private funding Local Planning Mechanisms to be Used in Implementation, if any: Action Status Progress Report School Emergency Plan New 4.27
187 Action Worksheet Name of Jurisdiction: Problem being Mitigated: Hazard(s) Addressed: Action/Project Number: Name of Action or Project: Action or Project Description: Estimated Cost: Benefits: Responsible Organization/Department: Action/Project Priority: Timeline for Completion: Potential Fund Sources: Local Planning Mechanisms to be Used in Implementation, if any: Action Status Pettis County R-V Risk / Vulnerability Insufficient multi-jurisdictional cooperation among emergency agencies. Currently no campus police are present from either local or county agencies. Tornados, Flood, Winter, Earthquakes, Dam/Levee Failure, Wildfires, Sinkholes Action or Project P3.3-Pettis R5 Multi-Jurisdictional Cooperation Identify, review and implement mechanisms to foster collaboration among jurisdictional agencies and special districts. Enter into contract with either local or county law enforcement to provide security and presence on campus, and to assist in mitigation protocols during natural disasters. Annual meetings to coordinate and discuss participation, identify gaps, and develop solutions can be expected to range from $100-$500 depending on venue, plus time and mileage. Officer salary and time will vary depending on contract and services. Create a more functional and supportive network among the various entities to allow for more efficient hazard mitigation practices and provide safer and more efficient environments during natural hazards. Plan for Implementation School Board, Local/County Law enforcement. Medium 6-12 months Internal funding, private funding Emergency Plan, evacuation protocols, shelter protocols. Progress Report New 4.28
188 Action Worksheet Name of Jurisdiction: Problem being Mitigated: Hazard(s) Addressed: Action/Project Number: Name of Action or Project: Action or Project Description: Estimated Cost: Benefits: Responsible Organization/Department: Action/Project Priority: Timeline for Completion: Potential Fund Sources: Smithton R-VI Risk / Vulnerability police presence on campus, or departments contracted to provide security or emergency assistance during natural hazard events. Tornados, Flood, Winter, Earthquakes, Dam/Levee Failure, Wildfires, Sinkholes Action or Project P3.3-Smithton R6 Multi-Jurisdictional Cooperation Implement aid agreements or enter into contract with local/county law enforcement to provide police presence on campus and assist in execution of school emergency plans in times of natural hazard events. N/A Provides security and additional mitigation strategies to school district during regular hours and during natural disaster events. Plan for Implementation Smithton District Officials, School Board, Local/County Law enforcement and emergency services. Medium 1-2 Years Internal funding, private funding Local Planning Mechanisms to be Used in Implementation, if any: Action Status Progress Report School emergency plan New 4.29
189 Goal 4: Preserve and maintain property, infrastructure, business, and jurisdiction vitality. Action Worksheet Name of Jurisdiction: Problem being Mitigated: Hazard(s) Addressed: Action/Project Number: Name of Action or Project: Action or Project Description: Estimated Cost: Benefits: Responsible Organization/Department: Action/Project Priority: Timeline for Completion: Potential Fund Sources: Local Planning Mechanisms to be Used in Implementation, if any: Action Status Report of Progress Pettis County Risk / Vulnerability Reduce or prevent impacts from hazards on private properties Tornado, Flood, Winter, Drought, Heat Wave, Earthquake, Dam/Levee Failure, Wildfire, Sinkholes Action or Project P4.1-Pettis Hazards on Private Property Educate residents on property protection from hazards. An effective public educational campaign can range in price depending on the desired outreach. Through social media, printing, and public meetings, an affective campaign can run between an estimate $500 - $ Decrease in vulnerability to hazards due to an educated county population on the risk of natural hazards and preventable risks. Plan for Implementation Pettis EMA Director, Pettis County Commissioners Medium 1-5 Years, seasonal Government program funding, internal funds, private funds N/A Progress Report Ongoing Hazard maps are available to the public and can be obtained by reviewing this plan, reviewing the County Emergency Management Plan, or by contacting the Johnson County Emergency Management Office, and the Johnson County LEPC. 4.30
190 Action Worksheet Name of Jurisdiction: Problem being Mitigated: Hazard(s) Addressed: Action/Project Number: Name of Action or Project: Action or Project Description: Estimated Cost: Benefits: Responsible Organization/Department: Action/Project Priority: Timeline for Completion: Potential Fund Sources: Local Planning Mechanisms to be Used in Implementation, if any: Action Status Report of Progress Pettis County Risk / Vulnerability Reduce or prevent impacts from hazards on private properties Tornado, Flood, Winter, Drought, Heat Wave, Earthquake, Dam/Levee Failure, Wildfire, Sinkholes Action or Project P4.2-Pettis Hazard Impact Reduction on Private Property County planning departments provide hazard maps to developers, home buyers, construction and engineers to aid with proper building techniques and location. Mapping and development $500 - $3000 depending on detail, content and location size. Decrease in vulnerability to hazards by providing up to date and relevant maps to developers, home buyers, construction and engineers to allow for proper construction locations and prevent exposures to known hazard prone areas. Plan for Implementation Pettis EMA Director, County Commissioners, Economic Planner Medium 1-5 Years, as maps are available Internal funds, private funds Code Enforcement Progress Report New Hazard maps are available to the public and can be obtained by reviewing this plan, reviewing the County Emergency Management Plan, or by contacting the Pettis County Emergency Management Office, and the Pettis County LEPC. 4.31
191 Action Worksheet Name of Jurisdiction: Problem being Mitigated: Hazard(s) Addressed: Action/Project Number: Name of Action or Project: Action or Project Description: Estimated Cost: Benefits: Responsible Organization/Department: Action/Project Priority: Timeline for Completion: Potential Fund Sources: Pettis County Risk / Vulnerability Reduce or prevent impacts from hazards on private properties and critical infrastructure Tornado, Flood, Winter, Drought, Earthquake, Wildfire Action or Project P4.3-Pettis County Reduce Hazards on Private Properties Negotiate or require utilities to be placed or relocated underground during the construction of facilities being constructed throughout the county. Utility relocation from above ground to new underground for a 138KV line would approximately cost $2 million per mile, according to a paper published by the Public Service Commission of Wisconsin. ( 18/issue-2/features/underground-vs-overhead-power-line-installationcost-comparison-.html) Decrease in vulnerability to loss of electricity and utility lines from natural hazards limiting the short-term exposure of residents. Plan for Implementation Pettis County Commissioners. Pettis County GIS, Economic Planner Medium 1-5 Years; per project Government program funding, internal funds, private funds Local Planning Mechanisms to be Used in Implementation, if any: Action Status Progress Report N/A New 4.32
192 Action Worksheet Name of Jurisdiction: Problem being Mitigated: Hazard(s) Addressed: Action/Project Number: Name of Action or Project: Action or Project Description: Estimated Cost: Benefits: Responsible Organization/Department: Action/Project Priority: Timeline for Completion: Potential Fund Sources: Local Planning Mechanisms to be Used in Implementation, if any: Action Status Report of Progress Sedalia Risk / Vulnerability Reduce or prevent impacts from hazards on industrial and commercial property Tornado, Flood, Winter, Earthquake, Dam/Levee Failure, Wildfire Action or Project P4.3-Sedalia Reduce Hazards on Commercial Properties Educate prospective industries relocating or expanding to the Sedalia area to bury utility lines and critical infrastructures during the building process of facilities. Utility relocation from above ground to new underground for a 138KV line would approximately cost $2 million per mile, according to a paper published by the Public Service Commission of Wisconsin. ( 18/issue-2/features/underground-vs-overhead-power-line-installationcost-comparison-.html) Enable the continued operations of facilities being constructed in industrial parks, and commercially zoned properties, protecting economic vitality and livelihoods of the residents employed. Plan for Implementation Sedalia Development Planner, City Public Works Director, City Economic Developer Medium 1-5 Years Government program funding, internal funds, private funds Economic Development Plan, Comprehensive Plan Progress Report New Continued coordination with utility companies in developing areas in the City of Warrensburg and areas identified for commercial and industrial development. 4.33
193 Action Worksheet Name of Jurisdiction: Problem being Mitigated: Hazard(s) Addressed: Action/Project Number: Name of Action or Project: Action or Project Description: Estimated Cost: Benefits: Responsible Organization/Department: Action/Project Priority: Timeline for Completion: Potential Fund Sources: Local Planning Mechanisms to be Used in Implementation, if any: Action Status Report of Progress Green Ridge Risk / Vulnerability Reduce or prevent impacts from hazards on public properties Tornado, Flood, Winter, Earthquake, Dam/Levee Failure, Wildfire Action or Project P4.3-Green Ridge Severe weather damage prevention Encourage prospective businesses and residents to the jurisdiction to bury utility lines to critical infrastructure. Utility relocation from above ground to new underground for a 138KV line would approximately cost $2 million per mile, according to a paper published by the Public Service Commission of Wisconsin. ( 18/issue-2/features/underground-vs-overhead-power-line-installationcost-comparison-.html) Continued operation of critical infrastructure in hazard events, protecting the economic vitality of the jurisdiction Plan for Implementation Green Ridge City Council, City Public Works Director Medium 1-5 Years Government program funding, internal funds, private funds Zoning Ordinance Progress Report New Continued coordination with utility companies in developing areas are encouraged to bury line. 4.34
194 Action Worksheet Name of Jurisdiction: Problem being Mitigated: Hazard(s) Addressed: Action/Project Number: Name of Action or Project: Action or Project Description: Estimated Cost: Benefits: Responsible Organization/Department: Action/Project Priority: Timeline for Completion: Potential Fund Sources: Houstonia Risk / Vulnerability Damage caused by hazards to public properties and critical infrastructure Tornado, Flood, Winter, Earthquake, Dam/Levee Failure, Wildfire Action or Project P4.4-Houstonia Reduction of hazard effects to public property Upgrade and retrofit of buildings with reinforced hazard protections correctly installed. Retrofitting existing buildings to storms and current seismic codes can be averaged to $30/sq. ft. for one story buildings and $40/sq. ft. for buildings with 2 or more floors. Reduce or eliminate damages from hazards to public properties. Plan for Implementation Houstonia City Council, City Public Works Director Medium 1-5 Years, depending on budget Government program funds, private funding, internal revenue. Local Planning Mechanisms to be Used in Implementation, if any: Action Status Progress Report N/A New 4.35
195 Action Worksheet Name of Jurisdiction: Problem being Mitigated: Hazard(s) Addressed: Action/Project Number: Name of Action or Project: Action or Project Description: Estimated Cost: Benefits: Responsible Organization/Department: Action/Project Priority: Timeline for Completion: Potential Fund Sources: Hughesville Risk / Vulnerability Hazards impacts on public properties/critical infrastructure Tornado, Flood, Winter, Earthquake, Wildfire Action or Project P4.4-Hughesville Jurisdiction Responsibility to Reduce Hazards on Public Properties Upgrade of public lifeline facilities to meet most current building seismic codes with storm resistant material. Retrofitting existing buildings to storms and current seismic codes can be averaged to $30/sq. ft. for one story buildings. Storm resistant windows can easily exceed $500 per window plus installation. Reduction in damages from hazards to public properties and critical infrastructure. Plan for Implementation Hughesville City Council, City Public Works Director Medium 1-5 Years as funds are available Government program funds, private funding, internal revenue. Local Planning Mechanisms to be Used in Implementation, if any: Action Status Progress Report Capital improvement plan New 4.36
196 Action Worksheet Name of Jurisdiction: Problem being Mitigated: Hazard(s) Addressed: Action/Project Number: Name of Action or Project: Action or Project Description: City of Green Ridge Risk / Vulnerability Loss of function to critical facilities during prolonged power outages due to lack of, or nonfunctioning generator. Tornados, flood, winter, drought, extreme heat, earthquakes, dam and levee failure, wildfires, sinkholes Action or Project P4.4-Green Ridge Emergency Equipment Upgrade/replace/install generators fire station and police station facilities to ensure continued operation during natural disasters. Estimated Cost: Generator Purchase - $37,951; Generator Maintenance - $825 annually Benefits: Ensures continued operation of emergency services during prolonged outages cause by natural disasters. Plan for Implementation Responsible City special districts and regulatory committees, City Council Organization/Department: Action/Project Priority: High Timeline for Completion: 1-5 Years Potential Fund Sources: Internal revenue, Government program funds, HMGP, RHSOC Local Planning Mechanisms to be Used in Implementation, if any: Action Status Mutual Aid Agreements, Emergency Planning Committees, Special district committees, City Mitigation Plan Progress Report New 4.37
197 Action Worksheet Name of Jurisdiction: Problem being Mitigated: Hazard(s) Addressed: Action/Project Number: Name of Action or Project: Action or Project Description: Estimated Cost: Benefits: Responsible Organization/Department: Action/Project Priority: Timeline for Completion: Potential Fund Sources: Smithton R-VI Risk / Vulnerability Reduce or prevent damages from hazards on existing district buildings. Tornado, Flood, Winter, Earthquake, Wildfire Action or Project P4.5-SmithtonR6 Reduce Hazard Effect on District Buildings Upgrade and retrofit buildings with wind and storm-resistant materials such as reinforced windows and retrofit buildings with appropriate structural installations Retrofitting existing buildings to storms and current seismic codes can be averaged to $30/sq. ft. for one story buildings and $40/sq. ft. for buildings with 2 or more floors. Reduce or eliminate damages from high winds and thunderstorm conditions to building and contents such as computers due to exposer to elements. Plan for Implementation Smithton School Board, Principal, Maintenance Supervisor Medium 1-5 Years, as budget allows Government program funds, private funding, internal revenue. Local Planning Mechanisms to be Used in Implementation, if any: Action Status Progress Report School Emergency Plan New 4.38
198 Action Worksheet Name of Jurisdiction: Green Ridge R-8 Problem being Mitigated: Hazard(s) Addressed: Action/Project Number: Name of Action or Project: Action or Project Description: Estimated Cost: Benefits: Responsible Organization/Department: Action/Project Priority: Timeline for Completion: Potential Fund Sources: Risk / Vulnerability Strengthen protection for existing district buildings from the effects of hazards. Tornado, Flood, Winter, Earthquake, Wildfire Action or Project P4.5-GreenRidgeR4 Protection of District Buildings Use current design parameters, materials, and building techniques to retrofit district building to protect against storm and wind damages. Retrofitting existing buildings to standards for severe storms can be averaged to $30/sq. ft. for one story buildings and $40/sq. ft. for buildings with 2 or more floors. Windows designed to limit damage can exceed $1000 per installation, for larger windows. Reduced or eliminated damage caused by flying debris during a hazard event, that results in less damage to contents of buildings. Plan for Implementation School Board, Principal, Maintenance Supervisor Medium 1-5 Years, depending on budget constraints Government program funds, private funding, internal revenue. Local Planning Mechanisms to be Used in Implementation, if any: Action Status Progress Report School Emergency Plan New 4.39
199 Action Worksheet Name of Jurisdiction: Pettis County R-5 Problem being Mitigated: Hazard(s) Addressed: Action/Project Number: Name of Action or Project: Action or Project Description: Estimated Cost: Benefits: Responsible Organization/Department: Action/Project Priority: Timeline for Completion: Potential Fund Sources: Risk / Vulnerability Prevent/reduce damage incurred from hazards by strengthen protections for existing district buildings. Tornado, Flood, Winter, Earthquake, Wildfire Action or Project P4.5-PettisCountyR5 Damage Protection from Hazards on District Buildings Use storm-resistant materials, like reinforced windows and integrated structural support materials, to retrofit/upgrade district buildings to protect against hazard damages. Retrofitting existing buildings to standards for severe storms can be averaged to $30/sq. ft. for one story buildings and $40/sq. ft. for buildings with 2 or more floors. Replacement windows designed to limit damage can exceed $1000 per installation depending on opening size. Damages from high winds and thunderstorm conditions to building are reduced or eliminated, while building contents remain protected. Plan for Implementation School Board, Principal, Maintenance Supervisor Medium 1-5 Years, depending on budget constraints Government program funds, private funding, internal revenue. Local Planning Mechanisms to be Used in Implementation, if any: Action Status Progress Report School Emergency Plan New 4.40
200 Action Worksheet Name of Jurisdiction: Sedalia 200 Problem being Mitigated: Hazard(s) Addressed: Action/Project Number: Name of Action or Project: Action or Project Description: Estimated Cost: Benefits: Responsible Organization/Department: Action/Project Priority: Timeline for Completion: Potential Fund Sources: Risk / Vulnerability designated tornado or storm shelters in 4 of 5 elementary schools, middle, or high school. Tornado, Thunderstorm Action or Project P4.6-Sedalia200 Tornado Shelters Construct FEMA approved tornado or storm shelters in the four elementary school and high school that can accommodate students, staff and visitors. New FEMA approved storm shelters will vary in price depending on capacity, but costs can be expected to be approximately $600,000 and $1,000,000 for construction. Decreased exposure to faculty and students from high winds and tornados, possibly preventing loss of life. Plan for Implementation School Board, Building Principals, Maintenance Supervisor High 1-5 Years, depending on budget constraints Government program funds, private funding, internal revenue. Local Planning Mechanisms to be Used in Implementation, if any: Action Status Progress Report School Emergency Plan New 4.41
201 4.42
202 5 PLAN MAINTENANCE PROCESS 5 PLAN MAINTANCE PROCESS Monitoring, Evaluation, & Updating the Plan Responsibility for Plan Maintenance Plan Maintenance Schedule Plan Maintenance Process Incorporation into Existing Planning Mechanisms Continued Public Involvement This chapter provides an overview of the overall strategy for plan maintenance and outlines the method and schedule for monitoring, updating and evaluating the plan. The chapter also discusses incorporating the plan into existing planning mechanisms and how to address continued public involvement. 5 Plan Maintenance Process 44 CFR Requirement 201.6(c)(4): The plan maintenance process shall include a section describing the method and schedule of monitoring, evaluating, and updating the mitigation plan within a five-year cycle. 5.1 Monitoring, Evaluating, and Updating the Plan Responsibility for Plan Maintenance The MPC can be a standing committee, with oversight by a responsible agency or elected body. Oversight responsibility could fall to such entities as the county emergency management agency, the Regional Planning Commission, or Local Emergency Operations. If the MPC is not a standing committee, responsibility for maintenance needs to be delegated to another individual or entity. Maintenance should involve agreement of the participating jurisdictions, including school and special districts, to: Meet annually, and after a disaster event, to monitor and evaluate the implementation of the plan; Act as a forum for hazard mitigation issues; Disseminate hazard mitigation ideas and activities to all participants; Pursue the implementation of high priority, low- or no-cost recommended actions; Maintain vigilant monitoring of multi-objective, cost-share, and other funding opportunities to help the community implement the plan s recommended actions for which no current funding exists; Monitor and assist in implementation and update of this plan; Keep the concept of mitigation in the forefront of community decision making by identifying plan recommendations when other community goals, plans, and activities overlap, influence, or directly affect increased community vulnerability to disasters; Report on plan progress and recommended changes to the County Board of Supervisors and governing bodies of participating jurisdictions; and Inform and solicit input from the public. The designated responsible entity is an advisory body and can only make recommendations to county, city, town, or district elected officials. Its primary duty is to see the plan successfully carried out and to 5.1
203 report to the community governing boards and the public on the status of plan implementation and mitigation opportunities. Other duties include reviewing and promoting mitigation proposals, hearing stakeholder concerns about hazard mitigation, passing concerns on to appropriate entities, and posting relevant information in areas accessible to the public Maintenance Schedule The designated responsible entity agrees to meet annually and after a state or federally declared hazard event as appropriate to monitor progress and update the mitigation strategy. The Pettis County Emergency Management Director will be responsible for initiating the plan reviews and will invite members of the MPC and other designated responsible entities to the meeting. In coordination with all participating jurisdictions, a five-year written update of the plan will be submitted to the Missouri State Emergency Management Agency (SEMA) and FEMA Region VII per Requirement 201.6(c)(4)(i) of the Disaster Mitigation Act of 2000, unless disaster or other circumstances (e.g., changing regulations) require a change to this schedule Maintenance Process Progress on the proposed actions can be monitored by evaluating changes in vulnerabilities identified in the plan. The MPC, and other designated responsible entities, during the annual meeting should review changes in vulnerability identified as follows: Decreased vulnerability as a result of implementing recommended actions, Increased vulnerability as a result of failed or ineffective mitigation actions, Increased vulnerability due to hazard events, and/or Increased vulnerability as a result of new development (and/or annexation). Future 5-year updates to this plan will include the following activities: Consideration of changes in vulnerability due to action implementation, Documentation of success stories where mitigation efforts have proven effective, Documentation of unsuccessful mitigation actions and why the actions were not effective, Documentation of previously overlooked hazard events that may have occurred since the previous plan approval, Incorporation of new data or studies with information on hazard risks, Incorporation of new capabilities or changes in capabilities, Incorporation of growth data and changes to inventories, and Incorporation of ideas for new actions and changes in action prioritization. In order to best evaluate any changes in vulnerability as a result of plan implementation, the participating jurisdictions will adopt the following process: Each proposed action in the plan identified an individual, office, or agency responsible for action implementation. This entity will track and report on an annual basis to the jurisdictional MPC (or designated responsible entity) member on action status. The entity will provide input on whether the action as implemented meets the defined objectives and is likely to be successful in reducing risk. 5.2
204 If the action does not meet identified objectives, the jurisdictional MPC (or designated responsible entity) member will determine necessary remedial action, making any required modifications to the plan. Changes will be made to the plan to remedy actions that have failed or are not considered feasible. Feasibility will be determined after a review of action consistency with established criteria, time frame, community priorities, and/or funding resources. Actions that were not ranked high but were identified as potential mitigation activities will be reviewed as well during the monitoring of this plan. Updating of the plan will be accomplished by written changes and submissions, as the (MPC or designated responsible entity) deems appropriate and necessary. Changes will be approved by the Pettis County Board of Commissioners and the governing boards of the other participating jurisdictions. 5.2 Incorporation into Existing Planning Mechanisms 44 CFR Requirement 201.6(c)(4)(ii): [The plan shall include a] process by which local governments incorporate the requirements of the mitigation plan into other planning mechanisms such as comprehensive or capital improvement plans, when appropriate. Where possible, plan participants, including school and special districts, will use existing plans and/or programs to implement hazard mitigation actions. Those existing plans and programs were described in Section 2 of this plan. Based on the capability assessments of the participating jurisdictions, communities in Pettis County will continue to plan and implement programs to reduce losses to life and property from hazards. This plan builds upon the momentum developed through previous and related planning efforts and mitigation programs and recommends implementing actions, where possible, through the following plans: Pettis County Emergency Operations Plan School Emergency Plans School Master Plans Capital improvements project funding Participation in the NFIP Zoning and planning restrictions Economic Development programs Capital Improvement plans Comprehensive plans Zoning ordinances Building codes Subdivision codes Storm water ordinances Hazard awareness programs Floodplain ordnances The MPC and designated responsible entity members involved in updating these existing planning mechanisms will be responsible for integrating the findings and actions of the mitigation plan, as appropriate. The MPC and designated responsible entities are also responsible for monitoring this integration and incorporation of the appropriate information into the five-year update of the multijurisdictional hazard mitigation plan. Additionally, after the annual review of the Hazard Mitigation 5.3
205 Plan, the Pettis County Emergency Management Director will provide the updated Mitigation Strategy with current status of each mitigation action to the County (Board of Commissioners) as well as all Mayors, City Clerks, and School District Superintendents. The Emergency Manager Director will request that the mitigation strategy be incorporated, where appropriate, in other planning mechanisms Table 5.1 Planning Mechanisms Identified for Integration of Hazard Mitigation Plan Jurisdiction Planning Mechanisms Integration Process from Previous Plan Integration Process for Current Plan County Emergency Plan County Commission Comprehensive Plan Pettis Co Green Ridge Houstonia Hughesville La Monte County Mitigation Plan Emergency Management Director Hazard Analysis Debris Management Plan Floodplain Manager NFIP Participation Debris Management Watershed Plan Plan Floodplain Ordinance Floodplain Ordinance Storm Water Ordinance County Emergency Management Plan Emergency Action Plan Zoning Ordinance City Ordinance City Ordinance City Mitigation Plan Zoning Regulations Zoning Ordinance City Ordinances Zoning / Land use restrictions City Ordinances City Mitigation Plan City Ordinance City Ordinance Capital Improvement Plan Emergency Operations Plan Master Plan NFIP Participation Capital Improvement Plan City Emergency Operations Emergency Operations Plan City Ordinances City Ordinances Zoning / Land use restrictions City Ordinances Master Plan Floodplain Ordinance Zoning / Land use restrictions Emergency Operations Plan Zoning Regulations Sedalia Comprehensive Plan Capital Improvement Plan City Emergency Operations Mater Plan Emergency Management Director Economic Development Director Local Emergency Planning Committee Emergency Management Plan Economic Development Plan Local Recovery Plan Emergency Operations Plan Floodplain Ordinance City Mitigation Zoning Regulations Comprehensive Plan Economic Development Plan 5.4
206 Green Ridge R-VIII Pettis Co. R-V Smithton R-VI Sedalia 200 School Emergency Plan School Emergency Plan School Emergency Plan Shelter In-place Shelter In-place Protocols Shelter In-place Protocols Protocols Evacuation Protocols Evacuation Protocols Evacuation Protocols Weapons Policy Weapons Policy Weapons Policy School Emergency Plan School Emergency Plan School Emergency Plan Shelter In-place Shelter In-place Protocols Shelter In-place Protocols Protocols Evacuation Protocols Evacuation Protocols Evacuation Protocols Weapons Policy Weapons Policy Weapons Policy School Emergency Plan School Emergency Plan School Emergency Plan Evacuation Protocols Evacuation Protocols Evacuation Protocols Weapons Policy Weapons Policy Weapons Policy Master Plan Master Plan Master Plan Capital Improvement Capital Improvement Plan Capital Improvement Plan Plan School Emergency Plan School Emergency Plan School Emergency Plan Shelter In-place Shelter In-place Protocols Shelter In-place Protocols Protocols Evacuation Protocols Evacuation Protocols Evacuation Protocols Weapons Policy Weapons Policy Weapons Policy 5.3 Continued Public Involvement 44 CFR Requirement 201.6(c)(4)(iii): [The plan maintenance process shall include a] discussion on how the community will continue public participation in the plan maintenance process. The hazard mitigation plan update process provides an opportunity to publicize success stories resulting from the plan s implementation and seek additional public comment. Information about the annual reviews will be posted in the local newspaper as well as on the Pettis County website following each annual review of the mitigation plan. When the MPC reconvenes for the five-year update, it will coordinate with all stakeholders participating in the planning process. Included in this group will be those who joined the MPC after the initial effort, to update and revise the plan. Public notice will be posted and public participation will be actively solicited, at a minimum, through available website postings and press releases to local media outlets, primarily newspapers. 5.5
207 Appendix A: RESOURCES: Missouri State Hazard Mitigation Plan July Missouri State Hazard Mitigation Plan July n Plan.pdf Midwestern Regional Climate Center Missouri Historical Agricultural Weather Database, University of Missouri Extension U.S. Census Bureau, American Factfinder Missouri Census Data Center University of Missouri Extension FEMA Hazard Mitigation Grant Dataset Missouri Department of Elementary & Secondary Education U.S. Census Bureau Building Permit Data FEMA Disaster Declarations ld_disaster_declaration_type_value=dr&items_per_page=20&=go Missouri Department of Public Safety SEMA Federal Highway Administration National Bridge Inventory
208 U.S. Fish & Wildlife Service, Endangered Species National Park Services Missouri DNR, Pettis County National Historic Register Listings Stanford University s National Performance of Dams Program U.S. Corp. of Engineers, National Inventory of Dams National Drought Mitigation Center United States Drought Monitor USGS Earthquake Hazards Program Richter Magnitude Earthquake Scenario, New Madrid Fault Zone Map Probability of magnitude 5.0 or greater within 100 year, United States Geological Survey DNR, History of Earthquakes in Missouri National Centers for Environmental Information gindate_dd=01&begindate_yyyy=1996&enddate_mm=12&enddate_dd=31&enddate_yyyy=20 16&county=SALINE%3A195&hailfilter=0.00&tornfilter=0&windfilter=000&sort=DT&submitbutto n =Search&statefips=29%2CMISSOURI National Weather Services Missouri Department of Conservation Wildfire Data Search National Fire Incident Reporting System
209 FEMA map services center NFIP Community Status Book NFIP Claim Status USGS Sinkholes National Levee Database FEMA Levee Resource Library Sedalia Parks & Recreation Pettis County Missouri Pettis County Fire Protection District Pettis County City of Sedalia Pettis County Ambulance District Pettis County Sheriff Office
210 Appendix B:
211
212
213
214
215
216
217
218
219
220
221
222
223
224
225
226
227
228 Appendix C: Adoption Resolutions
229
230
231
232
233
234
235
236
237
238
239 Appendix D: Invitee List Pettis County Participation Invite List Pettis Co. Commissioners Jurisdictions School Districts Presiding David Dick Health Services Pettis Co Health Center West Jim Marcum Bothwell Hospital Joann Martin Jimmy Robertson East Brent Hampy Katy Trail Community Chris Stewart Fire/EMS Services Sedalia Steve Galliher Sedalia Mike Ditzfield Sedalia Kelvin Shaw Smithton Jim Menke Smithton Damian Lemens Hughesville Brad Walbourn Hughesville Jennifer Raines Houstonia Russ Kreisel Houstonia Brenda Cramer La Monte Ray Durham Tonya Houstonia Brandkamp Green Ridge Allan Rohrbach La Monte Ronnis McNene Pettis Co EMS Eric Dirck Green Ridge Ronnie Ollison Law Enforcement Sedalia 200 Brad Pollit Sherriff Kevin Bond Pettis Co. R-VII Amy Fagg Sedalia John DeGonia Smithton R-VI Diedrick Kahrs Smithton Bill Grose Pettis Co. R-V Sharee rfleet Green Ridge Darryl Koebel La Monte R-IV Green Ridge R- VIII Joan Twidwell Rodney Edington Emergency Managers Other Pettis County Trisha Rooda Pettis GIS/Floodplain James Theisen Sedalia Trisha Rooda Smithton Ed Saltsgaver
240 Appendix E: STAPLEE Worksheets
241
242
243
244
245
246
247
248
249
250
251
252
253
254
255
256

257
258
259
260
261
262
263
264 Appendix F: Pettis County Public Survey
265
266 Appendix G: Questionnaires
267
268
269
270
271
272
273
274
275
276
277
278
279
280
281
282
283
284
285
286

287

288
289
290
291
292
293
294

295
296
297
298

299

300

301
302
303
304

305

306
307
308
309
310

311
312
313

314

315
316
317
318
319
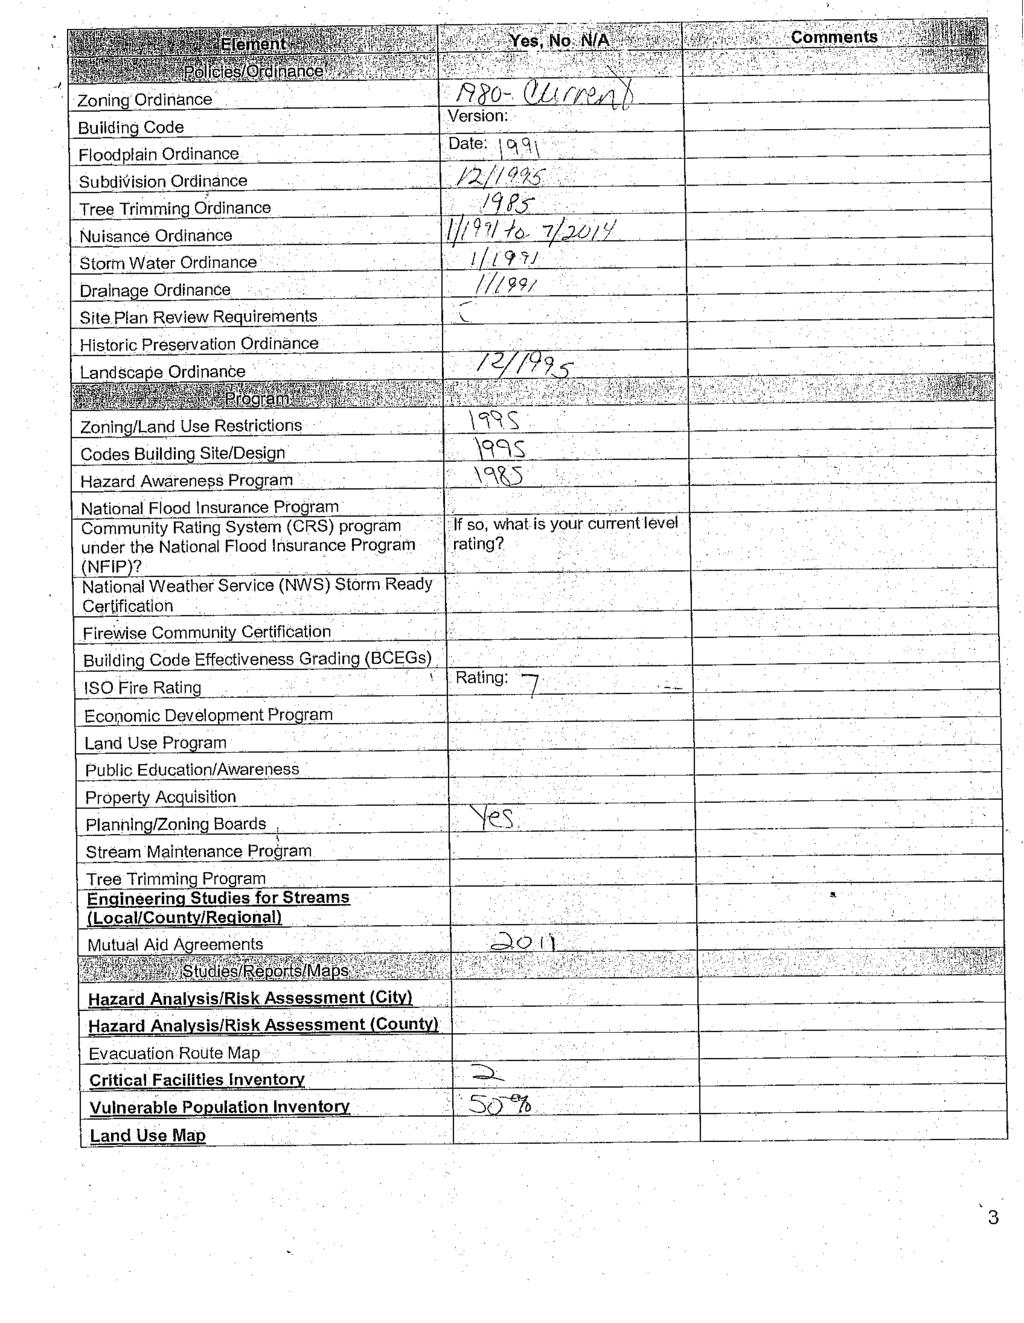
320
321
322
323
324
325

326

327
328
329
330
331
332
333
334
335

336

337
338
339
340
341
342
343
344
345

346
347
348
349
350
351
352
353
354
355
356
357
358
359
360
361
362
363
364
365
366

367
368
369
370

371
1.1 Purpose Background and Scope Plan Organization
 1 INTRODUCTION AND PLANNING PROCESS 1 INTRODUCTION AND PLANNING PROCESS... 1.1 1.1 Purpose... 1.1 1.2 Background and Scope... 1.1 1.3 Plan Organization... 1.2 1.4 Planning Process... 1.2 1.4.1 Multi-Jurisdictional
1.1.1 Purpose. 1.2 Background and Scope
 1.1.1 Purpose Van Buren County and the 8 associated jurisdictions and associated agencies, business interests and partners of the county prepared this local hazard mitigation plan to guide hazard mitigation
Shelby Hazard Mitigation Planning Committee
 CONTRIBUTORS Jurisdictional Representatives Shelby Hazard Mitigation Planning Committee Name Title Department Jurisdiction/Agency/Organiz Glenn Eagan Presiding Commissioner Administration County ation
Appendix F: Ozark special Road District Addendum
 Appendix F: Ozark special Road District Addendum F-1: Introduction and Planning Process F-1.1 Purpose The Christian County 2016 Multi-Jurisdictional Natural Hazards Mitigation Plan is an updated version
in coordination with Peoria County, Planning and Zoning Department
 Prepared by Amec Foster Wheeler Environment & Infrastructure Hazard Mitigation and Emergency Management Program in coordination with Peoria County, Planning and Zoning Department The purpose of hazard
SOUTH CENTRAL REGION MULTI-JURISDICTION HAZARD MITIGATION PLAN. Advisory Committee Meeting September 12, 2012
 SOUTH CENTRAL REGION MULTI-JURISDICTION HAZARD MITIGATION PLAN Advisory Committee Meeting September 12, 2012 AGENDA FOR TODAY Purpose of Meeting Engage All Advisory Committee Members Distribute Project
Dade County Natural Hazard Mitigation Plan
 Introduction to Mitigation Definition of Mitigation Mitigation is defined by FEMA as "...sustained action that reduces or eliminates longterm risk to people and property from natural hazards and their
CLINTON COUNTY MULTI- JURISDICTIONAL HAZARD MITIGATION PLAN
 CLINTON COUNTY MULTI- JURISDICTIONAL HAZARD MITIGATION PLAN Draft 5/8/2018 Mo-Kan Regional Council, 224 N. 7 th Street, St. Joseph, MO 64501 Jurisdictional Representatives Clinton County Hazard Mitigation
LOCAL HAZARD MITIGATION PLAN REVIEW WORKSHEET FEMA REGION 2 Jurisdiction: Jurisdiction: Title of Plan: Date of Plan: Address:
 REVIEW AD APPROVAL TATU Title of Plan: Date of Plan: Local Plan submitted by: Address: Title: Agency: Phone umber: E-Mail: tate Reviewer: Title: Date: FEMA Reviewer: Title: Date: FEMA QA/QC: Title: Date:
Section 2. Introduction and Purpose of the LMS
 Section 2. Introduction and Purpose of the LMS 2.1 Introduction The Disaster Mitigation Act of 2000 (DMA 2000), signed into law by the President of the United States on October 30, 2000 (P.L. 106-390),
LOCAL HAZARD MITIGATION PLAN UPDATE CHECKLIST
 D LOCAL HAZARD MITIGATION PLAN UPDATE CHECKLIST This section of the Plan includes a completed copy of the Local Hazard Mitigation Checklist as provided by the North Carolina Division of Emergency Management.
T-318. Hazard Mitigation Section TDEM Recovery, Mitigation, and Standards
 T-318 Local Hazard Mitigation Plan Requirements Hazard Mitigation Section TDEM Recovery, Mitigation, and Standards Raymond Mejia, Lead Hazard Mitigation Planner Samantha Aburto, Hazard Mitigation Planner
G318 Local Mitigation Planning Workshop. Module 2: Risk Assessment. Visual 2.0
 G318 Local Mitigation Planning Workshop Module 2: Risk Assessment Visual 2.0 Unit 1 Risk Assessment Visual 2.1 Risk Assessment Process that collects information and assigns values to risks to: Identify
Stevens County, Washington Request for Proposal For A Countywide Multi-Jurisdictional All Hazard Mitigation Plan (Update)
") Stevens County, Washington Request for Proposal For A Countywide Multi-Jurisdictional All Hazard Mitigation Plan (Update) Project background A Multi-Jurisdictional All Hazard Mitigation Plan is a representation
Stevens County, Washington Request for Proposal For A Countywide Multi-Jurisdictional All Hazard Mitigation Plan (Update) Project background A Multi-Jurisdictional All Hazard Mitigation Plan is a representation
1 Introduction and Planning Process Purpose Background and Scope Plan Organization... 4
 1 INTRODUCTION AND PLANNING PROCESS 1 Introduction and Planning Process... 1 1.1 Purpose... 1 1.2 Background and Scope... 1 1.3 Plan Organization... 4 1.4 Planning Process... 4 1.4.1 Multi-Jurisdictional
Section I: Introduction
 Section I: Introduction This section provides a general introduction to natural hazard mitigation planning in Clackamas County. In addition, Section I: Introduction addresses the planning process requirements
Tangipahoa Parish Hazard Mitigation Plan Update Mitigation Steering Committee Kick-off Meeting. September 9, 2014 Hammond, LA
 Tangipahoa Parish Hazard Mitigation Plan Update Mitigation Steering Committee Kick-off Meeting September 9, 2014 Hammond, LA Introductions Officials Mitigation Steering Committee members SDMI team members
COMMUNITY SUMMARY LINN COUNTY MULTI-JURISDICTIONAL HAZARD MITIGATION PLAN CITY OF LISBON
 COMMUNITY SUMMARY LINN COUNTY MULTI-JURISDICTIONAL HAZARD MITIGATION PLAN CITY OF LISBON This document provides a summary of the hazard mitigation planning information for the City of Lisbon that will
Sussex County All Hazard Mitigation Plan. Plan Executive Summary
 Sussex County All Hazard Mitigation Plan Plan Executive Summary March 2010 SUSSEX COUNTY ALL HAZARD MITIGATION PLAN SUMMARY March 2010 For questions and to make comments on this document, contact: Joseph
EXECUTIVE SUMMARY. Onondaga County Multi-Jurisdictional Planning Process
 EXECUTIVE SUMMARY The Onondaga County Multi-Jurisdictional All-Hazards Mitigation Plan was prepared in response to the Disaster Mitigation Act of 2000 (DMA 2000). DMA 2000 requires states and local governments
DeSoto Parish Hazard Mitigation Plan Update Kick-off Meeting. February 16, 2016 Grand Cane, LA
 DeSoto Parish Hazard Mitigation Plan Update Kick-off Meeting February 16, 2016 Grand Cane, LA Introductions Officials Mitigation Steering Committee members SDMI team members GOHSEP hazard mitigation team
Town of Montrose Annex
 Town of Montrose Annex Community Profile The Town of Montrose is located in the Southwest quadrant of the County, east of the Town of Primrose, south of the Town of Verona, and west of the Town of Oregon.
LOCAL MITIGATION PLAN REVIEW CROSSWALK
 INSTRUCTIONS FOR USING THE PLAN REVIEW CROSSWALK FOR REVIEW OF LOCAL MITIGATION PLANS Attached is a Plan Review Crosswalk based on the Local Multi-Hazard Mitigation Planning Guidance, published by FEMA
Village of Blue Mounds Annex
 Village of Blue Mounds Annex Community Profile The Village of Blue Mounds is located in the southwest quadrant of the County, north of the town of Perry, west of the town of Springdale, and south of the
Multi-Jurisdictional Hazard Mitigation Plan. Data Collection Questionnaire. For Local Governments
 Multi-Jurisdictional Hazard Mitigation Plan Data Collection Questionnaire County: For Local Governments Jurisdiction: Return to: Marcus Norden, Regional Planner BRP&EC Please complete this data collection
Hazard Mitigation Planning
 Hazard Mitigation Planning Mitigation In order to develop an effective mitigation plan for your facility, residents and staff, one must understand several factors. The first factor is geography. Is your
Multi-Jurisdictional Hazard Mitigation Plan. Data Collection Questionnaire. For School Districts and Educational Institutions
 Multi-Jurisdictional Hazard Mitigation Plan Data Collection Questionnaire For School Districts and Educational Institutions County: School District / Educational Institution Name: Return by: Please complete
SECTION 1. INTRODUCTION
 1.1 BACKGROUND SECTION 1. INTRODUCTION Communities, residents and businesses have been faced with continually increasing costs associated with both natural and man-made hazards. Hazard mitigation is the
SECTION 1 INTRODUCTION
 SECTION 1 INTRODUCTION This section provides a general introduction to the Mississippi Emergency Management Agency (MEMA) District 9 Regional Hazard Mitigation Plan. It consists of the following five subsections:
Crawford County Multi-Jurisdiction Natural Hazard Mitigation Plan Meramec Regional Planning Commission March 2018
 Crawford County Multi-Jurisdiction Natural Hazard Mitigation Plan Meramec Regional Planning Commission March 2018 4 Industrial Drive, St. James, MO 65559 Phone: (573) 265-2993 Fax: (573) 265-3550 Crawford
Iberia Parish Hazard Mitigation Plan Update Plan Steering Committee Kick-off Meeting
 Iberia Parish Hazard Mitigation Plan Update Plan Steering Committee Kick-off Meeting July 9, 2014 Iberia Parish Council Chambers New Iberia, Louisiana Introductions Officials Steering Committee members
PLANNING PROCESS. Table of Contents. List of Tables
 PLANNING PROCESS Table of Contents 1.1 Narrative Description of the Planning Process... 1-1 1.2 Steering Committee & Public Involvement... 1-7 1.2.1 Steering Committee Participant Solicitation... 1-7 1.2.2
Executive Summary. Introduction and Purpose. Scope
 Executive Summary Introduction and Purpose This is the first edition of the Los Angeles Unified School District All-Hazard Mitigation Plan, and through completion of this plan the District continues many
COMMUNITY SUMMARY LINN COUNTY MULTI-JURISDICTIONAL HAZARD MITIGATION PLAN CITY OF CENTRAL CITY
 COMMUNITY SUMMARY LINN COUNTY MULTI-JURISDICTIONAL HAZARD MITIGATION PLAN CITY OF CENTRAL CITY This document provides a summary of the hazard mitigation planning information for the City of Central City
EXECUTIVE SUMMARY. Greater Greenburgh Planning Area Planning Process
 EXECUTIVE SUMMARY The Greater Greenburgh Planning Area All-Hazards Mitigation Plan was prepared in response to the Disaster Mitigation Act of 2000 (DMA 2000). DMA 2000 requires states and local governments
ANNEX B: TOWN OF BLUE RIVER
 ANNEX B: TOWN OF BLUE RIVER B.1 Community Profile Figure B.1 shows a map of the Town of Blue River and its location within Summit County. Figure B.1. Map of Blue River Summit County (Blue River) Annex
LOCAL MITIGATION PLAN REVIEW TOOL
 LOCAL MITIGATION PLAN REVIEW TOOL The Local Mitigation Plan Review Tool demonstrates how the Local Mitigation Plan meets the regulation in 44 CFR 201.6 and offers States and FEMA Mitigation Planners an
CHAPTER THREE Natural Hazard Mitigation Strategy
 CHAPTER THREE Natural Hazard Mitigation Strategy Chapter 3 Section All Sections Updates to Section Revised Natural Hazards Introduction and all Sections to change Natural Hazards Subcommittee to Committee.
Northern Kentucky University 2018 Hazard Mitigation Plan. Public Kick-Off Meeting March 20, 2018
 Northern Kentucky University 2018 Hazard Mitigation Plan Public Kick-Off Meeting March 20, 2018 Agenda Welcome Hazard Mitigation Planning 101 Hazard Identification Exercises Next Steps Jeff Baker, NKU
REQUEST FOR PROPOSALS. Planning in Water s Way: Flood Resilient Economic Development Strategy for the I-86 Innovation Corridor
 REQUEST FOR PROPOSALS Planning in Water s Way: Flood Resilient Economic Development Strategy for the I-86 Innovation Corridor Southern Tier Central Regional Planning and Development Board (STC) is seeking
SECTION 6 - RANGE OF ALTERNATIVE MITIGATION ACTIONS CONSIDERED
 SECTION 6 - RANGE OF ALTERNATIVE MITIGATION ACTIONS CONSIDERED For this hazard mitigation plan to be approved by FEMA, each participating jurisdiction was required to identify and analyze a comprehensive
Hazard Mitigation & Resiliency
 Hazard Mitigation & Resiliency Goal: Encourage resiliency and sustainable development by protecting development from natural hazards. In Maryland Heights, the Comprehensive Plan is the responsibility of
HAZARD MITIGATION PLANNING
 HAZARD MITIGATION PLANNING Oswego County HMP Update Working Group Kickoff Meeting September 27, 2017 Agenda Welcoming Remarks Oswego County Emergency Management DHSES FEMA Introduce Executive Committee
Lake County Hazard Identification and Risk Assessment Plan Lake County Hazard Mitigation Committee
 Lake County Hazard Identification and Risk Assessment Plan Lake County Hazard Mitigation Committee Request for Proposals Bid Deadline: Hard Copy Due 4:00 PM Mountain Standard Time (MST) Friday March 9,
LOCAL MITIGATION PLAN REVIEW TOOL
 LOCAL MITIGATION PLAN REVIEW TOOL The Local Mitigation Plan Review Tool demonstrates how the Local Mitigation Plan meets the regulation in 44 CFR 201.6 and offers States and FEMA Mitigation Planners an
LOCAL MITIGATION PLAN REVIEW TOOL
 LOCAL MITIGATION PLAN REVIEW TOOL The Local Mitigation Plan Review Tool demonstrates how the Local Mitigation Plan meets the regulation in 44 CFR 201.6 and offers States and FEMA Mitigation Planners an
Garfield County NHMP:
 Garfield County NHMP: Introduction and Summary Hazard Identification and Risk Assessment DRAFT AUG2010 Risk assessments provide information about the geographic areas where the hazards may occur, the value
Justification for Floodplain Regulatory Standards in Illinois
 Justification for Floodplain Regulatory Standards in Illinois Office of Water Resources Issue Paper April, 2015 Proactive Illinois floodplain and floodway regulatory standards have prevented billions of
1.1. PURPOSE 1.2. AUTHORITIES 1. INTRODUCTION
 1. INTRODUCTION This section briefly describes hazard mitigation planning requirements, associated grants, and this Standard State Hazard Mitigation Plan (SHMP) update s composition. HMPs define natural
Stoddard County Natural Hazard Mitigation Plan-Five Year Update SECTION 3
 SECTION 3 CITY/COUNTY CAPABILITY ASSESSMENT Mitigation Management Policies This section is an update from the approved Stoddard County 2004 Plan. Specific updates include new information on population
TABLE OF CONTENTS. Foreword... i. Executive Summary...1. Prerequisites... P.1. Participating Jurisdictions... P.1. Participation Requirements... P.
 TABLE OF CONTENTS Foreword... i Executive Summary...1 Prerequisites... P.1 Participating Jurisdictions... P.1 Participation Requirements... P.2 Record of Participation... P.3 Sample Adoption Resolution...
APPENDIX D PLANNING PROCESS DOCUMENTATION
 APPENDIX D PLANNING PROCESS DOCUMENTATION This appendix includes the following: 1. Meeting Agendas 2. Meeting Minutes 3. Meeting Sign-In Sheets 4. Public Survey Summary Results 1) Introductions AGENDA
East Hartford. Challenges
 East Hartford The Town of East Hartford is a suburban community of approximately 52,212 located east of the City of Hartford and west of the Town of Manchester. The Town covers slightly more than 18 square
1 Rare Hazard event is not likely to occur within 100 years. 2 Occasional Hazard event is likely to occur within 100 years
 5.3 HAZARD RANKING After the hazards of concern were identified for Onondaga County, the hazards were ranked to describe their probability of occurrence and their impact on population, property (general
Simsbury. Challenges Capitol Region Natural Hazards Mitigation Plan Update - Page 356
 Simsbury Simsbury is a suburban community of about 23,600 located in the western portion of the Capitol Region. Its land area encompasses 33.9 square miles. Elevation in town generally ranges from about
Hazard Mitigation Plan Planning Perspective
 7. A. Hazard Mitigation Plan Planning Perspective B. Public Meeting Notice A. Hazard Mitigation Plan Planning Perspective York County Hazard Mitigation Plan Hazard Mitigation Plan Planning Perspective
Delaware River Basin Commission s Role in Flood Loss Reduction Efforts
 Delaware River Basin Commission s Role in Flood Loss Reduction Efforts There is a strong need to reduce flood vulnerability and damages in the Delaware River Basin. This paper presents the ongoing role
EMERGENCY MANAGEMENT
 -29- -30- -31- -32- EMERGENCY MANAGEMENT Plan and prepare for, respond to, and recover from natural and human made disasters in a coordinated response utilizing our local government and agency resources.
Natural Hazard Mitigation Plan 5-Year Update Progress Report Chippewa County Taskforce Committee January 29, 2013
 Natural Hazard Mitigation Plan 5-Year Update Progress Report Chippewa County Taskforce Committee January 29, 2013 Allegan County, June, 2010 Photo courtesy Peter Olson Chapter Updates Chapter 1 Introduction»
HAZARD MITIGATION PLAN POINT OF CONTACT MUNICIPAL PROFILE
 HAZARD MITIGATION PLAN POINT OF CONTACT northcatasauquaema@yahoo.com scheirerg@gmail.com MUNICIPAL PROFILE MUNICIPAL PARTICIPATION Compliance with the National Flood Insurance Program (NFIP) Identify source
Strategies for Increasing Flood Resiliency
 Strategies for Increasing Flood Resiliency Flood Hazard Mitigation Steve Ferryman, CFM Mitigation Branch Chief Ohio Emergency Management Agency Ohio EMA Mitigation Branch The mission of the Mitigation
In 1993, spring came in like a lion, but refused
 36 UNIVERSITIES COUNCIL ON WATER RESOURCES ISSUE 130, PAGES 36-40, MARCH 2005 FEMA and Mitigation: Ten Years After the 1993 Midwest Flood Norbert Director of Federal Insurance and Mitigation Division Federal
ASFPM Partnerships for Statewide Mitigation Actions. Alicia Williams GIS and HMP Section Manager, Amec Foster Wheeler June 2016
 ASFPM Partnerships for Statewide Mitigation Actions Alicia Williams GIS and HMP Section Manager, Amec Foster Wheeler June 2016 Summary The Concept Leveraging Existing Data and Partnerships to reduce risk
Natural Hazards Mitigation Plan Kankakee County, Illinois Executive Summary
 1. Introduction Natural Hazards Mitigation Plan Kankakee County, Illinois Executive Summary Kankakee County is subject to natural hazards that threaten life, safety, health, and welfare and cause extensive
Georgia Flood M.A.P. Program
 Georgia Flood M.A.P. Program Georgia Flood M.A.P. Program The Upper Chattahoochee River Basin Risk MAP Project Transitioning State Program to align with FEMA s Risk MAP Program Increase focus on risk assessment
44 CFR Local Mitigation Plans.
 Page 1 of 5 44 CFR 201.6 - Local Mitigation Plans. Code of Federal Regulations - Title 44: Emergency Management and Assistance Updated to: October 01, 2010 Linked as: 0 CONTENT BLOCKED! Text Title 44:
PART 3 LOCAL MITIGATION PLANS
 PART 3 LOCAL MITIGATION PLANS Local Mitigation Plan requirements in 44 CFR, Part 201.6 of the Interim Final Rule (the Rule) apply to both local jurisdictions and Tribal governments that elect to participate
Michael Taylor, PE, CFM Project Manager, AECOM August 25, 2015
 Promoting FEMA s Flood Risk Products in the Lower Levisa Watershed Michael Taylor, PE, CFM Project Manager, AECOM August 25, 2015 Agenda Study Background Flood Risk Product Overview AOMI and Mitigation
Local Hazard Mitigation Plan Review. FEMA Region VI and the State of Texas
 Appendix E: Local Hazard Mitigation Plan Review For FEMA Region VI and the State of Texas LOCAL HAZARD MITIGATION PLAN REVIEW FOR PAGE 1 FEMA REGION 6 AND STATE OF TEXAS FOR FEMA USE ONLY Instructions
TERREBONNE PARISH HAZARD MITIGATION PLAN UPDATE
 TERREBONNE PARISH HAZARD MITIGATION PLAN UPDATE HAZARD MITIGATION PLAN UPDATE COMMITTEE KICK-OFF MEETING May 22, 2014 A World of Solutions 0 PRESENTATION AGENDA I. INTRODUCTIONS AND WELCOME II. PURPOSE,
SECTION 3: PLANNING PROCESS
 INTRODUCTION This section includes a description of the planning process used to develop the HMP, including how it was prepared, who was involved in the process, and how the public was involved. To ensure
Planning Process---Requirement 201.6(b): An open public involvement process is essential to the development of an effective plan.
: An open public involvement process is essential to the development of an effective plan.") Section 3 Capability Identification Requirements Planning Process---Requirement 201.6(b): An open public involvement process is essential to the development of an effective plan. Documentation of the Planning
Section 3 Capability Identification Requirements Planning Process---Requirement 201.6(b): An open public involvement process is essential to the development of an effective plan. Documentation of the Planning
On Page 4, following the Planning Process subsection, insert the following: 2012 Committee members included:
 Appendix C: City of Estacada Addendum to the Clackamas County Natural Hazards Mitigation Plan 2012 Amendments and Update The Oregon Partnership for Disaster Resilience prepared this Appendix to the City
Priority Ranking. Timeframe. Faribault County Blue Earth, Bricelyn, Delavan, Easton, Elmore, Frost, Kiester, Minnesota Lake, Walters, Wells, Winnebago
 Multi-Hazard Plan, 2017 Table G - 11. Actions Identified for by the () (From Master Action Chart) Action /City Comments on 1 All-Hazards Education & Awareness Programs Work to ensure that all residents
Challenges. Estimated Damages from 100-Year Flood
 Newington Newington is a fully suburban town in central Connecticut with a population of about 30,562. The Town encompasses 13.2 square miles and ranges in elevation from 40-350 feet above sea level. The
LOCAL HAZARD MITIGATION PLAN REVIEW FEMA REGION VI AND STATE OF TEXAS
 LOCAL HAZARD MITIGATION FEMA REGION VI AND STATE OF TEXAS Instructions for using the attached Crosswalk Reference Document for Review and Submission of Local Mitigation Action Plans to the State Hazard
Name Category Web Site Address Description Army Corps of Engineers Federal
 Version 4.0 Page 12-1 SECTION 12. ANNEX A: RESOURCES The following resources were used in the development and update of the Las Virgenes-Malibu Council of Governments. In addition to the resources listed,
HAZARD MITIGATION PLAN POINT OF CONTACT. MUNICIPAL PROFILE
 HAZARD MITIGATION PLAN POINT OF CONTACT troseberry@easton-pa.gov cmanges@easton-pa.gov MUNICIPAL PROFILE MUNICIPAL PARTICIPATION Compliance with the National Flood Insurance Program (NFIP) Identify source
APPENDIX A: REFERENCES
 APPENDIX A: REFERENCES 2002 Census of Agriculture. http://www.agcensus.usda.gov/ 2007 Kansas Severe Weather Awareness Week Information Packet. National Weather Service. 2007. www.crh.noaa.gov/image/top2007kansas.pdf
INTRODUCTION 1. INTRODUCTION 1.1 HAZARD MITIGATION PLANNING 1.2 PLANNING REQUIREMENTS Local Mitigation Plans
 1. INTRODUCTION INTRODUCTION This section provides a brief introduction to hazard mitigation planning, local mitigation plan requirements, the grants associated with these requirements, and a description
HAZARD MITIGATION PLAN POINT OF CONTACT MUNICIPAL PROFILE
 HAZARD MITIGATION PLAN POINT OF CONTACT tatamy1@rcn.com dwerkheiser@tatamypa.com MUNICIPAL PROFILE MUNICIPAL PARTICIPATION Topic Identify source of information, if different from the one listed Additional
HAZARD MITIGATION PLAN POINT OF CONTACT MUNICIPAL PROFILE
 HAZARD MITIGATION PLAN POINT OF CONTACT nazareth50em1@gmail.com jessicagteel@gmail.com MUNICIPAL PROFILE MUNICIPAL PARTICIPATION 3. Describe how the public will be engaged in the current planning process
Flood Risk Products. New Techniques for Identifying and Communicating Flood Risk
 Flood Risk Products New Techniques for Identifying and Communicating Flood Risk Mark Zito, GISP, CFM GIS Specialist Amol Daxikar, GISP, CFM Project Manager March 28, 2012 1% Flood with 3 Feet Sea Level
9.10 HEIDELBERG TOWNSHIP
 9.10 HEIDELBERG TOWNSHIP This section presents the jurisdictional annex for Heidelberg Township. A. HAZARD MITIGATION PLAN POINT OF CONTACT Name Title/ Department Address Telephone Fax Email Primary Point
Section 1: Introduction
 Section 1: Introduction [SEMO ELECTRIC COOPERATIVE] May 18, 2012 SEMO Electric Cooperative (SEMOEC) was established in 1938 to provide electric service to the rural areas of southeast Missouri. SEMOEC
Mitigation Measures: Sound Investments in Disaster Recovery
 ISSUE 14 EDITOR S NOTE While FEMA is best known for emergency assistance after a disaster, the agency s support of mitigation programs to help identify and reduce risks to life and property before a disaster
HAZARD MITIGATION PLAN POINT OF CONTACT MUNICIPAL PROFILE
 HAZARD MITIGATION PLAN POINT OF CONTACT hankvb@entermail.net khorvath@kceinc.com MUNICIPAL PROFILE MUNICIPAL PARTICIPATION Compliance with the National Flood Insurance Program (NFIP) Topic 1. Staff Resources
SECTION 6: MITIGATION STRATEGIES
 SECTION 6: MITIGATION STRATEGIES This section presents mitigation actions for Somerset County to reduce potential exposure and losses identified as concerns in the Risk Assessment portion of this plan.
Avon. Challenges. Estimated Damages from 100- Year Flood
 Avon Avon is a suburban town in north-central Connecticut with a population of about 18,000. It has an average elevation of about 350 ft. The Town encompasses 23.5 square miles, lying entirely within the
APPENDIX B: CITIZEN SURVEY
 APPENDIX B: CITIZEN SURVEY B1 CONVERSE COUNTY HAZARD MITIGATION PLAN SURVEY March 30, 2011 Prepared for: Converse County Emergency Management Agency Prepared by: Ken Markert, AICP MMI Planning Cody, WY.
Osceola County Hazard Mitigation Plan. Part 3 - Mitigation Strategy
 Osceola County Hazard Mitigation Plan Part 3 - Mitigation Strategy Osceola County Hazard Mitigation Plan - Part 3 Mitigation Strategy 3-1 Contents Tables and Figures... 3 Overview... 4 Strategy... 4 Goals...
Modernization, FEMA is Recognizing the connection between damage reduction and
 EXECUTIVE SUMMARY Every year, devastating floods impact the Nation by taking lives and damaging homes, businesses, public infrastructure, and other property. This damage could be reduced significantly
PUBLIC SURVEY FOR HAZARD MITIGATION PLANNING
 PUBLIC SURVEY FOR HAZARD MITIGATION PLANNING We need your help! The Counties of Cherokee, Graham, Haywood, Jackson, Swain, and the Eastern Band of Cherokee Indians are currently engaged in a planning process
9.8 FOUNTAIN HILL BOROUGH
 9.8 FOUNTAIN HILL BOROUGH This section presents the jurisdictional annex for Fountain Hill Borough. A. HAZARD MITIGATION PLAN POINT OF CONTACT Name Title/ Department Address Telephone Fax Email Primary
Section 1: Introduction
 [PEMISCOT-DUNKLIN ELECTRIC COOPERATIVE] May 18, 2012 Section 1: Introduction Pemiscot-Dunklin Electric Cooperative (PDEC) was established in 1937 to provide electric service to the rural areas of southeast
Appendix A. Mitigation Plan Crosswalk
 Appendix A Mitigation Plan Crosswalk Local Mitigation Plan Review and Approval Status Jurisdiction: Multi-jurisdictional Plan; 43 municipalities in Mercer, Hunterdon, Warren and Sussex Counties (see list
REQUEST FOR PROPOSAL FOR THE 5-YEAR UPDATE OF THE OTSEGO COUNTY MULTI-JURISDICTIONAL MULTI- HAZARD MITIGATION PLAN
 REQUEST FOR PROPOSAL FOR THE 5-YEAR UPDATE OF THE OTSEGO COUNTY MULTI-JURISDICTIONAL MULTI- HAZARD MITIGATION PLAN 2013-2018 Submitted by the Otsego County Planning Department Prepared by the Otsego County
Section 1: Introduction
 Section 1: Introduction [WEBSTER ELECTRIC COOPERATIVE] May 18, 2012 Webster Electric Cooperative (WEC) was established in 1946 to provide electric service to the rural areas of southwest Missouri. A Touchstone
Somerset County Mitigation Plan Update
 Somerset County Multi-Jurisdictional Hazard Mitigation Plan Update Kickoff Meeting Agenda Kickoff Meeting September 28, 2017 6:00 pm SCES, 402 Roycefield Road, Hillsborough, NJ Welcome and Opening Remarks.....
Natural Hazards Risks in Kentucky. KAMM Regional Training
 Natural Hazards Risks in Kentucky KAMM Regional Training Floodplain 101 Kentucky has approximately 92,000 linear miles of streams and rivers Approximately 31,000 linear miles have mapped flood hazards