Project Prattville : : The Next Chapter
|
|
|
- Madeline Powell
- 6 years ago
- Views:
Transcription
1


2 Welcome Introductions How Well Do You Know Prattville? Comp Planning 101 Schedule & Products Prattville in 2008 Questions & Answers The Planning Stations Next Steps


3 Project Team Urban Collage Urban Design Sain Associates Transportation Market + Main Economics Contente Consulting Community Planning PBS&J/Birmingham Transportation


4 How Well Do You Know Prattville?


5 Comp Planning 101 Three Elements: o Land Use o Transportation ti o Economics Three Parts: o Inventory & Assessment o Framework & Concepts o Policy & Implementation


6 Land Use


7 Transportation


8 Economics


9 Inventory & Assessment

10 Framework & Concepts


11 Policy & Implementation


12 Why Plan? Anticipate Growth Plan Infrastructure Add Amenities Maintain Identity
13 Schedule


14 Process Client Team Advisory Group Stakeholder Interviews Public Meetings Website


15 Still Think You Know Prattville?


16 Prattville in 2008


17 Aerial : 1950


18 Aerial : 1966


19 Aerial : 1998


20 Aerial : 2007


21 Land Use Population: 32,000 (2007) Park acreage per person: 0.08 Population Density: 1.72 residents per acre


22 Agricultural 2,731 acres 14.7%


23 Commercial 710 acres 3.8%
24 Industrial 209 acres 1.1%

25 Institutional 1,040 acres 5.6%

26 Office 109 acres 0.6%


27 Open Space 1,525 acres 8.2%


28 Residential 7,920 acres 42.6%

29 Utilities 108 acres 0.6%


30 Vacant 4,214 acres 22.7%


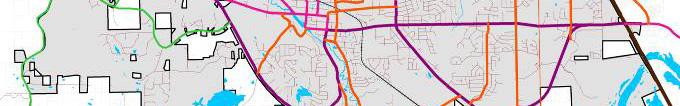
31 Road Network


32 Bicycle Routes Proposed


33 Sustainability Commercial Centers Parks Sh Schools Walkability Driveability
34 Commercial Centers Centroids
35 Commercial Centers Walkability (Quarter-Mile Buffers)
36 Commercial Centers Drivability (One- Mile Buffers)

37 Commercial Centers Combination
38 Parks Centroids

39 Parks Walkability (Quarter-Mile Buffers)

40 Parks Drivability (One- Mile Buffers)

41 Parks Combination

42 Schools Centroids
43 Schools Walkability (Quarter-Mile Buffers)
44 Schools Drivability (One- Mile Buffers)


45 Schools Combination

46 Walkability Rank 1 Rank 2 Rank 3 Rank 4 Non- Residential


47 Drivability Rank 1 Rank 2 Rank 3 Rank 4 Non- Residential
48 Analysis Older parts of town are better connected Amenities in short supply to west and south Good number of parks, but still below standard in acreage School walkability level is low Drivability is very good


49 Transportation Study Traffic Counts Field Data Collection Signal Timing Downtown Parking Data Targeted Parking Supply Transportation Characteristics


50 Existing Transportation Characteristics Strongly automobile oriented Low to moderate congestion Good street connectivity Heavy commuter flow to Montgomery Limited mode choices (bike, transit, etc.)


51 Transportation Considerations for the Future Focus on managing the existing system Limited funding for new construction Needs of an aging population Demand for more travel mode choice


52 Socioeconomic Findings
53 Statistics Reviewed Population Age Distribution Racial Composition Educational Attainment Per Capita Income Household Income Total Employment Sector Employment Households Housing Total Labor Force Labor Force Participation Rate Unemployment Commuting Patterns Employers Business Size Sources of Income Wages Sector Wages
54 Key Socioeconomic Findings Rapid Growth Prattville growth of 25% since 2000 Prattville growth of 12% btwn Prattville growth above County averages, 4x Montgomery MSA average, & 3x national average Almost 25% of Prattville housing stock built since 2000 Prattville younger than AL & US, but growth expected in older age groups
55 Population Change Comparison, % Population 30% Age Distribution 25% Racial Composition Educational Attainment 20% 15% 20.4% Per Capita Income 24.6% Household Income 12.3% 10% Total Employment Sector Employment 5% Households 0% Housing City of Prattville Autauga County Elmore County Montgomery MSA United States Source: US Census Bureau, Claritas, Market + Main, Inc.
56 Age Distribution Changes, City of Prattville, Population 75 to 84 Age Distribution 65 to 74 Racial Composition 55 to 64 25% 26% 29% 30% 45 to 54 Educational 15% Attainment 35 to 44-3% Per Capita Income 25 to 34 Household Income 18 to 24 Total Employment 15 to 17 Sector Employment 5 to 14 Households 0 to 4 Housing 2% 10% 17% 10% 13% -5% 0% 5% 10% 15% 20% 25% 30% 35% Source: Claritas, Market + Main, Inc.
57 Key Socioeconomic Findings High Wealth & Education Levels Prattville s per capita income & average household h income is higher than County averages & MSA average, but below US 16% of households h earn above $100, % of households earn less than $25,000 Prattville has fewer population p with less than high school education Prattville has more population with college degrees than Counties, but just under MSA & US
58 Average Household Income Trends, $80, % $70,000 $60, City of Prattville Montgomery MSA US % of National Average $63,978 $71,585 95% $53,351 94% Population $50,000 94% 94% Age Distribution $40,000 90% $30,000 Racial Composition $20,000 85% Educational Attainment $10,000 $ Per Capita Income Source: US Census Bureau, Claritas, Market + Main, Inc. Household Income Total Employment Sector Employment $35,000 $30,000 $25,000 $20,000 $15,000 80% Per Capita Income Trends, $19,827 City of Prattville Montgomery MSA US % of National Average 92% $24,377 94% $27,763 96% 100% 95% 90% Households Housing $10,000 $5,000 85% $ % Source: US Census Bureau, Claritas, Market + Main, Inc.
59 City of Prattville, Change in Household Income, $0 - $15,000 Population -10% -13% $15,000 - $24,999 Age Distribution $25,000 Racial - $34,999Composition -7% $35,000 Educational - $49,999 Attainment $50,000 - $74,999-12% -5% Per Capita Income $75,000 - $99,999 Household Income Total Employment $100,000 - $149,999 5% 26% Sector Employment 61% $150,000 - $249,999 Households $250,000 + Housing -20% -10% 0% 10% 20% 30% 40% 50% 60% 70% 39% Source: Claritas
60 Educational Attainment Comparison, % Population 30% Age Distribution 25% Racial Composition Educational 20% Attainment Per Capita Income 15% Household Income 10% 15.0% Total Employment Sector Employment 5% Households 30.3% City of Prattville Montgomery MSA United States 23.9% 0% Housing Less Than High School High School Graduates College Graduates Source: US Census Bureau, Claritas
61 Key Socioeconomic Findings Status in the Metro Area Prattville wealthier than MSA as a whole Prattville has larger average household size & fewer single-person households than MSA as a whole Prattville employment has grown faster than MSA as a whole since 2000 Prattville has significant retail concentration compared to MSA as a whole
62 Sector Employment Comparison, City of Prattville and Montgomery MSA, 2008 Population Public Administration Age Distribution Services Racial Composition Finance/Insurance/Real Estate Educational Attainment Retail Trade Per Wholesale Capita Trade Income Household Income Transp./Comm./Utilities Total Employment Manufacturing Sector Employment Households Housing Construction Source: Claritas, Bureau of Economic Analysis 5.5% 25.4% 5.1% 47.2% Montgomery MSA 4.7% City of Prattville 3.0% 2.9% 5.3% 0% 5% 10% 15% 20% 25% 30% 35% 40% 45% 50%
63 Socioeconomic Findings Summary Growth is here & still coming Strategically guide it, embrace increased diversity, ensure housing & employment Strong wealth & education Closely l linked, many work outside City, concerns for unskilled & semi-skilled workers, long-term training/workforce development Role in the Metro Area Bedroom community, families, commercial businesses follow residents, retail job growth is double-edged, edged jobs/housing balance


64 Questions & Answers


65 Planning Stations Project Prattville Logo Live and Work Transportation ti Hot Spots Change vs. Preserve The 1996 Plan Refreshment Comment Cards


66 Next Steps Planning Stations Questions & Comments Public Workshop in February
Market and Fiscal Impact Analysis of the Phase 2 Metrorail Extension to Loudoun County. Loudoun County April 19, 2011
 Market and Fiscal Impact Analysis of the Phase 2 Metrorail Extension to April 19, 2011 BACKGROUND AND OBJECTIVES RCLCO (Robert Charles Lesser & Co.) is a national real estate advisory firm based in Bethesda
Economic Profile. Capital Crossroads. a vision forward
 Economic Profile Capital a vision forward This profile was prepared by: Liesl Eathington Department of Economics State University phone: (515) 294 2954 email: leathing@iastate.edu 5/23/2012 Distribution
Pendleton County Labor Market Summary Update November 2006
 1 Labor Market Summary Update November 26 Copyright 26 WVU Research Corporation College of Business and Economics West Virginia University www.bber.wvu.edu by George W. Hammond, Ph.D. Anthony Gregory This
Historical and Projected Population Totals in Maryland,
 Growth and Land Use Trends Population Trends From 2000-2030 Maryland will grow by nearly 1.4 million people. Specifically, this growth will mean the difference between 5.3 million people in 2000 to 6.7
Grant County Labor Market Summary Update November 2006
 County Labor Market Summary Update November 26 Copyright 26 WVU Research Corporation College of Business and Economics West Virginia University www.bber.wvu.edu by George W. Hammond, Ph.D. Anthony Gregory
Population Change in the West Data Sources and Methods December, 2014
 Population Change in the West Data Sources and Methods December, 2014 This document describes the data sources and methods used to generate the interactive data tool, Migration and Population Trends in
Demographic and Economic Profile. North Dakota. Updated June 2006
 Demographic and Economic Profile North Dakota Updated June 2006 Metro and Nonmetro Counties in North Dakota Based on the most recent listing of core based statistical areas by the Office of Management
Pennsylvania. Demographic and Economic Profile. Metro and Nonmetro Counties in Pennsylvania
 Demographic and Economic Profile Pennsylvania Updated June 2006 Metro and Nonmetro Counties in Pennsylvania Based on the most recent listing of core based statistical areas by the Office of Management
Review and Update of Year 2035 Regional Transportation Plan
 Review and Update of Year 2035 Regional Transportation Plan #217752 1 Background Every four years, the Year 2035 Plan is reviewed Elements of review Validity of Plan Year 2035 forecasts Transportation
STAFF REPORT Regional Transportation Plan/Sustainable Communities Strategy (RTP/SCS) Scenario Performance Update for Board Direction
 Scenario Performance Update for Board Direction") November 2017 Board of Directors STAFF REPORT SUBJECT: RECOMMENDED ACTION: 2018 Regional Transportation Plan/Sustainable Communities Strategy (RTP/SCS) Scenario Performance Update for Board Direction Support
November 2017 Board of Directors STAFF REPORT SUBJECT: RECOMMENDED ACTION: 2018 Regional Transportation Plan/Sustainable Communities Strategy (RTP/SCS) Scenario Performance Update for Board Direction Support
Executive Summary 1/3/2018
 Executive Summary 1/3/2018 EXECUTIVE SUMMARY This comprehensive plan was prepared by the City of Langley in accordance with Section 36.70A.070 of the Growth Management Act (GMA). The plan guides future
ECONOMIC ISSUES AND OPPORTUNITIES PAPER
 ECONOMIC ISSUES AND OPPORTUNITIES PAPER Introduction The purpose of this paper is to identify important economic issues that need to be addressed in order to create policy options for the City of Simi
TRANSIT ORIENTED DEVELOPMENT IN THE PORTLAND METRO REGION
 TRANSIT ORIENTED DEVELOPMENT IN THE PORTLAND METRO REGION Presented by: Megan Gibb What is Metro Directly elected regional government Serves more than 1.4 million residents in Clackamas, Multnomah and
COMPREHENSIVE PLAN UPDATE EXECUTIVE SUMMARY. Plan Abstract
 Village of Swansea, Illinois 10/26/2017 Executive Summary COMPREHENSIVE PLAN UPDATE EXECUTIVE SUMMARY A Plan Abstract The following are excerpts from Swansea s 2017 Comprehensive Plan Update Comprehensive
CITY OF STRATFORD OFFICIAL PLAN REVIEW BACKGROUND REPORT DEMOGRAPHIC AND ECONOMIC PROFILE AND POPULATION AND HOUSING GROWTH FORECAST NOVEMBER 21, 2012
 CITY OF STRATFORD OFFICIAL PLAN REVIEW BACKGROUND REPORT DEMOGRAPHIC AND ECONOMIC PROFILE AND POPULATION AND HOUSING GROWTH FORECAST NOVEMBER 21, 2012 IN ASSOCIATION WITH: CONTENTS Page 1. INTRODUCTION
4.3 Economic and Fiscal Impacts
 4.3 This section evaluates the potential economic, and fiscal impacts that could arise from the construction and long-term operation of the proposed East San Fernando Valley Transit Corridor Project. 4.3.1
TEX Rail Fort Worth, Texas Project Development (Rating Assigned November 2012)
") TEX Rail Fort Worth, Texas Project Development (Rating Assigned November 2012) Summary Description Proposed Project: Commuter Rail 37.6 Miles, 14 Stations (12 new, two existing) Total Capital Cost ($YOE):
TEX Rail Fort Worth, Texas Project Development (Rating Assigned November 2012) Summary Description Proposed Project: Commuter Rail 37.6 Miles, 14 Stations (12 new, two existing) Total Capital Cost ($YOE):
TRANSPORTATION 7. THE LEVEL OF SERVICE (LOS) FOR COUNTY SUBJECT: HIGHWAY LEVELS OF SERVICE. Current LOS for roads and intersections
 FOR COUNTY SUBJECT: HIGHWAY LEVELS OF SERVICE. Current LOS for roads and intersections") TRANSPORTATION BENCHMARK INDICATOR 7. THE LEVEL OF SERVICE (LOS) FOR COUNTY ARTERIAL ROADS WILL BE MAINTAINED. Current LOS for roads and intersections SUBJECT: HIGHWAY LEVELS OF SERVICE One of the foundations
TRANSPORTATION BENCHMARK INDICATOR 7. THE LEVEL OF SERVICE (LOS) FOR COUNTY ARTERIAL ROADS WILL BE MAINTAINED. Current LOS for roads and intersections SUBJECT: HIGHWAY LEVELS OF SERVICE One of the foundations
2016 Labor Market Profile
 2016 Labor Market Profile Prepared by The Tyler Economic Development Council Tyler Area Sponsor June 2016 The ability to demonstrate a regions availability of talented workers has become a vital tool
DRCOG is local officials working together to address the region's challenges for today and tomorrow. Metro Vision 2040
 DRCOG is local officials working together to address the region's challenges for today and tomorrow A plan to make life better for people of all ages, incomes and abilities Equitable sharing of costs and
Demographic and Economic Profile. New Mexico. Updated June 2006
 Demographic and Economic Profile New Mexico Updated June 2006 Metro and Nonmetro Counties in New Mexico Based on the most recent listing of core based statistical areas by the Office of Management and
City of Utica Central Industrial Corridor ReVITALization Plan Appendix A. Socio-Economic Profile
 City of Utica Central Industrial Corridor ReVITALization Plan Appendix A. Socio-Economic Profile Population Graphic 1 City of Utica Population Change: 1960-2010 Since the 1960s, the population of Utica
Utah. Demographic and Economic Profile. Metro and Nonmetro Counties in Utah
 Demographic and Economic Profile Utah Updated July 2006 Metro and Nonmetro Counties in Utah Based on the most recent listing of core based statistical areas by the Office of Management and Budget (December
4. Please indicate whether you feel that there are too many, the right amount or not enough of each of the following in Littleton:
 Please complete this questionnaire if you are the person most knowledgeable about this business, typically the owner or manager. Please select the response (by circling the number or checking the box)
Littleton, CO 2016 Business Survey
 Littleton, CO 2016 Business Survey June 2016 2955 Valmont Road Suite 300 Boulder, CO 80301 303-444-7863 www.n-r-c.com Contents Executive Summary... 1 Background and Methods... 3 Business Survey Results...
PUBLIC DISCLOSURE. September 4, 2001 COMMUNITY REINVESTMENT ACT PERFORMANCE EVALUATION CITIZENS BANK OF EDMOND RSSD#
 PUBLIC DISCLOSURE COMMUNITY REINVESTMENT ACT PERFORMANCE EVALUATION CITIZENS BANK OF EDMOND RSSD# 172457 ONE EAST 1 st STREET, P.O. BOX 30 EDMOND, OKLAHOMA 73034 Federal Reserve Bank of Kansas City 925
EVEREST. Retail Investment Opportunity. Ivy Hills Retail Center 7397 Main Street Newtown, OH CONTACT: Chris Nachtrab.
 Retail Investment Opportunity CONTACT: Chris Nachtrab chris.nachtrab@everestrealestate.com 513/769-2509 John Thompson john.thompson@everestrealestate.com 513/769-2514 Ivy Hills Retail Center 7397 Main
Urban Action Agenda Community Profiles COVER TO GO HERE. City of Beacon
 Urban Action Agenda Community Profiles COVER TO GO HERE City of Beacon COMMUNITY OVERVIEW MAP POPULATION & DEMOGRAPHICS Population Basics 27,828 Population (2015) Population Change 9.6% since 2000 5.1
2017 Annual Indicator Report
 Are We Living Our Values?... 1 Ecosystem Stewardship Indicators... 2 Ecosystem Stewardship Takeaways... 5 Next Steps in Ecosystem Stewardship... 5 Growth Management Indicators... 6 Growth Management Takeaways.
CHAPTER 3 POPULATION AND ECONOMIC CHARACTERISTICS
 CHAPTER 3 POPULATION AND ECONOMIC CHARACTERISTICS INTRODUCTION Population trends in La Vista and its respective planning jurisdiction serve as valuable indicators of future development needs and patterns
MORGANTOWN METROPOLITAN STATISTICAL AREA OUTLOOK COLLEGE OF BUSINESS AND ECONOMICS. Bureau of Business and Economic Research
 2013 MORGANTOWN METROPOLITAN STATISTICAL AREA OUTLOOK COLLEGE OF BUSINESS AND ECONOMICS Bureau of Business and Economic Research 1 MORGANTOWN METROPOLITAN STATISTICAL AREA OUtlook 2013 EXECUTIVE SUMMARY
4.12 POPULATION AND HOUSING
 4.12 POPULATION AND HOUSING 4.12.1 INTRODUCTION This section describes the existing socioeconomic conditions, including population, housing, and employment, within the Specific Plan Area and provides an
Leadership Frederick County Frederick Today Session
 Frederick Today Session Nov 14, 2014 Frederick County Council County Executive Jan Gardner Charter Government - County Executive oversees County government departments and agencies, establishes policies
REGION 7W DESCRIPTION. Demographics
 REGION 7W DESCRIPTION Demographics is one of the fastest growing areas in the state. The region s close proximity to the Twin Cities Metropolitan Area (TCMA) has spurred growth in. Continued growth will
Demographic and Economic Profile. Texas. Updated April 2006
 Demographic and Economic Profile Texas Updated April 2006 Metro and Nonmetro Counties in Texas Based on the most recent listing of core based statistical areas by the Office of Management and Budget (December
City of Lawrence Page 1 Strategic Plan Performance Measures
 City of Lawrence Page 1 Strategic Plan s Strategic Plan s Performance measures are specific metrics for each aspect of performance to be monitored. In March 2017, the City of Lawrence s Critical Success
Analysis of the Alameda County Transportation Expenditure Plan Prepared by Alameda County Transportation Commission
 Analysis of the Alameda County Transportation Expenditure Plan Prepared by Alameda County Transportation Commission Discussion: In 1986, voters approved Measure B, a 1/2 cent sales tax, to fund transportation
City of West Sacramento General Plan Background Report Chapter 4 Demographics and Economic Conditions
 City of West Sacramento General Plan Background Report Chapter 4 Demographics and Economic Conditions 4.1 INTRODUCTION This section describes the demographic and economic characteristics of the city of
Population & Demographic Analysis
 Population & Demographic Analysis The United States Census Bureau conducts a nationwide census every ten years. This census compiles information relating to the socio-economic characteristics of the entire
Rifle city Demographic and Economic Profile
 Rifle city Demographic and Economic Profile Community Quick Facts Population (2014) 9,289 Population Change 2010 to 2014 156 Place Median HH Income (ACS 10-14) $52,539 State Median HH Income (ACS 10-14)
Parking Cash Out. Transportation Solutions Workshop Series April 19, 2017
 Parking Cash Out Transportation Solutions Workshop Series April 19, 2017 Workshop Series Sponsors Welcome from the Chamber of Commerce Grand Rapids is Changing New Approach to Transportation Workshop Agenda
Demographic and Economic Profile. Nevada. Updated May 2006
 Demographic and Economic Profile Nevada Updated May 2006 Metro and Nonmetro Counties in Nevada Based on the most recent listing of core based statistical areas by the Office of Management and Budget (December
Planning Board Roundtable 12/3/15
 Planning Board Roundtable 12/3/15 1 Study overview Four specific topics: 1. Function and relationship of transportation funding mechanisms (LATR, TPAR, transportation impact taxes) 2. Pro-rata share concept
Demographic and Economic Profile. Kentucky. Updated June 2006
 Demographic and Economic Profile Kentucky Updated June 2006 Metro and Nonmetro Counties in Kentucky Based on the most recent listing of core based statistical areas by the Office of Management and Budget
Demographic and Economic Profile. Ohio. Updated June Metro and Nonmetro Counties in Ohio
 Demographic and Economic Profile Ohio Updated June 2006 Metro and Nonmetro Counties in Ohio Based on the most recent listing of core based statistical areas by the Office of Management and Budget (December
Lake County. Government Finance Study. Supplemental Material by Geography. Prepared by the Indiana Business Research Center
 County Government Finance Study Supplemental Material by Geography Prepared by the Indiana Business Research www.ibrc.indiana.edu for Sustainable Regional Vitality www.iun.edu/~csrv/index.shtml west Indiana
Demographic and Economic Profile. Florida. Updated May 2006
 Demographic and Economic Profile Florida Updated May 2006 Metro and Nonmetro Counties in Florida Based on the most recent listing of core based statistical areas by the Office of Management and Budget
APPENDIX B: Henry County Comprehensive Plan Survey
 APPENDIX B: HENRY COUNTY COMPREHENSIVE PLAN SURVEY RESULTS 759 Surveys Mailed (Random Sample) 226 Surveys Returned 30% Return Rate 1. How important is each of the following characteristics to the county
Independence, MO Data Profile 2015
 , MO Data Profile 2015 5 year American Community Survey (ACS) Jackson County, Missouri Data sources: U.S. Census Bureau, American Community Survey (ACS), 2011 2015 (released December 8, 2016), compared
The Economic Base of San Juan County, NM. PREPARED BY: The Office of Policy Analysis at Arrowhead Center, New Mexico State University.
 The Economic Base of San Juan County, NM PREPARED BY: The Office of Policy Analysis at Arrowhead Center, New Mexico State University DATE: July 2015 The Economic Base of San Juan County, New Mexico Introduction
Regional Economic Impact of Cass County, ND and Clay County, MN
 51 Broadway Suite 500 Fargo, ND 58102 701.364.1900 Fax 701.293.7819 Regional Economic Impact of Cass County, ND and Clay County, MN GFMEDC Mission The mission of the Greater Fargo Moorhead Economic Development
Wake County. People love to be connected. In our cyberspace. transit plan CONNECTING PEOPLE, CONNECTING THE COUNTY
 Wake County transit plan CONNECTING PEOPLE, CONNECTING THE COUNTY EXECUTIVE SUMMARY People love to be connected. In our cyberspace driven world, people can stay connected pretty much all of the time. Connecting
STATE OF SCARBOROUGH. Public Safety Building
 STATE OF SCARBOROUGH Public Safety Building Census 2020 Sustainability Eastern Downtown District Comp Plan POLICY Growth Management PROJECTS Trail & Route 1 Public Safety Buildings Council Goals BUDGET
DRAFT REGIONAL TRANSIT SYSTEM PLAN Regional Task Force July 8, 2011
 1 DRAFT REGIONAL TRANSIT SYSTEM PLAN Regional Task Force July 8, 2011 AGENDA What is the role of the RTF? Public Involvement Update Technical Process Overview Draft Regional Transit System Plan (RTSP)
EAGLE COMMONS at OVERLAND
 For Sale or For Lease EAGLE COMMONS at OVERLAND EAGLE ROAD & OVERLAND ROAD MERIDIAN, ID SCOTT RAEBER, MBA, CCIM 208 472 2817 scott.raeber@colliers.com MIKE CHRISTENSEN 208 472 2866 mike.christensen@colliers.com
ATLANTA NEIGHBORHOOD DEVELOPMENT PARTNERSHIP GEORGIA UNDERWATER APRIL 2015
 ATLANTA NEIGHBORHOOD DEVELOPMENT PARTNERSHIP GEORGIA UNDERWATER APRIL 2015 1 Develop a replicable methodology to analyze the leveraging effect of home improvement investments in underwater neighborhoods
COMMUNITY REINVESTMENT ACT PERFORMANCE EVALUATION
 PUBLIC DISCLOSURE August 23, 1999 COMMUNITY REINVESTMENT ACT PERFORMANCE EVALUATION Bank of Cairo and Moberly RSSD# 833646 27 E. Rollins Street Moberly, Missouri 6527-2 Federal Reserve Bank of St. Louis
A Sublette County Profile: Socioeconomics
 JULY 2015 A Sublette County Profile: Socioeconomics Sublette County Board of County Commissioners Andy Nelson, Chair Joel Bousman Jim Latta INTRODUCTION In a rapidly changing world, timely and accurate
Urban Action Agenda Community Profiles COVER TO GO HERE. City of Beacon
 Urban Action Agenda Community Profiles COVER TO GO HERE City of Beacon COMMUNITY OVERVIEW MAP POPULATION & DEMOGRAPHICS Population Basics 2,212 Population (2015) Population Change 2. since 2000 0.5 Square
EAGLE COMMONS at OVERLAND
 For Sale or For Lease EAGLE ROAD & OVERLAND ROAD MERIDIAN, ID PENDING PENDING SCOTT RAEBER, MBA, CCIM 208 472 2817 scott.raeber@colliers.com MIKE CHRISTENSEN 208 472 2866 mike.christensen@colliers.com
Lake County. Government Finance Study. Supplemental Material by Geography. Prepared by the Indiana Business Research Center
 County Government Finance Study Supplemental Material by Geography Prepared by the Indiana Business Research www.ibrc.indiana.edu for Sustainable Regional Vitality www.iun.edu/~csrv/index.shtml west Indiana
Economic Growth Initiatives. November 14, 2014
 Economic Growth Initiatives November 14, 2014 Key Concepts Creating Jobs Increased Revenue (type of jobs) Reduced Cost (location) Productive vs. New Revenues A Plan Land Use / Regulations / Finance / Services
Socio-Demographic Projections for Autauga, Elmore, and Montgomery Counties:
 Information for a Better Society Socio-Demographic Projections for Autauga, Elmore, and Montgomery Counties: 2005-2035 Prepared for the Department of Planning and Development Transportation Planning Division
University Link LRT Extension
 (November 2007) The Central Puget Sound Regional Transit Authority, commonly known as Sound Transit, is proposing to implement an extension of the Central Link light rail transit (LRT) Initial Segment
2018 Annual Indicator Report
 Are We Living Our Values?... 1 Ecosystem Stewardship... 2 Ecosystem Stewardship Takeaways. 2 Ecosystem Stewardship Indicators... 3 Ecosystem Stewardship Next Steps.. 6 Growth Management... 6 Growth Management
Minimum Wage in South Dakota Table of Contents
 October 27, 2014 Minimum Wage in South Dakota Table of Contents Introduction 2-3 Demographics 3-9 Current Population Survey 3 Occupational Employment Statistics... 4 Estimates Delivery System. 4-5 Part-
Washington Metropolitan Area Transit Authority
 Washington Metropolitan Area Transit Authority Financial Report For the Fiscal Years Ended June 30, 2017 and 2016 Table of Contents Washington Metropolitan Area Transit Authority Financial Report For the
 http://www.tennessee.gov/tacir/_profile/hardin_profile.htm Page 1 of 13 I. Geography & Demographics VI. Government Finance II. Income & Poverty VII. Public Infrastructure Needs Inventory III. Health &
DELAWARE VALLEY REGIONAL PLANNING COMMISSION DECEMBER rating the region THE STATE OF THE DELAWARE VALLEY
 DELAWARE VALLEY REGIONAL PLANNING COMMISSION rating the region THE STATE OF THE DELAWARE VALLEY DECEMBER 2007 dvrpc Our logo is adapted from the official DVRPC seal. Designed as a stylized image of the
Active Transportation Health and Economic Impact Study
 Active Transportation Health and Economic Impact Study November 7, 2016 Please recycle this material. SCAG 2789.2017.02.22 Contract No. 15-019-C1 Active Transportation Health and Economic Impact Study
2365 Reynolds Ave, North Las Vegas, NV 89030
 10% Down $77 psf 7,072' Medical Office Elevator & Gray Shell 2365 Reynolds Ave, North Las Vegas, NV 89030 Listing ID: 29944110 Status: Active Property Type: Office For Sale Office Type: Business Park,
NEIGHBORHOOD REPORT. Placitas, NM Prepared for Future Tenant. New Mexico Real Estate License: 17308
 NEIGHBORHOOD REPORT Placitas, NM Prepared for Future Tenant Presented by Wayne Ullery New Mexico Real Estate License: 17308 Check out my web site to see availability dates. Work: (505) 867-4077 Mobile:
DOES GROWTH PAY FOR ITSELF THROUGH INCREASED REVENUES OR DECREASED COSTS PER PERSON? An Analysis of the City of Colorado Springs,
 DOES GROWTH PAY FOR ITSELF THROUGH INCREASED REVENUES OR DECREASED COSTS PER PERSON? An Analysis of the City of Colorado Springs, 1980-2000 Prepared by the Center for Colorado Policy Studies University
1320 S Casino Center Blvd, Las Vegas, NV 89104
 Professional or Attorney Office Arts District Casino Center 1320 S Casino Center Blvd, Las Vegas, NV 89104 Listing ID: 30030990 Status: Active Property Type: Office For Sale Office Type: Business Park,
Bluffs Values and Priorities
 G1 Heartland 2050: Omaha-Council Bluffs Values and Priorities Quantitative Study Prepared for Fregonese Associates January 28, 2014 About three in four see their quality of life in the Omaha-Council Bluffs
Heartland 2050: Omaha-Council Bluffs Values and Priorities Quantitative Study
 Heartland 2050: Omaha-Council Bluffs Values and Priorities Quantitative Study Prepared for Fregonese Associates January 28, 2014 G1 About three in four see their quality of life in the Omaha-Council Bluffs
6.44 Acre Commercial Lot FOR SALE Florence Road - Murfreesboro, TN
 6.44 Acre Commercial Lot FOR SALE Florence Road - Murfreesboro, TN AMENITIES: 6.44 Acres: $799,000 Sewer & Water available Zoned for a variety of retail, office, assisted living, daycare, storage units
OVERVIEW OF THE SAN DIEGO REGION Current Conditions and Future Trends
 OVERVIEW OF THE SAN DIEGO REGION Current Conditions and Future Trends Why do we need a Regional Comprehensive Plan? Let s examine the facts. It helps to look at some objective statistical information that
WILMAPCO Public Opinion Survey Summary of Results
 Wilmington Area Planning Council WILMAPCO Public Opinion Survey Summary of Results April 2018 Prepared by: 2955 Valmont Road, Suite 300 Boulder, Colorado 80301 t: 303-444-7863 f: 303-444-1145 www.n-r-c.com
Wyoming Economic and
 Wyoming Economic and Demographic Data Tools for your Toolbox Presented to: Wyoming Association of Municipal i Clerks and Treasurers (WAMCAT) 2011 Region VIII & WAMCAT Winter Workshop Jackson, Wyoming January
1. I N T R O D U C T I O N
 INTRODUCTION The Chico 2030 General Plan is a statement of community priorities to guide public decisionmaking. It provides a comprehensive, long-range, and internally consistent policy framework for the
Washington Metropolitan Area Transit Authority Metro Budget Overview
 Washington Metropolitan Area Transit Authority Metro Budget Overview February 2011 Metro 10,877 Employees (10,974 budgeted) 1,491 Buses 588 Escalators and 237 Elevators 106 Miles of Track 92 Traction Power
Minimum Elements of a Local Comprehensive Plan
 Minimum Elements of a Local Comprehensive Plan Background OKI is an association of local governments, business organizations and community groups serving more than 180 cities, villages, and townships in
Roseville Towne Center Gratiot Avenue Roseville, MI 48066
 Retail Space Available 65,000 SF Second Level Space and Outparcel Florence Street Massachusetts Street Gratiot Avenue E. 12 Mile Road Property Highlights is shadow-anchored by Walmart and includes national
E APPENDIX METHODOLOGY FOR LAND USE PROJECTIONS IN THE BOSTON REGION INTRODUCTION
 E APPENDIX METHODOLOGY FOR LAND USE PROJECTIONS IN THE BOSTON REGION INTRODUCTION The Metropolitan Area Planning Council (MAPC), the region s land use planning agency, is responsible for preparing detailed
Wake Transit Plan. A Wake County Transit Investment Strategy Report. NOVEmber 2016
 A Report NOVEmber 2016 Table of Contents Contents Foreword...3 1 Background...4 About the Reports...5 Transit Planning in Wake County...5 Process Overview....5 2....6 Big Moves: Enhanced Transit in Wake
The New Main Street. Lakey Broderius Boyd, AICP, CEcD Market + Main, Inc. November 4, Community Academy: The New Main Street
 The New Main Street November 4, 2010 Lakey Broderius Boyd, AICP, CEcD Market + Main, Inc. 85% 15% Role of Business Serve Consumer Work Employee Serve Consumer Fundamentals of Retail Retailers follow rooftops
Follow this and additional works at: Part of the Business Commons
 University of South Florida Scholar Commons College of Business Publications College of Business 7-1-2001 South central Florida's regional economy : report to the Central Florida Regional Planning Council
The Economic Base of Valencia County, NM. PREPARED BY: The Office of Policy Analysis at Arrowhead Center, New Mexico State University.
 The Economic Base of Valencia County, NM PREPARED BY: The Office of Policy Analysis at Arrowhead Center, New Mexico State University DATE: July 2017 DATE: September 2013 The Economic Base of Valencia County,
Georgetown, TX 78628
 305 - ( V 922 - W a l ( 697 - NEIGHBORHOOD REPORT W o rk : ( 512 ) 3720 M o b i l e : P r e s e n t e d b y Tate Chiles 512 ) 7825 F a x : Austin 6514 W h i t e m a r s h a l l e y A u s t i n 78746 k
University of Minnesota
 neighborhood profile October 2011 About this area The University neighborhood is bordered by 11th Avenue Southeast, University Avenue, 15th Avenue Southeast, the railroad tracks, Oak Street, and the Mississippi
Mid - City Industrial
 Minneapolis neighborhood profile October 2011 Mid - City Industrial About this area The Mid-City Industrial neighborhood is bordered by I- 35W, Highway 280, East Hennepin Avenue, and Winter Street Northeast.
CHAPTER 2: SOCIO-ECONOMIC PROFILE
 2040 Regional Transit Element CHAPTER 2: SOCIO-ECONOMIC PROFILE STUDY AREA The study area for this 2040 RTE is the NFRMPO region, also designated by the Colorado Department of Transportation (CDOT) as
2415 Reynolds Ave, North Las Vegas, NV 89030
 7,221' *Reynolds Medical Center* Gray Shell w/ Elevator 89030 2415 Reynolds Ave, North Las Vegas, NV 89030 Listing ID: 29944098 Status: Active Property Type: Office For Sale (also listed as Special Purpose)
The Economic Base of San Miguel County, NM. PREPARED BY: The Office of Policy Analysis at Arrowhead Center, New Mexico State University
 The Economic Base of San Miguel County, NM PREPARED BY: The Office of Policy Analysis at Arrowhead Center, New Mexico State University DATE: July 2015 The Economic Base of San Miguel County, New Mexico
Economic Activity Report. October 2016
 Economic Activity Report October 2016 The current economic activity report for Commerce City economy reported mixed trends across many indicators. The employment situation improved, with overall employment
PUBLIC DISCLOSURE. June 4, 2012 COMMUNITY REINVESTMENT ACT PERFORMANCE EVALUATION. Utah Independent Bank RSSD #
 PUBLIC DISCLOSURE June 4, 2012 COMMUNITY REINVESTMENT ACT PERFORMANCE EVALUATION Utah Independent RSSD # 256179 55 South State Street Salina, Utah 84654 Federal Reserve of San Francisco 101 Market Street
JP Morgan Public Finance Transportation Utility Conference
 JP Morgan Public Finance Transportation Utility Conference April 18-19, 2018 Presented by: Brenden Morgan Sr. Manager of Debt & Investments Table of Contents I. Overview of the Region and RTD II. Updates
City of Sacramento City Council 915 I Street, Sacramento, CA,
 City of Sacramento City Council 915 I Street, Sacramento, CA, 95814 www.cityofsacramento.org Meeting Date: 2/8/2011 Report Type: Consent Title: Agreement: Streetcar Planning Study Report ID: 2011-00051
The Economic Base of Quay County, NM. PREPARED BY: The Office of Policy Analysis at Arrowhead Center, New Mexico State University.
 The Economic Base of Quay County, NM PREPARED BY: The Office of Policy Analysis at Arrowhead Center, New Mexico State University DATE: July 2015 The Economic Base of Quay County, New Mexico Introduction