Active Transportation Health and Economic Impact Study
|
|
|
- Phoebe Stokes
- 5 years ago
- Views:
Transcription


1 Active Transportation Health and Economic Impact Study November 7, 2016 Please recycle this material. SCAG
2 Contract No C1 Active Transportation Health and Economic Impact Study Project Manager: Produced By: Rye Baerg, Associate Regional Planner, Southern California Association of Governments Urban Design 4 Health( AECOM ( Draft: August 28, 2016 Revised Final: November 7,
3 Table of Contents 1 Executive Summary 6 2 Introduction 8 3 Current Active Transportation Trends in the SCAG Region Regional Estimates of Active Travel from Active Transportation Modes Consumer Costs Annual Active Transportation Investments Active Transportation Events 11 4 Health Benefits of Active Transportation Overview on Modeling Health and Applying Cost of Illness Understanding Health Impacts of Current Infrastructure 14 Modeling Health Outcomes from Physical Activity 15 Monetizing Public Health Morbidity Benefits 17 County Level Monetized Health Estimates Understanding Health Impacts of Planned Infrastructure 21 Modeling Health Outcomes from Increased Physical Activity 21 Monetizing Public Health Morbidity Benefits 22 5 Active Transportation s Effect on Regional Employment and Regional Economic Growth Regional Economic Impacts of Implementing the 2016 RTP/SCS Active Transportation Infrastructure Regional Economic Health Impacts of Current Active Transportation Infrastructure 29 6 Conclusion 31 7 Appendix A: Task 5 Methodology for Public Health Benefits Analysis Error! Bookmark not defined. 8 Appendix B: Task 4: Transportation System Cost Analysis Error! Bookmark not defined. 9 Appendix C: Task 5 - Technical Memo Summarizing Monetized Physical Activity Outcomes of Active Transportation Infrastructure Error! 3
4 Bookmark not defined. 10 Appendix D: Task 5 - Technical Memo Summarizing 2016 Final RTP/SCS Monetized Health Outcomes Error! Bookmark not defined. 11 Appendix E: Task 6 - Technical Memo Summarizing Economic Impact of Active Transportation in SCAG Region Error! Bookmark not defined. 12 Appendix F: Task 5 Maps of Health Outcomes and Monetized Health Outcomes by County for Current Infrastructure Error! Bookmark not defined. Figures Figure 1. Average Cost per Traveler per Year and per Mile by Mode 10 Figure 2. Event Spending Per Participant by Event Size 11 Figure 3. Annual Revenue and Spending in Events that Support Active Transportation 12 Figure 4. Approach to Modeling and Monetizing Health Effects from Physical Activity from Active Transportation 14 Figure 5: Data Sources and Modeling Approach to Monetizing Health Benefits of Active Transportation 15 Figure 6. Change in Prevalence of Hypertension from Active Transportation Infrastructure, Adults (Ages 18-64) 17 Figure 7. Total (Direct + Indirect for Hypertension, Heart Disease, and Diabetes) Monetized Health Benefits by County, Adults (18-64) 20 Figure 8: Annual Per Capita Monetized Health Benefit for Adults (ages 18-64) by County 20 Figure 9. Modeled Health Outcomes for 2016 RTP Scenarios, Adults 21 Figure 10. Increased Sale Output per $1 in AT-RTP Spending 24 Figure 11. Output from Active Transportation, ($ billions, 2015$) 25 Figure 12. Increased Value Added per $1 in AT-RTP Spending 25 Figure 13. Value Added from Active Transportation, ($ Billions, 2015$) 26 Figure 14. Employment Gains per $1 in AT-RTP Spending 27 Figure 15. Employment Gains from Active Transportation, Thousands, Figure 16. Top Sectors Impacted by Employment (from AT-RTP and Current 4
5 Infrastructure Health Gains), Figure 17. Increased Personal Income (wages) per $1 in AT-RTP Spending 28 Figure 18. Personal Income (wages) from Active Transportation, ($ billions, 2015$) 29 Tables Table 1: Daily (Weekday) Distance and Time Traveled for Those who Use the Mode in SCAG Region 9 Table 2: Average Cost per Traveler per Year and per Mile by Mode 10 Table 3: Current Conditions and Cost-of-Illness, Table 4: Predicted Reduction in Prevalence (Change in Rate) and Reduction in Cases Assuming 18.3 Minutes of Walking and 2.4 Minutes of Biking Each Week, by Age Groups 16 Table 5: Estimated Annual Physical Activity 1 Health Savings (2011$) for Adults 2 in SCAG Region by Cost Type - Hypertension, Heart Disease, Diabetes, and Obesity 17 Table 6: Estimated Annual Physical Activity 1 Health Savings (2011$) for Seniors 2 in SCAG Region by Cost Type - Hypertension, Heart Disease, Diabetes, and Obesity 18 Table 7: Monetized Annual Health Benefits (Total and Per Capita) by County and Disease, Adults (18-64) 19 Table 8: Monetized Annual Health Benefits (Total and Per Capita) by County and Disease, Seniors (65+) 19 Table 9. Predicted Adult 1 (ages 18-64) Prevalence and Avoided Cases from Increased Physical Activity in 2040 for RTP/SCS Scenarios as Modeled by C-PHAM 21 Table 10. Predicted Annual Physical Activity Health Savings (millions, 2011$) in 2040 for Adults 1 (ages 18-64) by Cost Type Hypertension, Heart Disease, and Diabetes 22 Table 11. Sales Output (Cumulative, Yearly Average, and Benefit per $1 AT-RTP Spent) for (2015 $) 25 Table 12. Value Added (Cumulative, Yearly Average, and Benefit per $1 AT-RTP Spent) for (2015 $) 26 Table 13. Employment Benefits (Cumulative, Yearly Average, and Benefit per $1 Billion AT-RTP Spent) for Table 14. Personal Income (Cumulative, Yearly Average, and Benefit per $1 RTP Spent) for (2015 $) 29 Table 15. Regional Economic Metrics from Health Benefits of Current Active Transportation Infrastructure 30 5
6 1 Executive Summary The purpose of this Active Transportation Health and Economic Impact Study is to provide an understanding of the public health and economic benefits of building and maintaining active transportation infrastructure. Active transportation in this report, refers to walking and bicycling for utilitarian transportation purposes. Active transportation infrastructure elements that specifically support pedestrian and bicycle activity include sidewalks, bike facilities (lanes, paths), and complete street design. The study area is the six-county Southern California Association of Governments (SCAG) region. The study was initiated on behalf of SCAG in response to stakeholder input surrounding the development of the 2012 and 2016 Regional Transportation Plans and Sustainable Communities Strategies (RTP/SCS). There are many different ways in which active transportation influences the economy. This report details outcomes related to the following: Active travel in the six-county Southern California Association of Governments (SCAG) region including: o current mode share, o costs of traveling by different modes and potential savings by changing modes, o costs of building and maintaining the active transportation infrastructure (Section 3); Health impacts from physical activity attributed to active transportation mode choice (Section 4); and The influence of active transportation infrastructure spending and changes in health expenditures (due to more physically active people) on regional employment and gross domestic product (GDP) (Section 5). The findings below are a summary of multiple modeling exercises completed on behalf of SCAG for this project. A high level summary for each of these outcomes is provided in this report. The sources of data and methodologies used to complete this project are detailed in appendices A-E. Trips by active mode (walking, walking to transit, and biking) are an increasing share of the SCAG region s transportation system. 1 o 13.3% of trips in the region are taken by an active mode. o This equates to 14.5 million miles and 5.4 million hours of physical activity daily. Walking and biking is a relatively inexpensive mode of travel. o Walking costs $0.02 per mile and biking costs $0.05 per mile compared to $1.22 per mile to drive a vehicle. o Total walking costs $169,426 per day or $61.8 million per year paid by consumers. o Upkeep of bicycles costs consumers $250,612 each day or $91.5 million annually. o Consumer spending on walking and biking for daily commutes costs $153 million. If these trips were made by single occupancy vehicle it would cost $6.45 billion annually. Current active transportation infrastructure (modeled for year 2012) improves health by supporting increased physical activity. o Among adults ages 18+, increased physical activity attributed to current active 1 Source: California Department of Transportation (2012) California Household Travel Survey. Walking and bicycling trips are complete trips. Walking to transit trips are segments of larger trips. 6
7 o o transportation infrastructure prevents annually 84,773 cases of hypertension; 14,016 cases of heart disease; and 29,824 cases of diabetes. The prevented cases of hypertension, heart disease, and diabetes equate to $193 million in direct reduced healthcare expenditures and $82 million in indirect benefits such as productivity gains from reduced absenteeism and lower expenditures for disability payments Without the current active transportation infrastructure system in place 3,557 jobs and $560 million in personal income would be lost each year and Annual sales output would be reduced by an average of $2.53 billion. Implementing the active transportation strategies and investments planned in the 2016 Regional Transportation Plan and Sustainable Communities Strategy (RTP/SCS) will result in significant health benefits from increased physical activity. o o Among adults ages 18-64, implementing the 2016 RTP/SCS will result in the prevention of 81,657 cases of hypertension; 15,985 cases of heart disease, and 15,076 cases of diabetes. By 2040, these prevented cases of hypertension, heart disease, and diabetes equate to annual benefits of $226 million in direct reduced healthcare expenditures and $111 million in indirect benefits (productivity gains) Implementing the active transportation strategies and investments planned in the 2016 RTP/SCS will also result in significant regional economic benefits. When added to the health productivity benefits: o o o o 11,500 jobs will be created on average each year creating $36 billion in personal income over the life of the plan; and Sales output will increase $113 billion over the life of the plan, including $70 billion in value added that stays within the regional economy. Increased productivity from healthier workers in all sectors drives a majority of these regional economic benefits; Construction and strategy spending also contributes a significant portion of the economic benefits. Overall, implementing the active transportation investments within the 2016 RTP/SCS is cost effective. o For every $1 spent in implementing the active transportation strategy within the 2016 RTP/SCS, the regional economy will see an additional $8.41 in sales output, $2.65 in personal income, and $5.20 in value added. Understanding Regional Economic Indicators REMI s Transight model captures annual regional economic growth using the following metrics: 7
8 2 Introduction The purpose of this Active Transportation Health and Economic Impact Study is to provide an understanding of the public health and economic benefits of building and maintaining active transportation infrastructure. The study area is the six-county Southern California Association of Governments (SCAG) region. Estimates are provided for both current conditions and for the impact of planned investment according to SCAG s 2016 Regional Transportation Plan/ Sustainable Communities Strategy (RTP/SCS). Active transportation in this report, refers to walking and bicycling for utilitarian transportation purposes, such as commuting or accessing neighborhood destinations. Active transportation infrastructure elements that specifically support pedestrian and cycling activity include sidewalks, bike facilities (lanes, paths), and complete street design. Compact land use design also plays an important role determining in rates of bicycling and walking. There are many different ways in which active transportation influences the economy. This report describes the following elements: Section 3: Current Active Transportation Trends in the SCAG Region -- the amount of active transportation in the SCAG region including current mode share, costs of traveling by different modes and potential associated savings, and costs of building and maintaining the active transportation infrastructure; Section 4: Health Benefits of Active Transportation -- Health impacts from physical activity related to active transportation mode choice; Section 5: Active Transportation s Effect on Regional Employment and Regional Economic Growth -- The influence of active transportation infrastructure spending and changes in health on regional employment, accompanying personal income, sales, and value added; and Section 6: Conclusions -- The cost effective nature of active transportation investments. 8

9 3 Current Active Transportation Trends in the SCAG Region 2 Regional estimates of active transportation costs and benefits incorporate the average daily utilitarian travel (physical activity) done using active modes. Also included in the costs/benefits analysis are active transportation-related infrastructure cost, and the economic impact of related special events in the region. 3.1 Regional Estimates of Active Travel from Active Transportation Modes The vast majority daily trips in the SCAG region are taken by auto (84.7%). SCAG residents have been increasing the number and share of trips by alternative modes over the past decade. Active modes make up 13.3% of all trips. Of the active travel, 78.4% (10.4% of all trips) are walking trips and 12.1% (2% of all trips) are walking to transit. Biking trips make up 9.5% of active trips (or 1.6% of all trips). While bicycling is the least likely type of trip, cyclists go 9.3 times further than those walking to transit and 4.6 times further on average than those walking to destinations (Table 1). Those who bicycle as a transportation mode take an average of 2.38 trips to their final destinations each weekday, going an average of 6.02 miles per trip. Pedestrians take an average of 2.19 trips to their final destinations per weekday with an average distance of 1.33 miles for each trip. Those who walk to transit as a segment of their trip average 1.61 trips to transit per weekday with an average length of 0.65 miles per trip to transit. The total daily distance traveled in the SCAG region is approximately 8.9 million miles of walking, an additional 675,497 miles of walking to transit, and 4.9 million miles of bicycling (Table 1). This translates into nearly 5.4 million hours of active travel per day. Table 1: Daily (Weekday) Distance and Time Traveled for Those who Use the Mode in SCAG Region Item # of Trips Average Distance (miles) Average Speed (miles per hour) Total Distance (miles) Total Daily Time (Hours) Walk Trips 6,706, ,920,063 3,345,111 Bike Trips 810, ,881,821 1,874,136 Walk to Transit 1,039, , ,296 Total 8,556, ,477,381 5,358,543 Source: California Department of Transportation (2012) California Household Travel Survey (CHTS). Average Speed from 2010 CHTS GPS sample, restricted to SCAG. 2 See Appendix B for a more detailed discussion of methodology. 9
10 3.2 Consumer Costs Travel costs vary by mode for residents in the SCAG region. Consumers spend money throughout the year on active transportation products and devices including purchasing, maintaining and upgrading equipment, and replacing perishable items such as tires, clothing, shoes, helmets, and parts. While these costs add up, Figure 1 shows it is relatively cheaper to own and maintain a bicycle ($0.05 per mile) compared to owning a car ($1.22 per mile). Figure 1. Average Cost per Traveler per Year and per Mile by Mode Per mile consumer costs derived above can be used to estimate the cost borne by the consumer for active travel. Walking and walking to transit results in 9.6 million miles (Table 1) daily, costing, at $0.02 per mile, $169,426 per day or $61.8 million per year across the SCAG region. Upkeep of bicycles traveling 4.9 million miles daily equates to $250,612 each day or $91.5 million annually. Consumer spending on walking and biking for daily commutes costs $153 million a year. Table 2: Average Cost per Traveler per Year 3 and per Mile by Mode Mode Average $ / Year Average $ / Mile Drive Alone $11,407 $1.22 Carpool - 2 per Car $5,704 $0.72 Public Transit $1,182 $0.11 Bicycle - Personal $395 $0.05 Walk $30 $0.02 A rough estimate of current consumer savings can be calculated by assigning all active miles to single occupancy vehicles, at a per mile cost of $1.22. Doing so would increase annual costs from $153 million to $6.45 billion annually 4. This significantly overestimates the savings from use of active modes, since it is not expected that every mile walked or bicycled necessarily replace a mile of driving. A more nuanced understanding of active transportation s benefit for consumers can be calculated by using SCAG s travel demand model to understand the extent active modes substitute vehicle miles traveled (VMT). For example, in 2012, the SCAG travel demand model estimates an increase of 45,718 miles travel by motor vehicles daily if all bicycle lanes were removed. This suggests the annual economic savings due to consumers shifting from automobiles to bicycling in the year 2012 was over $19 million; this savings could be up to $976 million annually by 2040 with implementation of the 2016 RTP/SCS. 3 See Appendix B for more information. 4 This assumes a 1:1 substitution of active travel miles for motor vehicle miles: (4,881,821+9,595,561)*365*$
.")
11 3.3 Annual Active Transportation Investments Of all the ways in which active transportation related investments influence the regional economy, maintaining existing and constructing new active transportation infrastructure is the most direct economic lever with a significant economic impact (see Section 6). The 2016 RTP/SCS forecasts active transportation infrastructure/program spending from 2016 to 2040 at $12.9 billion in 2011$ value. The average planned annual economic spending on active transportation infrastructure for years 1-5 of the RTP/SCS totals $435 million per year, or $24 per capita per year. This will increase to $656 million per year or $36.41 per capita in years Short trip enhancements including $5.6 billion in sidewalks and 6,016 additional miles of bikeways ($900 million) are the largest scheduled infrastructure investment ($7.6 billion) over the life of the plan. 3.4 Active Transportation Events 5 Communities sometimes look to running or biking events as a community or economic development strategy. While spending is localized and has minimal regional impact, bicycling, running, and walking participants are estimated 6 to spend nearly $200 million annually as part of their attendance of active transportation related events in the SCAG region. Figure 2. Event Spending Per Participant by Event Size There is a range of event types and participant counts in the SCAG region. Medium to-small running events, such as the Citrus Heritage Run, are the most prevalent, followed by triathlons and novelty races. Large running events, such as the Los Angeles Marathon, generate the greatest revenue per participant nearly $700. Large running events often include many participants with registration and other fees which bring the revenue generated to an estimate of $10.5 million per event. Conversely, open streets events, such as CicLAvia, generate very little revenue per participant, in part due to the lack of registration fees. Research shows, however, that events such as CicLAvia can have 5 While active transportation events are an important educational tool, their impact is generally limited to short window of time. Because of this, events have been excluded from the REMI analyses in Section 6. 6 See Appendix B for more information. 11

. Figure 3.")
12 significant impacts on local businesses along the route. 7 Events also support mode shift to walking and bicycling which promotes increased physical activity and improved health outcomes. When taken together, events contribute nearly $200 million to the total average annual spending. Running events provide the greatest contribution ($177 million). Figure 3. Annual Revenue and Spending in Events that Support Active Transportation 7 See Study by UCLA, Economic Impacts of CicLAvia: Study Finds Gains to Local Businesses 12

13 4 Health Benefits of Active Transportation 8 In the SCAG region, over 2.5 million adults ages (21.7%) have hypertension. Over 3.1 percent have heart disease and 6.5% have diabetes (Table 3) 9. Chronic diseases are costly, resulting in health care expenditures and lost productivity. For example, on average, someone with diabetes spends an additional $7,774 on healthcare expenditures and has reduced productivity of $3,311 per year due to missed days of work, reduced days of work, early disability, and/or early death. Diabetes, heart disease, and hypertension medical expenses and lost productivity for adults ages costs the SCAG region $12 billion annually. Medical expenses and lost productivity for seniors related to diabetes, heart disease and hypertension is over $8.5 billing annually. People who walk and bicycle, for transportation purposes increase their daily physical activity, which results in significant health benefits. This section summarizes the methods and estimates the financial impact of improved health due to the use of the current active transportation infrastructure in the SCAG region. 10 Table 3: Current Conditions and Cost-of-Illness, 2012 Prevalence Rates: 2012 California Health Interview Survey Diabetes: American Diabetes Association. Economic costs of diabetes in the U.S. in Diabetes Care. 2013;36(4): Heart Disease and Hypertension: Mozaffarian et al. Heart Disease and Stroke Statistics-2016 Update: A Report From the American Heart Association. Circulation. 2016;133(4):e38-e See Appendix C for a more detailed discussion of methodology. 9 Prevalence rates of diabetes, heart disease, and hypertension are significantly higher for seniors ages Methodological documentation is provided in Appendix A and more detailed results can be found in Appendix C of this report. 13

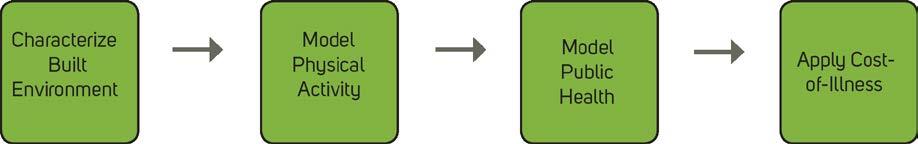
14 4.1 Overview on Modeling Health and Applying Cost of Illness The California Public Health Assessment Model (C-PHAM) 11 is used to estimate the physical activity health benefits from the active transportation infrastructure. The financial savings of these benefits are estimated by applying cost-of-illness information to predicted avoided cases of obesity, diabetes, high blood pressure, and heart disease due to increased physical activity. Cost of Illness (COI) studies are used to define additional costs per person and aggregate costs associated with major categories of disease. COI studies include an estimate of direct costs or money exchanged for healthcare. COI studies often also include a measure of indirect costs, such as absenteeism, reduced productivity, and, in some cases, early death. COI studies do not include intangible costs such as pain and suffering, making total costs a conservative estimate of the cost of disease. The per case costs reported in COI studies can be applied to modeled number of cases attributable to active transportation infrastructure through a chain of models (Error! Reference source not found.). Figure 4. Approach to Modeling and Monetizing Health Effects from Physical Activity from Active Transportation Characterize Built Environment Model Physical Activity Model Public Health Apply Cost Of Illness Monetized Health Outcome 4.2 Understanding Health Impacts of Current Infrastructure 12 Current levels of active transportation are supported by active transportation facilities already in place throughout the SCAG region. This section seeks to understand the extent to which this current infrastructure prevents diseases associated with lack of active transportation. The following method was used: Active transportation infrastructure and the number of active transportation trips was modeled by SCAG. This accounted for active transportation demand throughout the region. Active transportation trips were converted to time being physically active. The literature suggests somewhere between 40% and 60% of active transportation trips are due to available 11 C-PHAM was developed by Urban Design 4 Health, and integrated into UrbanFootprint, a web-based scenario planning tool developed by Calthorpe Analytics. The RTP analysis reported in Section 4.3 uses the original UrbanFootprint version to monetize 2016 RTP/SCS outcomes and only includes land use measures. C-PHAM was modified to incorporate SCAG s transportation demand model to model and monetize current active transportation infrastructure impacts reported in Section 4.2. To learn more about C-PHAM, please see 12 See Appendix A for a more detailed discussion of methodology and Appendix C for more detailed results. 14

15 infrastructure like bike lanes and sidewalks. 13 This report s analysis conservatively attributes the first 50% of active transportation trips to land use destinations or basic transportation needs, and the remainder to active transportation infrastructure. 14 Time was then converted to metabolic (MET) units, the preferred measurement of energy expenditure for modeling health benefits. The California Public Health Assessment Model (C-PHAM) was used to estimate the number of additional cases of obesity, diabetes, hypertension, and heart disease that would occur without the active transportation mode of travel. The C-PHAM model stratifies by age; adults (ages 18-64) and seniors (ages 65+) were modeled separately. Per-case cost-of-illness was then applied to estimated cases of disease prevented by active travel. (See Table 1 for per-case costs.) Figure 5: Data Sources and Modeling Approach to Monetizing Health Benefits of Active Transportation Modeling Health Outcomes from Physical Activity The average adult in the SCAG region spends 36.6 minutes walking per week for transportation purposes. Of that, this study assumes that 50% of active transportation trips are attributable to 13 Ewing, R., & Cervero, R. (2010). Travel and the built environment: A meta-analysis. Journal of the American Planning Association, 76(3), See Appendix C for more detail on this methodology. 15
16 infrastructure and the remaining are attributable to land use. Thus, the active transportation system prompts the average adult to spend 18.3 minutes of walking for transport and 2.4 minutes of biking each week. Table 4: Predicted Reduction in Prevalence (Change in Rate) and Reduction in Cases Assuming 18.3 Minutes of Walking and 2.4 Minutes of Biking Each Week, by Age Groups Health Condition Adults Seniors Adult + Seniors Change in Cases Prevalence Change in Cases Prevalence Change in Prevalence Cases 3 High Blood Pressure -0.60% 70, % 14, % 84,773 Heart Disease -0.06% 7, % 6, % 14,016 Diabetes -0.14% 16, % 13, % 29,824 Obesity -1.47% 172, % 14, % 186,323 1 Change in prevalence for adults is based off of a year old s CHIS-based statistical model; Cases for adults applies the year old s prevalence rate to the 2012 U.S. Census Estimate for year olds for Imperial, Los Angeles, Orange, Riverside, San Bernardino, and Ventura Counties (11,722,630). 2 Results apply to the 2012 U.S. Census estimate of 2.13 million seniors ages 65+ for Imperial, Los Angeles, Orange, Riverside, San Bernardino, and Ventura Counties. 3 Counts of cases for adults plus seniors equal the sum of the adult and senior models. The count in cases was divided by 2012 U.S. Census estimates of 18+ years old to calculate change in prevalence. Walking 18.3 minutes and biking 2.4 minutes each week prevents, as modeled using C-PHAM, an increase of prevalence rates for the conditions listed in Table 4. For example, without the active transportation mode of travel induced from SCAG s current bicycle and pedestrian infrastructure, hypertension for year olds would rise from the current level of 21.7% to 22.3%, heart disease from 3.1% to 3.1%, and diabetes from 6.5% to 6.6%. In other words, we would expect an additional 70,621 cases of hypertension, 7,132 cases of heart disease, and 16,151 cases of diabetes. The spatial distribution of the change in hypertension is provided in Error! Reference source not found.. The darker green shading indicates greater reductions. Without active travel, an additional 172,170 cases of obesity for adults ages would be expected. Active transportation also helps keep seniors active and healthy. Using the process described above, it is estimated that our current active transportation infrastructure prevents 14,153 persons over the age of 65 from being obese annually. Additionally, without the active transportation mode of travel attributable to the active transportation infrastructure, there would be an additional 14,153 cases of high blood pressure, 6,884 cases of heart disease, and 13,673 cases of diabetes for those over the age 65 (Table 4). 16
 Monetizing Public Health Morbidity Benefits Table 5 presents the estimated annual health costs that")
17 Figure 6. Change in Prevalence of Hypertension from Active Transportation Infrastructure, Adults (Ages 18-64) Monetizing Public Health Morbidity Benefits Table 5 presents the estimated annual health costs that would occur for adults ages assuming the last 50% of active travel currently occurring in the SCAG region is attributable to active transportation infrastructure. The avoided health costs are broken out by direct (health care expenditures) and indirect (lost productivity) benefits. For example, the annual health benefit from avoided hypertension from increased physical activity for year olds is estimated to be $42 million; of that, $38.9 million is from fewer healthcare expenditures, and another $3.1 million from greater productivity. Similarly, Table 5 shows total annual heath savings of $54.5 million from fewer cases of heart disease, and $179 Table 5: Estimated Annual Physical Activity 1 Health Savings (2011$) for Adults 2 in SCAG Region by Cost Type - Hypertension, Heart Disease, Diabetes, and Obesity Health Condition Direct Indirect Total Per Capita Hypertension $38,912,093 $3,107,318 $42,019,411 $3.58 Heart Disease $28,563,944 $25,910,813 $54,474,757 $4.65 Diabetes $125,561,187 $53,477,372 $179,038,560 $15.27 Subtotal 3 $193,037,224 $82,495,503 $275,532,728 $23.50 Obesity $623,083,379 $46,830,251 $669,913,630 $ Assumes the last 50% of active travel currently occurring in the SCAG region is attributable to active transportation infrastructure. 2 Results apply to the 2012 U.S. Census Estimate for year olds for Imperial, Los Angeles, Orange, Riverside, San Bernardino, and Ventura Counties (11,722,630). 3 Hypertension, heart disease, and diabetes can be summed with minimal double counting due to statistical controls in original COI studies; obesity, as a risk factor for all three conditions cannot be included in the total without introducing significant double counting. million from fewer cases of diabetes. It is appropriate to add these conditions together with minimal double counting, suggesting an aggregate annual savings from increased physical activity of $275.5 million or $23.50 for each of the 11.7 million adults ages in the SCAG region. 17
18 Similar results are provided for seniors (65+) for the SCAG region in Table 6 below. Over $141 million in direct and $70 million in indirect costs would occur annually for seniors without the active transportation system, based on the same assumption that 50% of the active transportation travel currently occurring in the SCAG region is attributable to active transportation infrastructure. The total per capita costs are much higher for seniors ($99.72) than adults ($23.50). This reflects the stronger effect of the built environment in preventing diabetes and heart disease for seniors. Table 6: Estimated Annual Physical Activity 1 Health Savings (2011$) for Seniors 2 in SCAG Region by Cost Type - Hypertension, Heart Disease, Diabetes, and Obesity Health Condition Direct Indirect Total Per Capita Hypertension $7,798,086 $622,715 $8,420,801 $3.95 Heart Disease $27,570,043 $25,009,230 $52,579,273 $24.67 Diabetes $106,294,078 $45,271,378 $151,565,456 $71.10 Subtotal 3 $141,662,208 $70,903,323 $212,565,530 $99.72 Obesity $105,929,342 $7,961,531 $113,890,873 $ Assumes the last 50% of active travel currently occurring in the SCAG region is attributable to active transportation infrastructure. 2 Results apply to the 2012 U.S. Census estimate of 2.13 million seniors ages 65+ for Imperial, Los Angeles, Orange, Riverside, San Bernardino, and Ventura Counties. 3 Hypertension, heart disease, and diabetes can be summed with minimal double counting due to statistical controls in original COI studies; obesity, as a risk factor for all three conditions cannot be included in the total without introducing significant double counting. Adding adults and seniors together, the SCAG region s current active transportation system prevents $488 million in health related costs each year from physical activity. This includes preventing $335 million in healthcare expenditures and $153 million in benefits from increased productivity annually. County Level Monetized Health Estimates Demographics and the built environment vary across the SCAG region suggesting the benefits of the active transportation network may also vary. The health modeling in C-PHAM occurred at the 150x150 meter grid (see previous section). This spatial scale allows the results for each grid to be aggregated to larger geographies, including county. The monetized health results were subtotaled by county and are provided for adults (Table 7) and seniors (Table 8). Total benefits direct and indirect for hypertension, heart disease, and diabetes are shown in Error! Reference source not found. and Error! Reference source not found.. 15 Monetized totals by county incorporate differences in predicted prevalence rates. Because county populations vary significantly, this difference is difficult to see when comparing the total monetized benefits. To address this, a per capita benefit is provided in brackets (Table 7 for adults and Table 8 for seniors) to normalize by county size. For example, the diabetes benefits range from $12.49 per adult aged in Orange County to $17.36 in Riverside County. In general, adults in Los Angeles see similar per capita benefits as that of the greater region; Orange and Ventura County per capita benefits are lower than the region; and the Inland Empire (Riverside and San Bernardino) show higher than regional per capita benefits. Error! Reference source not found. shows the differences in per capita benefits by county and disease. Table 8 reflects similar patterns of per capita benefits by county. The largest difference from adults is that seniors show significantly higher per capita benefits for heart disease and diabetes; this reflects the 15 Monetized benefits for Adults and Seniors by Disease at the county level are provided in Appendix F. 18
19 stronger relationship between physical activity and better health outcomes for seniors. Table 7: Monetized Annual Health Benefits (Total and Per Capita) by County and Disease, Adults (18-64) Direct + Indirect Benefits for Adults (18-64) [Per Capita Benefits] County Hypertension Heart Disease Diabetes Total 1 Obesity Los Angeles $23,161,601 $29,347,776 $99,764,598 $152,273,976 $364,361,166 [$3.59] [$4.54] [$15.45] [$23.58] [$56.42] Orange $6,513,500 $8,508,728 $24,663,510 $39,685,739 $97,767,803 [$3.30] [$4.31] [$12.49] [$20.11] [$49.53] Riverside $5,192,384 $7,326,752 $23,712,631 $36,231,767 $88,276,793 [$3.80] [$5.36] [$17.36] [$26.52] [$64.62] San Bernardino $4,884,564 $6,391,889 $21,891,510 $33,167,963 $83,326,792 [$3.77] [$4.93] [$16.89] [$25.59] [$64.30] Ventura $1,919,428 $2,490,022 $7,625,228 $12,034,678 $31,495,044 [$3.68] [$4.77] [$14.61] [$23.06] [$60.34] SCAG 2 $42,019,411 [$3.58] $54,474,757 [$4.65] $179,038,560 [$15.27 $275,532,728 [$23.50] $669,913,630 [$57.15] 1 Hypertension, heart disease, and diabetes can be summed with minimal double counting due to statistical controls in original COI studies; obesity, as a risk factor for all three conditions cannot be included in the total without introducing significant double counting. 2 Imperial County is not reported due to small sample size and insufficient built environment data. The SCAG benefit assumes Imperial County prevalence rates will match the SCAG average. Table 8: Monetized Annual Health Benefits (Total and Per Capita) by County and Disease, Seniors (65+) Direct + Indirect Benefits for Seniors (65+) [Per Capita Benefits] County Hypertension Heart Disease Diabetes Total 1 Obesity Los Angeles $4,516,440 $27,784,105 $84,734,149 $117,034,694 $60,458,543 [$3.95] [$24.27] [$74.03] [$102.25] [$52.82] Orange $1,528,914 $9,031,832 $23,063,178 $33,623,924 $17,713,742 [$4.01] [$23.67] [$60.44] [$88.11] [$46.42] Riverside $1,103,170 $7,472,695 $20,106,714 $28,682,579 $16,590,345 [$3.92] [$26.54] [$71.40] [$101.86] [$58.92] San Bernardino $778,800 $5,147,716 $15,354,327 $21,280,844 $12,380,653 [$3.91] [$25.87] [$77.17] [$106.96] [$62.22] Ventura $416,135 $2,654,773 $7,027,758 $10,098,665 $5,826,039 [$3.95] [$25.19] [$66.67] [$95.81] [$55.27] SCAG 2 $8,420,801 [$3.95] $52,579,273 [$24.67] $151,565,456 [$71.10] $212,565,530 [$99.72] $113,890,873 [$53.43] 1 Hypertension, heart disease, and diabetes can be summed with minimal double counting due to statistical controls in original COI studies; obesity, as a risk factor for all three conditions cannot be included in the total without introducing significant double counting. 2 Imperial County is not reported due to small sample size and insufficient built environment data. The SCAG benefit assumes Imperial County prevalence rates will match the SCAG average. 19
 Monetized Health Benefits by")

20 Figure 7. Total (Direct + Indirect for Hypertension, Heart Disease, and Diabetes) Monetized Health Benefits by County, Adults (18-64) *Imperial County is not reported due to small sample size and insufficient built environment data. The SCAG benefit assumes Imperial County prevalence rates will match the SCAG average. Figure 8: Annual Per Capita Monetized Health Benefit for Adults (ages 18-64) by County 20
 was used to estimate the number of avoided cases obesity, diabetes, hypertension, and heart disease in 2040 from")
21 4.3 Understanding Health Impacts of Planned Infrastructure 16 SCAG recently adopted the 2016 RTP/SCS. As part of the RTP/SCS process, the California Public Health Assessment Model (C-PHAM) was used to estimate the number of avoided cases obesity, diabetes, hypertension, and heart disease in 2040 from implementation of the RTP/SCS. The subsections below provide health outcomes, changes in healthcare expenditures, and indirect health benefits associated with the health outcomes reported in the RTP/SCS. Modeling Health Outcomes from Increased Physical Activity The original RTP/SCS analysis focused on Figure 9. Modeled Health Outcomes for 2016 RTP Scenarios, Adults the areas where there would be change, such as increased density, additional mixed use development, and active transportation investments, and the resultant increase of population of 2.56 million adults (age only; excludes seniors age 65+) in those areas. For the purposes of monetization in this report, this analysis assumes all adults ages in areas with planned housing or employment growth or transportation investments showed similar increases in health. Since these analyses include input variables describing the built environment, those people living in the parts of the region not planned/forecasted to change are not included. This is a conservative approach due to its focus on people s home location. Even though the built environment where someone lives is very important to their mode choice and resulting physical activity levels, people can also be impacted by the built environment of where they work, learn and play. Table 9 shows projected adult (ages 18-64) prevalence rates in 2040 based upon forecasted trends and fully implementing the planned active transportation strategies in the 2016 RTP/SCS. The difference in prevalence would result in 15,076 avoided diabetes cases, 81,657 avoided cases of hypertension, and 15,985 avoided cases of heart disease. Table 9. Predicted Adult 1 (ages 18-64) Prevalence and Avoided Cases from Increased Physical Activity in 2040 for RTP/SCS Scenarios as Modeled by C-PHAM Health Outcomes from Increased Prevalence Rates in 2040 Physical Activity Associated with Implementing RTP Health Condition Forecasted Trend 2016 RTP Prevalence Number of Cases Diabetes 6.1% 6.0% -0.1% -15,076 Hypertension 21.5% 20.8% -0.6% -81,657 Heart Disease 4.4% 4.2% -0.1% -15,985 1 Analysis originally applied to the 2.56 million additional adults ages who live in areas with built environment change; all adults ages in areas of built environment change are assumed to have similar benefits for this application. 16 See Appendix A and Appendix C for a more detailed discussion of methodology. 21
22 Monetizing Public Health Morbidity Benefits Avoided cases of diabetes, hypertension, and heart disease will result in both reduced healthcare expenditures and indirect labor productivity gains. Table 10 shows the health benefits of implementing the RTP will be $337 million annually; $226 million will be from reduced healthcare expenditures and $111 million will be from productivity gains. Assuming a steady rate of implementation, the cumulative impact will be nearly $5 billion over the life of the plan. Table 10. Predicted Annual Physical Activity Health Savings (millions, 2011$) in 2040 for Adults 1 (ages 18-64) by Cost Type Hypertension, Heart Disease, and Diabetes Condition Savings from Implementing RTP (in Millions) Direct Healthcare Expenditures Indirect Productivity Hypertension $45.00 $3.46 $48.46 Heart Disease $63.79 $57.86 $ Diabetes $ $49.95 $ Total Physical Activity Health Benefit $ $ $ Analysis originally applied to the 2.56 million additional adults ages who live in areas with built environment change; all adults ages in areas of built environment change are assumed to have similar benefits for this application. Total 22

23 5 Active Transportation s Effect on Regional Employment and Regional Economic Growth 17 Constructing, maintaining, and using active transportation infrastructure, such as bikeways, bike lanes, and sidewalks, provides economic and health benefits to a regional economy. Understanding the broad range of benefits provided by these investments is important in order to demonstrate their value to improved health. Quantifying these benefits also allows for a comparison to other transportation investments made by SCAG. Sections 3 and 4 above describe direct and indirect impacts of the active transportation system. This section describes how those impacts multiply throughout the SCAG region s economy to create employment and wages; increase sales output; and increase value added to the region. An input-output econometric model used in other SCAG planning activities, REMI s Transight, is used here to capture how the funding and use of active transportation infrastructure impacts the overall regional economy. It is a leading tool for evaluation of the total economic effects of transportation systems. Travel demand modeling results are integrated with the REMI economic impact model to demonstrate how transportation contributes to economic competitiveness. The model is constructed with data from a wide range of economic and transportation topical areas, includes key econometric estimates, and integrates inter industry transactions, long run equilibrium features, and regional characteristics. REMI s Transight model includes: Understanding Regional Economic Indicators REMI s Transight model captures annual regional economic growth using the following metrics: substitution among factors of production in response to changes in relative factor costs; labor migration responses to changes in expected income and employment opportunity; access to regional and national consumer commodities, and exposure to positive and negative amenities; labor participation rate responses to changes in real wage and employment conditions; wage rate responses to labor market changes; consumer consumption responses to changes in real disposable income and commodity prices; and local, regional, and market shares responses to changes in regional production costs and in agglomeration economics. The output of this model includes key economic indicators including (1) employment (2) associated 17 This section is based on Appendix D and E, which include a more detailed discussion of the REMI methodology and application. 23
24 changes in personal income from employment; (3) output or sales and (4) a measure of value added. Impacts to the region primarily result from (1) changes in construction and active transportation programmatic strategy spending and (2) improved labor productivity from workers who are healthier due to increased physical activity. Healthcare expenditures, while positive from a public policy standpoint, have the effect of shrinking economic activity in the healthcare sector. Additional smaller, but positive, impacts accrue from changes in healthcare spending, travel costs, mobility, and amenities. Impacts from construction and strategy/programmatic spending, mobility, amenities, and travel spending and labor productivity are all positive economic impacts. 5.1 Regional Economic Impacts of Implementing the 2016 RTP/SCS Active Transportation Infrastructure Implementing the active transportation investments within the 2016 RTP/SCS will result in significant annual and cumulative benefits. On average, spending from the active transportation portion of the RTP (AT-RTP) results in 11,500 jobs each year. Over the life of the plan, this results in $36 billion in personal income, and $113 billion in output sales resulting in $70 billion in value added to the region. Each indicator is discussed below. Output Sales output from active transportation averages $4.53 billion annually. Cumulative active transportation RTPinduced output over the life of the RTP is $113.3 billion. When normalized by AT- RTP spending, every $1 spent in support of more walkable and bikeable communities is expected to increase sales output by $8.41. Figure 10. Increased Sale Output per $1 in AT-RTP Spending Sales output is strongly influenced by construction spending rippling through the economy: $26.6 billion or 24% of the cumulative benefit is from construction, programmatic, and strategic spending. This equates to $1.97 in output from construction and strategy spending for every $1 spent on the AT-RTP. Improvements in labor productivity due to healthier workers is the largest contributor to increased sales output; $79.5 billion or approximately 70% of economic growth is attributable to labor productivity gains. This is complemented by a small increase to regional sales output for general goods due to reduced demand for healthcare on average, $30 million a year. Together, there is $5.96 in healthdriven output for every $1 spent on the AT-RTP. Active transportation reduces the cost of travel through lower fuel and vehicle maintenance costs. Another $700 million in sales output over the life of the RTP or $0.05 for every $1 spent are expected from lower household travel costs. Active transportation also results in less congestion. Sales output increases $5.2 billion over the life of the RTP from savings due to less time spent in traffic. 24
 for 2016-2040 (2015 $) Sales Output, 2016-2040 (2015$) Cumulative (billions) Average (billions) Per $1 AT- RTP Spent Labor")
25 Table 11. Sales Output (Cumulative, Yearly Average, and Benefit per $1 AT-RTP Spent) for (2015 $) Sales Output, (2015$) Cumulative (billions) Average (billions) Per $1 AT- RTP Spent Labor Productivity (Healthier Workers) $79.5 $3.18 $5.90 Mobility (Less Congestion) $5.2 $0.21 $0.38 Amenities (Air Quality) $0.5 $0.02 $0.04 Household Travel Spending $0.7 $0.03 $0.05 Healthcare Expenditures $0.8 $0.03 $0.06 Construction + Strategy $26.6 $1.06 $1.97 RTP Total $113.3 $4.53 $8.41 Current Infrastructure Health Effects $63.2 $2.53 $10.07* *Current infrastructure per $1 spent assumes current levels of active transportation spending over the past 25 years or $6.0 billion (2011$). All other rows reflect the RTP analysis and are normalized by $12.9 billion (2011$) in expected future RTP spending on active transportation. Figure 11. Output from Active Transportation, ($ billions, 2015$) $ Billions Labor Productivity Mobility Amenities Travel Spend Healthcare Construction + Strategy Value Added Value added is a measure of regional Figure 12. Increased Value Added per $1 in AT-RTP Spending economic activity that restricts output to components (manufacturing inputs including labor) that occur inside the SCAG region. Value added impacts are important as they accrue to businesses inside the region. Value added from implementing the RTP active transportation element averages $2.80 billion annually. Cumulative AT-RTPinduced value added over the life of the RTP is $70.1 billion. When normalized by AT-RTP spending, every $1 spent is expected to increase value added by $5.20. Value added is most impacted by improvements in labor productivity due to healthier workers, with 25
26 $49.2 billion or approximately 70% is attributable to labor productivity. Value added is increased further by a small increase from consumers shifting demand from healthcare to other goods on average, $10 million a year. Together, there is $3.68 in health-driven value added for every $1 spent on the AT-RTP. Construction spending as it multiplies throughout the economy also contributes to value added; $16.3 billion, or 23% of value added, is from construction, programmatic, and strategic spending. This equates to $1.21 in value added for every $1 spent on the AT-RTP. Table 12. Value Added (Cumulative, Yearly Average, and Benefit per $1 AT-RTP Spent) for (2015 $) Value Added, (2015$) Cumulative (billions) Average (billions) Per $1 AT-RTP Spent Labor Productivity (Healthier Workers) $49.2 $1.97 $3.65 Mobility (Less Congestion) $3.2 $0.13 $0.24 Amenities (Air Quality) $0.3 $0.01 $0.03 Household Travel Spending $0.8 $0.03 $0.06 Healthcare Expenditures $0.4 $0.01 $0.03 Construction + Strategy $16.3 $0.65 $1.21 AT-RTP Total $70.1 $2.80 $5.20 Current Infrastructure Health Effects $38.7 $1.55 $6.16* *Current infrastructure per $1 spent assumes current levels of active transportation spending over the past 25 years or $6.0 billion (2011$). All other rows reflect the RTP analysis and are normalized by $12.9 billion (2011$) in expected future RTP spending on active transportation. Figure 13. Value Added from Active Transportation, ($ Billions, 2015$) $ Billions Labor Productivity Mobility Amenities Travel Spend Healthcare Construction + Strategy 26
.")
27 Employment Over the forecast period, , an estimated average of 11,500 jobs are created each year. The jobs are largely attributable to labor productivity from improved health outcomes and the construction of active transportation infrastructure (Figure 14). There are modest employment benefits associated with reduced congestion (mobility) and reduced travel spending. There are also modest reductions in employment in the healthcare sector. The most notable change over time occurs in 2021 when additional infrastructure construction spending begins. Figure 14. Employment Gains per $1 in AT-RTP Spending Figure 15. Employment Gains from Active Transportation, Thousands, Thousands Labor Productivity Mobility Amenities Travel Spend Healthcare Construction + Strategy Table 13. Employment Benefits (Cumulative, Yearly Average, and Benefit per $1 Billion AT-RTP Spent) for Jobs (1 year), (2015$) Per $1 Billion AT-RTP Cumulative Average Spent Labor Productivity (Healthier Workers) 106,637 4,265 7,910 Mobility (Less Congestion) 12, Amenities (Air Quality) 3, Household Travel Spending 6, Healthcare Expenditures Construction + Strategy 158,667 6,347 11,770 AT-RTP Total 287,490 11,500 21,326 Current Infrastructure Health Effects 88,936 3,557 14,170* *Current infrastructure per $1 billion spent assumes current levels of active transportation spending over the past 25 years or $6.0 billion (2011$). All other rows reflect the RTP analysis and are normalized by $12.9 billion (2011$) in expected future RTP spending on active transportation. 27
 account for the vast majority of job creation: 11,770 jobs per $1 billion of RTP active")
28 Table 13 shows job creation by different active transportation economic drivers. Spending on construction and programmatic strategies (including education and encouragement strategies) account for the vast majority of job creation: 11,770 jobs per $1 billion of RTP active transportation spent. This includes both direct construction jobs and more general jobs created by increased spending by the construction workers. Healthier workers are more productive, allowing businesses to hire an additional 7,910 annual workers for every $1 billion in RTP active transportation spent. This is offset by slight job losses from reduced demand for healthcare. Household travel savings also free up household budgets, resulting in consumer spending that creates 481 jobs per $1 billion of AT-RTP spent. Another way to analyze job creation is to ask in which sectors the job creation occurs. Again, RTP spending on active transportation infrastructure concentrates over a quarter of the jobs created in the construction sector (Error! Reference source not found.) with spillover into manufacturing (13%), housing and food (9%), and finance/insurance (6%). Reduced healthcare expenditures will result in concentrated job loss in health care and in associated professional science and technology jobs such as laboratories. Figure 16. Top Sectors Impacted by Employment (from AT-RTP and Current Infrastructure Health Gains), Finance + Insurance Professional, Scientific, and Technical Services Accomm. + Food Svcs Manufacturing Construction -15% -10% -5% 0% 5% 10% 15% 20% 25% 30% Personal Income Personal income captures the wages associated with increased employment. Over $35.7 billion in personal income is gained over the life of the RTP from the active transportation portion of the RTP (Table 14), averaging $1.43 billion annually. When normalized by RTP spending on active transportation, every $1 spent is expected to increase personal income by $2.65 (Figure 17. Figure 17. Increased Personal Income (wages) per $1 in AT-RTP Spending Personal income, like value added and sales output, is strongly impacted by construction spending: $15.6 billion (44%) of the cumulative 28
STAFF REPORT Regional Transportation Plan/Sustainable Communities Strategy (RTP/SCS) Scenario Performance Update for Board Direction
 Scenario Performance Update for Board Direction") November 2017 Board of Directors STAFF REPORT SUBJECT: RECOMMENDED ACTION: 2018 Regional Transportation Plan/Sustainable Communities Strategy (RTP/SCS) Scenario Performance Update for Board Direction Support
November 2017 Board of Directors STAFF REPORT SUBJECT: RECOMMENDED ACTION: 2018 Regional Transportation Plan/Sustainable Communities Strategy (RTP/SCS) Scenario Performance Update for Board Direction Support
Draft Environmental Impact Statement. Appendix G Economic Analysis Report
 Draft Environmental Impact Statement Appendix G Economic Analysis Report Appendix G Economic Analysis Report Economic Analyses in Support of Environmental Impact Statement Carolina Crossroads I-20/26/126
Listed below is a breakdown of specific project economic benefits:
 Appendix 17 Los Angeles County is requesting that the California Transportation Commission (CTC) secure the other half of the $3.6 billion in needed funding from the $2.7 billion South County portion of
Southern California Association of Governments (SCAG) Metropolitan Planning Organization (AMPO) Annual Conference. Prepared for
 Metropolitan Planning Organization (AMPO) Annual Conference. Prepared for") Congestion Pricing Modeling and Results for Express Travel Choices Study Kazem Oryani and Cissy Kulakowski, CDM Smith Portland, Oregon, October 22 25, 2013 Prepared for Southern California Association
Congestion Pricing Modeling and Results for Express Travel Choices Study Kazem Oryani and Cissy Kulakowski, CDM Smith Portland, Oregon, October 22 25, 2013 Prepared for Southern California Association
I-75 at Overpass Road Interchange
 Benefit-Cost Analysis Supplementary Documentation TIGER Grant Program I-75 at Overpass Road Interchange Pasco County, FL October 16, 2017 0 Benefit-Cost Analysis Supplementary Documentation 1. Introduction
Regional Travel Study
 PSRC S Regional Travel Study 1999 KEY COMPARISONS OF 1999,, AND TRAVEL SURVEY FINDINGS Puget Sound Regional Council JUNE 2015 PSRC S Regional Travel Study / JUNE 2015 Funding for this document provided
CHAPTER 5 INVESTMENT PLAN
 CHAPTER 5 INVESTMENT PLAN This chapter of the 2014 RTP/SCS plan illustrates the transportation investments for the Stanislaus region. Funding for transportation improvements is limited and has generally
2008 Cecil County Public Opinion Survey Results Summary
 Cecil County Public Opinion Survey Results Summary Survey completed by Public National Research Center Inc. Report created by WILMAPCO September www.wilmapco.org September 29, About the Survey PURPOSE
Population, Housing, and Employment Methodology
 Appendix O Population, Housing, and Employment Methodology Final EIR APPENDIX O Methodology Population, Housing, and Employment Methodology This appendix describes the data sources and methodologies employed
Economic Impact of Public Transportation Investment 2014 UPDATE
 Economic Impact of Public Transportation Investment 2014 UPDATE May 2014 Acknowledgements This study was conducted for the American Public Transportation Association (APTA) by Economic Development Research
Economic Impact Analysis of the Downtown Green Line Vision Plan and Georgia Multi-modal Passenger Terminal
 Economic Impact Analysis of the Downtown Green Line Vision Plan and Georgia Multi-modal Passenger Terminal Summary Released January 2012 Prepared for Central Atlanta Progress/Atlanta Downtown Improvement
Big Chino Water Ranch Project Impact Analysis Prescott & Prescott Valley, Arizona
 Big Chino Water Ranch Project Impact Analysis Prescott & Prescott Valley, Arizona Prepared for: Central Arizona Partnership August 2008 Prepared by: 7505 East 6 th Avenue, Suite 100 Scottsdale, Arizona
The Potential for Shared Use Mobility in Affordable Housing Complexes in Rural California
 The Potential for Shared Use Mobility in Affordable Housing Complexes in Rural California A Research Report from the University of California Institute of Transportation Studies Susan Pike, Ph.D., Post-Doctoral
A Culture of Health: What your General Plan can do for you and what you can do for your General Plan
 2015 A Culture of Health: What your General Plan can do for you and what you can do for your General Plan Elizabeth Baca, MD, MPA Senior Health Advisor Governor s Office of Planning and Research December
Estimate of a Work and Save Plan in Georgia
 1 JUNE 6, 2017 Estimate of a Work and Save Plan in Georgia Wesley Jones Sally Wallace 2 Introduction AARP Georgia commissioned the Center for State and Local Finance at Georgia State University to estimate
The Effects of the Sales and Use Tax Exemption For Repairs to Railroad Rolling Stock
 The Effects of the Sales and Use Tax Exemption For Repairs to Railroad Rolling Stock Compiled by the staff of the Education and Taxability Section, Wyoming Department of Revenue and edited by Terri Lucero,
32 nd Street Corridor Improvements
 Benefit-Cost Analysis Supplementary Documentation TIGER Discretionary Grant Program 32 nd Corridor Improvements USDOT TIGER BCA Results City of Joplin, MO April 29, 2016 32nd Corridor Improvements Contents...
Impacts of Amtrak Service Expansion in Kansas
 Impacts of Amtrak Service Expansion in Kansas Prepared for: Kansas Department of Transportation Topeka, KS Prepared by: Economic Development Research Group, Inc. 2 Oliver Street, 9 th Floor Boston, MA
Regional Economic Development Impacts of Transportation Investments
 Transportation Decision-making Principles of Project Evaluation and Programming Regional Economic Development Impacts of Transportation Investments Kumares C. Sinha and Samuel Labi 1 Background Contents
Chapter 10 Equity and Environmental Justice
 Chapter 10 Equity and Environmental Justice Introduction An important consideration for the 2040 Transportation Policy Plan is its impact on all populations in the Minneapolis-Saint Paul region, particularly
Overview of the Final New Starts / Small Starts Regulation and Frequently Asked Questions
 Overview of the Final New Starts / Small Starts Regulation and Frequently Asked Questions The Federal Transit Administration s (FTA) New Starts and Small Starts program represents the federal government
DRCOG is local officials working together to address the region's challenges for today and tomorrow. Metro Vision 2040
 DRCOG is local officials working together to address the region's challenges for today and tomorrow A plan to make life better for people of all ages, incomes and abilities Equitable sharing of costs and
TIGER IV. Benefit Cost Analysis. Minot International Airport Access Road. Minot, ND
 Appendix A TIGER IV Benefit Cost Analysis Minot International Airport Access Road Minot, ND Table of Contents Summary and Findings... 3 Net Economic Impacts to North Dakota... 4 Project Matrix... Error!
CITY OF LOS ANGELES INTER-DEPARTMENTAL CORRESPONDENCE
 CITY OF LOS ANGELES INTER-DEPARTMENTAL CORRESPONDENCE DATE: TO: Honorable City Council c/o City Clerk, Room 395, City Hall Attention: Honorable Nury Martinez, Chair, Energy and the Environment Committee
17,321 13,351. Overall Statewide Results. How was the survey taken? Do you own or lease a personal vehicle?
 10 Overall Statewide Results 3 2 How was the survey taken? 1 Houston 2 Dallas 3 Fort Worth 4 San Antonio 5 Austin 6 Laredo / Pharr 7 Corpus Christi / Yoakum 12 11 5 4 7 8 1 9 Internet Mail Phone 35% 61%
15,790. Bryan Waco Region. Do you own or lease a personal vehicle? What is your primary means of transportation?
 Bryan Waco Region 1 Houston 2 Dallas 3 Fort Worth 4 San Antonio 5 Austin 6 Laredo Pharr 7 Corpus Christi Yoakum 8 Bryan Waco 9 Atlanta Beaumont Lufkin Paris Tyler 10 Amarillo Childress Lubbock Wichita
APPENDIX F. Port of Long Beach Pier S Labor Market Study. AECOM July 25, 2011
 APPENDIX F Port of Long Beach Pier S Labor Market Study AECOM July 25, 2011 PORT OF LONG BEACH PIER S LABOR MARKET STUDY AECOM Economics Sustainable Economics Group July 26, 2011 DRAFT Table of Contents
CHAPTER 3: GROWTH OF THE REGION
 CHAPTER OVERVIEW Introduction Introduction... 1 Population, household, and employment growth are invariably Residential... 2 expected continue grow in both the incorporated cities Non-Residential (Employment)
4.6 POPULATION AND HOUSING
 L S A A S S O C I A T E S, I N C. D R A F T E N V I R O N M E N T A L I M P A C T R E P O R T 4.6 POPULATION AND HOUSING 4.6.1 Introduction This section provides a discussion of the existing population,
ECONOMIC ISSUES AND OPPORTUNITIES PAPER
 ECONOMIC ISSUES AND OPPORTUNITIES PAPER Introduction The purpose of this paper is to identify important economic issues that need to be addressed in order to create policy options for the City of Simi
WILMAPCO Public Opinion Survey Summary of Results
 Wilmington Area Planning Council WILMAPCO Public Opinion Survey Summary of Results April 2018 Prepared by: 2955 Valmont Road, Suite 300 Boulder, Colorado 80301 t: 303-444-7863 f: 303-444-1145 www.n-r-c.com
I-81 Corridor Improvement Plan. October 2018 Public Meetings
 I-81 Corridor Improvement Plan October 2018 Public Meetings I-81 Corridor Improvement Plan Overview of I-81 Corridor Improvement Plan purpose Summary of public feedback Prioritization of potential improvements
SKECHERS HERMOSA BEACH DESIGN CENTER & EXECUTIVE OFFICES
 SKECHERS HERMOSA BEACH DESIGN CENTER & EXECUTIVE OFFICES NET FISCAL IMPACT & ECONOMIC BENEFIT ANALYSIS HERMOSA BEACH, CA Prepared For: SKECHERS U.S.A., INC. Prepared By: KOSMONT COMPANIES 1601 N. Sepulveda
SCENARIO PLANNING CHAPTER 2015 REGIONAL MASTER PLAN. For the Rockingham Planning Commission Region
 SCENARIO PLANNING CHAPTER 2015 REGIONAL MASTER PLAN For the Rockingham Planning Commission Region Contents Introduction to... ii Vision and Objective... 1 Basis in Projections... 1 Population Projections...
Economic Impact of the Oklahoma Manufacturing Sector Winter 2018 Prepared by Prepared for
 Economic Impact of the Oklahoma Manufacturing Sector Winter 2018 Prepared by Prepared for Population, Labor Force, & Employment Summary Population in any given year is determined by adding the net natural
The Effects of the Sales and Use Tax Exemption For Qualifying Data Processing Services Center s Purchases and Rentals
 The Effects of the Sales and Use Tax Exemption For Qualifying Data Processing Services Center s Purchases and Rentals Compiled by the staff of the Education and Taxability Section, Wyoming Department of
4.12 POPULATION, HOUSING, AND EMPLOYMENT
 SCOPE AND METHODOLOGY 4.12 POPULATION, HOUSING, AND EMPLOYMENT This section discusses the effects the proposed project may potentially have on local and regional population, housing, and employment. The
State of Wisconsin Department of Administration Division of Energy
 State of Wisconsin Department of Administration Division of Energy Focus on Energy Public Benefits Evaluation Low-income Weatherization Assistance Program Evaluation Economic Development Benefits Final
Project Prattville : : The Next Chapter
 Welcome Introductions How Well Do You Know Prattville? Comp Planning 101 Schedule & Products Prattville in 2008 Questions & Answers The Planning Stations Next Steps Project Team Urban Collage Urban Design
Appendix C-5 Environmental Justice and Title VI Analysis Methodology
 Appendix C-5 Environmental Justice and Title VI Analysis Methodology Environmental Justice Analysis SACOG is required by law to conduct an Environmental Justice (EJ) analysis as part of the MTP/SCS, to
Introduction...1. Project Overview.2. Cache la Poudre River NHA Economic Impact 4. Conclusion..10. Appendix A: Glossary of Terms 11
 TABLE OF CONTENTS Introduction...1 Project Overview.2 Cache la Poudre River NHA Economic Impact 4 Conclusion..10 Appendix A: Glossary of Terms 11 Appendix B: Research Methodology 12 Acknowledgements.18
Strategic Performance measures
 Strategic Performance measures 2012 RepoRt background In 2007, the RTA worked with CTA, Pace, and Metra as well as other community stakeholders to develop a Regional Transportation Strategic Plan. This
Employer-Based Commuter Benefits Programs: How they Work and their Impacts February 9, 2017
 Employer-Based Commuter Benefits Programs: How they Work and their Impacts February 9, 2017 Michael Grant ICF Purpose / Overview Understanding types of commuter benefits programs What they are, how they
SB 83 Additional Vehicle Registration Fee Expenditure Plan (July 15, 2010)
") 1. INTRODUCTION A. SUMMARY In late October, the Governor signed into law SB 83 (Hancock), which authorizes congestion management agencies (CMAs) to impose an annual vehicle registration fee increase of
1. INTRODUCTION A. SUMMARY In late October, the Governor signed into law SB 83 (Hancock), which authorizes congestion management agencies (CMAs) to impose an annual vehicle registration fee increase of
Cost-Benefit Analysis of Rural and Small Urban Transit
 Cost-Benefit Analysis of Rural and Small Urban Transit Prepared for: U.S. Department of Transportation Prepared by: Ranjit Godavarthy Jeremy Mattson Elvis Ndembe North Dakota State University Upper Great
The Economic Impact of Northern Virginia Transportation Authority Capital Investment
 The Economic Impact of Northern Virginia Transportation Authority Capital Investment Prepared for Northern Virginia Transportation Authority November 26, 2018 1309 E Cary Street, Richmond, VA 23219 1025
GENERAL INFORMATION ABOUT THE CONTENTS OF THIS FILE
 GENERAL INFORMATION ABOUT THE CONTENTS OF THIS FILE Submissions by the public in compliance with the Commission Rules and Operating Procedures (ROPs), Rule 4.3, are distributed to the Commission and uploaded
Puget Sound 4K Model Version Draft Model Documentation
 Puget Sound 4K Model Version 4.0.3 Draft Model Documentation Prepared by: Puget Sound Regional Council Staff June 2015 1 Table of Contents Trip Generation 9 1.0 Introduction 9 Changes made with Puget Sound
CHAPTER 2: SOCIO-ECONOMIC PROFILE
 2040 Regional Transit Element CHAPTER 2: SOCIO-ECONOMIC PROFILE STUDY AREA The study area for this 2040 RTE is the NFRMPO region, also designated by the Colorado Department of Transportation (CDOT) as
Impacts of Socio-Demographic Changes on the New Zealand Land Transport System
 Impacts of Socio-Demographic Changes on the New Zealand Land Transport System Adolf Stroombergen, Infometrics Michael Bealing & Eilya Torshizian, NZIER Jacques Poot, Waikato University Presentation to:
FY 2011 Continuing Appropriations Act. TIGER Discretionary Grant Program
 FY 2011 Continuing Appropriations Act TIGER Discretionary Grant Program Highway 167 Improvement Project Appendices A Benefit Cost Analysis B Federal Wage Rate Certifications Submitted by Arkansas State
The Effects of the Sales and Use Tax Exemption For Repairs to Railroad Rolling Stock
 The Effects of the Sales and Use Tax Exemption For Repairs to Railroad Rolling Stock Compiled by the staff of the Education and Taxability Section, Wyoming Department of Revenue and edited by Kim Lovett,
4.3 Economic and Fiscal Impacts
 4.3 This section evaluates the potential economic, and fiscal impacts that could arise from the construction and long-term operation of the proposed East San Fernando Valley Transit Corridor Project. 4.3.1
2012 TIGER Grant Application Benefit Cost Analysis Technical Memo March 19, 2012
 Improved US 70 with Railroad Grade Separation (Highway Overpass) Valliant, Oklahoma 2012 TIGER Grant Application Benefit Cost Analysis Technical Memo March 19, 2012 Project Summary The Improved US 70 with
Economic impact of the National Cycle Network
 Economic impact of the National Cycle Network This report identifies some of the benefits of the National Cycle Network (NCN), from the wider economic benefits of the whole network to the impact on the
Arvada, Colorado. Citizen Survey. Report of Results October Prepared by:
 Arvada, Colorado Citizen Survey Prepared by: 2955 Valmont Road Suite 300 Boulder, Colorado 80301 t: 303-444-7863 f: 303-444-1145 www.n-r-c.com Prepared by National Research Center, Inc. Arvada Citizen
Economic Impacts of Road Project Timing Shifts in Sarasota County
 Economic Impacts of Road Project Timing Shifts in Sarasota County Prepared for: Prepared by: Economic Analysis Program Featuring REMI Policy Insight and IMPLAN October 22 Introduction Improving traffic
Automobile Ownership Model
 Automobile Ownership Model Prepared by: The National Center for Smart Growth Research and Education at the University of Maryland* Cinzia Cirillo, PhD, March 2010 *The views expressed do not necessarily
Middle Tennessee Transporta/on and Health Study
 Middle Tennessee Transporta/on and Health Study Tennessee Model User s Group November 14, 2013 Dr. Daniel Rodriguez History Household Travel Surveys Household travel surveys are conducted in most major
TESTIMONY. The Texas Transportation Challenge. Testimony Before the Study Commission on Transportation Financing
 TESTIMONY The Texas Transportation Challenge Testimony Before the Study Commission on Transportation Financing Ric Williamson Chairman Texas Transportation Commission April 19, 2006 Texas Department of
CHAPTER 4 FINANCIAL STRATEGIES: PAYING OUR WAY
 The financial analysis of the recommended transportation improvements in the 2030 San Diego Regional Transportation Plan: Pathways for the Future (RTP or the Plan ) focuses on four components: Systems
Arizona Low Income Housing Tax Credit and Housing Trust Fund Economic and Fiscal Impact Report
 Arizona Low Income Housing Tax Credit and Housing Trust Fund Economic and Fiscal Impact Report Prepared for: Arizona Department of Housing January 2014 Prepared by: Elliott D. Pollack & Company 7505 East
OVERVIEW OF THE SAN DIEGO REGION Current Conditions and Future Trends
 OVERVIEW OF THE SAN DIEGO REGION Current Conditions and Future Trends Why do we need a Regional Comprehensive Plan? Let s examine the facts. It helps to look at some objective statistical information that
Appendix N. Evaluating the Performance of the Transportation Network
 Appendix N Evaluating the Performance of the Transportation Network Appendix Contents Introduction Scorecard for San Diego Forward: The Performance Measures Development Process Public and Working Group
Sec Transportation management special use permits Purpose and intent.
 Sec. 11-700 Transportation management special use permits. 11-701 Purpose and intent. There are certain uses of land which, by their location, nature, size and/or density, or by the accessory uses permitted
Strategic Plan Progress Report Goal 2 Focus. July 2015 San Francisco, California
 Strategic Plan Progress Report Goal 2 Focus July 2015 San Francisco, California 1 Goal 2 focus Make transit, walking, bicycling, taxi, ridesharing and carsharing the preferred means of travel Objective
Fiscal Implications of Chronic Diseases. Peter S. Heller SAIS, Johns Hopkins University November 23, 2009
 Fiscal Implications of Chronic Diseases Peter S. Heller SAIS, Johns Hopkins University November 23, 2009 Defining Chronic Diseases of Concern Cancers Diabetes Cardiovascular diseases Mental Dementia (Alzheimers
OVERVIEW OF ALASKA REMI MODEL
 Growth Projections OVERVIEW OF ALASKA REMI MODEL The Alaska Regional Economic Model Inc. (REMI) was developed for Northern Economics (NEI) in a collaborative process with Regional Economic Models, Inc.
Development of a Risk Analysis Model for Producing High-Speed Rail Ridership and Revenue Forecasts
 Development of a Risk Analysis Model for Producing High-Speed Rail Ridership and Revenue Forecasts presented to The 5 th Transportation Research Board Conference on Innovations in Travel Modeling presented
APPENDIX I REVENUE PROJECTION AND ASSUMPTIONS
 APPENDIX I REVENUE PROJECTION AND ASSUMPTIONS The 2018 StanCOG Regional Transportation Plan/Sustainable Communities Strategy (RTP/SCS) financial forecasts provide revenue projections for StanCOG member
The Economic Impact of Short-Term Rentals In the State of Texas 2018 Update
 The Economic Impact of Short-Term Rentals In the State of Texas 2018 Update Prepared by TXP, Inc. 1310 South 1st Street, Suite 105 Austin, Texas 78704 (512) 328-8300 www.txp.com Overview The popularity
LEVEL OF SERVICE / COST & REVENUE ASSUMPTIONS
 LEVEL OF SERVICE / COST & REVENUE ASSUMPTIONS APPENDIX TO THE FISCAL IMPACT ANALYSIS OF PHASE I OF CAROLINA NORTH University of North Carolina-Chapel Hill Town of Chapel Hill, North Carolina Town of Carrboro,
ACTION ELEMENT CONCLUSIONS
 ACTION ELEMENT CONCLUSIONS The Action Element identifies all transportation projects within the horizon of the RTP/SCS and are financially constrained. This Action Element implements the Policy Element
Hot Springs Bypass Extension TIGER 2017 Application. Benefit-Cost Analysis Methodology Summary
 TIGER 2017 Application Overview This project proposes to extend the Hot Springs Bypass (US 70/US 270) from US 70 to State Highway 7 in Garland County, Arkansas. The 5.5 mile facility will initially consist
OHIO STATEWIDE TRANSIT NEEDS STUDY
 OHIO STATEWIDE TRANSIT NEEDS STUDY SUMMARY OF FINDINGS The Ohio Statewide Transit Needs Study was tasked with quantifying Ohio s transit needs, as well as recommending programmatic and policy initiatives
The Economic Impact of Infrastructure Improvements Proposed by the Connecticut Light and Power Company
 The Economic Impact of Infrastructure Improvements Proposed by the Connecticut Light and Power Company By: Stan McMillen, Manager, Research Projects Murat Arik, Senior Research Associate Revision Date:
NATIONAL LAND TRANSPORT PROGRAMME / INformation sheet / october 2012
 NATIONAL LAND TRANSPORT PROGRAMME 2012 15 / INformation sheet / october 2012 Creating transport solutions for a thriving New Zealand The NZ Transport Agency Board has adopted the 2012 15 National Land
University Link LRT Extension
 (November 2007) The Central Puget Sound Regional Transit Authority, commonly known as Sound Transit, is proposing to implement an extension of the Central Link light rail transit (LRT) Initial Segment
Purpose. 2 Third Crossing Business Plan
 Business Plan April 18, 2017 Purpose This is the third of three information sheets on critical pieces of work related to the preliminary design and business plan development for the Third Crossing. This
Net Impacts of Detailed Travel Efficiencies I-49 South Economic Impact Analysis Eric McClellan, CDM Smith
 Net Impacts of Detailed Travel Efficiencies I-49 South Economic Impact Analysis Eric McClellan, CDM Smith October 25, 2017 REMI Users Conference 2017 Evaluating Infrastructure Investment Project team Regional
Environmental Analysis, Chapter 4 Consequences, and Mitigation
 Environmental Analysis, Chapter 4 4.14 Economic and Fiscal Impacts This section evaluates potential impacts to local and regional economies during construction and operation of each project alternative.
Technical Report Documentation Page
 NOTICE: This research was funded by the Wisconsin Council on Research of the Wisconsin Department of Transportation and the Federal Highway Administration under Project #SPR-0092-03-07. The contents of
Page 2. Copies of the OODC Study can be requested from:
 Page 1 Copies of the OODC Study can be requested from: CALIFORNIA TRUCKING ASSOCIATION Policy and Government Relations Department Email: syang@caltrux.org Phone: (916) 373-3500 Website: www.caltrux.org
The Economic Impact Of Travel on Massachusetts Counties 2015
 The Economic Impact Of Travel on Massachusetts Counties 2015 A Study Prepared for the Massachusetts Office of Travel and Tourism By the Research Department of the U.S. Travel Association Washington, D.C.
INVESTING STRATEGICALLY
 11 INVESTING STRATEGICALLY Federal transportation legislation (Fixing America s Surface Transportation Act FAST Act) requires that the 2040 RTP be based on a financial plan that demonstrates how the program
Did not work at home: Less than 5 minutes Estimate Estimate Estimate
 Economics Traditionally, the Economics Element focused on data and analysis related to unemployment, employment by industry, and labor force characteristics of a community. For the 2015 Comprehensive Plan,
LOS ANGELES COUNTY METROPOLITAN TRANSPORTATION AUTHORITY TRANSPORTATION DEVELOPMENT ACT ARTICLE 3 BICYCLE AND PEDESTRIAN FUNDS
 LOS ANGELES COUNTY METROPOLITAN TRANSPORTATION AUTHORITY TRANSPORTATION DEVELOPMENT ACT ARTICLE 3 BICYCLE AND PEDESTRIAN FUNDS FISCAL YEAR 2018-2019 FUNDING AND ALLOCATION GUIDELINES CLAIMING TDA ARTICLE
Pasco County, Florida. Multi-Modal Mobility Fee 2018 Update Study
 Pasco County, Florida Multi-Modal Mobility 2018 Update Study PCPT December 3, 2018 PASCO COUNTY 2018 MULTI MODAL MOBILITY FEE UPDATE STUDY Prepared for: Pasco County, Florida Prepared by: W.E. Oliver,
Planning Committee STAFF REPORT June 3, 2015 Page 2 of 6 Committee a comparison between the old and new guidelines for Authority reference. Background
 Planning Committee STAFF REPORT Meeting Date: June 3, 2015 Subject Summary of Issues Recommendations Financial Implications Options Attachments - New Changes from Approval of Revised 2014 CTP Work Plan
Draft SFMTA Strategic Plan 11/14/2011, San Francisco California
 Draft SFMTA Strategic Plan 11/14/2011, San Francisco California Agenda Development of the Strategic Plan. Draft FY2013-FY2018 Strategic Plan. o Vision. o Mission. o Goals. o Objectives with Indicators
Table 2.7 I-73 Economic Impact Summary in Value Change (Alternatives compared to No-Build)
") The results are based on a forecast period between 2015 and 2030. These estimates represent only the economic impacts arising from travel efficiency savings and strategic development opportunities. They
The results are based on a forecast period between 2015 and 2030. These estimates represent only the economic impacts arising from travel efficiency savings and strategic development opportunities. They
Corridors of Commerce DRAFT Scoring and Prioritization Process. Patrick Weidemann Director of Capital Planning and Programming November 1, 2017
 Corridors of Commerce DRAFT Scoring and Prioritization Process Patrick Weidemann Director of Capital Planning and Programming November 1, 2017 Project Purpose To develop and implement a scoring and project
COMPREHENSIVE PLAN UPDATE EXECUTIVE SUMMARY. Plan Abstract
 Village of Swansea, Illinois 10/26/2017 Executive Summary COMPREHENSIVE PLAN UPDATE EXECUTIVE SUMMARY A Plan Abstract The following are excerpts from Swansea s 2017 Comprehensive Plan Update Comprehensive
Sustainable Urban Mobility Plans: Concept, process, content & benefits. Koprivnica 11 th of June 2015
 Sustainable Urban Mobility Plans: Concept, process, content & benefits /mobility-plans Koprivnica 11 th of June 2015 Is the increase of car traffic a natural law? Like a sunrise or a sunset Or like an
Analysis of the Alameda County Transportation Expenditure Plan Prepared by Alameda County Transportation Commission
 Analysis of the Alameda County Transportation Expenditure Plan Prepared by Alameda County Transportation Commission Discussion: In 1986, voters approved Measure B, a 1/2 cent sales tax, to fund transportation
Review of 91 Toll Road Funding
 Review of 91 Toll Road Funding 1. Summary The Orange County Grand Jury became interested in studying the financial feasibility of the 91 Toll Road because of newspaper articles and public interest. Our
Health Economics Program
 Health Economics Program Issue Brief 2003-05 August 2003 Minnesota s Aging Population: Implications for Health Care Costs and System Capacity Introduction After a period of respite in the mid-1990s, health
Parking Cash Out. Transportation Solutions Workshop Series April 19, 2017
 Parking Cash Out Transportation Solutions Workshop Series April 19, 2017 Workshop Series Sponsors Welcome from the Chamber of Commerce Grand Rapids is Changing New Approach to Transportation Workshop Agenda
The Economic Impacts of Senate Bill 1 on California s Inland Empire
 The Economic Impacts of Senate Bill 1 on California s Inland Empire Commissioned by The California Alliance for Jobs The California Transit Association Transportation California Prepared by JULY 2018 About
THE ECONOMIC IMPACT OF FEARRINGTON PLACE
 THE ECONOMIC IMPACT OF FEARRINGTON PLACE PREPARED FOR JESSE FEARRINGTON PREPARED BY COLUMBIA, SOUTH CAROLINA RESEARCH TRIANGLE PARK, NORTH CAROLINA APRIL 17, 2006 1 INTRODUCTION This report evaluates the