Appendix C-5 Environmental Justice and Title VI Analysis Methodology
|
|
|
- Primrose Harvey
- 6 years ago
- Views:
Transcription
1 Appendix C-5 Environmental Justice and Title VI Analysis Methodology Environmental Justice Analysis SACOG is required by law to conduct an Environmental Justice (EJ) analysis as part of the MTP/SCS, to determine whether the MTP/SCS benefits low-income and minority communities equitably, and whether the Plan s transportation investments have any disproportionate negative effects on minority and/or low-income populations in the SACOG region. SACOG has conducted such analyses in the last several MTPs. The results of the analysis as well as a full discussion of the legal framework are described in MTP/SCS Chapter 8 Equity and Choice. The Environmental Justice analysis developed for the MTP/SCS includes two components. First, Low Income High Minority (LIHM) Areas are identified to meet the statutory requirements for lowincome and minority communities for the analysis. Second the MTP/SCS plan and performance are analyzed to measure the benefits or impacts to these areas. Definitions in the 2012 MTP/SCS The U.S. Census is the basis for identifying geographic areas with concentrations of low income and/or minority populations in the region. There are numerous geographic levels at which Census data is available and considered reasonably reliable: county or city level, census tract level, block group level, and block level. Census blocks in urban areas may cover a city block or perhaps a large apartment complex; in rural areas they may cover a larger area because of the lower density of population or blocks may even be identified by physical boundaries but not actually include any population. Block groups are made up of a number of census blocks, on average about 39 blocks per block group, but there are variations. Census tracts are made up of block groups and always nest within a county. Per the U.S. Census Bureau, census tracts are designed to be relatively homogeneous units with respect to population characteristics, economic status and living conditions and average about 4,000 people in each tract 1. In 2011, SACOG developed criteria to define the areas to be analyzed for the 2012 MTP/SCS environmental justice analysis. This definition was informed by a vulnerability index developed by the UC Davis Center for Regional Change and an Equity, Housing and Public Health Working Group convened as part of SACOG s HUD Regional Sustainability Planning Grant. Minority populations were identified through the 2010 Census. However, changes to the decennial 2010 Census Program supplied a new source of other data through the American Community Survey (ACS). This annual nationwide sampling program replaced the decennial Census long form questions related to income, language, educational attainment, and a variety of other factors. Five
2 year ACS data for provided the best available income and vulnerability data at the time the 2012 Plan was being developed. For purposes of the 2012 Plan analysis, communities meeting one or both of the following criteria were analyzed: Low-Income Communities: Census Tracts where 45 percent or more of the population earns 200 percent or less of the federal poverty level, based on ACS data. Minority Communities: Census Block Groups where 70 percent or more of the population is Asian, Pacific Islander, African American, Hispanic, Native American or other Non-White ethnic group, based on 2010 Census data. Additionally, SACOG added the following criteria for defining areas for analysis, drawn from the CRC vulnerability index: Vulnerable Communities: Based on ACS data, Census Block Groups in the region that, when compared with the regional average, are in the top quintile on at least four of these five vulnerability measures: Housing cost burden: percent of renter- and owner-occupied housing units paying more than 50 percent of household income in housing costs. Single parent households: percent of family households with their own children under age 18 with a single householder. Older population: percentage of population aged 75 and older. Educational attainment: percentage of population 25 years and older with less than a high school degree. Linguistic isolation: percent of households where English is not the primary language and is not spoken very well. Areas included in the definition were those with a 30% or better confidence interval. This confidence interval is a statistical measure that indicates a high likelihood that the data accurately reflects the area s population. Combining all of these criteria, the low-income, minority and vulnerable communities that made up the areas for the 2012 analysis included about 26.5 percent of the total regional population. Data reliability is a concern when using ACS data. Because the sample size of the ACS is so much smaller than in the decennial long-form Census that was conducted in previous decades, errors are present in ACS data, called a margin of error. In statistical terms, a Margin of Error (MOE) is calculated for every estimate at the 90 percent confidence interval level. This means that if a Census estimate is 100 and the MOE is 20 then there is a 90 percent chance that the real number would be somewhere between 80 and 120 over the time period reported a fairly wide range. In this 2
3 example, the estimate would have a 20 percent reliability measure. If the Census estimate is 100 and the reliability measure is 50, this means that there is a 90 percent chance that the real number would be somewhere between 50 and 150 such a broad range as to be essentially unusable. SACOG developed a reliability test to assess if the SACOG region s ACS data is reliable enough to use, by dividing the margin of error by the estimate itself to derive a percentage. If the percentage was 30 percent then the estimate was considered by SACOG reliable enough to use. Identifying LIHM Areas for the 2016 MTP/SCS New five-year ( ) data became available from the ACS for the Sacramento region in time for the 2016 Plan analysis. SACOG staff revisited the 2012 criteria and determined that rather than using larger census tracts, ACS sample sizes had increased sufficiently to use the more specific block group geography available through the ACS. This allowed identifying more precisely the areas with higher concentrations of poverty in the region. SACOG staff confirmed with the Sounding Board using the following criteria updates to define the LIHM Areas to analyze in the 2016 MTP/SCS: Low-Income Communities: Census Block Groups where 45 percent or more of the population lives at 200 percent or less of the federal poverty level, based on ACS data. Minority Communities: Census Block Groups where 70 percent or more of the population is Asian Pacific Islander, African American, Hispanic, Native American or other Non-White ethnic group, using the newer ACS data rather than the previous 2010 Census. Vulnerable Communities: Same definition as in 2012 described above, but using ACS Census Block Groups Consideration of Low-Income Populations to Define LIHM Areas The poverty line threshold and percentage were kept the same as in Because the federal poverty level is a nation-wide number that does not account for differences in the cost of living, many federal and state programs around the country use 150 percent or 200 percent of the federal poverty level to determine eligibility in areas of the country with higher costs of living. SACOG selected 200 percent of the poverty level as the low-income threshold, consistent with the threshold used by the Sacramento County Department of Health Care Services, Sacramento Metropolitan Utility District and other agencies for determining low-income eligibility for their programs. 3
4 Federal poverty levels are determined by household size. The poverty thresholds for 2009 and 2013 (comparable to the 2009 to 2013 ACS data) are shown in Table C-5.1. Table C-5.1 Comparison of Federal Poverty Guidelines Federal Poverty Level 100 percent of Poverty 200 percent of Poverty Family Size 2009 Poverty Guidelines 2013 Poverty Guidelines 2009 Poverty Guidelines 2013 Poverty Guidelines 1 $10,830 $11,490 $21,660 $22,980 2 $14,570 $15,510 $29,140 $31,020 3 $18,310 $19,530 $36,620 $39,060 4 $22,050 $23,550 $44,100 $47,100 5 $25,790 $27,570 $51,580 $55,140 6 $29,530 $31,590 $59,060 $63,180 7 $33,270 $35,610 $66,540 $71,220 8 $37,010 $39,630 $74,020 $79,260 For each additional person $3,740 $4,020 $7,480 $8,040 Consideration of Minority Populations to Define LIHM Areas The final requirement for defining LIHM Areas is to identify communities with a concentration of minority populations, identified through Census data on race. Minority populations include people who identify themselves as Hispanic, African American/Black, Native Hawaiian/Pacific Islander, Asian, American Indian/Alaskan Native, or of more than one race. Using 2010 Census data, staff in 2012 looked at block groups with 60 percent or more minority populations, the threshold used in the 2008 MTP, but found that due to our region s increasing diversity, many areas were added that did not appear to overlap areas exhibiting significant vulnerabilities. The 2012 MTP/SCS raised the proportion of minority population at the Census block group level to 70 percent, which aligned somewhat better with other vulnerability measures, and consistent with Caltrans guidance for identifying more concentrated minority areas when much of our region is becoming majority minority. Given the similarity between county-level 2010 Census and ACS minority population figures, this threshold was kept for
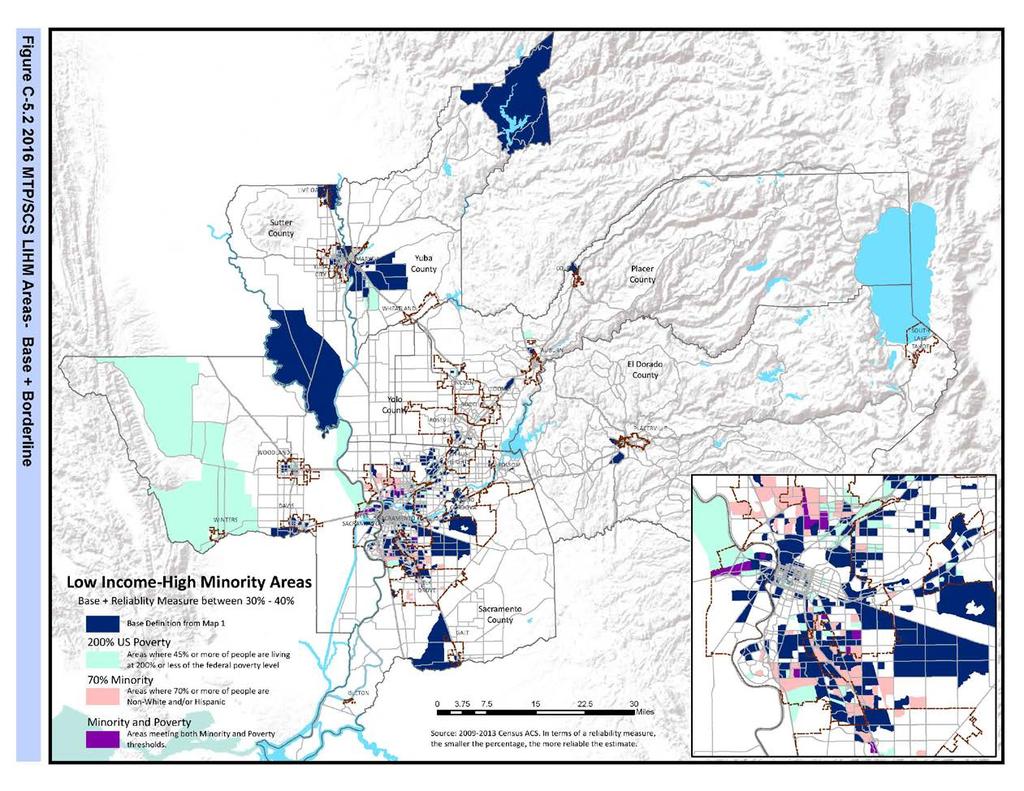
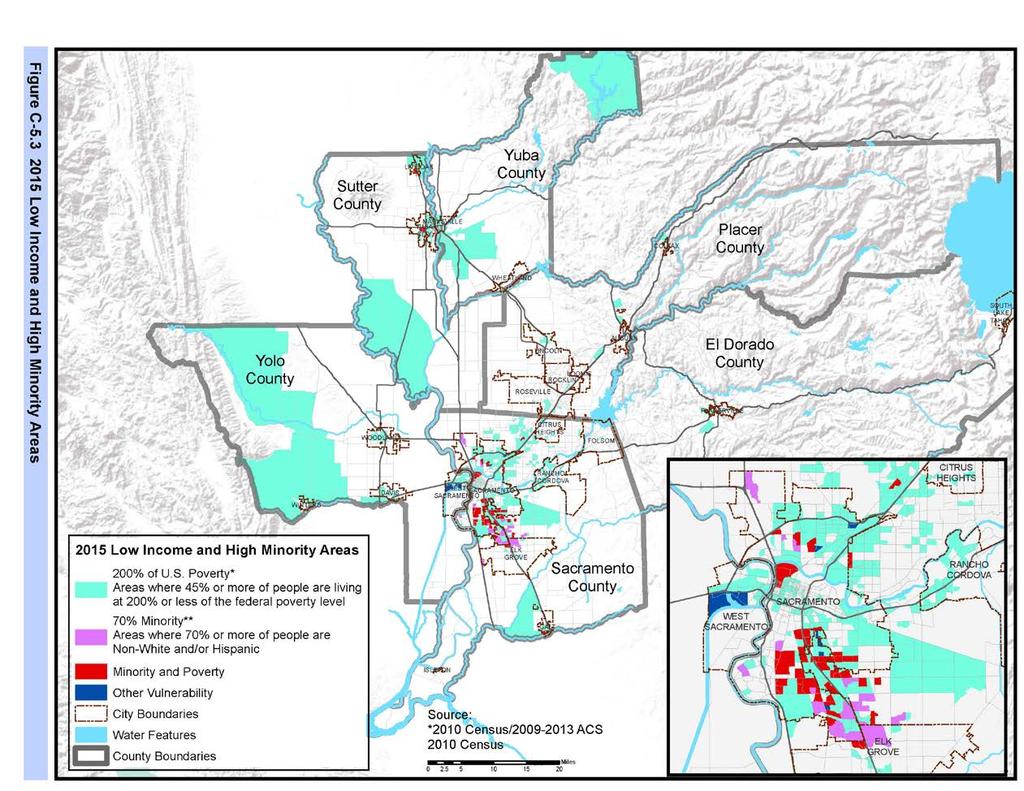
5 Base vs. Borderline Areas Figure C-5.1, 2016 MTP/SCS LIHM Areas - Base shows the low-income and minority communities meeting the statistical 30% confidence interval that was used for the 2012 MTP/SCS. Using just these block groups would have resulted in about 23.8% of the population being included in the defined LIHM Areas for the 2016 MTP/SCS. Figure C-5.2, 2016 MTP/SCS LIHM Areas Base + Borderline shows in blue the Base LIHM Areas, and adds borderline areas. These borderline areas, shown in the lighter colors, are where the data confidence intervals are between 30% and 40%, meaning the measurements for low-income or non-white populations are somewhat less likely to be accurate. As can be seen, the borderline areas include a number of urbanized block groups as well as some that are quite rural, with limited population and densities. Standard statistical procedure is to use a cut-off of 30% reliability. Expanding the reliability to 40% makes the data a bit less reliable but offsets the shift from larger Census Tracts down to Block Group level for the income analysis. For this reason, SACOG staff and the Sounding Board reviewed the differences, and agreed that SACOG should include the borderline areas in the LIHM Area definition for Including all borderline areas increased to 32 percent the proportion of the regional population located in LIHM Areas. Figure C-5.3 shows the final LIHM Areas used for the analysis in Chapter 8 of the plan. 5
6 6
7 7
8 8
9 Title VI Analysis As discussed in Chapter 8 Equity and Choice, the Federal Transit Administration (FTA) issued Circular B in October 2012, providing guidance for metropolitan planning organizations (MPOs) such as SACOG and other recipients of federal Department of Transportation (DOT) funding to ensure that their programs, policies, and activities comply with DOT s Title VI regulations. This includes demographic maps showing minority/non-minority populations, charts that analyze the impacts of the distribution of State and Federal funds in the aggregate for public transportation purposes and identification and analysis of any disparate impacts on the basis of race, color, or national origin. The FTA guidance did not provide specific direction for how to conduct such analyses. SACOG has thus developed a methodology based on available data and work by other California MPOs. SACOG s methodology relies on the regional forecast of changes in minority and non-minority populations that was prepared by the Center for the Continuing Study of the California Economy (CCSCE) in These projections showed higher growth in minority populations and, by 2035, a shift to 51 percent minority population regionwide up from 44 percent in the 2010 Census. This is likely a conservative estimate; California Department of Finance projections are for minority population proportions of up to 52.7 percent by 2030 and up to 57.5 percent by 2040 in the six counties (including the Lake Tahoe area which is outside the SACOG region). SACOG has no forecasting tools that allow for predicting the future location of minority populations, so for purposes of this analysis, the minority/non-minority households in SACOG s regional travel demand model were simply scaled up in their 2012 base year locations to the 2036 horizon year. This scaling up went from the 44 percent proportion observed in the 2010 Census to the 51 percent proportion projected by CCSCE for SACOG then compared for the future minority and non-minority populations in the travel model the plan investments by modal category, based on the shares of the population defined as minority and non-minority, and on minority and non-minority utilization of the three modes. The modal funding categories are: Roadway combines funding for: maintenance and rehabilitation of state highways/freeways, local streets and roads, and rehabilitation project safety investments; new road and highway capacity, interchange, and river crossing/bridge projects; and system management/operations and Intelligent Transportation Systems (ITS) improvements. Transit combines funding for transit system operations and maintenance and transit capital projects. 2 Levy, Stephen and Doche-Boulos, Viviane, Regional Employment Population, and Households Projections in the SACOG Region, , Center for Continuing Study of the California Economy, October
10 Non-Motorized based on expected funding for pedestrian and bicycle projects and investments. Table C-5.4 provides a tabulation of the MTP/SCS funding for each of these modal categories. Table C-5.4 MTP/SCS Funding by Mode MTP/SCS Funding Modal Funding Category Amount Roadway: Maintenance & Rehabilitation System Management, Operations, and ITS Road & Highway Capacity Roadway Subtotal Transit: Transit Capital Transit Operations & Maintenance Transit Subtotal Non-Motorized: Bicycle and Pedestrian Subtotal Modal Funding Category Subtotal $12.56 billion $1.5 billion $5.8 billion $19.86 billion $3.5 billion $7.1 billion $10.6 billion $2.8 billion $33.26 billion Programs/Planning MTP/SCS Funding Total $1.7 billion $34.96 billion Source: SACOG, July 2015 Utilization rates for minority and non-minority populations were then computed using the travel demand model. Modal utilization by minority and non-minority populations were based on the following travel metrics: Roadway Utilization household-generated vehicle miles traveled (VMT), which includes the VMT generated by residents of the region for their travel within the region. Householdgenerated VMT includes vehicle travel for normal commuting, going to school, shopping, and personal business. Transit Utilization person trips made by residents of the SACOG region using transit modes. Non-Motorized Mode Utilization person trips made by residents of the SACOG region by biking or walking modes. 10
11 These VMT and person trip utilization metrics were tallied to place of residence for all householdgenerated travel. The utilization metrics were then split between minority and non-minority populations based on the block-level proportions of those populations, which were scaled up to reflect the projected growth for minority populations to 51 percent of the regional total, as described above. To provide an example of this methodology, say the 2010 Census reported that 45 percent of the residents of a given Census block were part of a minority group, and 1,000 weekday VMT were forecasted for that Census block. First, the minority share of the Census block was increased to 51 percent; second, 51 percent of the 1,000 projected VMT for the Census Block or 510 were attributed to the minority population and 49 percent or 490 to the non-minority population within that block. By applying this approach to all blocks within the region, and adding up all of the blocks, a reasonable utilization share can be calculated for each mode. Table C-5.5 shows the resulting roadway, transit, and non-motorized utilization shares of minority and non-minority populations. Table C-5.5 Minority/Non-Minority Utilization Shares by Mode Roadway Utilization (Weekday Household-Generated VMT, in thousands) 2036 Share Minority 21, % Non-Minority 31, % Total 52, % Transit Utilization (Weekday Transit Person Trips) 2036 Share Minority 171, % Non-Minority 167, % Total 338, % Non-Motorized Utilization (Weekday Bike + Walk Person Trips) Minority 2036 Share Minority 580, % Non-Minority 644, % Total 1,224, % Based on the forecasted utilization of the three modes by minority and non-minority populations in the region, SACOG then applied a weighted-share calculation to the different funding categories. That is, the modal utilization shares shown in Table C-5.5 were applied to the total modal funding 11
12 category amounts in Table C-5.4, to assign funding for each mode to minority and non-minority populations. Results are shown in Table C-5.6 Finally, based on the assumed 51 percent minority/49 percent non-minority split shown in Table C-5.7, per capita investments by mode were calculated for the 2036 minority and nonminority population that will benefit from these investments, shown in Table C-5.8. The percentage difference between per capita investments were calculated for each mode, using the formula ((V 1 - V 2)/((V 1 + V 2)/2) where Value 1 is the per capita minority investment and Value 2 is the per capita non-minority investment. Proportionality In total, minority populations are forecasted to utilize the highway system at a lower rate than their population share (47 percent compared to 51 percent of population), and use at higher rates public transit (60 percent) and non-motorized modes (56 percent). For the modal funding categories, per capita spending differences between minority and non-minority populations reflect differences in forecasted utilization rates for each mode less for roadways and more for transit and nonmotorized shares. In the aggregate, minority populations are expected to receive a slightly greater benefit (52 percent) from total investments relative to their overall share of the region s population (51 percent), and a slightly greater benefit (4 percent) per capita. This regional analysis has a number of limitations. These include the following: The analysis is conservative on the likely increase in minority population; changes in minority population would likely affect utilization rates and therefore the analysis. The analysis assumes that the shares of minority and non-minority population in blocks will scale up proportionally over the years of the plan. However, residents will more likely locate in blocks or move within the region unevenly over time, which may also affect modal utilization rates. As a result, the analysis may over- or under-state the share of benefit for minority or non-minority populations. The analysis provides a regional level analysis in terms of investments per capita for minority and non-minority populations, but cannot measure the benefits of individual projects or programs for population sub-groups. Many roadway projects include transit, bicycle/pedestrian facilities as part of road rehabilitation or expansion projects. The proportion of roadway funds for transit, bike and pedestrian elements cannot be determined or included in the analysis. Roadway utilization shares do not include use of the roadways by passengers who travel in transit vehicles, so roadway investment benefits to transit riders are not captured. Transit investments include federal, state and local funds, and SACOG is not able to separate out only federal and state public transportation funds for investment analysis or project mapping purposes. 12
13 Table C-5.6 MTP/SCS Modal Investment Based on Minority/Non-Minority Utilization Share of Each Mode Roadway Utilization Share Roadway Investment Total Transit Utilization Share Transit Investment Total Non- Motorized Utilization Share Non-Motorized Investment Total Total Investment Total 100% $19,860,000, % $10,600,000, % $2,800,000,000 $33,260,000, % Minority 47.4% $9,422,905, % $6,328,030, % $1,565,896,284 $17,316,832, % Non-Minority 52.6% $10,437,094, % $4,271,969, % $1,234,103,716 $15,943,167, % Percent Table C-5.7 Projected 2036 Minority/Non-Minority Population Total Population Minority (51%) Non-Minority (49%) 3,078,772 1,570,174 1,508,598 Table C-5.8 Per Capita Investment/Benefit by Mode Non- Roadway Transit Motorized Total Investment Investment Investment Investment Minority $9,422,905,687 $6,328,030,751 $1,565,896,284 $17,316,832,722 Non-Minority $10,437,094,313 $4,271,969,249 $1,234,103,716 $15,943,167,278 Per Capita Per Capita Per Capita Per Capita Minority $6,001 $4,030 $997 $11,029 Non-Minority $6,918 $2,832 $818 $10,568 % difference between minority & non-minority per capita benefit -14% +35% +20% +4% 13
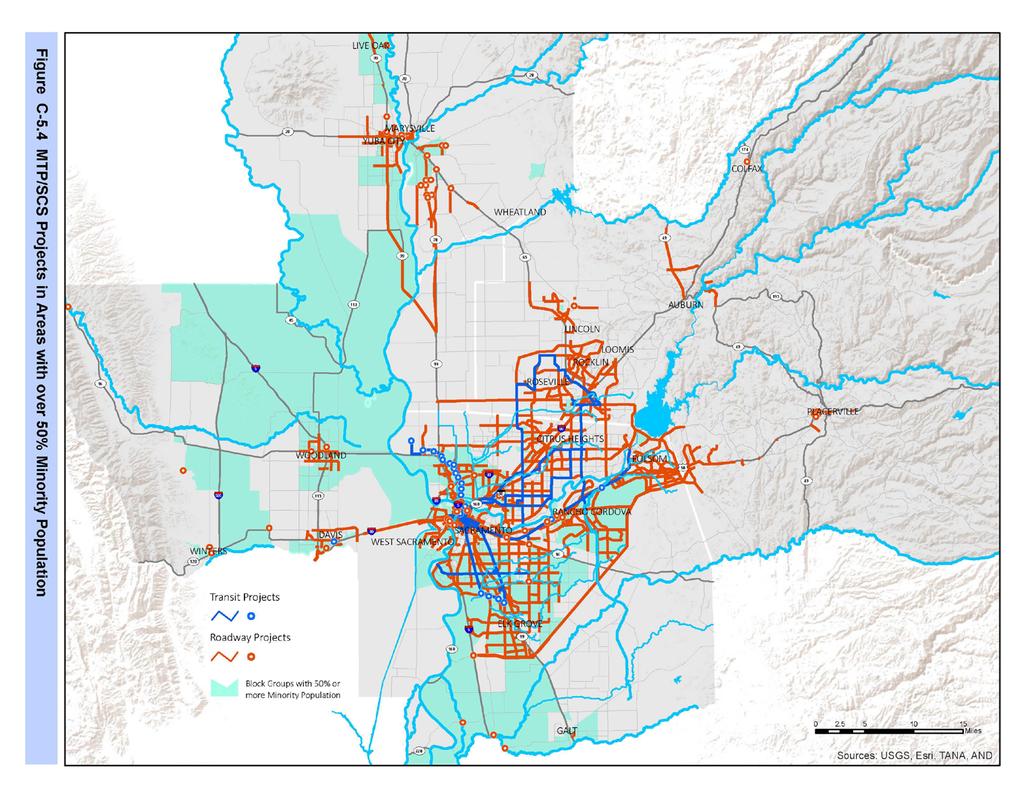
14 SACOG also mapped MTP/SCS projects and overlaid them on block groups in the region with a 50 percent minority population or greater, shown in Figure C-5.4. This mapping analysis can generally only be qualitative, given its limitations. Some MTP/SCS funding is categorical, such as funding for bicycle/pedestrian projects and transit operations and maintenance, so specific projects cannot be mapped. As a result, the maps understate significantly eventual investments in these types of transportation facilities and services. Additionally, SACOG has not identified a solid methodology for how to assign project benefits, even of mappable projects, to geographies at the block group, census tract, or other geographic level. Qualitatively, the distribution of mappable projects is broad across the region, as shown in Figure C-5.4. There are outlying areas that show on the map as areas with a 50 percent or greater minority population but are very low density or agricultural lands where little growth is forecast and thus few transportation projects are planned. Setting aside those very rural areas of the region, the MTP/SCS does not appear to systematically exclude or provide an imbalance of projects benefiting communities with higher or lower proportions of minority residents. Additionally, as noted, there are limitations to this analysis, given SACOG s inability to predict future locations of minority populations, which could change the map significantly. 14
15 15
Chapter 10 Equity and Environmental Justice
 Chapter 10 Equity and Environmental Justice Introduction An important consideration for the 2040 Transportation Policy Plan is its impact on all populations in the Minneapolis-Saint Paul region, particularly
Service and Fare Change Policies. Revised Draft
 Revised Draft June 19, 2013 1. INTRODUCTION It is the policy of the Sacramento Regional Transit District (RT) to provide quality service to all customers regardless of race, color, national origin, or
Commission District 4 Census Data Aggregation
 Commission District 4 Census Data Aggregation 2011-2015 American Community Survey Data, U.S. Census Bureau Table 1 (page 2) Table 2 (page 2) Table 3 (page 3) Table 4 (page 4) Table 5 (page 4) Table 6 (page
Northwest Census Data Aggregation
 Northwest Census Data Aggregation 2011-2015 American Community Survey Data, U.S. Census Bureau Table 1 (page 2) Table 2 (page 2) Table 3 (page 3) Table 4 (page 4) Table 5 (page 4) Table 6 (page 5) Table
Riverview Census Data Aggregation
 Riverview Census Data Aggregation 2011-2015 American Community Survey Data, U.S. Census Bureau Table 1 (page 2) Table 2 (page 2) Table 3 (page 3) Table 4 (page 4) Table 5 (page 4) Table 6 (page 5) Table
Poverty in the United Way Service Area
 Poverty in the United Way Service Area Year 4 Update - 2014 The Institute for Urban Policy Research At The University of Texas at Dallas Poverty in the United Way Service Area Year 4 Update - 2014 Introduction
Zipe Code Census Data Aggregation
 Zipe Code 66101 Census Data Aggregation 2011-2015 American Community Survey Data, U.S. Census Bureau Table 1 (page 2) Table 2 (page 2) Table 3 (page 3) Table 4 (page 4) Table 5 (page 4) Table 6 (page 5)
Zipe Code Census Data Aggregation
 Zipe Code 66103 Census Data Aggregation 2011-2015 American Community Survey Data, U.S. Census Bureau Table 1 (page 2) Table 2 (page 2) Table 3 (page 3) Table 4 (page 4) Table 5 (page 4) Table 6 (page 5)
Lake County. Government Finance Study. Supplemental Material by Geography. Prepared by the Indiana Business Research Center
 County Government Finance Study Supplemental Material by Geography Prepared by the Indiana Business Research www.ibrc.indiana.edu for Sustainable Regional Vitality www.iun.edu/~csrv/index.shtml west Indiana
Environmental Justice Analysis. Appendix 3 to SFY MORPC TIP
 Environmental Justice Analysis Appendix 3 to SFY 2018-2021 MORPC TIP April 28, 2017 Table of Contents I. INTRODUCTION TO ENVIRONMENTAL JUSTICE... 2 A. Definition of Environmental Justice... 2 B. Regulatory
Chapter 2: Existing Transportation System. Chapter 3. Socio Economic Profile. Old Town Fort Collins. Image 75 Credit: City of Fort Collins
 Chapter 2: Existing Transportation System Chapter 3 Socio Economic Profile Old Town Fort Collins. Image 75 Credit: City of Fort Collins Chapter 3: Socio-Economic Profile I. Socio-Economic Data In 2013,
Rifle city Demographic and Economic Profile
 Rifle city Demographic and Economic Profile Community Quick Facts Population (2014) 9,289 Population Change 2010 to 2014 156 Place Median HH Income (ACS 10-14) $52,539 State Median HH Income (ACS 10-14)
Proposed Service Change Title VI Compliance Review
 Proposed Service Change Title VI Compliance Review May 2014 Submitted by: Table of Contents 1. Purpose... 3 2. Background... 3 3. Definition of Title VI and Environmental Justice Impact Policies... 3 3.1
Lapkoff & Gobalet Demographic Research, Inc.
 Lapkoff & Gobalet Demographic Research, Inc. 22361 Rolling Hills Road, Saratoga, CA 95070-6560 (408) 725-8164 Fax (408) 725-1479 2120 6 th Street #9, Berkeley, CA 94710-2204 (510) 540-6424 Fax (510) 540-6425
University of Minnesota
 neighborhood profile October 2011 About this area The University neighborhood is bordered by 11th Avenue Southeast, University Avenue, 15th Avenue Southeast, the railroad tracks, Oak Street, and the Mississippi
Mid - City Industrial
 Minneapolis neighborhood profile October 2011 Mid - City Industrial About this area The Mid-City Industrial neighborhood is bordered by I- 35W, Highway 280, East Hennepin Avenue, and Winter Street Northeast.
CHERRIOTS 2018 SERVICE PLAN APPENDIX A EQUITY ANALYSIS
 CHERRIOTS 2018 SERVICE PLAN APPENDIX A EQUITY ANALYSIS 1. Background... 1 2. Title VI requirements... 1 3. SAMTD Title VI compliance... 2 3.1 Major service changes policy... 2 3.2 Definition of adverse
Camden Industrial. Minneapolis neighborhood profile. About this area. Trends in the area. Neighborhood in Minneapolis.
 Minneapolis neighborhood profile October 2011 Camden Industrial About this area The Camden Industrial neighborhood is bordered by 48th Avenue North, the Mississippi River, Dowling Avenue North, Washington
Population, Housing, and Employment Methodology
 Appendix O Population, Housing, and Employment Methodology Final EIR APPENDIX O Methodology Population, Housing, and Employment Methodology This appendix describes the data sources and methodologies employed
MEMORANDUM. Gloria Macdonald, Jennifer Benedict Nevada Division of Health Care Financing and Policy (DHCFP)
") MEMORANDUM To: From: Re: Gloria Macdonald, Jennifer Benedict Nevada Division of Health Care Financing and Policy (DHCFP) Bob Carey, Public Consulting Group (PCG) An Overview of the in the State of Nevada
MEMORANDUM To: From: Re: Gloria Macdonald, Jennifer Benedict Nevada Division of Health Care Financing and Policy (DHCFP) Bob Carey, Public Consulting Group (PCG) An Overview of the in the State of Nevada
TECHNICAL REPORT NO. 11 (5 TH EDITION) THE POPULATION OF SOUTHEASTERN WISCONSIN PRELIMINARY DRAFT SOUTHEASTERN WISCONSIN REGIONAL PLANNING COMMISSION
 THE POPULATION OF SOUTHEASTERN WISCONSIN PRELIMINARY DRAFT SOUTHEASTERN WISCONSIN REGIONAL PLANNING COMMISSION") TECHNICAL REPORT NO. 11 (5 TH EDITION) THE POPULATION OF SOUTHEASTERN WISCONSIN PRELIMINARY DRAFT 208903 SOUTHEASTERN WISCONSIN REGIONAL PLANNING COMMISSION KRY/WJS/lgh 12/17/12 203905 SEWRPC Technical
TECHNICAL REPORT NO. 11 (5 TH EDITION) THE POPULATION OF SOUTHEASTERN WISCONSIN PRELIMINARY DRAFT 208903 SOUTHEASTERN WISCONSIN REGIONAL PLANNING COMMISSION KRY/WJS/lgh 12/17/12 203905 SEWRPC Technical
Risk and Technology Review - Analysis of Socio-Economic Factors for Populations Living Near Hard Chromium Electroplating Facilities
 Risk and Technology Review - Analysis of Socio-Economic Factors for Populations Living Near Hard Chromium Electroplating Facilities Prepared by: EC/R Incorporated 501 Eastowne Drive, Suite 250 Chapel Hill,
Shingle Creek. Minneapolis neighborhood profile. About this area. Trends in the area. Neighborhood in Minneapolis. October 2011
 neighborhood profile October 2011 About this area The neighborhood is bordered by 53rd Avenue North, Humboldt Avenue North, 49th Avenue North, and Xerxes Avenue North. It is home to Olson Middle School.
Independence, MO Data Profile 2015
 , MO Data Profile 2015 5 year American Community Survey (ACS) Jackson County, Missouri Data sources: U.S. Census Bureau, American Community Survey (ACS), 2011 2015 (released December 8, 2016), compared
Draper: Fair Housing Equity Assessment
 Draper: Fair Housing Equity Assessment Prepared by Bureau of Economic and Business Research David Eccles School of Business University of Utah James Wood John Downen DJ Benway Darius Li April 2013 [DRAFT]
Local Business Profile All Sectors - Fairfield city, Ohio. Contents. What will I find in this report? My Customers
 Local Business Profile All Sectors -, Contents What will I find in this report? My Customers The My Customers section provides summarized demographic information for,. This information provides a snapshot
Equity Analysis: Honored Citizen Fare Increase DRAFT. Department of Diversity & Transit Equity
 Equity Analysis: Honored Citizen Increase DRAFT Department of Diversity & Transit Equity March 23, 2015 Executive Summary: Honored Citizen Increase Equity Analysis In accordance with Title VI of the Civil
PUBLIC DISCLOSURE COMMUNITY REINVESTMENT ACT PERFORMANCE EVALUATION
 PUBLIC DISCLOSURE October 31, 2005 COMMUNITY REINVESTMENT ACT PERFORMANCE EVALUATION RSSD No. 236706 158 U.S. Highway 206 North Gladstone, New Jersey 07934 Federal Reserve of New York 33 Liberty Street
CHAPTER 16 POPULATION AND HOUSING, SOCIOECONOMICS, AND ENVIRONMENTAL JUSTICE 16.1 AFFECTED ENVIRONMENT/ENVIRONMENTAL SETTING
 CHAPTER 16 POPULATION AND HOUSING, SOCIOECONOMICS, AND ENVIRONMENTAL JUSTICE This chapter provides an overview of the existing social and economic conditions, demographics, and the characteristics of minority
Regional Equity Analysis Of Current Funding (Highway STIP and CIP) Project Selection Advisory (PSA) Council
 Project Selection Advisory (PSA) Council") Regional Equity Analysis Of Current Funding (Highway STIP and CIP) Project Selection Advisory (PSA) Council TABLE OF CONTENTS 1 Introduction and Analysis Framework... 1-1 1.1 The Project Selection Advisory
Regional Equity Analysis Of Current Funding (Highway STIP and CIP) Project Selection Advisory (PSA) Council TABLE OF CONTENTS 1 Introduction and Analysis Framework... 1-1 1.1 The Project Selection Advisory
Small Area Health Insurance Estimates from the Census Bureau: 2008 and 2009
 October 2011 Small Area Health Insurance Estimates from the Census Bureau: 2008 and 2009 Introduction The U.S. Census Bureau s Small Area Health Insurance Estimates (SAHIE) program produces model based
Economic Profile. Capital Crossroads. a vision forward
 Economic Profile Capital a vision forward This profile was prepared by: Liesl Eathington Department of Economics State University phone: (515) 294 2954 email: leathing@iastate.edu 5/23/2012 Distribution
West Valley City: Fair Housing Equity Assessment
 West Valley City: Fair Housing Equity Assessment Prepared by Bureau of Economic and Business Research David Eccles School of Business University of Utah James Wood John Downen DJ Benway Darius Li April
National Equity Atlas Data & Methods: Technical Documentation
 National Equity Atlas Data & Methods: Technical Documentation Prepared by PolicyLink and the USC Program for Environmental and Regional Equity March 5, 2015 This document provides more detailed information
2013 STA Passenger Survey Results. Attachment E Title VI Attachment E
 2013 STA Passenger Survey Results Attachment E 1 2014 Title VI Attachment E 2013 STA Passenger Survey Results Overview Spokane Transit Authority (STA) conducted its most recent passenger survey in December
Urban Action Agenda Community Profiles COVER TO GO HERE. City of Beacon
 Urban Action Agenda Community Profiles COVER TO GO HERE City of Beacon COMMUNITY OVERVIEW MAP POPULATION & DEMOGRAPHICS Population Basics 2,212 Population (2015) Population Change 2. since 2000 0.5 Square
NORTH MINNEAPOLIS: INTRODUCTION
 NORTH MINNEAPOLIS: INTRODUCTION This report is part of a larger collaborative between the Local Initiatives Support Corporation (LISC) and the Center for Urban and al Affairs (CURA) that addresses regional
Equity Dimensions of Transportation Funding in the Central Puget Sound Region May 2015
 Equity Dimensions of Transportation Funding in the Central Puget Sound Region May 2015 White Paper for the Transportation Futures Task Force Prepared by Chris Mefford, CAI Table of Contents Page Executive
Urban Action Agenda Community Profiles COVER TO GO HERE. City of Beacon
 Urban Action Agenda Community Profiles COVER TO GO HERE City of Beacon COMMUNITY OVERVIEW MAP POPULATION & DEMOGRAPHICS Population Basics 27,828 Population (2015) Population Change 9.6% since 2000 5.1
PROPOSED SHOPPING CENTER
 PROPOSED SHOPPING CENTER Southeast Corner I-95 & Highway 192 Melbourne, Florida In a 5 Mile Radius 80,862 Population 32,408 Households $61K Avg HH Income SOONER INVESTMENT Commercial & Investment Real
Clay County Comprehensive Plan
 2011-2021 Clay County Comprehensive Plan Chapter 1: Demographic Overview Clay County Comprehensive Plan Demographic Overview Population Trends This section examines historic and current population trends
CHAPTER 3 POPULATION AND ECONOMIC CHARACTERISTICS
 CHAPTER 3 POPULATION AND ECONOMIC CHARACTERISTICS INTRODUCTION Population trends in La Vista and its respective planning jurisdiction serve as valuable indicators of future development needs and patterns
REGIONAL TRANSIT ISSUE PAPER Page 1 of 3 Agenda Item No.
 REGIONAL TRANSIT ISSUE PAPER Page 1 of 3 Agenda Item No. Board Meeting Date Open/Closed Session Information/Action Item Issue Date 13 07/27/15 Open Action 07/08/15 Subject: Setting a Public Hearing on
INVESTMENT STRATEGIES
 3 INVESTMENT STRATEGIES 70 INVESTMENT STRATEGIES 71 A key role of Mobilizing Tomorrow is to outline a strategy for how the region will invest in transportation infrastructure over the next 35 years. This
COMMUNITY REINVESTMENT ACT PERFORMANCE EVALUATION
 PUBLIC DISCLOSURE December 6, 2010 COMMUNITY REINVESTMENT ACT PERFORMANCE EVALUATION Alden State Bank RSSD No. 414102 13216 Broadway Alden, New York 14004 FEDERAL RESERVE BANK OF NEW YORK 33 LIBERTY STREET
Congressional District Report For the 115th Congress
 Congressional District Report For the 115th Congress Arizona District 6 Honorable David Schweikert (R) May 2017 Report National Association of REALTORS Congressional District Report For the 115th Congress
PUBLIC DISCLOSURE. June 4, 2012 COMMUNITY REINVESTMENT ACT PERFORMANCE EVALUATION. Utah Independent Bank RSSD #
 PUBLIC DISCLOSURE June 4, 2012 COMMUNITY REINVESTMENT ACT PERFORMANCE EVALUATION Utah Independent RSSD # 256179 55 South State Street Salina, Utah 84654 Federal Reserve of San Francisco 101 Market Street
Regional Travel Study
 PSRC S Regional Travel Study 1999 KEY COMPARISONS OF 1999,, AND TRAVEL SURVEY FINDINGS Puget Sound Regional Council JUNE 2015 PSRC S Regional Travel Study / JUNE 2015 Funding for this document provided
Congressional District Report For the 115th Congress
 Congressional District Report For the 115th Congress Washington District 5 Honorable Cathy McMorris Rodgers (R) February 2017 Report National Association of REALTORS Congressional District Report For the
BOARD OF SUPERVISORS BUSINESS MEETING ACTION ITEM
 Date of Meeting: June 7, 2016 # 7 BOARD OF SUPERVISORS BUSINESS MEETING ACTION ITEM SUBJECT: ELECTION DISTRICT: Title VI Policies for Transit Service Countywide CRITICAL ACTION DATE: June 7, 2016 STAFF
Utah. Demographic and Economic Profile. Metro and Nonmetro Counties in Utah
 Demographic and Economic Profile Utah Updated July 2006 Metro and Nonmetro Counties in Utah Based on the most recent listing of core based statistical areas by the Office of Management and Budget (December
Measuring the Cost of Employment: Work-Related Expenses in the Supplemental Poverty Measure. No. 279 SEHSD No
 THE SURVEY OF INCOME AND PROGRAM PARTICIPATION Measuring the Cost of Employment: Work-Related in the Supplemental Poverty Measure Revised November 13, 2017 No. 279 SEHSD No. 2017-43 Abinash Mohanty Ashley
2018:IIIQ Nevada Unemployment Rate Demographics Report*
 2018:IIIQ Nevada Unemployment Rate Demographics Report* Department of Employment, Training & Rehabilitation Research and Analysis Bureau Dr. Tiffany Tyler-Garner, Director Dennis Perea, Deputy Director
COMMUNITY REINVESTMENT ACT PERFORMANCE EVALUATION
 PUBLIC DISCLOSURE July 25, 2011 COMMUNITY REINVESTMENT ACT PERFORMANCE EVALUATION Bank of Millbrook RSSD No. 175609 3263 Franklin Avenue Millbrook, New York 12545 FEDERAL RESERVE BANK OF NEW YORK 33 LIBERTY
Title VI Service Equity Analysis: FY2019 Annual Service Plan. Department of Diversity & Transit Equity
 Title VI Service Equity Analysis: FY2019 Annual Service Plan Department of Diversity & Transit Equity April 26, 2018 Executive Summary TriMet is proposing to implement several service improvements in fall
Toronto s City #3: A Profile of Four Groups of Neighbourhoods
 Toronto s City #3: A Profile of Four Groups of Neighbourhoods A supplement to the Three Cities in Toronto analysis of trends, focused on City #3, the 40% of the City s neighbourhoods with the lowest incomes
COMMUNITY REINVESTMENT ACT PERFORMANCE EVALUATION
 PUBLIC DISCLOSURE June 2, 2008 COMMUNITY REINVESTMENT ACT PERFORMANCE EVALUATION Legacy Bank & Trust Company RSSD # 397755 10603 Highway 32 P.O. Box D Plato, Missouri 65552 Federal Reserve Bank of St.
STAFF REPORT Regional Transportation Plan/Sustainable Communities Strategy (RTP/SCS) Scenario Performance Update for Board Direction
 Scenario Performance Update for Board Direction") November 2017 Board of Directors STAFF REPORT SUBJECT: RECOMMENDED ACTION: 2018 Regional Transportation Plan/Sustainable Communities Strategy (RTP/SCS) Scenario Performance Update for Board Direction Support
November 2017 Board of Directors STAFF REPORT SUBJECT: RECOMMENDED ACTION: 2018 Regional Transportation Plan/Sustainable Communities Strategy (RTP/SCS) Scenario Performance Update for Board Direction Support
White Pine County. Economic and Demographic Profile, 1999
 TECHNICAL REPORT UCED 99/2000-18 White Pine County Economic and Demographic Profile, 1999 UNIVERSITY OF NEVADA, RENO White Pine County Economic and Demographic Profile, 1999 Study Conducted by: Shawn W.
PUBLIC DISCLOSURE COMMUNITY REINVESTMENT ACT PERFORMANCE EVALUATION
 PUBLIC DISCLOSURE March 10, 2008 COMMUNITY REINVESTMENT ACT PERFORMANCE EVALUATION Tioga State Bank RSSD No. 910118 1 Main Street P.O. Box 386 Spencer, NY 14883 FEDERAL RESERVE BANK OF NEW YORK 33 LIBERTY
~ NOTICE OF MEETING ~ CAPITAL METROPOLITAN TRANSPORTATION AUTHORITY BOARD OF DIRECTORS MEETING
 ~ NOTICE OF MEETING ~ CAPITAL METROPOLITAN TRANSPORTATION AUTHORITY BOARD OF DIRECTORS MEETING 2910 East Fifth Street Austin, TX 78702 ~ AGENDA ~ Executive Assistant/Board Liaison Gina Estrada 512-389-7458
APPENDICES Fair Housing and Equity Assessment
 APPENDICES 77 APPENDIX A: DATA TABLES Data is provided for Racially Concentrated Areas of Poverty (RCAPs) and Opportunity Areas (OAs). The RCAPs, as defined in Chapter 3, include: RCAP 1: West Kansas City,
Older Households : Projections and Implications for Housing A Growing Population
 Older Households 215-235: Projections and Implications for Housing A Growing Population Jennifer Molinsky February 15, 217 Setting the Stage: HOUSEHOLD GROWTH AMONG OLDER ADULTS 2 The Older Adult Population
Understanding the Margin of Errors and the Coefficient of Variance in the American Community Survey U.S. Census Bureau Workshop at SACOG
 Understanding the Margin of Errors and the Coefficient of Variance in the American Community Survey U.S. Census Bureau Workshop at SACOG Michael Burns Deputy Regional Director American Community Survey
House Bill 20 Implementation. House Select Committee on Transportation Planning Tuesday, August 30, 2016, 1:00 P.M. Capitol Extension E2.
 House Bill 20 Implementation Tuesday,, 1:00 P.M. Capitol Extension E2.020 INTRODUCTION In response to House Bill 20 (HB 20), 84 th Legislature, Regular Session, 2015, and as part of the implementation
COMMUNITY REINVESTMENT ACT PERFORMANCE EVALUATION
 PUBLIC DISCLOSURE August 24, 2009 COMMUNITY REINVESTMENT ACT PERFORMANCE EVALUATION First State Bank of Red Bud RSSD # 356949 115 West Market Street Red Bud, Illinois 62278 Federal Reserve Bank of St.
California MAP-21 Transit Working Group: MAP-21 Questions for FTA
 California MAP-21 Transit Working Group: MAP-21 Questions for FTA General Has FTA started developing rules for transit programs as identified in MAP 21? When will FTA offer stakeholders an opportunity
Transportation Advisory Board of the Metropolitan Council of the Twin Cities INFORMATION ITEM. DATE: July 12, 2018
 Transportation Advisory Board of the Metropolitan Council of the Twin Cities DATE: July 12, 2018 TO: PREPARED BY: SUBJECT: BACKGROUND: INFORMATION ITEM TAC Planning Committee Steve Peterson, Highway Planning
Appendix G Defining Low-Income Populations
 Appendix G Defining Low-Income Populations 1.0 Introduction Executive Order 12898, Federal Actions to Address Environmental Justice in Minority Populations and Low-Income Populations, requires federal
Automobile Ownership Model
 Automobile Ownership Model Prepared by: The National Center for Smart Growth Research and Education at the University of Maryland* Cinzia Cirillo, PhD, March 2010 *The views expressed do not necessarily
PUBLIC DISCLOSURE COMMUNITY REINVESTMENT ACT PERFORMANCE EVALUATION
 PUBLIC DISCLOSURE August 25, 2003 COMMUNITY REINVESTMENT ACT PERFORMANCE EVALUATION ORANGE COUNTY TRUST COMPANY RSSD 176101 212 Dolson Avenue Middletown, New York 10940 FEDERAL RESERVE BANK OF NEW YORK
Monte Vista Population, ,744 4,651 4,564 4,467 4,458 4,432 4,451
 1 Monte Vista 4,8 4,7 4,6 4,5 4,4 4,3 4,2 4,1 4,61 4,612 4,61 4,676 Monte Vista, 2-213 4,744 4,651 4,564 4,467 4,458 4,432 4,451 4,418 4,412 4,355 2 21 22 23 24 25 26 27 28 29 21 211 212 213 Year Monte
Sandy: Fair Housing Equity Assessment
 Sandy: Fair Housing Equity Assessment Prepared by Bureau of Economic and Business Research David Eccles School of Business University of Utah James Wood John Downen DJ Benway Darius Li April 2013 [DRAFT]
WHO S LEFT TO HIRE? WORKFORCE AND UNEMPLOYMENT ANALYSIS PREPARED BY BENJAMIN FRIEDMAN JANUARY 23, 2019
 JANUARY 23, 2019 WHO S LEFT TO HIRE? WORKFORCE AND UNEMPLOYMENT ANALYSIS PREPARED BY BENJAMIN FRIEDMAN 13805 58TH STREET NORTH CLEARNWATER, FL, 33760 727-464-7332 Executive Summary: Pinellas County s unemployment
Cumberland Comprehensive Plan - Demographics Element Town Council adopted August 2003, State adopted June 2004 II. DEMOGRAPHIC ANALYSIS
 II. DEMOGRAPHIC ANALYSIS A. INTRODUCTION This demographic analysis establishes past trends and projects future population characteristics for the Town of Cumberland. It then explores the relationship of
Riverton: Fair Housing Equity Assessment
 Riverton: Fair Housing Equity Assessment Prepared by Bureau of Economic and Business Research David Eccles School of Business University of Utah James Wood John Downen DJ Benway Darius Li April 2013 [DRAFT]
Wyoming Economic and
 Wyoming Economic and Demographic Data Tools for your Toolbox Presented to: Wyoming Association of Municipal i Clerks and Treasurers (WAMCAT) 2011 Region VIII & WAMCAT Winter Workshop Jackson, Wyoming January
COMPREHENSIVE PLAN UPDATE EXECUTIVE SUMMARY. Plan Abstract
 Village of Swansea, Illinois 10/26/2017 Executive Summary COMPREHENSIVE PLAN UPDATE EXECUTIVE SUMMARY A Plan Abstract The following are excerpts from Swansea s 2017 Comprehensive Plan Update Comprehensive
Grassy Mountain Gold Project Socioeconomics and Environmental Justice Analysis - Draft Outline
 Grassy Mountain Gold Project Socioeconomics and Environmental Justice Analysis - Draft Outline EXECUTIVE SUMMARY CHAPTER 1 INTRODUCTION 1.1 Geographic Scope The geographic scope of the analysis is the
Technical Appendix 2 Demographics in Support of Chapter 2
 Technical Appendix 2 Demographics in Support of Chapter 2 List of Figures and Tables... 2 Introduction and Structure... 3 Introduction... 3 Structure... 4 Part One: Trends in Transit Use... 5 Younger and
Taylorsville: Fair Housing Equity Assessment
 Taylorsville: Fair Housing Equity Assessment Prepared by Bureau of Economic and Business Research David Eccles School of Business University of Utah James Wood John Downen DJ Benway Darius Li April 2013
Item #6B. September 17, 2014
 Regional Planning Partnership September 17, 2014 Item #6B 2016 MTP/SCS Update: Land Use Forecast Methodology Issue: How is the land use forecast methodology applied in the Metropolitan Transportation Plan/Sustainable
Meeting the Energy Needs of Low-Income Households in Connecticut Final Report
 Meeting the Energy Needs of Low-Income Households in Connecticut Final Report Prepared for Operation Fuel, Inc / December 2016 Table of Contents Table of Contents Executive Summary... i Study Methodology...
Title VI Service Equity Analysis
 Pierce Transit Title VI Service Equity Analysis Pursuant to FTA Circular 4702.1B March 2017 Restructure December 2016 Pierce Transit -- Transit Development Dept. PIERCE TRANSIT TITLE VI SERVICE EQUITY
PUBLIC DISCLOSURE COMMUNITY REINVESTMENT ACT PERFORMANCE EVALUATION
 PUBLIC DISCLOSURE February 22, 2010 COMMUNITY REINVESTMENT ACT PERFORMANCE EVALUATION Orange County Trust Company RSSD No. 176101 212 Dolson Avenue Middletown, NY 10940 FEDERAL RESERVE BANK OF NEW YORK
Lake Tahoe Basin Census Trends Report
 Lake Tahoe Basin Census Trends Report 1990-2000-2010 Prepared August 2013 Contents Page Executive Summary 1 Findings 1 Definitions 3 Section 1. Demographics 4 Population 4 Age 6 Race 6 Housing 10 Tenancy
Title VI Approval of Major Service Change, Disparate Impact and Disproportionate Burden
 Customer Service and Operations Committee Board Action Item III-A October 10, 2013 Title VI Approval of Major Service Change, Disparate Impact and Disproportionate Burden Page 3 of 42 Washington Metropolitan
3. Trends & Projections
 CONNECTIONS 2040: The Duluth - Superior Long Range Transportation Plan 3. Trends & Projections This section of Connections 2040 summarizes the trends in demographics, economics, land use and transportation
CHAPTER 5 INVESTMENT PLAN
 CHAPTER 5 INVESTMENT PLAN This chapter of the 2014 RTP/SCS plan illustrates the transportation investments for the Stanislaus region. Funding for transportation improvements is limited and has generally
Opportunities and Issues in Using HMDA Data
 Opportunities and Issues in Using HMDA Data Authors Robert B. Avery, Kenneth P. Brevoort, and Glenn B. Canner Abstract Since 1975, the Home Mortgage Disclosure Act (HMDA) has required most mortgage lending
OVERVIEW OF THE SAN DIEGO REGION Current Conditions and Future Trends
 OVERVIEW OF THE SAN DIEGO REGION Current Conditions and Future Trends Why do we need a Regional Comprehensive Plan? Let s examine the facts. It helps to look at some objective statistical information that
Demographic and Economic Trends in Rural America
 Demographic and Economic Trends in Rural America John Cromartie Geographer, ERS-USDA Tom Hertz Economist, ERS-USDA Lorin Kusmin Economist, ERS-USDA Presentation for HUD Rural Gateway Peer-to-Peer Call
The Three Cities in Toronto 1970 to 2005
 The Three Cities in Toronto 1970 to 2005 A 2006 Census Update J. David Hulchanski A 2006 Census update of the maps, charts and data in: J.D. Hulchanski, The Three Cities within Toronto: Income Polarization
The High Cost of Segregation: Exploring the Relationship Between Racial Segregation and Subprime Lending
 F u r m a n C e n t e r f o r r e a l e s t a t e & u r b a n p o l i c y N e w Y o r k U n i v e r s i t y s c h o o l o f l aw wa g n e r s c h o o l o f p u b l i c s e r v i c e n o v e m b e r 2 0
Road Map for the Future
 The Rockville Summit Road Map for the Future The City of Rockville, Maryland Current Economic Conditions And Future Directions Stephen S. Fuller, PhD The Dwight Schar Faculty Chair and University Professor
ONBOARD ORIGIN-DESTINATION STUDY
 REPORT ONBOARD ORIGIN-DESTINATION STUDY 12.23.2014 PREPARED FOR: ANCHORAGE METROPOLITAN AREA TRANSPORTATION SYSTEM (AMATS) 55 Railroad Row White River Junction, VT 05001 802.295.4999 www.rsginc.com SUBMITTED
Economic Overview Long Island
 Report created on August 29, 2017 Economic Overview Long Island Contact: Lisa.Montiel@suny.edu DEMOGRAPHIC PROFILE... 3 EMPLOYMENT TRENDS... 5 UNEMPLOYMENT RATE... 5 WAGE TRENDS... 6 COST OF LIVING INDEX...
LISC Building Sustainable Communities Initiative Neighborhood Quality Monitoring Report
 LISC Building Sustainable Communities Initiative Neighborhood Quality Monitoring Report Neighborhood:, Kansas City, MO The LISC Building Sustainable Communities (BSC) Initiative supports community efforts
Review of the Federal Transit Administration s Transit Economic Requirements Model. Contents
 Review of the Federal Transit Administration s Transit Economic Requirements Model Contents Summary Introduction 1 TERM History: Legislative Requirement; Conditions and Performance Reports Committee Activities