Urban Action Agenda Community Profiles COVER TO GO HERE. City of Beacon
|
|
|
- Eileen Poole
- 5 years ago
- Views:
Transcription

1 Urban Action Agenda Community Profiles COVER TO GO HERE City of Beacon

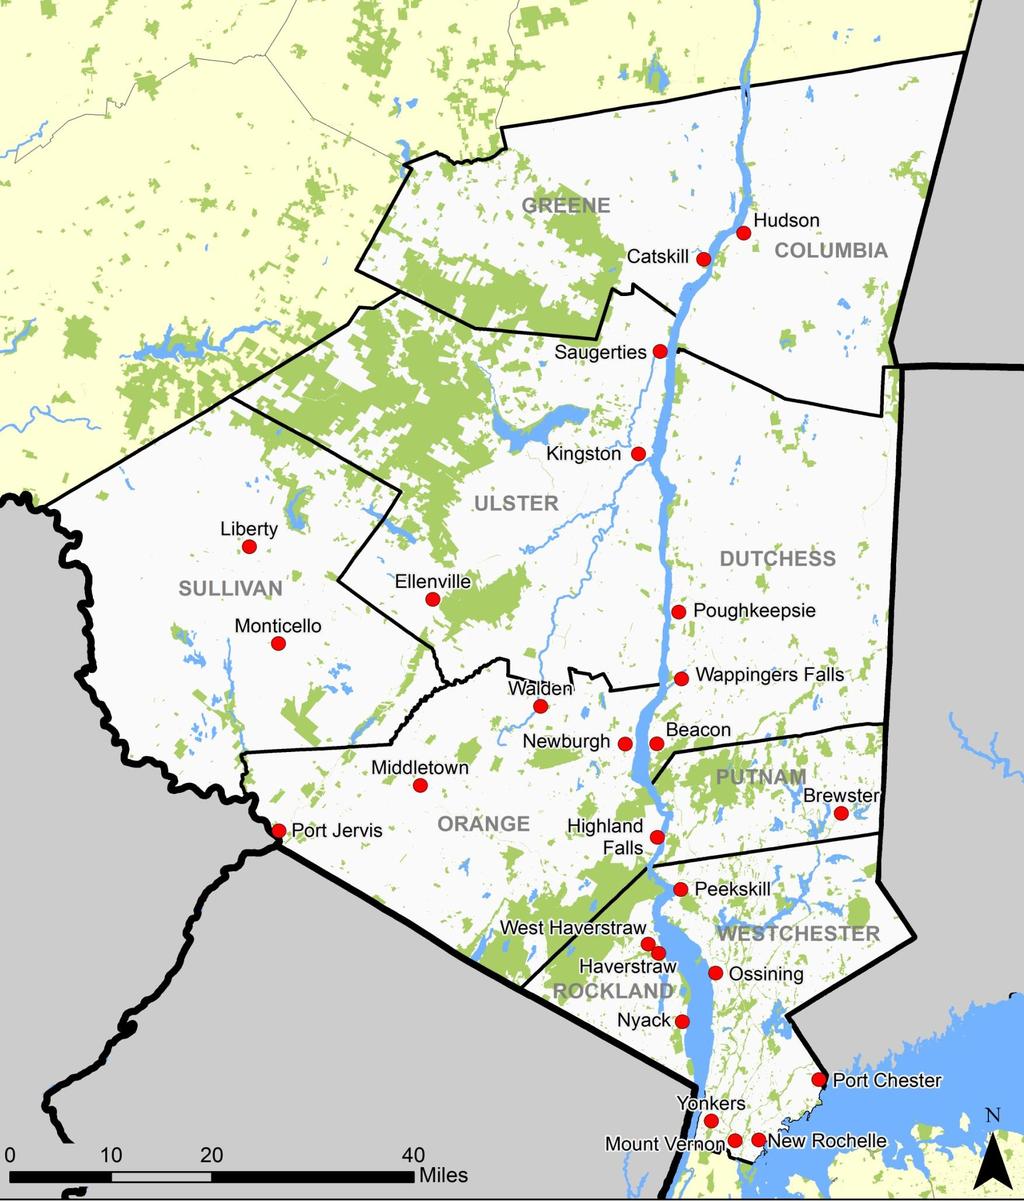
2 COMMUNITY OVERVIEW MAP
 28% Population under age 20 60% Population ages 20-64 11% Population 65 and older $50,441 Median household income 19% Residents with a bachelor s degree or higher 48% Owner-occupied housing 43%")
3 POPULATION & DEMOGRAPHICS Population Basics 27,828 Population (2015) Population Change 9.6% since Square Miles 5,456 Community Snapshot Population Density (people per sq. mile) 28% Population under age 20 60% Population ages % Population 65 and older $50,441 Median household income 19% Residents with a bachelor s degree or higher 48% Owner-occupied housing 43% Renter-occupied housing Population by Race and Ethnicity White 35% 57% Population & Demographics Analysis Middletown s population has grown by nearly 10% since Over that period, while the Hispanic population grew from 25% to 38% and the Black population grew from 13% to 22%, the White population fell from 57% to 35% of the city s total. Almost 30% of Middletown s population is under 20 years old. Most residents were born in the United States, but 18% were born abroad. Population by Race & Ethnicity The Other category includes Native Americans, Pacific Islanders, those who checked Other on the Census, and individuals with two or more races. Place of Birth The category of individuals who were born abroad and are not U.S. citizens includes both legal immigrants (with green cards, student visas, etc.) and undocumented immigrants. The U.S. Census does not ask individuals about their immigration status. Share of Population by Age and Sex % Of Male Population % Of Female Population to to to to to to to to to to to to to to to 14 5 to 9 < 5 15% 10% 5% 5% 10% 15% Black Hispanic or Latino Asian Other 2% 3% 3% 2% 13% 22% 25% 38% Place of Birth B o r n i n U n i t e d S t a t e s Born Abroad 67% 15% 6% 12% Born in NY Born Elsewhere in US Naturalized Citizen Not a US Citizen ; 2000 Decennial Census
4 HOUSING Housing Analysis Middletown s housing stock is divided relatively evenly between owner-occupied and renter-occupied units. While housing is affordable for 60% of homeowners, 54% of renters are cost burdened (paying more than 30% of their income towards housing), including 36% who are severely cost burdened (paying more than 50% of their income towards rent). Inflation-adjusted home values in Middletown have risen by 33% since 2000, exactly the same as in as a whole. Almost half of all homes are worth between $100,000 - $199,999. Over 60% of housing units are at least 50 years old, while only 15% of housing units were built since Median Home Value 2000 figures adjusted for inflation using CPI inflation tables from the U.S. Bureau of Labor Statistics. Age of Housing Stock Built 2010 or Later 2% Built 2000 to % Built 1990 to % Built 1980 to % Built 1970 to % Built 1960 to % Built 1950 to % Built 1940 to % Built 1939 or Earlier 44% Home Values Median Home Value $1,000,000 or more <1% $300,000 $750,000 - $999,999 $500,000 - $749,999 $400,000 - $499,999 $300,000 - $399,999 1% <1% 3% 7% $200,000 $100,000 $143K $191K $199K $263K $200,000 - $299,999 $100,000 - $199,999 $0 - $99,999 8% 33% 47% $ Middletown ; 2000 Decennial Census Affordability (% of Income Towards Housing Costs) Housing Occupancy Owners 60% 24% 16% 5,250 Units 48% 86,184 / 63% Renters 46% 18% 36% 4,763 / 43% 39, 086 / 29% Number of Households Affordable (<30%) Unaffordable (30-50%) Severely Unaffordable (>50%) Source: U.S. Dept. of HUD - Comprehensive Housing Affordability Strategy Data (2017) 996 / 9% 11,668 / 9% Middletown Vacant Rented Owned
5 INCOME & POVERTY Household Income Distribution $200,000 or more 2% 7% $150,000 - $199,999 4% 9% $100,000 - $149,999 13% 19% $75,000 - $99,999 13% 13% $50,000 - $74,999 18% 16% Income & Poverty Analysis Since 2000, Middletown s median household income has fallen by 7% when accounting for inflation, while the poverty rate has risen from 15% to 19%. The share of households receiving SNAP benefits has risen from 12% to 18% since Half of households earn less than $50,000 while only 19% earn over $100,000. Median Household Income 2000 figures adjusted for inflation using CPI inflation tables from the U.S. Bureau of Labor Statistics. Households Below the Poverty Line The federal poverty line is adjusted on a yearly basis and varies by household size. As of 2015, the poverty line for a family of four was $24,250. Households Receiving SNAP SNAP is the Supplemental Nutrition Assistance Program (formerly Food Stamps). To qualify for SNAP, a household must have an income below 130% of the poverty line. $25,000 - $49,999 $10,000 - $24,999 Less than $10,000 22% 18% 17% 12% 11% 6% Median Household Income $80,000 $60,000 Middletown $40,000 $20,000 $54,464 $50,441 $71,653 $70,848 Households Receiving SNAP $ Middletown ; 2000 Decennial Census (Inflation Adjusted) 15% 10% 18% Households Below the Poverty Line 15% 5% 0% 12% 11% 7% Middletown 10% 5% 0% 19% 15% 14% 12% 9% 9% Middletown Source: 2010 & 2015 American Community Survey ; 2000 Decennial Census


6 City of BEACON ECONOMY ECONOMY Economy Analysis The percent of Middletown residents who are employed has edged up since 2000, although the share who are unemployed doubled. Only 28% of Middletown residents work in the city, but 79% work in. Almost 85% of residents commute by car, while 5% take public transportation. The educational services, health care and social assistance and public administration sector employs the most Middletown residents, followed by retail trade. In 2016, Middletown became the first winner of the NY State $10 million Downtown Revitalization Initiative award in the mid-hudson region. Employment Data on unemployment comes from American Community Survey, which reports data by municipality. The Bureau of Labor Statistics is a common source for national unemployment rate data but does not report data at the municipal level. Employment by Industry of Middletown Residents Agriculture, forestry, fishing & hunting, and mining Construction Manufacturing Wholesale trade Retail Trade Transportation & warehousing and utilities Information Finance & insurance, and real estate & rental & leasing Professional, scientific, & management, & administrative & waste mgmt. services Educational services, health care & social assistance Arts, entertainment, and recreation, and accommodation and food services Other services, except public administration Public administration ,328 1,252 1,860 1,750 1,131 1,681 3,253 3,173 Means of Travel to Work Worked at home 3% Walked 3% Public Transit 5% Other 4% Carpooled 16% % of residents who work in Middletown % of residents who work in Average Commute Time Drove Alone 68% Place of Work & Commute Time 28% 79% 31 Minutes Employment (Age 16 and Older) 57% 61% 60% 39% 30% 31% 4% 9% 10% Unemployed Not in Labor Force Employed Source: American Community Survey, US Decennial Census
 2012 2013 2014 2015 2016 2017 Yes Yes Yes Yes Yes Yes Bond Rating (Moody s) A1 (Upper Medium Grade) Rating Date: May 10, 2016 Median Home Value $191,000 School District City County")

7 DOLLARS & CENTS Taxes on Median Home $5,000 (59%) $2,766 (33%) $745 (9%) Total Taxes - $8,459 Municipal Finances Did City Budget Stay Under NY State Tax Cap? Source: (2015) Yes Yes Yes Yes Yes Yes Bond Rating (Moody s) A1 (Upper Medium Grade) Rating Date: May 10, 2016 Median Home Value $191,000 School District City County Sources: Moody s; Office of the New York State Comptroller Dollars and Cents Analysis Middletown has kept its municipal budget under the Tax Cap every year since 2012 and its bond rating is above average. City property taxes are 33% of the average tax bill. The city has 211 full time and 30 part time employees. Municipal Finances The NY Tax Cap law restricts schools and local governments from raising the property tax levy by more than 2% without a supermajority vote of the local governing body. Municipal Employees Employees were counted as part time if they earned less than $30,000 in 2016 and full time if they earned over $30,000. General employees are non-police/fire employees. Municipal Revenues and Expenditures Categories are determined by the Comptroller s Office. Proceeds of Debt revenue comes from sale of bonds and is not a recurring yearly source of revenue. Municipal Revenues and Expenditures Econ. Dev. 2% Culture & Rec. 4% Transportation 5% Utilities 5% Community Services 1% Sanitation 7% Employee Benefits 26% Public Safety 21% 2016 Expenditures $53,069,574 Municipal Employees Debt Service 9% General Government Part Time 28 Part Time 2 Federal Aid 2% Other Local Revenues 3% Real Property Taxes and Assessments 28% 2016 Revenues $66,510,138 Full Time 120 Full Time 91 Other Real Prop. Tax Items 3% State Aid 5% Proceeds of Debt 24% General Employees Median FT Salary: $62,144 Police/Fire Employees Median FT Salary: $96,207 Source: Office of the New York State Comptroller (2016) Sales and Use Tax 15% Charges for Services Source: Office of the New York State Comptroller

8 city of MIDDLETOWN EDUCATION Education Analysis The City School District of Middletown serves just under 7,500 students in the city and parts of two adjacent towns. Enrollment in the district is growing steadily, rising by 28% since Over the past decade, the graduation rate has also risen, even as per pupil expenditures have stayed nearly flat. The number of students receiving free or reduced lunch (a measure of poverty) has increased significantly since the school year, rising from 53% to 79%. Expenditures per Pupil Adjusted for inflation using CPI inflation tables from the U.S. Bureau of Labor Statistics. Graduation Rate & College/Career Readiness College/Career Readiness (CCR), also known as Aspirational Performance Measure, is a statistic created by NY State to track high school graduates ability to succeed in college or the workforce. CCR is based on a student s Regents scores and was introduced in the school year data is not yet available. Student Characteristics Students are eligible for free school lunch if their family s income is below 130% of the poverty line and reduced price lunch if their family s income is below 185% of the poverty line. English Language Learners are students who have been classified as not proficient in English and require additional instruction. Average SAT Scores Category Score (800 max) Rank Among 23 UAA districts Reading Math 455 T-19 Writing Source: New York State Department of Education ( ) Education Level of City Residents 7% Graduate or Professional 12% Degree 10% Bachelor's Degree 23% Associate's Degree City School District of Middletown 31% 17% Some College, No Degree High School Diploma or GED Less than High School Graduate Expenditures Per Pupil Households in Poverty and Receiving SNAP $30,000 $28,000 $26,000 $24,000 $22,000 $20,000 $18,000 $16,000 $14,000 $12,000 $10,000 Source: New York State Department of Education (Infl. Adjusted)

 100% 90% 80% 70% 60% 50% 40% 30% 10% 0% 54%")
9 city of MIDDLETOWN EDUCATION Post-Graduation Plans of Graduating High School Seniors 6% 13% 9% 4-Year College Military Other 46% 26% 2-Year College Employment Source: New York State Department of Education ( ) City School District of Middletown Enrollment Source: New York State Department of Education Student to Teacher Ratio Graduation Rate & College/Career Readiness 14 : 1 Source: New York State Department of Education ( ) 100% 90% 80% 70% 60% 50% 40% 30% 10% 0% 54% 62% 59% 71% 73% 73% 69% 74% 76% 74% 27% 18% 19% 22% 23% 78% Race & Ethnicity of Students Asian 3% Hispanic 55% Other 3% White 16% Black 23% Graduation Rate Student Characteristics 90% 80% 70% 60% 50% 40% 30% 10% 0% College/Career Readiness Source: New York State Department of Education Source: New York State Department of Education ( ) Eligible for Free & Reduced Lunch English Language Learner Source: New York State Department of Education

10 HEALTH Health Analysis The number of births in the city has plunged since % of students in Middletown public schools were overweight or obese. 87% of Middletown residents have health insurance. County Health Ranking Each year, the Robert Wood Johnson Foundation releases a health ranking for every county in the U.S. These rankings are based on dozens of key health metrics. Access to Quality Food The US Dept. of Agriculture defines census tracts as food deserts if the tracts have high poverty and low access to food. Pattern analyzed GIS data to find supermarket walktimes. Childhood Obesity These categories are mutually exclusive. Obese individuals are not also counted as overweight. County Health Ranking Rank out of 62 New York Counties Source: Robert Wood Johnson County Health Rankings Access to Quality Food Childhood Obesity 30% 25% 15% 10% 5% 24% 16% 17% 18% 0% Middletown City School District Overweight Obese Sources: USDA Food Access Research Atlas (2015); Pattern GIS analysis Source: New York State Department of Health ( average) Number of Births Health Insurance Rate % 87% Insured Uninsured Source: New York State Department of Health

11 Crimes per 1000 residents city of MIDDLETOWN QUALITY OF LIFE Access to Parks Ï F Acres of Open Space & Parks in Municipality 67 Residents per Acre of Parkland Avg. Annual Household Spending 418 Source: Pattern for Progress Analysis of GIS Data Quality of Life Analysis Middletown has several attractive parks scattered throughout the city. After peaking in the early 1990s and rising again during the 2000s, the property crime rate is down by nearly 50% since The violent crime rate is low, but has slightly increased since Per Capita Crime Rate This metric tracks totals for certain types of property and violent crimes. The property crimes tracked are burglary, larceny, and motor vehicle theft. The violent crimes tracked are murder, rape, robbery, and aggravated assault. Per Capita Crime Rate Property Crime Rate Violent Crime Rate 0 Source: ESRI Business Analyst 2017 Source: NY State Division of Criminal Justice Services The Urban Action Agenda (UAA) is a major initiative led by Hudson Valley Pattern for Progress to promote growth and revitalization in urban centers throughout the nine-county Hudson Valley Region. The Valley contains a wide variety of urban centers, large and small, located along the Hudson River and other historic transportation corridors. These cities and villages are where population, social, cultural, civic, and economic activity traditionally clustered. With their existing infrastructure, access to transit, and traditions of denser development, these communities are well positioned to accommodate the region's growth in the 21 st Century. Pattern began working on the UAA profiles in 2014 thanks to a multi-year grant from the Ford Foundation. To keep the project s scale manageable, the UAA focuses on a group of 25 higher-need urban areas in the region, selected for reasons Including changing demographics and poverty. An initial set of ABOUT THIS PROJECT profiles were issued in early 2016 in partnership with the Regional Plan Association. Now, this set of updated and expanded community profiles represent the next step in the UAA s efforts to provide useful data to policymakers, residents, and business and community groups in the Valley s urban areas. Current funding for these profiles comes from Empire State Development and the NYS Department of State through the Mid-Hudson Regional Economic Development Council. About Hudson Valley Pattern for Progress Pattern is a half-century old not-for-profit policy, planning, advocacy, and research organization whose mission is to promote regional, balanced, and sustainable solutions that enhance the growth and vitality of the Hudson Valley. To learn more about Pattern and the UAA, visit our website: This community profile was prepared with funding provided by the New York State Department of State under Title 11 of the Environmental Protection Fund.

12 URBAN ACTION AGENDA COMMUNITIES
Urban Action Agenda Community Profiles COVER TO GO HERE. City of Beacon
 Urban Action Agenda Community Profiles COVER TO GO HERE City of Beacon COMMUNITY OVERVIEW MAP POPULATION & DEMOGRAPHICS Population Basics 2,212 Population (2015) Population Change 2. since 2000 0.5 Square
Mid - City Industrial
 Minneapolis neighborhood profile October 2011 Mid - City Industrial About this area The Mid-City Industrial neighborhood is bordered by I- 35W, Highway 280, East Hennepin Avenue, and Winter Street Northeast.
University of Minnesota
 neighborhood profile October 2011 About this area The University neighborhood is bordered by 11th Avenue Southeast, University Avenue, 15th Avenue Southeast, the railroad tracks, Oak Street, and the Mississippi
Camden Industrial. Minneapolis neighborhood profile. About this area. Trends in the area. Neighborhood in Minneapolis.
 Minneapolis neighborhood profile October 2011 Camden Industrial About this area The Camden Industrial neighborhood is bordered by 48th Avenue North, the Mississippi River, Dowling Avenue North, Washington
LAKE FOREST NEIGHBORHOOD PROFILE
 LAKE FOREST NEIGHBORHOOD PROFILE July 2017 Prepared in Partnership Between the Kentucky State Data Center at the University of Louisville and Metro United Way This data profile uses 2010 census tract boundaries
Shingle Creek. Minneapolis neighborhood profile. About this area. Trends in the area. Neighborhood in Minneapolis. October 2011
 neighborhood profile October 2011 About this area The neighborhood is bordered by 53rd Avenue North, Humboldt Avenue North, 49th Avenue North, and Xerxes Avenue North. It is home to Olson Middle School.
EASTWOOD-LONG RUN NEIGHBORHOOD PROFILE
 EASTWOOD-LONG RUN NEIGHBORHOOD PROFILE July 2017 Prepared in Partnership Between the Kentucky State Data Center at the University of Louisville and Metro United Way This data profile uses 2010 census tract
GERMANTOWN-PARISTOWN NEIGHBORHOOD PROFILE
 GERMANTOWN-PARISTOWN NEIGHBORHOOD PROFILE July 2017 Prepared in Partnership Between the Kentucky State Data Center at the University of Louisville and Metro United Way Louisville s traditional urban neighborhoods
SOUTH LOUISVILLE NEIGHBORHOOD PROFILE
 SOUTH LOUISVILLE NEIGHBORHOOD PROFILE July 2017 Prepared in Partnership Between the Kentucky State Data Center at the University of Louisville and Metro United Way Louisville s traditional urban neighborhoods
SHELBY PARK NEIGHBORHOOD PROFILE
 SHELBY PARK NEIGHBORHOOD PROFILE July 2017 Prepared in Partnership Between the Kentucky State Data Center at the University of Louisville and Metro United Way Louisville s traditional urban neighborhoods
CHEROKEE-SENECA NEIGHBORHOOD PROFILE
 CHEROKEE-SENECA NEIGHBORHOOD PROFILE July 2017 Prepared in Partnership Between the Kentucky State Data Center at the University of Louisville and Metro United Way Louisville s traditional urban neighborhoods
PORTLAND NEIGHBORHOOD PROFILE
 PORTLAND NEIGHBORHOOD PROFILE July 2017 Prepared in Partnership Between the Kentucky State Data Center at the University of Louisville and Metro United Way Louisville s traditional urban neighborhoods
Economic Overview City of Tyler, TX. January 8, 2018
 Economic Overview City of Tyler, TX January 8, 2018 DEMOGRAPHIC PROFILE...3 EMPLOYMENT TRENDS...5 WAGE TRENDS...5 COST OF LIVING INDEX...6 INDUSTRY SNAPSHOT...7 OCCUPATION SNAPSHOT...9 INDUSTRY CLUSTERS...
Economic Overview York County, South Carolina. February 14, 2018
 Economic Overview York County, February 14, 2018 DEMOGRAPHIC PROFILE... 3 EMPLOYMENT TRENDS... 5 UNEMPLOYMENT RATE... 5 WAGE TRENDS... 6 COST OF LIVING INDEX... 6 INDUSTRY SNAPSHOT... 7 OCCUPATION SNAPSHOT...
Town Profiles: Demographic, Economic, and Housing Statistics for De Smet City and Wall Town, SOuth Dakota
 South Dakota State University Open PRAIRIE: Open Public Research Access Institutional Repository and Information Exchange Census Data Center News Releases SDSU Census Data Center 12-7-2017 Town Profiles:
OLD LOUISVILLE-LIMERICK (OLD LOU-LMK) NEIGHBORHOOD PROFILE
 NEIGHBORHOOD PROFILE") OLD LOUISVILLE-LIMERICK () NEIGHBORHOOD PROFILE July 2017 Prepared in Partnership Between the Kentucky State Data Center at the University of Louisville and Metro United Way Louisville s traditional urban
OLD LOUISVILLE-LIMERICK () NEIGHBORHOOD PROFILE July 2017 Prepared in Partnership Between the Kentucky State Data Center at the University of Louisville and Metro United Way Louisville s traditional urban
Economic Overview. Lawrence, KS MSA
 Economic Overview Lawrence, KS MSA March 5, 2019 DEMOGRAPHIC PROFILE... 3 EMPLOYMENT TRENDS... 5 UNEMPLOYMENT RATE... 5 WAGE TRENDS... 6 COST OF LIVING INDEX... 7 INDUSTRY SNAPSHOT... 8 OCCUPATION SNAPSHOT...
ECONOMIC OVERVIEW DuPage County, Illinois
 ECONOMIC OVERVIEW DuPage County, Illinois DEMOGRAPHIC PROFILE... 3 EMPLOYMENT TRENDS... 5 UNEMPLOYMENT RATE... 5 WAGE TRENDS... 6 COST OF LIVING INDEX... 7 INDUSTRY SNAPSHOT... 8 OCCUPATION SNAPSHOT...
Economic Overview Monterey County, California. July 22, 2016
 Economic Overview Monterey July 22, 2016 DEMOGRAPHIC PROFILE... 3 EMPLOYMENT TRENDS... 5 UNEMPLOYMENT RATE... 5 WAGE TRENDS... 6 COST OF LIVING INDEX... 6 INDUSTRY SNAPSHOT... 7 OCCUPATION SNAPSHOT...
TABLE 1. PROFILE OF GENERAL DEMOGRAPHIC CHARACTERISTICS
 Waterloo city, Iowa TABLE 1. PROFILE OF GENERAL DEMOGRAPHIC CHARACTERISTICS Estimate Lower Bound Upper Bound Total population 66,659 64,093 69,225 SEX AND AGE Male 32,096 30,415 33,777 Female 34,563 33,025
Economic Overview Long Island
 Report created on August 29, 2017 Economic Overview Long Island Contact: Lisa.Montiel@suny.edu DEMOGRAPHIC PROFILE... 3 EMPLOYMENT TRENDS... 5 UNEMPLOYMENT RATE... 5 WAGE TRENDS... 6 COST OF LIVING INDEX...
Economic Overview Loudoun County, Virginia. October 23, 2017
 Economic Overview October 23, 2017 DEMOGRAPHIC PROFILE... 3 EMPLOYMENT TRENDS... 5 UNEMPLOYMENT RATE... 5 WAGE TRENDS... 6 COST OF LIVING INDEX... 6 INDUSTRY SNAPSHOT... 7 OCCUPATION SNAPSHOT... 9 INDUSTRY
DEMOGRAPHIC PROFILE...3 EMPLOYMENT TRENDS...5 UNEMPLOYMENT RATE...5 WAGE TRENDS...6 COST OF LIVING INDEX...6 INDUSTRY SNAPSHOT...7
 March 14, 2017 DEMOGRAPHIC PROFILE...3 EMPLOYMENT TRENDS...5 UNEMPLOYMENT RATE...5 WAGE TRENDS...6 COST OF LIVING INDEX...6 INDUSTRY SNAPSHOT...7 OCCUPATION SNAPSHOT...9 INDUSTRY CLUSTERS... 12 EDUCATION
Economic Overview Capital District
 August 29, 2017 Economic Overview Capital District Contact: Lisa.Montiel@suny.edu DEMOGRAPHIC PROFILE... 3 EMPLOYMENT TRENDS... 5 UNEMPLOYMENT RATE... 5 WAGE TRENDS... 6 COST OF LIVING INDEX... 6 INDUSTRY
Economic Overview New York
 Report created on October 20, 2015 Economic Overview Created using: Contact: Lisa.Montiel@suny.edu DEMOGRAPHIC PROFILE...3 EMPLOYMENT TRENDS...5 UNEMPLOYMENT RATE...5 WAGE TRENDS...6 COST OF LIVING INDEX...6
October 28, Economic Overview Yellowstone County, Montana
 October 28, 2016 Economic Overview Yellowstone DEMOGRAPHIC PROFILE...3 EMPLOYMENT TRENDS...5 UNEMPLOYMENT RATE...5 WAGE TRENDS...6 COST OF LIVING INDEX...6 INDUSTRY SNAPSHOT...7 OCCUPATION SNAPSHOT...9
Economic Overview Fairfax / Falls Church. October 23, 2017
 Economic Overview Fairfax / Falls Church October 23, 2017 DEMOGRAPHIC PROFILE... 3 EMPLOYMENT TRENDS... 5 UNEMPLOYMENT RATE... 5 WAGE TRENDS... 6 COST OF LIVING INDEX... 6 INDUSTRY SNAPSHOT... 7 OCCUPATION
Economic Overview Long Island
 Report created on October 20, 2015 Economic Overview Long Island Created using: Contact: Lisa.Montiel@suny.edu DEMOGRAPHIC PROFILE...3 EMPLOYMENT TRENDS...5 UNEMPLOYMENT RATE...5 WAGE TRENDS...6 COST OF
June 9, Economic Overview Billings, MT MSA
 June 9, 2016 Economic Overview Billings, MT MSA DEMOGRAPHIC PROFILE... 3 EMPLOYMENT TRENDS... 5 UNEMPLOYMENT RATE... 5 WAGE TRENDS... 6 COST OF LIVING INDEX... 6 INDUSTRY SNAPSHOT... 7 OCCUPATION SNAPSHOT...
Economic Overview Mohawk Valley
 Report created on August 29, 2017 Economic Overview Mohawk Valley Contact: Lisa.Montiel@suny.edu DEMOGRAPHIC PROFILE... 3 EMPLOYMENT TRENDS... 5 UNEMPLOYMENT RATE... 5 WAGE TRENDS... 6 COST OF LIVING INDEX...
Economic Profile. Capital Crossroads. a vision forward
 Economic Profile Capital a vision forward This profile was prepared by: Liesl Eathington Department of Economics State University phone: (515) 294 2954 email: leathing@iastate.edu 5/23/2012 Distribution
Economic Overview Western New York
 Report created on August 29, 2017 Economic Overview Western New Contact: Lisa.Montiel@suny.edu DEMOGRAPHIC PROFILE... 3 EMPLOYMENT TRENDS... 5 UNEMPLOYMENT RATE... 5 WAGE TRENDS... 6 COST OF LIVING INDEX...
Economic Overview Prince William/Manassas. October 23, 2017
 Economic Overview Prince William/Manassas October 23, 2017 DEMOGRAPHIC PROFILE... 3 EMPLOYMENT TRENDS... 5 UNEMPLOYMENT RATE... 5 WAGE TRENDS... 6 COST OF LIVING INDEX... 6 INDUSTRY SNAPSHOT... 7 OCCUPATION
Economic Overview 45-Minute Commute From Airport Park. June 6, 2017
 Economic Overview 45-Minute Commute From Airport Park June 6, 2017 DEMOGRAPHIC PROFILE... 3 EMPLOYMENT TRENDS... 5 WAGE TRENDS... 5 COST OF LIVING INDEX... 6 INDUSTRY SNAPSHOT... 7 OCCUPATION SNAPSHOT...
Monte Vista Population, ,744 4,651 4,564 4,467 4,458 4,432 4,451
 1 Monte Vista 4,8 4,7 4,6 4,5 4,4 4,3 4,2 4,1 4,61 4,612 4,61 4,676 Monte Vista, 2-213 4,744 4,651 4,564 4,467 4,458 4,432 4,451 4,418 4,412 4,355 2 21 22 23 24 25 26 27 28 29 21 211 212 213 Year Monte
Commission District 4 Census Data Aggregation
 Commission District 4 Census Data Aggregation 2011-2015 American Community Survey Data, U.S. Census Bureau Table 1 (page 2) Table 2 (page 2) Table 3 (page 3) Table 4 (page 4) Table 5 (page 4) Table 6 (page
Economic Overview Plant City Region. April 5, 2017
 Economic Overview Plant City Region April 5, 2017 DEMOGRAPHIC PROFILE... 3 EMPLOYMENT TRENDS... 5 WAGE TRENDS... 5 COST OF LIVING INDEX... 6 INDUSTRY SNAPSHOT... 7 OCCUPATION SNAPSHOT... 9 INDUSTRY CLUSTERS...
Northwest Census Data Aggregation
 Northwest Census Data Aggregation 2011-2015 American Community Survey Data, U.S. Census Bureau Table 1 (page 2) Table 2 (page 2) Table 3 (page 3) Table 4 (page 4) Table 5 (page 4) Table 6 (page 5) Table
Riverview Census Data Aggregation
 Riverview Census Data Aggregation 2011-2015 American Community Survey Data, U.S. Census Bureau Table 1 (page 2) Table 2 (page 2) Table 3 (page 3) Table 4 (page 4) Table 5 (page 4) Table 6 (page 5) Table
Economic Overview Marlboro County Labor Shed. June 29, 2016
 Economic Overview Marlboro County Labor June 29, 2016 DEMOGRAPHIC PROFILE...3 EMPLOYMENT TRENDS...5 UNEMPLOYMENT RATE...5 WAGE TRENDS...6 COST OF LIVING INDEX...6 INDUSTRY SNAPSHOT...7 OCCUPATION SNAPSHOT...9
Zipe Code Census Data Aggregation
 Zipe Code 66101 Census Data Aggregation 2011-2015 American Community Survey Data, U.S. Census Bureau Table 1 (page 2) Table 2 (page 2) Table 3 (page 3) Table 4 (page 4) Table 5 (page 4) Table 6 (page 5)
Zipe Code Census Data Aggregation
 Zipe Code 66103 Census Data Aggregation 2011-2015 American Community Survey Data, U.S. Census Bureau Table 1 (page 2) Table 2 (page 2) Table 3 (page 3) Table 4 (page 4) Table 5 (page 4) Table 6 (page 5)
SDs from Regional Peer Group Mean. SDs from Size Peer Group Mean
 Family: Population Demographics Population Entire MSA 602894 Central Cities (CC) 227,818 Outside Central Cities 375,076 Percent of Entire MSA 37.79% Population in CC Percent Change in Population from 1999
SDs from Regional Peer Group Mean. SDs from Size Peer Group Mean
 Family: Population Demographics Population Entire MSA 1187941 Central Cities (CC) 511,843 Outside Central Cities 676,098 Percent of Entire MSA 43.09% Population in CC Percent Change in Population from
SDs from Regional Peer Group Mean. SDs from Size Peer Group Mean
 Family: Population Demographics Population Entire MSA 661645 Central Cities (CC) 247,057 Outside Central Cities 414,588 Percent of Entire MSA 37.34% Population in CC Percent Change in Population from 1999
SDs from Regional Peer Group Mean. SDs from Size Peer Group Mean
 Family: Population Demographics Population Entire MSA 583845 Central Cities (CC) 316,649 Outside Central Cities 267,196 Percent of Entire MSA 54.24% Population in CC Percent Change in Population from 1999
SDs from Regional Peer Group Mean. SDs from Size Peer Group Mean
 Family: Population Demographics Population Entire MSA 1251509 Central Cities (CC) 540,423 Outside Central Cities 711,086 Percent of Entire MSA 43.18% Population in CC Percent Change in Population from
SDs from Regional Peer Group Mean. SDs from Size Peer Group Mean
 Family: Population Demographics Population Entire MSA 1135614 Central Cities (CC) 677,766 Outside Central Cities 457,848 Percent of Entire MSA 59.68% Population in CC Percent Change in Population from
SDs from Regional Peer Group Mean. SDs from Size Peer Group Mean
 Family: Population Demographics Population Entire MSA 591932 Central Cities (CC) 260,970 Outside Central Cities 330,962 Percent of Entire MSA 44.09% Population in CC Percent Change in Population from 1999
SDs from Regional Peer Group Mean. SDs from Size Peer Group Mean
 Family: Population Demographics Population Entire MSA 1100491 Central Cities (CC) 735,617 Outside Central Cities 364,874 Percent of Entire MSA 66.84% Population in CC Percent Change in Population from
SDs from Regional Peer Group Mean. SDs from Size Peer Group Mean
 Family: Population Demographics Population Entire MSA 540258 Central Cities (CC) 198,915 Outside Central Cities 341,343 Percent of Entire MSA 36.82% Population in CC Percent Change in Population from 1999
SDs from Regional Peer Group Mean. SDs from Size Peer Group Mean
 Family: Population Demographics Population Entire MSA 1249763 Central Cities (CC) 691,295 Outside Central Cities 558,468 Percent of Entire MSA 55.31% Population in CC Percent Change in Population from
SDs from Regional Peer Group Mean. SDs from Size Peer Group Mean
 Family: Population Demographics Population Entire MSA 1088514 Central Cities (CC) 272,953 Outside Central Cities 815,561 Percent of Entire MSA 25.08% Population in CC Percent Change in Population from
SDs from Regional Peer Group Mean. SDs from Size Peer Group Mean
 Family: Population Demographics Population Entire MSA 922516 Central Cities (CC) 470,859 Outside Central Cities 451,657 Percent of Entire MSA 51.04% Population in CC Percent Change in Population from 1999
SDs from Regional Peer Group Mean. SDs from Size Peer Group Mean
 Family: Population Demographics Population Entire MSA 687249 Central Cities (CC) 198,500 Outside Central Cities 488,749 Percent of Entire MSA 28.88% Population in CC Percent Change in Population from 1999
SDs from Regional Peer Group Mean. SDs from Size Peer Group Mean
 Family: Population Demographics Population Entire MSA 542149 Central Cities (CC) 181870 Outside Central Cities 360279 Percent of Entire MSA 33.55% Population in CC Percent Change in Population from 1999
SDs from Regional Peer Group Mean. SDs from Size Peer Group Mean
 Family: Population Demographics Population Entire MSA 1025598 Central Cities (CC) 293,834 Outside Central Cities 731,764 Percent of Entire MSA 28.65% Population in CC Percent Change in Population from
SDs from Regional Peer Group Mean. SDs from Size Peer Group Mean
 Family: Population Demographics Population Entire MSA 875583 Central Cities (CC) 232,835 Outside Central Cities 642,748 Percent of Entire MSA 26.59% Population in CC Percent Change in Population from 1999
SDs from Regional Peer Group Mean. SDs from Size Peer Group Mean
 Family: Population Demographics Population Entire MSA 716998 Central Cities (CC) 448,275 Outside Central Cities 268,723 Percent of Entire MSA 62.52% Population in CC Percent Change in Population from 1999
SDs from Regional Peer Group Mean. SDs from Size Peer Group Mean
 Family: Population Demographics Population Entire MSA 1333914 Central Cities (CC) 284,943 Outside Central Cities 1,048,971 Percent of Entire MSA 21.36% Population in CC Percent Change in Population from
SDs from Regional Peer Group Mean. SDs from Size Peer Group Mean
 Family: Population Demographics Population Entire MSA 712738 Central Cities (CC) 448,607 Outside Central Cities 264,131 Percent of Entire MSA 62.94% Population in CC Percent Change in Population from 1999
SDs from Regional Peer Group Mean. SDs from Size Peer Group Mean. Population Entire MSA
 Family: Population Demographics Population Entire MSA 1169641 Central Cities (CC) 0 Outside Central Cities 1,169,641 Percent of Entire MSA 0% Population in CC Percent Change in Population from 1999 to
SDs from Regional Peer Group Mean. SDs from Size Peer Group Mean
 Family: Population Demographics Population Entire MSA 3251876 Central Cities (CC) 2,078,750 Outside Central Cities 1,173,126 Percent of Entire MSA 63.92% Population in CC Percent Change in Population from
SDs from Regional Peer Group Mean. SDs from Size Peer Group Mean
 Family: Population Demographics Population Entire MSA 1592383 Central Cities (CC) 1,181,140 Outside Central Cities 411,243 Percent of Entire MSA 74.17% Population in CC Percent Change in Population from
SDs from Regional Peer Group Mean. SDs from Size Peer Group Mean
 Family: Population Demographics Population Entire MSA 1776062 Central Cities (CC) 716,793 Outside Central Cities 1,059,269 Percent of Entire MSA 40.36% Population in CC Percent Change in Population from
SDs from Regional Peer Group Mean. SDs from Size Peer Group Mean
 Family: Population Demographics Population Entire MSA 4112198 Central Cities (CC) 416,474 Outside Central Cities 3,695,724 Percent of Entire MSA 10.13% Population in CC Percent Change in Population from
SDs from Regional Peer Group Mean. SDs from Size Peer Group Mean
 Family: Population Demographics Population Entire MSA 9519338 Central Cities (CC) 4408996 Outside Central Cities 5110342 Percent of Entire MSA 46.32% Population in CC Percent Change in Population from
SDs from Regional Peer Group Mean. SDs from Size Peer Group Mean
 Family: Population Demographics Population Entire MSA 1623018 Central Cities (CC) 152397 Outside Central Cities 1470621 Percent of Entire MSA 9.39% Population in CC Percent Change in Population from 1999
SDs from Regional Peer Group Mean. SDs from Size Peer Group Mean
 Family: Population Demographics Population Entire MSA 1731183 Central Cities (CC) 776733 Outside Central Cities 954450 Percent of Entire MSA 44.87% Population in CC Percent Change in Population from 1999
SDs from Regional Peer Group Mean. SDs from Size Peer Group Mean
 Family: Population Demographics Population Entire MSA 2968806 Central Cities (CC) 669,769 Outside Central Cities 2,299,037 Percent of Entire MSA 22.56% Population in CC Percent Change in Population from
SDs from Regional Peer Group Mean. SDs from Size Peer Group Mean
 Family: Population Demographics Population Entire MSA 2846289 Central Cities (CC) 809063 Outside Central Cities 2037226 Percent of Entire MSA 28.43% Population in CC Percent Change in Population from 1999
SDs from Regional Peer Group Mean. SDs from Size Peer Group Mean
 Family: Population Demographics Population Entire MSA 4441551 Central Cities (CC) 1147720 Outside Central Cities 3293831 Percent of Entire MSA 25.84% Population in CC Percent Change in Population from
SDs from Regional Peer Group Mean. SDs from Size Peer Group Mean
 Family: Population Demographics Population Entire MSA 1500741 Central Cities (CC) 661799 Outside Central Cities 838942 Percent of Entire MSA 44.1% Population in CC Percent Change in Population from 1999
SDs from Regional Peer Group Mean. SDs from Size Peer Group Mean
 Family: Population Demographics Population Entire MSA 2552994 Central Cities (CC) 686992 Outside Central Cities 1866002 Percent of Entire MSA 26.91% Population in CC Percent Change in Population from 1999
SOUTH DAKOTA KIDS COUNT BEACOM SCHOOL OF BUSINESS UNIVERSITY OF SOUTH DAKOTA 414 E. CLARK STREET VERMILLION, SD
 Brookings County Compared to o SDSD Undergrad Enrollment approximately 11,225 o USD Undergrad Enrollment approximately 7,600 o Brookings County 1 year population estimate for 2013 is 32,968 o 1 year population
SDs from Regional Peer Group Mean. SDs from Size Peer Group Mean
 Family: Population Demographics Population Entire MSA 2414616 Central Cities (CC) 764431 Outside Central Cities 1650185 Percent of Entire MSA 31.66% Population in CC Percent Change in Population from 1999
2016 Labor Market Profile
 2016 Labor Market Profile Prepared by The Tyler Economic Development Council Tyler Area Sponsor June 2016 The ability to demonstrate a regions availability of talented workers has become a vital tool
Tyler Area Economic Overview
 Tyler Area Economic Overview Demographic Profile. 2 Unemployment Rate. 4 Wage Trends. 4 Cost of Living Index...... 5 Industry Clusters. 5 Occupation Snapshot. 6 Education Levels 7 Gross Domestic Product
ACS DEMOGRAPHIC AND HOUSING ESTIMATES American Community Survey 1-Year Estimates
 DP05 ACS DEMOGRAPHIC AND HOUSING ESTIMATES 2010 American Community Survey 1-Year s Supporting documentation on code lists, subject definitions, data accuracy, and statistical testing can be found on the
Economic Overview Charlotte-Concord-Gastonia, NC-SC MSA. October 27, 2017
 Economic Overview Charlotte-Concord-Gastonia, NC-SC MSA October 27, 2017 DEMOGRAPHIC PROFILE...3 EMPLOYMENT TRENDS...5 UNEMPLOYMENT RATE...5 WAGE TRENDS...6 COST OF LIVING INDEX...6 INDUSTRY SNAPSHOT...7
ACS DEMOGRAPHIC AND HOUSING ESTIMATES American Community Survey 1-Year Estimates
 DP05 ACS DEMOGRAPHIC AND HOUSING ESTIMATES 2012 American Community Survey 1-Year Estimates Supporting documentation on code lists, subject definitions, data accuracy, and statistical testing can be found
Independence, MO Data Profile 2015
 , MO Data Profile 2015 5 year American Community Survey (ACS) Jackson County, Missouri Data sources: U.S. Census Bureau, American Community Survey (ACS), 2011 2015 (released December 8, 2016), compared
APPENDIX 6: CENSUS DATA BURLINGTON, VERMONT
 APPENDIX 6: CENSUS DATA BURLINGTON, VERMONT 2000 CENSUS DATA 2005-2007 AMERICAN COMMUNITY SURVEY Burlington city, Vermont - Fact Sheet - American FactFinder Page 1 of 2 FACT SHEET Burlington
PROPOSED SHOPPING CENTER
 PROPOSED SHOPPING CENTER Southeast Corner I-95 & Highway 192 Melbourne, Florida In a 5 Mile Radius 80,862 Population 32,408 Households $61K Avg HH Income SOONER INVESTMENT Commercial & Investment Real
SELECTED ECONOMIC CHARACTERISTICS American Community Survey 5-Year Estimates
 DP03 SELECTED ECONOMIC CHARACTERISTICS 2008-2012 American Community Survey 5-Year Estimates Supporting documentation on code lists, subject definitions, data accuracy, and statistical testing can be found
American Community Survey 5-Year Estimates
 DP03 SELECTED ECONOMIC CHARACTERISTICS 2013-2017 American Community Survey 5-Year Estimates Supporting documentation on code lists, subject definitions, data accuracy, and statistical testing can be found
Tell us what you think. Provide feedback to help make American Community Survey data more useful for you.
 DP03 SELECTED ECONOMIC CHARACTERISTICS 2016 American Community Survey 1-Year Estimates Supporting documentation on code lists, subject definitions, data accuracy, and statistical testing can be found on
Rifle city Demographic and Economic Profile
 Rifle city Demographic and Economic Profile Community Quick Facts Population (2014) 9,289 Population Change 2010 to 2014 156 Place Median HH Income (ACS 10-14) $52,539 State Median HH Income (ACS 10-14)
American Community Survey 5-Year Estimates
 DP03 SELECTED ECONOMIC CHARACTERISTICS 2012-2016 American Community Survey 5-Year Estimates Supporting documentation on code lists, subject definitions, data accuracy, and statistical testing can be found
American Community Survey 5-Year Estimates
 DP03 SELECTED ECONOMIC CHARACTERISTICS 2012-2016 American Community Survey 5-Year Estimates Supporting documentation on code lists, subject definitions, data accuracy, and statistical testing can be found
American Community Survey 5-Year Estimates
 DP03 SELECTED ECONOMIC CHARACTERISTICS 2012-2016 American Community Survey 5-Year Estimates Supporting documentation on code lists, subject definitions, data accuracy, and statistical testing can be found
American Community Survey 5-Year Estimates
 DP03 SELECTED ECONOMIC CHARACTERISTICS 2012-2016 American Community Survey 5-Year Estimates Supporting documentation on code lists, subject definitions, data accuracy, and statistical testing can be found
American Community Survey 5-Year Estimates
 DP03 SELECTED ECONOMIC CHARACTERISTICS 2012-2016 American Community Survey 5-Year Estimates Supporting documentation on code lists, subject definitions, data accuracy, and statistical testing can be found
American Community Survey 5-Year Estimates
 DP03 SELECTED ECONOMIC CHARACTERISTICS 2012-2016 American Community Survey 5-Year Estimates Supporting documentation on code lists, subject definitions, data accuracy, and statistical testing can be found
American Community Survey 5-Year Estimates
 DP03 SELECTED ECONOMIC CHARACTERISTICS 2012-2016 American Community Survey 5-Year Estimates Supporting documentation on code lists, subject definitions, data accuracy, and statistical testing can be found
American Community Survey 5-Year Estimates
 DP03 SELECTED ECONOMIC CHARACTERISTICS 2012-2016 American Community Survey 5-Year Estimates Supporting documentation on code lists, subject definitions, data accuracy, and statistical testing can be found
American Community Survey 5-Year Estimates
 DP03 SELECTED ECONOMIC CHARACTERISTICS 2012-2016 American Community Survey 5-Year Estimates Supporting documentation on code lists, subject definitions, data accuracy, and statistical testing can be found
American Community Survey 5-Year Estimates
 DP03 SELECTED ECONOMIC CHARACTERISTICS 2012-2016 American Community Survey 5-Year Estimates Supporting documentation on code lists, subject definitions, data accuracy, and statistical testing can be found
American Community Survey 5-Year Estimates
 DP03 SELECTED ECONOMIC CHARACTERISTICS 2012-2016 American Community Survey 5-Year Estimates Supporting documentation on code lists, subject definitions, data accuracy, and statistical testing can be found
American Community Survey 5-Year Estimates
 DP03 SELECTED ECONOMIC CHARACTERISTICS 2012-2016 American Community Survey 5-Year Estimates Supporting documentation on code lists, subject definitions, data accuracy, and statistical testing can be found