Economic and Fiscal Update
|
|
|
- Scott Lindsey
- 6 years ago
- Views:
Transcription
1 Economic and Fiscal Update OCTOBER 2012 Donald J. Bruce, Professor Center for Business and Economic Research The University of Tennessee, Knoxville
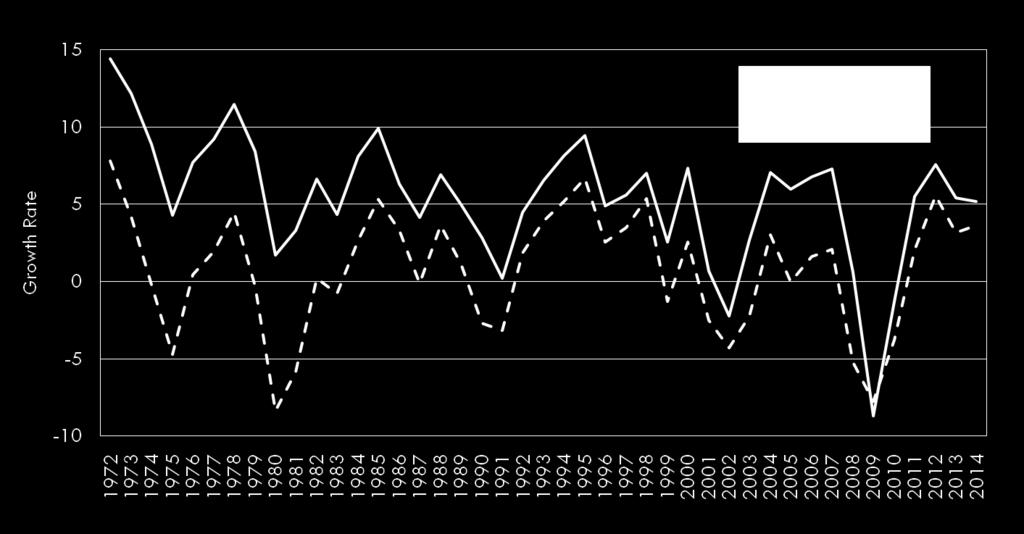
2 88Q2 89Q2 90Q2 91Q2 92Q2 93Q2 94Q2 95Q2 96Q2 97Q2 98Q2 99Q2 00Q2 01Q2 02Q2 03Q2 04Q2 05Q2 06Q2 07Q2 08Q2 09Q2 10Q2 11Q2 12Q2 Percent Change from Previous Quarter SAAR Growth in Quarterly Real Gross Domestic Product (Chained 2005 Dollars)
3 Risks to Economic Growth 3 Fiscal Cliff Collapse of EU or monetary union War in middle east or oil price spike Hard landing in China Housing falters again
4 Percenage change, SAAR Growth in Quarterly Real Personal Consumption Expenditures (Chained 2005 Dollars) Q2 89Q4 91Q2 92Q4 94Q2 95Q4 97Q2 98Q4 00Q2 01Q4 03Q2 04Q4 06Q2 07Q4 09Q2 10Q4 12Q2
5 Rate Interest Rates and Inflation Federal Funds Rate, % per annum Inflation, year over year Q1 02Q1 03Q1 04Q1 05Q1 06Q1 07Q1 08Q1 09Q1 10Q1 11Q1 12Q1
6 Percentage change, year over year Inflation Will Remain Subdued CPI-All Items CPI-Core (excl. food & energy) PPI-Industrial Commodities Source: IHS Global Insight, Inc.
7 Unit Sales of New Light Vehicles Housing Starts (in millions) Unit Sales of New Light Vehicles and Housing Starts Unit Sales Of New Light Vehicles Housing Starts (in millions)
8 Percentage change, annual rate U.S. Nonresidential Fixed Investment in Equipment & Software and Structures Equip & Software Structures Source: IHS Global Insight, Inc.
9 Percentage Change from Prev Qtr, Annual Rate Growth in Quarterly Real Private Residential Fixed Investment and Housing Starts (Chained 2005 Dollars) Residential Fixed Investment Housing Starts Q2 90Q2 92Q2 94Q2 96Q2 98Q2 00Q2 02Q2 04Q2 06Q2 08Q2 10Q2 12Q2
10 Number of units in thousands U.S. Building Permits Stuck in the Trough 10 2,500 2,000 Total Permits Total Starts Single-Family Permits Single-Family Starts 1,500 1, Source: U.S. Census Bureau and IHS Global Insight, Inc.
11 Number of units Tennessee Building Permits Poised for Rebound 11 5,000 4,500 4,000 3,500 Total Single-family 3,000 2,500 2,000 1,500 1, Jan- 05 Jul- 05 Jan- 06 Jul- 06 Jan- 07 Jul- 07 Jan- 08 Jul- 08 Jan- 09 Jul- 09 Jan- 10 Jul- 10 Jan- 11 Jul- 11 Jan- 12 Jul- 12 Source: U.S. Census Bureau, Building Permits Survey (as reported in the State of the Cities Data System [SOCDS] database).
12 Exchange rate Exports - Imports, Billions of Chained 2005 Dollars 12 U.S./Euro Foreign Exchange Rate and Real Exports Less Imports U.S./Euro Foreign Exchange Rate Exports less Imports Q1 00Q1 01Q1 02Q1 03Q1 04Q1 05Q1 06Q1 07Q1 08Q1 09Q1 10Q1 11Q1 12Q1
13 Billions of dollars Unified Federal Budget Surplus Fiscal Year
14 Fiscal Cliff 14 Sequestration Elimination of extended unemployment benefits Expiration of Bush tax cuts Elimination of payroll tax decrease Alternative minimum tax
15 Sep-94 Sep-95 Sep-96 Sep-97 Sep-98 Sep-99 Sep-00 Sep-01 Sep-02 Sep-03 Sep-04 Sep-05 Sep-06 Sep-07 Sep-08 Sep-09 Sep-10 Sep-11 Sep-12 Rate 15 Tennessee and U.S. Unemployment Rates (seasonally adjusted) U.S. TN Source: Bureau of Labor Statistics.
16 Index, month #1 = Tennessee Employment Doing Worse than Any Other Modern Business Cycle Nov 1980 Jan 1990 Jul 2001 Mar 2007 Dec Number of months from recession start month Note: Total nonfarm employment seasonally adjusted data indexed to the beginning month of each recession. Source: Calculated by CBER using data from the Bureau of Labor Statistics; and CBER-UT.
17 Sep-94 Sep-95 Sep-96 Sep-97 Sep-98 Sep-99 Sep-00 Sep-01 Sep-02 Sep-03 Sep-04 Sep-05 Sep-06 Sep-07 Sep-08 Sep-09 Sep-10 Sep-11 Sep-12 Percentage change, same month last year Tennessee and U.S. Employment Growth (seasonally adjusted) % 4.0% 2.0% U.S. TN 0.0% -2.0% -4.0% -6.0% -8.0% Source: Bureau of Labor Statistics.
18 Tennessee Job Growth by Sector (August 2012 over August 2011) 18 Mining, Logging, and Construction Durable Goods Education and Health Services Government Non-Durable Goods Leisure and Hospitality Total Private Other Services Professional and Business Services Trade, Transportation, and Utilities Information Financial Activities -3.0% -2.0% -1.0% 0.0% 1.0% 2.0% 3.0% 4.0% 5.0% 6.0% 7.0% Growth Rate
19 Nonfarm Employment Growth, Tennessee MSAs (August 2012 over August 2011) 19 Clarksville, TN-KY Knoxville, TN Jackson, TN Memphis, TN-MS-AR Kings-Bristol-Bristol, TN-VA Cleveland, TN Chattanooga, TN-GA TN Johnson City, TN Nash-Davidson-Murf-Franklin, TN Morristown, TN 0.0% 0.5% 1.0% 1.5% 2.0% 2.5% Growth Rate
20 Nonfarm Employment Growth, Tennessee MSAs (2 nd Quarter 2012 over 2 nd Quarter 2011 ) 20 Knoxville, TN Clarksville, TN-KY Jackson, TN Memphis, TN-MS-AR TN Johnson City, TN Nash-Davidson-Murf-Franklin, TN Chattanooga, TN-GA Cleveland, TN Kings-Bristol-Bristol, TN-VA Morristown, TN -4.0% -3.0% -2.0% -1.0% 0.0% 1.0% 2.0% 3.0% Growth Rate
21 TN as % of US Tennessee Per Capita Personal Income As a Percentage of U.S., % 92% 91% 90% 89% 88% 87% 86% 85% 84% 83% 82%

22 Growth in Adjusted Tax Collections,
 Greater than 6.6% ( 16 ) Source: Center for Business and Economic Research, http://cber.bus.utk.")
23 Change in Total Taxes July-March, FY2011 to FY U.S. = 4.5% 7.4% Less than 3.0% ( 18 ) 3.0% to 6.6% ( 16 ) Greater than 6.6% ( 16 ) Source: Center for Business and Economic Research,

24 Tax Revenues (in millions) Tennessee Tax Revenues, Total and as a Share of Personal Income, As a percentage of personal income, tax revenues are at historical lows

")
25 Growth in Sales Tax Revenue (Adjusted for Tax Increases) (3- month moving average) 25
")
26 Sales Tax Collections by Category of Sales (Quarter Ending July 2012) 26
27 U.S. Forecast Summary 27 Slow GDP growth of just under 2% Stable consumption growth and residential investment alongside slower business investment and net exports Continued low inflation under 2% Slow housing recovery picks up steam Fueled by continued low interest rates Sluggish labor market High unemployment (8%) and low job growth (<2%) Federal deficit/debt paralysis
28 Tennessee Forecast Summary 28 Non-farm employment growth of 1.4% Continued gains in manufacturing Keeping pace with the national forecast Slow decline in unemployment to 8.1% Slightly above the national rate throughout Personal income growth of 4.2% Faster than national income growth Taxable sales growth of 2.2% Down somewhat from recent high growth

29 Center for Business & Economic Research 29 College of Business Administration The University of Tennessee, Knoxville 716 Stokely Management Center 916 Volunteer Boulevard Knoxville, Tennessee phone: fax:
Economic Update. Don Bruce Research Professor Boyd Center for Business and Economic Research. January 2019
 Economic Update Don Bruce Research Professor Boyd Center for Business and Economic Research January 2019 January 2019 http://cber.haslam.utk.edu/erg/erg2019.pdf http://cber.haslam.utk.edu/ 2 National Economy
David A Penn, Director and Associate Professor Business and Economic Research Center Jones College of Business Middle Tennessee State University
 David A Penn, Director and Associate Professor Business and Economic Research Center Jones College of Business Middle Tennessee State University David.Penn@mtsu.edu www.mtsu.edu/berc National Economic
TENNESSEE HOUSING MARKET
 3rd Quarter 21 TENNESSEE HOUSING MARKET David A. Penn, Director Business and Economic Research Center Jennings A. Jones College of Business Middle Tennessee State University This quarterly series is supported
Ahmad Ijaz Center for Business and Economic Research Culverhouse College of Commerce The University of Alabama
 US Economic Outlook Ahmad Ijaz Center for Business and Economic Research Culverhouse College of Commerce The University of Alabama Composite Can and Tube Institute Annual Meeting Point Clear, Alabama May
AN ECONOMIC REPORT TO THE GOVERNOR OF THE STATE OF TENNESSEE
 AN ECONOMIC REPORT TO THE GOVERNOR OF THE STATE OF TENNESSEE Matthew N. Murray, Associate Director and Project Director Center for Business and Economic Research PREPARED BY THE Center for Business and
Housingmarket. Tennessee. 2nd Quarter Business and Economic Research Center David Penn, Ph.D., Associate Professor, Economics
 Tennessee Housingmarket 2nd Quarter 214 Business and Economic Research Center David Penn, Ph.D., Associate Professor, Economics Supported by Tennessee Housing Development Agency Economic Overview ennessee
TENNESSEE HOUSING MARKET
 2nd Quarter 21 TENNESSEE HOUSING MARKET David A. Penn, Director Business and Economic Research Center Jennings A. Jones College of Business Middle Tennessee State University This quarterly series is supported
TENNESSEE BUSINESS AND ECONOMIC OUTLOOK
 TENNESSEE BUSINESS AND ECONOMIC OUTLOOK THE STATE S ECONOMIC OUTLOOK SPRING2013 TENNESSEE BUSINESS AND ECONOMIC OUTLOOK Matthew N. Murray, Associate Director and Project Director Center for Business and
Arkansas Economic Outlook
 Arkansas Economic Forecast Conference 2011 Arkansas Economic Outlook Dr. Michael Pakko Chief Economist and State Economic Forecaster Institute for Economic Advancement, UALR November 2, 2011 Arkansas Experience
3rd Quarter Weekly Unemployment Claims Total Home Permits* Total Nonfarm Employment* Mortgage Tax Collections -5.
 HOUSING T E N N E S S E E 3rd Quarter 2018 Tennessee dashboard 3rd quarter 2018 (percent change over the year) Weekly Unemployment Claims -12.81 Total Home Permits* +2.67 Total Nonfarm Employment* +1.62
AN ECONOMIC REPORT TO THE GOVERNOR OF THE STATE OF TENNESSEE
 AN ECONOMIC REPORT TO THE GOVERNOR OF THE STATE OF TENNESSEE Matthew N. Murray, Associate Director and Project Director Center for Business and Economic Research PREPARED BY THE Center for Business and
Single-family home sales and construction are not expected to regain 2005 peaks
 Single-family home sales and construction are not expected to regain 25 peaks Millions of units 8. 7. 6. 5. Housing starts (right axis) 4. Home sales (left axis) 3. 2. 1. 198 1985 199 1995 2 25 21 215
The President s Report to the Board of Directors
 The President s Report to the Board of Directors April 4, 214 Current Economic Developments - April 4, 214 Data released since your last Directors' meeting show the economy was a bit stronger in the fourth
TENNESSEE BUSINESS AND ECONOMIC OUTLOOK
 TENNESSEE BUSINESS AND ECONOMIC OUTLOOK THE STATE S ECONOMIC OUTLOOK SPRING2014 TENNESSEE BUSINESS AND ECONOMIC OUTLOOK Matthew N. Murray, Associate Director and Project Director Center for Business and
1st Quarter Weekly Unemployment Claims -11% Total Home Permits* +44% Total Nonfarm Employment* +3% Mortgage Tax Collections +17%
 HOUSING T E N N E S S E E 1st Quarter 2016 Tennessee dashboard 1st quarter 2016 (percent change over the year) Weekly Unemployment Claims -11% Total Home Permits* +44% Total Nonfarm Employment* +3% Mortgage
 4th Quarter 211 TENNESSEE HOUSING MARKET David A. Penn, Director Business and Economic Research Center Jennings A. Jones College of Business Middle Tennessee State University This quarterly series is supported
August 2004 Index as of October
 T O T E N N E S S E E SAAR 10.0 7.5 5.0 2.5 0.0-2.5-5.0-7.5-10.0 E N N E S S E E FIGURE 1 Monthly Percentage Change in the Tennessee Leading Index (seasonally adjusted at annual rates) 6.4 Mar-04 0.4 Apr-04
Decline in Economic Activity Larger Than Advance GDP Estimate February 27, 2009
 Northern Trust Global Economic Research 5 South LaSalle Chicago, Illinois 663 northerntrust.com Asha G. Bangalore agb3@ntrs.com Decline in Economic Activity Larger Than Advance GDP Estimate February 27,
After falling last month, the Tennessee
 T O T E N N E S S E E SAAR 10.0 7.5 5.0 2.5 0.0-2.5-5.0-7.5-10.0 E N N E S S E E E C O N O M I C V E R V I E W September 2004 Index as of November 2004 FIGURE 1 Monthly Percentage Change in the Tennessee
Old Dominion University 2013 National Economic Outlook
 Old Dominion University 2013 National Economic Outlook January 30, 2013 Professor Vinod Agarwal Professor Mohammad Najand Professor Gary A. Wagner www.odu.edu/forecasting 1 Presentation Outline 2012 Scorecard
Alison Felix Economist & Branch Executive Federal Reserve Bank of Kansas City Denver Branch
 New Mexico Economic Update Alison Felix Economist & Branch Executive Federal Reserve Bank of Kansas City Denver Branch New Mexico employment growth slowed sharply over the past few months. PAYROLL EMPLOYMENT
Outlook for the Texas Economy. Luis Bernardo Torres Ruiz, Ph.D. August 26, 2016
 Outlook for the Texas Economy Luis Bernardo Torres Ruiz, Ph.D. August 26, 2016 Research Economist Texas Society of Architects Contents 1. U.S. Economic Outlook 2. Texas Economic Outlook 3. Challenges and
4th Quarter Weekly Unemployment Claims Total Home Permits* Total Nonfarm Employment* Mortgage Tax Collections -4.
 HOUSING T E N N E S S E E 4th Quarter 2017 Tennessee dashboard 4th quarter 2017 (percent change over the year) Weekly Unemployment Claims -12.27 Total Home Permits* -1.00 Total Nonfarm Employment* +1.17
U.S. Economic Update and Outlook. Laurel Graefe, REIN Director Federal Reserve Bank of Atlanta October 2, 2013
 1 U.S. Economic Update and Outlook Laurel Graefe, REIN Director Federal Reserve Bank of Atlanta October 2, 213 Following the deepest recession since the 193s, the economic recovery is well under way, though
The relatively slow growth of employment has
 NationalEconomicTrends August Please go to researchstlouisfedorg/publications/net for important information about your subscription Labor s Share The relatively slow growth of employment has been a prominent
The Arkansas Economic Outlook Focus on Hot Springs
 The Arkansas Economic Outlook Focus on Hot Springs Dr. Michael Pakko Chief Economist and State Economic Forecaster Institute for Economic Advancement, UALR Regional Economic Forecast Hot Springs December
On October 4, 2006, President Bush signed the
 NationalEconomicTrends December Political Economy of State Homeland Security Grants On October,, President Bush signed the Department of Homeland Security (DHS) Appro pri - ations Act for fiscal year 7
Data Digest: Mississippi. August 2013
 Data Digest: Mississippi August 2013 Mississippi s economic activity measure has increased to levels last seen in mid-2008. About the Coincident Economic Indicator Jan 2001 = 100 120 Coincident Economic
The chorus from Travis s 1947 song about the
 NationalEconomicTrends December 7 What Do You Get for Sixteen Tons? You load sixteen tons, and what do you get? Another day older and deeper in debt Merle Travis The chorus from Travis s 197 song about
The Outlook for the U.S. and Washington Area Economies In 2013 and Beyond
 Boland Open House The Outlook for the U.S. and Washington Area Economies In 213 and Beyond Stephen S. Fuller, Ph.D. Dwight Schar Faculty Chair and University Professor Director, Center for Regional Analysis
Texas Economic Outlook: Strong Growth Continues
 Texas Economic Outlook: Strong Growth Continues Keith Phillips Assistant Vice President and Senior Economist 1/23/18 The views expressed in this presentation are strictly those of the presenter and do
The Federal Reserve, Monetary Policy, and Economic Indicators
 The Federal Reserve, Monetary Policy, and Economic Indicators Megan Williams Associate Economist Federal Reserve Bank of Kansas City, Oklahoma City Branch The Creation of the Fed The first two national
THDA STIMULUS SECOND MORTGAGE PROGRAM REPORT
 January, 2011 STIMULUS SECOND MORTGE PROAM REPORT Hulya Arik, Ph.D., Research Coordinator DIVISION OF RESEARCH, PLANNING & TECHNICAL SERVICES Tennessee Housing Development Agency 404 James Robertson Parkway,
EMBARGOED UNTIL MARCH 2, 2011
 Outlook FORECAST: 2011-2015 March 2011 BUREAU OF BUSINESS AND ECONOMIC RESEARCH COLLEGE OF BUSINESS AND ECONOMICS WEST VIRGINIA UNIVERSITY www.bber.wvu.edu Executive Summary The Morgantown metropolitan
There has been considerable discussion of the possibility
 NationalEconomicTrends February Housing and the R Word There has been considerable discussion of the possibility that ongoing troubles in the housing market could push the economy into recession 1 But
The Federal Reserve has set the target range for the federal
 NationalEconomicTrends October Monetary Policy Stance: The View from Consumption Spending The Federal Reserve has set the target range for the federal funds at to 5 percent and intends to keep this near
RECESSION AND RECOVERY IN NEBRASKA AND THE U.S.
 RECESSION AND RECOVERY IN NEBRASKA AND THE U.S. Alison Felix Senior Economist Federal Reserve Bank of Kansas City The views expressed are those of the presenter and do not necessarily reflect the positions
The Arkansas Economic Outlook
 The Arkansas Economic Outlook Dr. Michael Pakko Chief Economist and State Economic Forecaster Arkansas Economic Development Institute, UALR December 1, 2017 Overview Review of Economic Conditions: Output
Zions Bank Economic Overview
 Zions Bank Economic Overview Utah League of Cities and Towns June 18, 2018 Utah Economic Conditions CA 0.6% OR 1.4% WA 1.7% NV 2.0% Utah Population 3 rd Fastest Growing in U.S. ID 2.2% UT 1.9% AZ 1.6%
TENNESSEE BUSINESS AND ECONOMIC OUTLOOK
 TENNESSEE BUSINESS AND ECONOMIC OUTLOOK FALL2013 THE STATE S ECONOMIC OUTLOOK TENNESSEE BUSINESS AND ECONOMIC OUTLOOK Matthew N. Murray, Associate Director and Project Director Center for Business and
The U.S. Economy s Current Performance and Outlook
 Delta Associates Spring Seminar The U.S. and Washington Area Economies: Current Performance and Outlook: 24-29 Stephen S. Fuller, Ph.D. Dwight Schar Faculty Chair and University Professor Director, Center
U.S. Economy and Financial Markets
 U.S. Economy and Financial Markets Economic Growth and Output Business Income and Finance Business Inventory Business Investment Consumption Housing Investment Income and Savings U.S. Aggregate Demand
2018 Texas Economic Outlook: Firing on All Cylinders
 218 Texas Economic Outlook: Firing on All Cylinders Keith Phillips Assistant Vice President and Senior Economist 4/5/218 The views expressed in this presentation are strictly those of the presenter and
With the tax filing season in full swing, these summary
 NationalEconomicTrends March Income Taxes: Who Pays and How Much? With the tax filing season in full swing, these summary figures may provide some perspective on the issue of who is paying federal individual
TENNESSEE BUSINESS AND ECONOMIC OUTLOOK
 TENNESSEE BUSINESS AND ECONOMIC OUTLOOK The State s Economic Outlook Fall 2009 TENNESSEE BUSINESS AND ECONOMIC OUTLOOK Matthew N. Murray, Associate Director and Project Director Center for Business and
Nonfarm Payroll Employment
 PRESIDENT'S REPORT TO THE BOARD OF DIRECTORS, FEDERAL RESERVE BANK OF BOSTON Current Economic Developments - June 10, 2004 Data released since your last Directors' meeting show the economy continues to
United States. GDP Growth Annualized Percentage Change. Industrial Production Annualized Percentage Change
 Output Indicators GDP Growth Annualized Percentage Change Industrial Production Annualized Percentage Change 0 2 4 6 2.3-5 0 5 4.5 GDP Growth Industrial Production 1.0 1.5 2.0 2.5 3.0 3.5 4.0 2.9-4 -2
The U.S. Economy s Current Performance and Outlook
 /3/4 Board of Directors, Northern Virginia Association of Realtors The Current Economic Outlook & Area Housing Market Conditions Stephen S. Fuller, Ph.D. Dwight Schar Faculty Chair and University Professor
Zions Bank Salt Lake Northeast Region Officers Mee8ng Economic Overview. July 28, 2016
 Zions Bank Salt Lake Northeast Region Officers Mee8ng Economic Overview July 28, 2016 National Economic Conditions Readings on the U.S. economy since the turn of the year have been somewhat mixed. - Janet
Mississippi s Business Monitoring The State s Economy
 Mississippi s Business January 2012 Monitoring The State s Economy ECONOMY AT A GLANCE Volume 70 - Number 1 A Publication of the University Research Center, Mississippi Institutions of Higher Learning
Texas Mid-Year Economic Outlook: Strong Growth Continues
 Texas Mid-Year Economic Outlook: Strong Growth Continues Keith Phillips Assistant Vice President and Senior Economist 9/27/18 The views expressed in this presentation are strictly those of the presenter
Plunging Oil Prices: Impact on the U.S. and State Economies
 Plunging Oil Prices: Impact on the U.S. and State Economies Mine Yücel Senior Vice President and Director of Research November 17, 216 Nominal price, weekly 16 14 Oil and gas prices volatile 12 1 Oil price
Zions Bank Economic Overview
 Zions Bank Economic Overview Jackson Hole Mountain Resort March 20, 2018 National Economic Conditions When Good News is Bad News Is Good News?? Dow Tops 26,000 Up 44% Since 2016 Election Source: Wall Street
ctrends Nominal Vs. Real Wage Growth Growth of Wages Percent Change From Year Ago August 1997
 ctrends August 1997 Nominal Vs. Real Wage Growth Nominal wages, measured by nonfarm compensation per hour, grew at an average annual rate of 5.5 percent between 1947 and 1973 and 6 percent between 1973
2012 As the Fundamentals Improve Stateside, They Deteriorate Abroad
 N O R T H E R N T R U S T G L O B A L E C O N O M I C R E S E A R C H 212 As the Fundamentals Improve Stateside, They Deteriorate Abroad December 211 Paul L. Kasriel, Chief Economist PH: 312..15 plk1@ntrs.com
Since the financial crisis began in mid-2007, media
 NationalEconomicTrends August Commercial Bank Lending Data during the Crisis: Handle with Care Since the financial crisis began in mid-7, media sources and academics alike have scrutinized data from the
TENNESSEE BUSINESS AND ECONOMIC OUTLOOK
 TENNESSEE BUSINESS AND ECONOMIC OUTLOOK The State s Economic Outlook Fall2010 TENNESSEE BUSINESS AND ECONOMIC OUTLOOK Matthew N. Murray, Associate Director and Project Director Center for Business and
Zions Bank Economic Overview
 Zions Bank Economic Overview Utah Institute of Real Estate Management Economic Summit September 12, 2017 National Economic Conditions August Job Indicators Indicator Expectation Actual Total Nonfarm Payrolls
Data current as of: August 5, ,200,000 1,000, , , , , , , , , , , ,000
 Forecast Version: Spring 216 Economic Indicators The Bureau of Labor Statistics reported a total nonfarm payroll employment increase of 287, in June with the unemployment rate rising.2% to 4.9%. The jobs
In 2010, the first of the Baby Boom generation will
 NationalEconomicTrends September 7 Can Social Security Survive the Baby Boomers? In 1, the first of the Baby Boom generation will reach age Many will choose to begin what they hope will be a long and financially
Uinta Basin Energy Summit Economic Overview September 10, 2015
 Uinta Basin Energy Summit Economic Overview September 10, 2015 Overview National Economic Conditions Utah Economic Conditions Utah is One of the Fastest Growing CA States in the Country Percent Change
House prices in the United States were 14.1 percent
 NationalEconomicTrends August How Much Have US House Prices Fallen? House prices in the United States were 11 percent lower in the first quarter of than they were a year earlier, according to a widely
Economic Highlights. ISM Purchasing Managers Index 1. Sixth District Payroll Employment by Industry 2. Contributions to Real GDP Growth 3
 December 1, 2010 Economic Highlights Manufacturing ISM Purchasing Managers Index 1 Employment Sixth District Payroll Employment by Industry 2 Economic Activity Contributions to Real GDP Growth 3 Prices
NationalEconomicTrends
 NationalEconomicTrends January 00 Stag-nations Economic growth in the United States has slowed substantially since the days of rapid expansion during the mid to late 1990s. According to preliminary estimates,
Western New York ECONOMIC NEWS Canisius College Richard J. Wehle School of Business
 Western New York ECONOMIC NEWS Canisius College Richard J. Wehle School of Business Volume 20, Number 1 January 2017 The BEA earnings report, which has historically served as the basis for our projection
ECONOMIC AND FINANCIAL HIGHLIGHTS
 ECONOMIC AND FINANCIAL HIGHLIGHTS LABOR MARKET Contributions to Change in Nonfarm Payrolls 2 Unemployment and Labor Force Participation Rate 3 MANUFACTURING ISM Manufacturing Index 4 CONSUMERS Light Vehicle
National and Virginia Economic Outlook
 National and Virginia Economic Outlook Association of Electric Cooperatives September 29, 215 Sonya Ravindranath Waddell Regional Economist Research Department The views and opinions expressed herein are
In the past three decades, the share of foreign-born
 NationalEconomicTrends June New Views on Immigration In the past three decades, the share of foreign-born workers in US total employment has increased markedly, from percent in 197 to 1 percent in Among
Old Dominion University 2016 Regional Economic Forecast. Strome College of Business
 Old Dominion University 2016 Regional Economic Forecast January 27, 2016 Professor Vinod Agarwal Director, Economic Forecasting Project Strome College of Business www.odu.edu/forecasting 1 Presentation
Current Employment Statistics
 Current Employment Statistics October 2017 If you have any questions or seek additional information, please contact: Vermont Department of Labor Economic and Labor Market Information Division 802-828-4202
Employment in Central Oregon: January, 2015
 FOR IMMEDIATE RELEASE: March 10, 2015 CONTACT INFORMATION: Damon Runberg, Regional Economist Damon.M.Runberg@oregon.gov (541) 388-6442 Employment in Central Oregon: January, 2015 Central Oregon finished
Ontario Economic Accounts
 SECOND QUARTER OF 2017 April, May, June Ontario Economic Accounts ONTARIO MINISTRY OF FINANCE Table of Contents ECONOMIC ACCOUNTS Highlights 1 Ontario s Economy Continues to Grow Expenditure Details 2
Current Employment Statistics
 Current Employment Statistics December 2017 If you have any questions or seek additional information, please contact: Vermont Department of Labor Economic and Labor Market Information Division 802-828-4202
The U.S. Economic Outlook
 The U.S. Economic Outlook Gering/Scottsbluff Economic Forum August 23, 216 George A. Kahn Vice President and Economist The views expressed are those of the author and do not necessarily reflect the opinions
e c o n o m i c o u t l o o k Fall 2007 Center for Business and Economic Research
 tennessee business and e c o n o m i c o u t l o o k Fall 2007 Center for Business and Economic Research tennessee business and e c o n o m i c o u t l o o k Center for Business and Economic Research Center
Individual households and firms, as well as local, state,
 NationalEconomicTrends February 9 How Accu Are Forecasts in a Recession? Individual households and firms, as well as local, state, and federal governments, make economic decisions based on their view of
CALHOUN COUNTY CHAMBER OF COMMERCE AND VISITORS CENTER
 2017 Economic Forum CALHOUN COUNTY CHAMBER OF COMMERCE AND VISITORS CENTER Information provided by School of Business and Industry THANK YOU to our SPONSORS Calhoun County Economy Forum National Update
The Changing Revenue Landscape
 The Changing Revenue Landscape NCSL Legislative Summit, 2018 July 30, 2018 Lucy Dadayan July 30, 2018 Lucy Dadayan State Revenue Trends and Volatility TCJA, South Dakota vs. Wayfair, Sports Betting Overview
Outlook for the Economy & Construction
 Outlook for the Economy & Construction UALR Economic Outlook Conference Little Rock, November 2, 2011 Ken Simonson Chief Economist, Associated General Contractors of America 2011 12 VP, National Association
QUARTERLY FINANCIAL REPORT
 QUARTERLY FINANCIAL REPORT Page Key Trends... 2 Executive Summary... 3 Economic Indicators... 4 General Fund... 8 Public Safety & Justice... 10 Land Use, Housing & Transportation... 11 Health & Human Services...
QUARTERLY FINANCIAL REPORT
 QUARTERLY FINANCIAL REPORT Page Key Trends...2 Executive Summary...3 Economic Indicators...4 General Fund...8 Public Safety & Justice...10 Land Use, Housing & Transportation...11 Health & Human Services...14
CBER Economic Indexes for Nevada and Southern Nevada
 CBER Economic Indexes for Nevada and Southern Nevada Published December 19, 2017 Stephen M. Miller, PhD, Director Nicolas Prada, M.A., Graduate Research Assistant Summary of CBER s Nevada Indexes Coincident
Economic Outlook and Forecast 2015
 Economic Outlook and Forecast 2015 Prince William County Fe b r u ar y 17, 2 0 15 Overview National growth Labor market improving but still weaknesses GDP growth expected to remain moderate Next 2 years
Economic Indicators For Manufacturing Executives
 Economic Indicators For Manufacturing Executives Valuable Data for a Complex World Presented by: Cliff Waldman Chief Economist, MAPI Foundation cwaldman@mapi.net Today s Presentation The Value of Economic
Understanding the New Trump Economy Economic Overview. November 15, 2016
 Understanding the New Trump Economy Economic Overview November 15, 2016 Uncertainty at the Na@onal and Interna@onal Level Source: Bureau of Labor Statistics The Trump Bump Why? National Job Growth 500
Old Dominion University 2017 Regional Economic Forecast. Strome College of Business
 Old Dominion University 2017 Regional Economic Forecast January 25, 2017 Professor Vinod Agarwal Director, Economic Forecasting Project Strome College of Business www.odu.edu/forecasting The views expressed
The effect that housing has on the economy has received
 NationalEconomicTrends May Boom & Gloom in Housing Markets: The Sequel The effect that housing has on the economy has received increased attention in recent years first for the recordhigh boom in house
Sharp declines in home prices, followed by a financial
 NationalEconomicTrends April Household Retrenchment Sharp declines in home prices, followed by a financial crisis and a steep recession, rattled US households in Economic misfortunes have caused many to
The Outlook for the U.S. Economy March Summary View. The Current State of the Economy
 The Outlook for the U.S. Economy March 2010 Summary View The Current State of the Economy 8% 6% Quarterly Change (SAAR) Chart 1. The Economic Outlook History Forecast The December 2007-2009 recession is
NationalEconomicTrends
 NationalEconomicTrends January 000 The Economic Outlook for 000: Bulls on Parade? The heartening U.S. economic performance during the past four years has seemingly benefited everyone except those in the
Key Labor Market and Economic Metrics
 Key Labor Market and Economic Metrics May Update Incorporates Data Available on May 27 th, 2016 This reference is the result of a collaboration between the Bureau of Labor Market Information and Strategic
SAME/ACEC June Conference. The Outlook for the U.S. and Washington Area Economies In 2013 and Beyond
 6/24/23 SAME/ACEC June Conference The Outlook for the U.S. and Washington Area Economies In 23 and Beyond Stephen S. Fuller, Ph.D. Dwight Schar Faculty Chair and University Professor Director, Center for
The U.S. and California Is The Recovery Here at Last? UCLA Anderson School of
 The U.S. and California Is The Recovery Here at Last? Jerry Nickelsburg Senior Economist UCLA Anderson Forecast State of the County January 20, 2010 SEPTEMBER 2008 In September 2008 Financial Markets Stopped
Mississippi s Business Monitoring The State s Economy
 Mississippi s Business September 2012 Monitoring The State s Economy ECONOMY AT A GLANCE Volume 70 - Number 8 A Publication of the University Research Center, Mississippi Institutions of Higher Learning
United States. Gross Domestic Product Percent change over year-ago level. Industrial Production Index, 2010=100. Unemployment Rate Percent
 United States Summary Indicators Gross Domestic Product Percent change over year-ago level Industrial Production Index, 2010=100 1.0 1.5 2.0 2.5 3.0 3.5 4.0 2.5 108 110 112 114 114.9 4.0 4.5 5.0 5.5 6.0
State of Ohio Workforce. 2 nd Quarter
 To Strengthen Ohio s Families through the Delivery of Integrated Solutions to Temporary Challenges State of Ohio Workforce 2 nd Quarter 2 0 1 2 Quarterly Report on the State of Ohio s Workforce Reference
U.S. Chamber of Commerce Economic Outlook
 U.S. Chamber of Commerce Economic Outlook December 211 Economic Policy Division Real GDP Outlook Percent Change, Annual Rate 2 1 1 - -1 197 197 198 198 199 199 2 2 21 U.S. GDP Actual and Potential Quarterly,
The next recession will not be. The Great Recession. Damon Runberg, Economist Oregon Employment Department
 The next recession will not be The Great Recession Damon Runberg, Economist Oregon Employment Department Why the fears? Simplified Business Cycle Peak 2 consecutive quarters of GDP declines Wages Rise
CRA Roundtable August 19, Megan Williams
 CRA Roundtable August 19, 214 Megan Williams Associate Economist and Manager, Oklahoma City Branch Federal Reserve Bank of Kansas City www.kansascityfed.org/oklahomacity The U.S. Economy and Monetary Policy
Texas Economic Outlook: Cruising in Third Gear
 Texas Economic Outlook: Cruising in Third Gear Keith Phillips Assistant Vice President and Senior Economist 1/19/17 The views expressed in this presentation are strictly those of the presenter and do not