The Forecasting in a Windstorm webinar will begin shortly.
|
|
|
- Nigel Beasley
- 5 years ago
- Views:
Transcription

1 The Forecasting in a Windstorm webinar will begin shortly. If you need technical assistance with the webcast or streaming audio, contact us at hsmai@commpartners.com and we will assist you immediately. 1 hsmai.org
 2 hsmai.")
2 Forecasting in a Windstorm Tuesday, February 3 rd, :00 3:00 PM EDT Hospitality Sales and Marketing Association International (HSMAI) 2 hsmai.org

3 Overview of Format and Topic Moderator Barb Taylor Carpender, CMM, CHSC Managing Director, HSMAI University 3 hsmai.org


4 HSMAI University Alliance Partner 4 hsmai.org

5 HSMAI University Alliance Partner 5 hsmai.org

6 POLL QUESTION #1 How many people are participating in this webinar at your location today? or more 6 hsmai.org
7 Today s s Presenters Jan D. Freitag Vice President, Global Development SMITH TRAVEL RESEARCH jan@smithtravelresearch.com R. Mark Woodworth President PKF International mark.woodworth@pkfc.com 7 hsmai.org
8 US LODGING INDUSTRY OVERVIEW Jan D. Freitag Vice President 8 hsmai.org
9 Thoughts about ALIS Fear and Loathing in San Diego transient demand, (is) a downward death spiral JP Morgan JP Morgan miserable 2009 management guidance RevPAR still a falling knife Baird Deutsche Bank 9
10 160 Total United States Estimated Revenue and Profitability Years Revenue Income Continually Profitable 2009 Smith Travel Research, Inc. 10
11 Total US Room Rates Actual vs Inflation Adjusted If year 2000 ADR had increased by CPI each year Nominal ADR Yr 2000, Grown by CPI It took 6 years to recover from Rate Reductions in Smith Travel Research, Inc. 11
12 12 Total US Overview
13 Total United States Room Supply/Demand Percent Change Twelve Month Moving Average 1989 to December Supply % Change Demand % Change Building Into The Downturn 2009 Smith Travel Research, Inc. 13
14 Total United States Room Demand/Occ/ADR Percent Change Twelve Month Moving Average 1989 to December ADR % Chg Demand % Change Occ % Chg % -1.6% -4.2% Focus on Demand Not Occupancy 2009 Smith Travel Research, Inc. 14
15 Total United States Hotel Rooms Sold vs. ADR Change Quarterly Change 1988 to Q Demand % Chg ADR % CHG q1 1991q1 1994q1 1997q1 2000q1 2003q1 2006q Yield Management Amplifies The Pain 2009 Smith Travel Research, Inc. 15
16 Total United States Key Performance Indicators Percent Change December YTD Supply Demand Occupancy ADR RevPAR -4.2 YE Results Mask The Deterioration of Fundamentals 2009 Smith Travel Research, Inc. 16
17 Total United States Key Performance Indicators Percent Change 2008 First 8 Months vs. Last 4 Months Jan-Aug Sept-Dec Supply Demand Occupancy ADR RevPAR A Tale of 2 Seasons 2009 Smith Travel Research, Inc. 17
18 Total United States Demand Percent Change Day of Week 2008 First 8 Months vs. Last 4 Months Jan-Aug Sept-Dec Sun Mon Tue Wed Thu Fri Sat Sunday / Thursday / Saturday Are Slowing Smith Travel Research, Inc. 18
19 Total United States ADR Percent Change Day of Week 2008 First 8 Months vs. Last 4 Months Jan-Aug Sept-Dec Sun Mon Tue Wed Thu Fri Sat Weekend Rates Are Deteriorating 2009 Smith Travel Research, Inc. 19
20 20 Chain Scales
21 Total United States Demand Percent Change Chain Scale 2008 First 8 Months vs. Last 4 Months Total US Luxury Upper Upscale -0.4 Jan-Aug Sept-Dec Upscale Mid W Mid W/O Economy High End Demand is Falling 2009 Smith Travel Research, Inc. 21
22 Total United States ADR Percent Change Chain Scale 2008 First 8 Months vs. Last 4 Months Total US Luxury Upper Upscale Jan-Aug Sept-Dec Upscale Mid W Mid W/O Economy Midscale Hotels Maintain Rate 2009 Smith Travel Research, Inc. 22
23 Increasing Occupancy and ADR Chain Scales Percent of Properties Year End rd & 4 th Quarters YE Q Q Luxury Upper Upscale Upscale Mid With Mid W/O Economy 14 Only 7 Luxury Hotels Increased ADR & OCC 2009 Smith Travel Research, Inc. 23
24 Declining Occupancy and ADR Chain Scales Percent of Properties Year End rd & 4 th Quarters YE Q Q Luxury 2.2 Upper Upscale Upscale Mid With Mid W/O Economy Most Properties See Falling ADR & OCC 2009 Smith Travel Research, Inc. 24
25 25 Major Markets
26 Key 10 Global Markets ADR Percent Change (Local Currency) December 2008 YTD Chicago, IL New York, NY Phoenix, AZ San Diego, CA 2.0 San Francisco/San Mateo, CA 5.4 Top 25 US Markets All Other US Markets Berlin Hong Kong SAR Dubai London 4.4 Rio de Janeiro Sluggish Global Rate Growth 2009 Smith Travel Research, Inc. 26
27 Key 10 Global Markets Occupancy Percent Change December 2008 YTD Chicago, IL New York, NY Phoenix, AZ San Diego, CA -4.7 San Francisco/San Mateo, CA -0.1 Top 25 US Markets All Other US Markets Berlin -2.1 Hong Kong SAR -3.7 Dubai -5.2 London -1.6 Rio de Janeiro Global OCC Declines 2009 Smith Travel Research, Inc. 27
28 Total US vs. Resort Locations Demand Percent Change Twelve Month Moving Average 2005 to December Total US Demand Resort Demand Resort Demand Drops Faster / More Steeply 2009 Smith Travel Research, Inc. 28

29 U.S. Lodging Industry Projections As of January
30 Total US Industry Consecutive Quarterly Declines Key Indicators 1990/ /2002 Current Room Demand Occupancy Average Daily Rate RevPAR Room Revenue Smith Travel Research, Inc.
31 Total United States Active Development Pipeline Thousand of Rooms Change From Last Year Phase December 2008 December 2007 % Change In Construction % Final Planning % Planning % Active Pipeline % Pre-Planning % Total % Source: STR / TWR / Dodge Construction Pipeline 31 Under Construction Pipeline Is Shrinking
32 Total United States Abandoned Rooms Year-over-year percent change 90% 70% 70% 75% 56% 50% 30% 31% 34% 10% 16% 17% Jun-08 Jul-08 Aug-08 Sep-08 Oct-08 Nov-08 Dec-08 Source: STR / TWR / Dodge Construction Pipeline 32 Rate of Abandonment is Increasing
33 5 4 Total United States Supply/Demand Percent Change P 4.0 Supply % Chg Demand % Chg P 2010P 20 Yr Average 2009 Smith Travel Research, Inc. 33
34 Total United States Occupancy Percent Change P Year Average: -0.4% P 2010P 2009 Smith Travel Research, Inc. 34
35 Total United States Occupancy Percent P P 2010P 2009 Smith Travel Research, Inc. 35
36 Total United States ADR Percent Change P Year Average: 3.5% P 2010P 2009 Smith Travel Research, Inc. 36
37 Total United States RevPAR Percent Change P Year Average: 3.4% P 2010P 2009 Smith Travel Research, Inc. 37
38 110 Total US Room Rates Actual vs Inflation Adjusted If year 2000 ADR had increased by CPI each year Nominal ADR Yr 2000, Grown by CPI It took 6 years to recover from Rate Reductions in
39 Turning Points When will the Lodging Industry Grow Again? R. Mark Woodworth PKF Hospitality Research Atlanta, Georgia 39
40 Turning Points When will the lodging industry grow again? What is a Turning Point? That point at which period to period change begins a sustained directional shift. Key Questions: When will they occur? What will we see along the way? Are we about to chart new territory, or have we seen this before? Word for the day: Protracted 40
41 Outline Turning Points: When will the lodging industry grow again? The Economy Profit Outlook Asset Values Takeaways 41
42 The Economy Profit Outlook Asset Values Takeaways 42


43 Total Payroll Employment in a Long Contraction Source: Moody's Economy.com 43


44 Remember the Jobless Recovery? Long Run Employment Levels 16 Qtrs 15 Qtrs Forecast 10 Qtrs 9 Qtrs Beginning / End of Contraction Period Turning Point Source: Moody's Economy.com 44


45 Monthly Unemployment Rate Forecast Local Maxima Source: Moody's Economy.com 45


46 Monthly Inflation Rate This hasn t happened since 1954 Oil explains much of the volatility Forecast Local Maxima / Minima Source: Moody's Economy.com 46
47 47 Have We Seen This Before?


48 Current Recession Much Longer than Last Two More than Half Is Behind Us: Q209 Source: PKF Hospitality Research, Smith Travel Research, Dr. Edward Leamer, UCLA 48


49 Turning Points: Distance from Beginning of Official NBER Recession (Quarters) Source: Moody's Economy.com 49
50 Recovery Timelines Mixed Across Markets Quarters Until Employment Levels Turn Positive 4Q08 Growth Positive 1 Quarter 2 Quarters 3 Quarters > 4 Quarters Source: Moody's Economy.com 50
51 How Much Worse Will It Be? Many Markets Will Realize Record Declines Single Worst Quarter Employment Forecast vs. History < -1% -1% - 0% 0% - 1% 1% - 2% > 2% Source: Moody's Economy.com 51

52 I guess he was right! 52


53 Loan Delinquencies Increase Pain Will Escalate into Late 2010 Source: PKF Hospitality Research, Moody s Economy.com 53

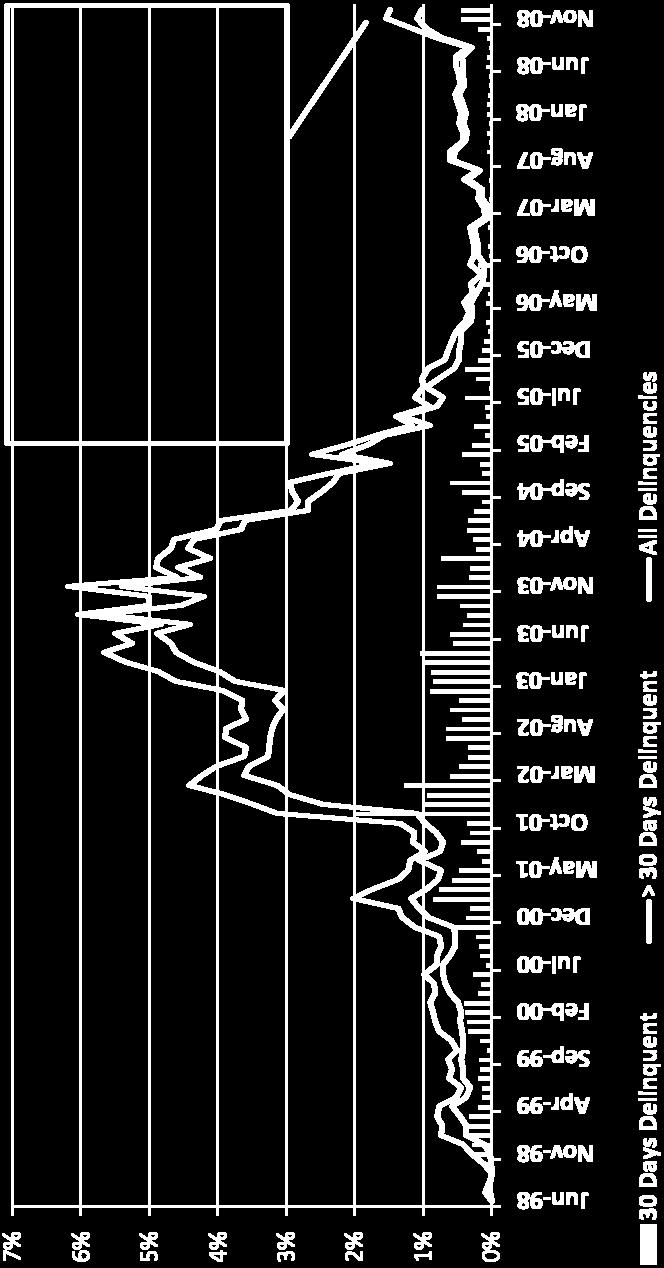


54 Hotel CMBS Delinquency Rate Source: Trepp, LLC 54
55 The Economy Profit Outlook Asset Values Takeaways 55


56 Protracted Disconnect Between Property Cycle and Business Cycle Forecast Source: PKF Hospitality Research, Smith Travel Research Cycle Disconnect 56


57 Protracted Declines Lead to Record Low Occupancy in 2009 Forecast Source: PKF Hospitality Research, Smith Travel Research 57


58 Weak Occupancy Postpones ADR Growth Until 2Q 2010 Forecast Source: PKF Hospitality Research, Smith Travel Research 58


59 High ADR Changes Fuel NOI Swings Forecast THIS IS A MODERN RECORD Source: PKF Hospitality Research, Smith Travel Research 59


60 Number of Markets with Declining Year over Year Quarterly Demand, Occupancy Source: PKF Hospitality Research Turning Point 60


61 Local Market Outlook Varies Considerably Number of Quarters Until RevPAR Change Turns Positive 2 Quarters 3 Quarters 4 Quarters 5 Quarters 6 Quarters 7 Quarters 8 Quarters Among our 50 market universe, only New Orleans is expected to achieve growth in RevPAR in 2009 Record low occupancies in 17 of our 50 market universe in Source: PKF Hospitality Research 61
62 The Economy Profit Outlook Takeaways Asset Values 62


63 63 Where are Cap Rates Going?


64 Forecast Spreads Above LRA But Below 2Q 2003 Peak Source: PKF Hospitality Research, Moody s Economy.com, Real Estate Research Corporation 64
65 Forecasts of Return Components Cap Rates Exploding Up 210 bps by Year Treasury Treasury Spread % NOI Cap Rate % 4.0% 15.5% 8.3% % 3.8% 13.3% 8.1% % 3.0% 7.2% 7.6% 2008E 3.7% 4.1% -1.7% 7.8% 2009F 3.6% 5.2% -18.8% 8.8% 2010F 4.8% 4.9% 0.0% 9.7% Source: PKF Hospitality Research, RERC, Moody s Economy.com 65


66 Cumulative Value Decline Falls Short of Experience Factors Influencing Value of Upper Priced Hotels Note: Cap Rate Influence = Change In Value Change In NOI (after reserve) Source: PKF Hospitality Research, Real Estate Research Corporation 66


67 U.S. Hotel Industry The Last Time Change In Select Unit Level Revenues And Profits* Note: * Before deductions for capital reserve, rent, interest, income taxes, depreciation, and amortization. Source: PKF Hospitality Research 67


68 U.S. Hotel Industry The Last Time Change In Select Unit Level Expenses Note: * Before deductions for capital reserve, rent, interest, income taxes, depreciation, and amortization. Source: PKF Hospitality Research 68


69 Change In Unit Level Marketing Department Expenditures* Note: * Does not include franchise related fees and assessments. Sample of properties that reported marketing payroll. Source: PKF Hospitality Research 69


70 Increased Payroll Spending Composition Of Unit Level Marketing Department Expenditures* Note: * Does not include franchise related fees and assessments. Sample of properties that reported marketing payroll. Source: PKF Hospitality Research 70
71 The Economy Profit Outlook Asset Values Takeaways 71


72 A Longer Journey This Time Number of Quarters from Beginning of Official NBER Recession Until Turning Point *Until supply falls below its LRA Source: PKF Hospitality Research 72
73 Nothing Looks Normal Supply Up Demand Down: Big RevPAR Declines in = the Low Point Going Forward = Below/Above Long Run Average Long Term Average E 2009F 2010F Supply 1.9% 0.4% 0.1% 0.2% 1.3% 2.7% % Demand 1.9% 4.0% 2.8% 0.5% 1.0% 1.4% 2.8% 1.3% Occupancy 62.8% 61.3% 63.1% 63.3% 63.1% 60.5% 57.2% 57.4% ADR 3.5% 4.2% 5.5% 7.5% 6.1% 2.4% 4.6% 1.0% 73 RevPAR 3.5% 7.9% 8.5% 7.8% 5.7% 1.7% 9.8% 1.3% Source: PKF Hospitality Research Preliminary Fourth Quarter 2008 Hotel Horizons SM Report, Smith Travel Research
74 74 Hotels on the Watch List
75 Impact of Revenue Declines on NOI Depends on Where You Start Low and High Occupancy Hotels Hotels with Occupancy Greater than 70% Hotels with Occupancy Less than 70% Note: * After capital reserve expense and before rent, interest, income taxes, and amortization. Source: PKF Hospitality Research 75


76 Negative Impact on Debt Service Coverage Capability is Significant Resulting Debt Coverage Ratio Source: PKF Hospitality Research 76
77 Final Thoughts Nothing really new ahead, although all that is bad about this phase of the cycle is protracted in nature. NOI and asset value declines are big but not unprecedented owners and lenders will still experience significant stress. The Turning Point: consensus view is mid All expenses will continue to be scrutinized marketing no exception. Non labor related areas were cut the most last time around. 77


78 Questions? Jan D. Freitag Vice President, Global Development SMITH TRAVEL RESEARCH R. Mark Woodworth President PKF International 78 hsmai.org
79 Upcoming HSMAI University Programs 3 rd Annual Hotel Sales Strategy Conference March 31 st, Swissotel Chicago Managing Business Results/Managing Revenue March 2 nd - March 6 th Location: Johnson & Wales University-Denver CHBA Certified in Hospitality Business Acumen Driving Revenue Through Successful Public Relations Tuesday, February 10 th Presenters are HSMAI Lifetime Achievement Award, the Winthrop W. Grice Award in Public Relations Evolving Travel Intentions Tuesday, February 17 th Peter Yesawich, Ph.D., President & CEO, Y Partnership Internet Marketing Series Thursday, February 26 th and Tuesday, March 3 rd Getting Your Message Across With An Integrated Marketing Strategy All webinars are 2:00 3:00 p.m. EST 79 hsmai.org

80 Evaluation Please take a moment now to click on the Evaluation link in the LINKS box and complete the evaluation. Be sure to click on Submit when you have completed the evaluation to send us your responses. Your comments & suggestions are very important to us, and they help us to provide you with quality programming. 80 hsmai.org
May 18, 2011 U.S. Lodging Industry Overview
 May 18, 2011 U.S. Lodging Industry Overview Accelerating success. Prepared for: Economic Forecasting Center Georgia State University by R. Mark Woodworth PKF Hospitality Research Questions We Have Been
March 7, 2011 U.S. Lodging Industry Overview Prepared for the. Hunter Investment Conference
 March 7, 2011 U.S. Lodging Industry Overview Prepared for the Hunter Investment Conference R. Mark Woodworth PKF Hospitality Research Accelerating success. Good and Getting Better 1. The economy. 2. Lodging
US Hotel Industry Overview. Chris Crenshaw
 US Hotel Industry Overview Chris Crenshaw ccrenshaw@str.com July 2014 (12 MMA): All Signs Point To A Sellers Market % Change Room Supply* 1.8 bn 0.8% Room Demand* 1.1 bn 3.4% Occupancy 63 % 2.6% A.D.R.*
What Lies Ahead? Georgia State University. Wednesday, May 14, 2008
 U.S. Lodging Horizon 2008 What Lies Ahead? Economic Forecasting Center Georgia State University Wednesday, May 14, 2008 Mark.Woodworth@pkfc.com com Presentation Outline I. The Economy II. Current Horizon:
European & UK Hotel Performance
 European & UK Hotel Performance Trend Analysis by STR Global Naureen Ahmed Manager, Marketing & Analysis RMAPI Conference, London 7 th November 2013 Agenda Global Snapshot Europe Overview UK Focus Outlook
History Shaping the Future: Presentation Title
 History Shaping the Future: Presentation Title Benchmarking and Performance Trends in the Hotel Sector for Strategic Decision Making Subtitle Elizabeth Randall Winkle Managing Director, STR Global Date
Lee County Tourist Development Council
 Lee County Tourist Development Council April 11 th, 2019 Emmy Hise Senior Consultant, Consulting & Analytics ehise@str.com 2019 STR, Inc. All Rights Reserved. Any reprint, use or republication of all or
REITs - Lodging. The Lodging Chartbook: June edition. Industry Overview
 US Equity Research June 16 Ryan Meliker Analyst Canaccord Genuity Inc. (US) rmeliker@canaccordgenuity.com 1.389.894 Michael Kodesch Associate Canaccord Genuity Inc. (US) mkodesch@canaccordgenuity.com 1-389-895
Publicly Registered Non-Traded Real Estate Investment Trust. Q Investor Presentation
 Publicly Registered Non-Traded Real Estate Investment Trust Q4 2015 Investor Presentation INVESTMENT STRATEGY Hospitality Trust seeks to provide: Capital Preservation Capital Appreciation Hospitality Trust
Ireland Revenue Forum
 Ireland Revenue Forum 27 th June 2017 Sarah Duignan Director, Client Relationships sduignan@str.com @SarahDuignanSTR 2016 STR, Inc. All Rights Reserved. Any reprint, use or republication of all or a part
HOTEL CONTINUES ON A POSITIVE TRACK TRENDS FOR DEMAND AND ADR REMAIN SOLID, BUT COMING DELIVERIES REMAIN A CONCERN
 HOTEL MARKET REPORT: 3Q2013 HOTEL CONTINUES ON A POSITIVE TRACK TRENDS FOR DEMAND AND ADR REMAIN SOLID, BUT COMING DELIVERIES REMAIN A CONCERN DEMAND: Although the pace is slowing, room night demand growth
Investor Presentation. September 2011
 Investor Presentation September 2011 Safe Harbor In keeping with the SEC s Safe Harbor guidelines, certain statements made during this presentation could be considered forward-looking and subject to certain
SAMPLE PULSE REPORT. For the month of: February 2013 STR # Date Created: April 02, 2013
 STR Analytics 4940 Pearl East Circle Suite 103 Boulder, CO 80301 Phone: +1 (303) 396-1641 Fax: +1 (303) 449 6587 www.stranalytics.com PULSE REPORT For the month of: February 2013 STR # Date Created: April
Hospitality Directions US Hospitality and Leisure
 January 2012 Q4 Hospitality Directions US Hospitality and Leisure At a glance The economy accelerated in the fourth quarter, and occupancy gains exceeded expectations. However, economic growth is expected
ECONOMIC OUTLOOK AND THE US LODGING INDUSTRY. Aran Ryan Director Tourism
 ECONOMIC OUTLOOK AND THE US LODGING INDUSTRY Aran Ryan Director aran.ryan@tourismeconomics.com @AranRyan1 March 22, 2017 Some historical perspective Room demand expansion continues Pace of demand growth
Decline in Economic Activity Larger Than Advance GDP Estimate February 27, 2009
 Northern Trust Global Economic Research 5 South LaSalle Chicago, Illinois 663 northerntrust.com Asha G. Bangalore agb3@ntrs.com Decline in Economic Activity Larger Than Advance GDP Estimate February 27,
Housing and Mortgage Market Update
 Housing and Mortgage Market Update VCU Real Estate Trends Conference October 14, 29 Amy Crews Cutts, PhD Deputy Chief Economist Recession Risks Still Elevated, Housing Contraction Ongoing Recession risks
CRE Capital Markets Update Amid Renewed Financial Instability and Fear of a Global Recession
 CRE Capital Markets Update Amid Renewed Financial Instability and Fear of a Global Recession presented to: Center for Real Estate and Urban Economic Studies Jim Clayton, Ph.D. Vice President Research Cornerstone
Company Presentation December 2011
 Company Presentation December 2011 Stifel Nicolaus had no involvement in the preparation of this presentation and, accordingly, makes no representation or warranty as to the accuracy or completeness of
Research. Hotels: Start of an Extended Recovery? Pramerica Real Estate Investors. Executive Summary
 Pramerica Real Estate Investors Hotels: Start of an Extended Recovery? September 2010 Research Paul Fiorilla Vice President U.S. Office Tel 973.734.1501 paul.fiorilla@prudential.com Pramerica Real Estate
THE CONFERENCE BOARD LEADING ECONOMIC INDEX (LEI) FOR GERMANY AND RELATED COMPOSITE ECONOMIC INDEXES FOR JANUARY
 FOR GERMANY AND RELATED COMPOSITE ECONOMIC INDEXES FOR JANUARY") FOR RELEASE: 10:00 A.M. (BERLIN TIME), WEDNESDAY, MARCH 24, 2010 The Conference Board Germany Business Cycle Indicators SM THE CONFERENCE BOARD LEADING ECONOMIC INDEX (LEI) FOR GERMANY AND RELATED COMPOSITE
FOR RELEASE: 10:00 A.M. (BERLIN TIME), WEDNESDAY, MARCH 24, 2010 The Conference Board Germany Business Cycle Indicators SM THE CONFERENCE BOARD LEADING ECONOMIC INDEX (LEI) FOR GERMANY AND RELATED COMPOSITE
Was it all for N 0 u g h t? The 00 Decade and the Year Ahead. Tony Pierson Cornerstone Real Estate Advisers LLC. Real Estate Conference
 Disclaimer This presentation is not intended to be and does not constitute investment advice. This is provided as an accommodation and shall not be relied upon as investment advice. This presentation includes
Budgeted in General Fund $ 83,177, % $ 94,421, % Budgeted outside of the General Fund 59,944, % 48,699,
 Hotel Room Tax Description The Hotel Room Tax (or transient occupancy tax ) is a 14 percent tax levied on hotel room charges. The tax is collected by hotel operators from guests and remitted to the Treasurer/Tax
US Hotel Value Gains Moderate as RevPAR Growth Slows and Cap Rates Rise
 US Hotel Value Gains Moderate as RevPAR Growth Slows and Cap Rates Rise January 23, 2017 By Suzanne R. Mellen Hotel investment activity experienced a bumpy ride in 2016. With a slowdown in RevPAR growth,
Embargoed until 30 November :45am CT
 Contact: Jack L Bishop Jr PhD Kingsbury International, Ltd. 245 Ridge Road Highland Park, IL 635 Phone 847 831-477 Fax 847 831-2846 email: napmc@kingbiz.com http://www.kingbiz.com Press Release Embargoed
STATE OF THE REAL ESTATE MARKET FALL Robert J. Strachota MAI, MCBA, CRE, FIBA 35 th Annual Real Estate Institute November 2, 2017 CLE
 STATE OF THE REAL ESTATE MARKET FALL 2017 Robert J. Strachota MAI, MCBA, CRE, FIBA 35 th Annual Real Estate Institute November 2, 2017 CLE 1 Ladies and gentlemen, you are the jury for the state of the
Bank of Ireland Hotel Sector Briefing
 Bank of Ireland Hotel Sector Briefing 29 th November 2018 Sarah Duignan Director, Client Relationships sduignan@str.com 2018 STR, Inc. All Rights Reserved. Any reprint, use or republication of all or a
Paul Sommers Seattle University February 2009
 The Economy and the Regional Construction Market Paul Sommers Seattle University February 2009 Employment falling, financial market chaos continues Extraordinary policy measures taken by both the Fed and
GENERAL FUND REVENUE & ECONOMIC OUTLOOK. January 20, 2009 Fiscal Research Division Barry Boardman, Ph.D.
 GENERAL FUND REVENUE & ECONOMIC OUTLOOK January 20, 2009 Fiscal Research Division Barry Boardman, Ph.D. Highlights The recession deepens pushing general fund collections well below forecast target. Now
CALHOUN COUNTY CHAMBER OF COMMERCE AND VISITORS CENTER
 2017 Economic Forum CALHOUN COUNTY CHAMBER OF COMMERCE AND VISITORS CENTER Information provided by School of Business and Industry THANK YOU to our SPONSORS Calhoun County Economy Forum National Update
Credit, Housing, Commodities and the Economy Chartered Financial Analysts Institute Annual Conference
 Credit, Housing, Commodities and the Economy Chartered Financial Analysts Institute Annual Conference May 13, 2008 Janet L. Yellen President and CEO Federal Reserve Bank of San Francisco Overview Financial
U.S. Lodging Industry Update. Are You Tired of Being at the Peak?
 U.S. Lodging Industry Update Question for Jan: Are You Tired of Being at the Peak? R. Mark Woodworth CBRE Hotels Americas Research March 23, 2017 Bright Horizons.. Dusty Dawns.. U.S. Lodging Industry Update
GENERAL FUND REVENUE & ECONOMIC OUTLOOK. December 18, 2008 Fiscal Research Division Barry Boardman, Ph.D.
 GENERAL FUND REVENUE & ECONOMIC OUTLOOK December 18, 2008 Fiscal Research Division Barry Boardman, Ph.D. Highlights As the recession deepens, economy-based taxes push general fund collections below forecast
HIT REIT Quarterly Investor Presentation April 26, American Realty Capital Hospitality Trust, Inc.
 HIT REIT Quarterly Investor Presentation April 26, 2018 American Realty Capital Hospitality Trust, Inc. Risk Factors Risk Factors Investing in our common stock involves a degree of risk. See the section
U.S. and New England Economic Conditions and Outlook
 U.S. and New England Economic Conditions and Outlook Yolanda Kodrzycki Senior Economist and Policy Advisor charts prepared by Ana Patricia Muñoz presented to New England Board of Higher Education conference
Economic History of the US
 Economic History of the US Pax Americana, 1946 to the Financial Crisis of 2008 Lecture #5 Peter Allen Econ 120 1 Since Sept. 2008 1. Worst Recession since WWII 2. Banking Crisis, Panic of 08 First since
QUARTERLY FINANCIAL REPORT
 QUARTERLY FINANCIAL REPORT Page Key Trends... 2 Executive Summary... 3 Economic Indicators... 4 General Fund... 8 Public Safety & Justice... 10 Land Use, Housing & Transportation... 11 Health & Human Services...
The Conference Board U.S. Business Cycle Indicators SM U.S. LEADING ECONOMIC INDICATORS AND RELATED COMPOSITE INDEXES FOR APRIL 2008
 Brussels Copenhagen Frankfurt Hong Kong London Mexico City New Delhi Ottawa New York Chicago San Francisco Washington FOR RELEASE: 10:00 A.M. ET, MONDAY, May 19, 2008 The Conference Board U.S. Business
XML Publisher Balance Sheet Vision Operations (USA) Feb-02
 Feb-02") Page:1 Apr-01 May-01 Jun-01 Jul-01 ASSETS Current Assets Cash and Short Term Investments 15,862,304 51,998,607 9,198,226 Accounts Receivable - Net of Allowance 2,560,786
Page:1 Apr-01 May-01 Jun-01 Jul-01 ASSETS Current Assets Cash and Short Term Investments 15,862,304 51,998,607 9,198,226 Accounts Receivable - Net of Allowance 2,560,786
Commercial Real Estate Outlook June Must Own Property Names to Buy During Interest Rate Fears
 Jonathan Litt Founder & CEO Must Own Property Names to Buy During Interest Rate Fears REITs have sold off 9.5% since their peak in mid-may on fears of rising interest rates. Historically, sell-offs related
The Conference Board U.S. Business Cycle Indicators SM U.S. LEADING ECONOMIC INDICATORS AND RELATED COMPOSITE INDEXES FOR JULY 2008
 Brussels Copenhagen Frankfurt Hong Kong London Mexico City New Delhi Ottawa New York Chicago San Francisco Washington FOR RELEASE: 10:00 A.M. ET, Thursday, August 21, 2008 The Conference Board U.S. Business
The Conference Board U.S. Business Cycle Indicators SM U.S. LEADING ECONOMIC INDICATORS AND RELATED COMPOSITE INDEXES FOR JANUARY 2008
 Brussels Copenhagen Frankfurt Hong Kong London Mexico City New Delhi Ottawa New York Chicago San Francisco Washington FOR RELEASE: 10:00 A.M. ET, THURSDAY, February 21, 2008 The Conference Board U.S. Business
After the Rate Increase, What Then?
 After the Rate Increase, What Then? Robert Eisenbeis, Ph.D. Vice Chairman & Chief Monetary Economist Bob.Eisenbeis@Cumber.com What the FOMC Did At Dec Meeting The Fed made the first step towards normalization
2008 RESULTS. Radisson Ambassador Hotel Paris Opéra
 2008 RESULTS Radisson Ambassador Hotel Paris Opéra 11 FEBRUARY 2009 BRUSSELS Kurt Ritter, President & CEO Knut Kleiven, Deputy President & CFO Puneet Chhatwal, Chief Development Officer 1 Dec-08 Apr-08
China Lodging Group, Limited Reports Second Quarter of 2014 Results
 August 11, 2014 China Lodging Group, Limited Reports Second Quarter of 2014 s As of 2014, the Company had a total of 1,669 hotels or 179,186 hotel rooms in operation and 505 leased and manachised hotels
December Employment Report: Further Deterioration of Labor Market Conditions January 9, 2009
 Northern Trust Global Economic Research 50 South LaSalle Chicago, Illinois 60603 northerntrust.com Asha G. Bangalore agb3@ntrs.com December Employment Report: Further Deterioration of Labor Market Conditions
The Conference Board U.S. Business Cycle Indicators SM U.S. LEADING ECONOMIC INDICATORS AND RELATED COMPOSITE INDEXES FOR NOVEMBER 2007
 Brussels Copenhagen Frankfurt Hong Kong London Mexico City New Delhi Ottawa New York Chicago San Francisco Washington FOR RELEASE: 10:00 A.M. ET, THURSDAY, December 20, 2007 The Conference Board U.S. Business
Hotel Transactions in the New Economy
 Hotel Transactions in the New Economy Hank Wolpert hank.wolpert@colliers.com 214.538.6637 The Hotel Market Cycle Moving Along the Road to Recovery Equilibrium ADR Rapid Development Lodging Decline, Leads
Report on the Economic Crisis: Initial Impact on Hospitals
 Report on the Economic Crisis: Initial Impact on Hospitals November 2008 Executive Summary The capital crunch is making it difficult and expensive for hospitals to finance facility and technology needs.
US Real Estate Summary
 US Real Estate Summary Edition 3, 218 Consumer and business optimism is high in the US. 2 Commercial real estate 5 Property types 6 Viewpoint UBS Asset Management US Real Estate Summary September 218 Commercial
The Conference Board Korea Business Cycle Indicators SM KOREA LEADING ECONOMIC INDICATORS AND RELATED COMPOSITE INDEXES FOR JULY 2005
 Brussels Copenhagen Frankfurt Hong Kong London Mexico City New Delhi Ottawa New York Chicago San Francisco Washington FOR RELEASE: 9:00 P.M. ET, TUESDAY, SEPTEMBER 13, 2005 The Conference Board Korea Business
Town Council and Vail Economic Advisory Council. Ralf Garrison, DestiMetrics. Date: December 16, Mountain Travel Market Update I.
 To: From: Town Council and Vail Economic Advisory Council Ralf Garrison, DestiMetrics Date: December 16, 2014 Subject: Mountain Travel Market Update I. BACKGROUND Ralf Garrison will give an update on market
ECONversations. Economic and Policy Briefing Webcast Dave Altig, Research Director November 19, :00 p.m. ET
 ECONversations Economic and Policy Briefing Webcast Dave Altig, Research Director November 9, 4 : p.m. ET Questions for Dave: events@atl.frb.org Technical issues: james.dooley@atl.frb.org Information received
Hotel Values in Transition An Appraisal Technique for These Uncertain Times
 Hotel Values in Transition An Appraisal Technique for These Uncertain Times Suzanne R. Mellen, CRE, MAI, FRICS Managing Director HVS San Francisco & HVS Gaming Services Las Vegas HVS SAN FRANCISCO 116
9 November 2018 AUSTRALIAN ECONOMIC DEVELOPMENTS
 9 November 2018 AUSTRALIAN ECONOMIC DEVELOPMENTS This week the Reserve Bank of Australia (RBA) left the cash rate at a record low of 1.50%. The RBA expects inflation and wages to accelerate gradually from
The U.S. and California Is The Recovery Here at Last? UCLA Anderson School of
 The U.S. and California Is The Recovery Here at Last? Jerry Nickelsburg Senior Economist UCLA Anderson Forecast State of the County January 20, 2010 SEPTEMBER 2008 In September 2008 Financial Markets Stopped
2017 Portfolio Enhancements
 2017 Portfolio Enhancements October 2017 Hyatt Regency Scottsdale Resort & Spa at Gainey Ranch Scottsdale, AZ Royal Palms Resort & Spa Phoenix, AZ The Ritz-Carlton Pentagon City Arlington, VA Hyatt Regency
Q RESULTS AMSTERDAM, 23 JULY 2014 WOLFGANG M. NEUMANN, PRESIDENT & CEO KNUT KLEIVEN, DEPUTY PRESIDENT & CFO. Radisson Blu Hotel, Amsterdam
 Q2 2014 RESULTS AMSTERDAM, 23 JULY 2014 WOLFGANG M. NEUMANN, PRESIDENT & CEO KNUT KLEIVEN, DEPUTY PRESIDENT & CFO Radisson Blu Hotel, Amsterdam Timing of Easter and special events negatively impact Q2
Office of the Chief Economist National Credit Union Administration. Economic Overview. California State Examiner School.
 Office of the Chief Economist National Credit Union Administration California State Examiner School May 30, 2017 Credit Union Performance Trends Recent Data About Credit Union Performance in California,
RLH Corporation Reports Fourth Quarter 2017 Results
 RLH Corporation Reports Fourth Quarter 2017 Results March 28, 2018 DENVER, March 28, 2018 (GLOBE NEWSWIRE) -- Red Lion Hotels Corporation (the Company ) (NYSE:RLH), a growing hospitality company doing
The Conference Board U.S. Business Cycle Indicators SM U.S. LEADING ECONOMIC INDICATORS AND RELATED COMPOSITE INDEXES FOR MAY 2007
 Brussels Copenhagen Frankfurt Hong Kong London Mexico City New Delhi Ottawa New York Chicago San Francisco Washington FOR RELEASE: 10:00 A.M. ET, THURSDAY, JUNE 21, 2007 The Conference Board U.S. Business
SURVEY OF MARKET PARTICIPANTS JANUARY 2019
 SURVEY OF MARKET PARTICIPANTS JANUARY 2019 This survey is formulated by the Trading Desk at the Federal Reserve Bank of New York to enhance policymakers' understanding of market expectations on a variety
GENERAL FUND REVENUE & ECONOMIC OUTLOOK. October 17, 2008
 GENERAL FUND REVENUE & ECONOMIC OUTLOOK October 17, 2008 Highlights Downward economic trends in the economy continue to effect economy-based taxes such as the sales tax and personal income withholding
Economic and Revenue Update
 Economic and Revenue Update A Briefing for the Money Committees Aubrey L. Layne, Jr. Secretary of Finance Commonwealth of Virginia www.finance.virginia.gov January 2018 Topics for Discussion National and
Emerging Trends in the Regional Economy
 Emerging Trends in the Regional Economy Alison Felix Economist & Branch Executive Federal Reserve Bank of Kansas City Denver Branch The views expressed are those of the presenter and do not necessarily
China Lodging Group, Limited Reports Fourth Quarter and Full Year 2017 Financial Results
 March 13, 2018 China Lodging Group, Limited Reports Fourth Quarter and Full Year 2017 Financial s A total of 3,746 hotels or 379,675 hotel rooms in operation as of December 31, 2017. Net revenues increased
The Economic Backdrop When will this cycle end?
 The Economic Backdrop When will this cycle end? How far are we into the current economic expansion? Current expansion in 8 th year; 4 th longest since 1960 Length of economic expansions (months) Apr-91-Feb-01
Metropolitan Area Statistics (4Q 2012)
") Metropolitan Area Statistics (4Q 2012) Apartment Completions 4Q 2011 4Q 2012 % Chg. Atlanta 490 288-41% Boston 678 995 47% Chicago 506 711 41% Cleveland 4 13 225% Columbus 255 322 26% Dallas-Ft. Worth
Metropolitan Area Statistics (4Q 2012) Apartment Completions 4Q 2011 4Q 2012 % Chg. Atlanta 490 288-41% Boston 678 995 47% Chicago 506 711 41% Cleveland 4 13 225% Columbus 255 322 26% Dallas-Ft. Worth
City of Modesto Economic Indicators December 2014 Edition
 City of Modesto Economic Indicators December 2014 Edition Steve Christensen City of Modesto Economic Outlook: City of Modesto The City of Modesto continues to slowly recover from the Great Recession. Some
SmallBizU WORKSHEET 1: REQUIRED START-UP FUNDS. Online elearning Classroom. Item Required Amount ($) Fixed Assets. 1 -Buildings $ 2 -Land $
 Fixed Assets. 1 -Buildings $ 2 -Land $") WORKSHEET 1: REQUIRED START-UP FUNDS Item Required Amount () Fixed Assets 1 -Buildings 2 -Land 3 -Initial Inventory 4 -Equipment 5 -Furniture and Fixtures 6 -Vehicles 7 Total Fixed Assets Working Capital
WORKSHEET 1: REQUIRED START-UP FUNDS Item Required Amount () Fixed Assets 1 -Buildings 2 -Land 3 -Initial Inventory 4 -Equipment 5 -Furniture and Fixtures 6 -Vehicles 7 Total Fixed Assets Working Capital
Spotlight: The Economic Cycle. April 30, 2018
 Spotlight: The Economic Cycle April 30, 2018 History of recessions This is not a barcode! Although the U.S. has had 48 recessions since 1785, they are becoming shorter and less frequent In 1913, the Federal
China Lodging Group, Limited Reports First Quarter of 2010 Financial Results
 Contact Information Ida Yu Investor Relations Manager Tel: 86 (21) 5153 9463 Email: ir@htinns.com http://ir.htinns.com China Lodging Group, Limited Reports First Quarter of 2010 Financial Results Net Revenues
THE CONFERENCE BOARD LEADING ECONOMIC INDEX (LEI) FOR FRANCE AND RELATED COMPOSITE ECONOMIC INDEXES FOR FEBRUARY
 FOR FRANCE AND RELATED COMPOSITE ECONOMIC INDEXES FOR FEBRUARY") FOR RELEASE: 10:00 A.M. CET, WEDNESDAY, APRIL 22, 2009 The Conference Board France Business Cycle Indicators SM THE CONFERENCE BOARD LEADING ECONOMIC INDEX (LEI) FOR FRANCE AND RELATED COMPOSITE ECONOMIC
FOR RELEASE: 10:00 A.M. CET, WEDNESDAY, APRIL 22, 2009 The Conference Board France Business Cycle Indicators SM THE CONFERENCE BOARD LEADING ECONOMIC INDEX (LEI) FOR FRANCE AND RELATED COMPOSITE ECONOMIC
Hotel Capitalization Rates on
 Hotel Capitalization Rates on the Rise January 2009 Suzanne R. Mellen, CRE, MAI, FRICS Managing Director, HVS San Francisco & HVS Las Vegas HVS San Francisco 116 New Montgomery Street Suite 620 San Francisco,
Economic Data and Interest Rate Forecast
 Economic Data and Interest Rate Forecast February 2018 (Data through February 14, 2018) Monthly highlights Nonfarm Payroll off to solid start in 2018 Year over year wage growth jumps Manufacturing sector
The Mortgage and Housing Market Outlook
 The Mortgage and Housing Market Outlook National Economists Club Washington, DC March 27, 2008 Frank E. Nothaft Chief Economist Recession Risk, Housing Contraction Worsen 1-in-2 chance of recession in
FOR RELEASE: 10:00 A.M. AEST, THURSDAY, APRIL 30, 2009
 FOR RELEASE: 10:00 A.M. AEST, THURSDAY, APRIL 30, 2009 The Conference Board Australia Business Cycle Indicators SM THE CONFERENCE BOARD LEADING ECONOMIC INDEX (LEI) FOR AUSTRALIA AND RELATED COMPOSITE
Robert W. Baird Equity Research Hotel Update: C-Corps and REITs
 Real Estate Research October 3, 2012 Robert W. Baird Equity Research Hotel Update: C-Corps and REITs David Loeb Senior Real Estate Research Analyst Managing Director dloeb@rwbaird.com 414-765-7063 Jonathan
The Conference Board Australia Business Cycle Indicators SM AUSTRALIA LEADING ECONOMIC INDICATORS AND RELATED COMPOSITE INDEXES FOR MAY 2006
 Brussels Copenhagen Frankfurt Hong Kong London Mexico City New Delhi Ottawa New York Chicago San Francisco Washington FOR RELEASE: 8:00 P.M. ET, TUESDAY, JULY 25, 2006 The Conference Board Australia Business
Monthly Chartbook. April 1, Reasons We Think the World is Not Ending. Copyright All rights reserved. investwithcornerstone.
 Monthly Chartbook April 1, 2009 20 Reasons We Think the World is Not Ending Copyright 2003-2009 All rights reserved. The market had priced in the worst possible scenario that of a second Great Depression.
KSGFOA 2017 Fall Conference
 An Economic Outlook: Changing Times and What It Means for Your Organization PRESENTATION TO KSGFOA 2017 Fall Conference October 13, 2017 PRESENTER: Sheryl D. Bailey, Ph.D. Senior Vice President Roadmap
Outlook for the Global Economy and Travel
 Outlook for the Global Economy and Travel Adam Sacks President Tourism Economics @adam_sacks November 2018 Let s pose some questions What s happening now? Outline What could go wrong? What s backwards?
Nonfarm jobs decline 2,000 in September; unemployment rate falls to 4.6%
 Lincoln.dyer@ct.gov appears Office of Research Scott D. Jackson, Commissioner FOR IMMEDIATE RELEASE September 2017 Data CT Unemployment Rate = 4.6% US Unemployment Rate = 4.2% Nonfarm jobs decline 2,000
Quarterly Economic Update Key Trends
 Quarterly Economic Update Key Trends Linda Haran Senior Director June 2011 Experian and the marks used herein are service marks or registered trademarks of Experian Information Solutions, Inc. Other product
Consumer/Banking Outlook
 Consumer/Banking Outlook Federal Reserve Bank of Chicago Economic Outlook Symposium December 2006 Carl Tannenbaum Chief Economist Household Spending Year-Over-Year Percent Change in Nominal Total Retail
NIC Fall Conference Investing in Seniors Housing and Care Properties. #NICFall17
 2017 NIC Fall Conference Investing in Seniors Housing and Care Properties #NICFall17 We Really Want to Hear From You! Please Take a Few Minutes to Complete Today s Session Evaluation Accessible in the
Capital Markets Update
 Capital Markets Update The Forces Transforming Markets November 2007 The Past December 2006 April 2007 The Height of the Market November 2007 Changes in Risk Tolerance Spring 2007 Rating Agencies Tighten
THE CONFERENCE BOARD LEADING ECONOMIC INDEX (LEI) FOR GERMANY AND RELATED COMPOSITE ECONOMIC INDEXES FOR FEBRUARY
 FOR GERMANY AND RELATED COMPOSITE ECONOMIC INDEXES FOR FEBRUARY") FOR RELEASE: 10:00 A.M. (BERLIN TIME), THURSDAY, APRIL 22, 2010 The Conference Board Germany Business Cycle Indicators SM THE CONFERENCE BOARD LEADING ECONOMIC INDEX (LEI) FOR GERMANY AND RELATED COMPOSITE
FOR RELEASE: 10:00 A.M. (BERLIN TIME), THURSDAY, APRIL 22, 2010 The Conference Board Germany Business Cycle Indicators SM THE CONFERENCE BOARD LEADING ECONOMIC INDEX (LEI) FOR GERMANY AND RELATED COMPOSITE
RETAIL CONCERN GROWS
 MEDIA RELEASE Embargoed 1:am Tuesday 3 April 12 RETAIL CONCERN GROWS Concerns over staffing costs and online competition dampen retail outlook ers are increasingly concerned over the pressure staffing
Hyatt Hotels Corporation Investor Presentation
 Hyatt Hotels Corporation Investor Presentation August 2016 2 Forward-Looking Statements Forward-Looking Statements in this presentation, which are not historical facts, are forward-looking statements within
HOTEL INVESTMENTS FOR DUMMIES ( AND LAWYERS) Hotel Investment
 Hotel Investment") HOTEL INVESTMENTS FOR DUMMIES ( AND LAWYERS) Understanding Hotel Investment & Valuation Methodologies and Proformas/Analysis PRESENTERS David Parker Principal o f DP Consulting Graduate o f University
HOTEL INVESTMENTS FOR DUMMIES ( AND LAWYERS) Understanding Hotel Investment & Valuation Methodologies and Proformas/Analysis PRESENTERS David Parker Principal o f DP Consulting Graduate o f University
Nonfarm jobs slip 1,700 in December; unemployment rate declines to 4.4%
 Lincoln.dyer@ct.gov appears Office of Research Scott D. Jackson, Commissioner FOR IMMEDIATE RELEASE December 2016 Data CT Unemployment Rate = 4.4% US Unemployment Rate = 4.7% Nonfarm jobs slip 1,700 in
THE CONFERENCE BOARD LEADING ECONOMIC INDEX (LEI) FOR FRANCE AND RELATED COMPOSITE ECONOMIC INDEXES FOR JANUARY
 FOR FRANCE AND RELATED COMPOSITE ECONOMIC INDEXES FOR JANUARY") FOR RELEASE: 10:00 A.M. CET, TUESDAY, MARCH 17, 2009 The Conference Board France Business Cycle Indicators SM THE CONFERENCE BOARD LEADING ECONOMIC INDEX (LEI) FOR FRANCE AND RELATED COMPOSITE ECONOMIC
FOR RELEASE: 10:00 A.M. CET, TUESDAY, MARCH 17, 2009 The Conference Board France Business Cycle Indicators SM THE CONFERENCE BOARD LEADING ECONOMIC INDEX (LEI) FOR FRANCE AND RELATED COMPOSITE ECONOMIC
Weekly Macroeconomic Review
 16/10/2012 Weekly Macroeconomic Review Expectations derived from the capital market Our forecast Inflation in the coming months Inflation through September 2013 CPI (average annual rate) Inflation through
Q RESULTS BRUSSELS, 22 OCTOBER 2015 WOLFGANG M. NEUMANN, PRESIDENT & CEO KNUT KLEIVEN, DEPUTY PRESIDENT & CFO
 Q3 215 RESULTS BRUSSELS, 22 OCTOBER 215 WOLFGANG M. NEUMANN, PRESIDENT & CEO KNUT KLEIVEN, DEPUTY PRESIDENT & CFO Radisson Blu Azuri Resort & Spa, Mauritius 1 I Q3-215 Results Q3-7 Q3-8 Q3-9 Q3-1 Q3-11
Consumer Price Index, Jobless Claims, Housing Starts Each of These Reports Have Favorable Aspects to Note
 Consumer Price Index, Jobless Claims, Housing Starts Each of These Reports Have Favorable Aspects to Note January 19, Asha G. Bangalore agb3@ntrs.com The Consumer Price Index (CPI) held steady in December,
Capital Market Update. February 10, 2011 Marc Louargand, Ph.D., CRE, FRICS Principal SALTASH PARTNERS LLC investing in American ingenuity
 Capital Market Update February 10, 2011 Marc Louargand, Ph.D., CRE, FRICS Principal SALTASH PARTNERS LLC investing in American ingenuity A Brief Tour of the Capital Market What s happened in the past year?
WESTERN MARKET SNAPSHOT
 The Market Monitor is published on the Market Surveillance Administrator's web site (www.albertamsa.ca) every Tuesday reporting on key market indicators and weekly trends in Alberta's evolving electricity
Labor Market Conditions in the Region
 Labor Market Conditions in the Region Economic Press Briefing: December 4, 2018 The views expressed here are those of the presenter and do not necessarily represent those of the Federal Reserve Bank of
U.S. and Regional Economic Outlook
 U.S. and Regional Economic Outlook Chad Wilkerson Vice President, Economist, and Oklahoma City Branch Executive Federal Reserve Bank of Kansas City www.kansascityfed.org/oklahomacity Overview of the Federal