The Best Gann Fan Trading Strategy
|
|
|
- Debra Hester Cameron
- 5 years ago
- Views:
Transcription
1
2 The Best Gann Fan Trading Strategy The best Gann fan trading strategy is a complex support and resistance trading strategy that uses diagonal support and resistance levels. Unlike the traditional horizontal support and resistance levels, the Gann fan angles are mathematically calculated based on the price, time and the price range of the market. If you want to learn how to correctly trade horizontal support and resistance level we ve got your back, just read Support and Resistance Zones Road to Successful Trading. Our team at Trading Strategy Guides has developed the best Gann fan trading strategy which can be applied to all markets because according to the Gann theory, financial markets move as a result of human behavior which makes them cyclical in nature. In other words, history is a good predictor of future price action. One of the main reasons why Gann fan angles are superior to the horizontal support and resistance levels is that financial markets are geometric in their movements. This means that if you can spot a pattern or or any other geometric shape in a chart, then there is a high probability you can spot them at the Gann fan angles. Now

3 Before we get started, let s look at what indicator you need for the job for the Best Gann Fan Trading Strategy: The First and ONLY indicator you need is the: Gann Fan Indicator: This indicator is notable unique because it draws diagonal support and resistance levels at different angles. At first sight you might recognize the indicator because it s a colorful indicator much like the Fibonacci Channel indicator which has been introduced to our audience in previous months, read more here: Fibonacci Retracement Channel Trading Strategy We have special Gann fan angles and more specifically Gann came up with 9 different angles (see Figure Above). The most important angle is the 45-degree angle or the 1/1 line. For every Gann angle, there is a line that is derived from that angle. We can distinguish 4 different Gann angles above the 45-degree angle and 4 other Gann angles below, as follows: 1/8 1/4 1/3 1/2 1/1 45 degree 2/1

4 3/1 4/1 8/1 How to Use the Gann Fan Indicator According to Gann theory, there are special angles that you can draw on a chart that will give you a good indicator of what price is going to do in the future. All of Gann s techniques require equal time and price intervals, in other words, a rise of a 1/1 would imply a 45-degree angle. This statement may sound obscure, but after we ll go through some example, shortly and you ll get a better understanding of how to use the Gann fan indicator and more importantly how to draw Gann fan angles. Gann believed that when price and time move in sync, then that s the ideal balance of the market. The biggest part of the Gann theory revolves around the fact that prices above the 1/1 line, the 45-degree line will determine a bull market and prices below the 1/1 line determine a bear market (see Figure above).
5 How to Draw Gann an Angle In this section, I m going to teach you how to draw Gann fan angles. Many traders are used to draw Gann fan angles the wrong way which is why you need to pay closer attention to this section. You first need to draw a perfect 45-degree angle and most sophisticated trading platforms should have incorporated such tools. On the Tradingview platform, you can locate the Trend Angle tool on the left-hand side panel (see Figure below). Next step is to select any major swing high or swing low on the chart from where you want to draw the Gann fan angles. Once you ve chosen your swing low point simply utilize the trend Angle tool and draw a perfect 45 degree angle. Once you re done, you need now to learn how to draw the Gann fan angles. On this step you need to use the Gann Fan indicator which again is located on the left hand side panel (see Figure below).

6 Now, all you have to do is to simply place the Gann fan indicator on the chart and make sure it overlays on top of the 45-degree line you previously have drawn. This is the correct way to draw the Gann fan angles and if you have been following all these steps all the other Gann fan angles should comply with the Gann rules. Now, let s move forward to the most important part of this article, the trading rules of the best Gann fan trading strategy. Before we go any further, we always recommend writing down the trading rules on a piece of paper. This exercise will step up your learning curve and you ll become a Gann expert in no time. Let s get started

7 The Best Gann Fan Trading Strategy (Rules for BUY Trade) Step #1: Pick a significant High, Draw Gann Fan Angles and Wait For the 1/1 Line to Break to the Upside The best Gann fan trading strategy works the same on every time frame, but we recommend not going lower than the 1h chart as you want to be able to pick significant swing high points which can t be seen on the lower time frames. To draw Gann fan angles please refer to the previous How to draw Gann fan Angle section. Next, let s address our entry point: Step #2: Wait for a Break Above 2/1 Gann angle Before Buying at the market This step is significantly important because a reversal of the previous trend is only confirmed once the 2/1 Gann angle is broken to the upside. You want to buy at the market as soon as we break above 1/1 line.

8 Now, after we have our position opened, we need to do one more important thing: Step #3: Apply again the Gann Fan Indicator on the Swing low Prior to the Breakout above 2/1 Gann Fan Angle How to use the Gann fan indicator? Simply follow the instruction presented in the above sections. At this point, you can also get rid of the previous Gann fan angles drawn from the swing high. This will make sure your chart will not get cluttered and the price is still visible. One of the reasons why this is the best Gann fan strategy is because we use the Gann fan indicator to track every swing in the market.

9 At this point, your trade is opened, but we still need to determine where to place our protective stop loss and take profit orders, which brings us to the next step of best Gann fan trading strategy. The BIG THREE Indicator Can Win Three Times As Many Trades Than Your Average Free Indicator You See in the Marketplace. - Guaranteed TAP HERE TO GET YOUR SPECIAL DISCOUNT
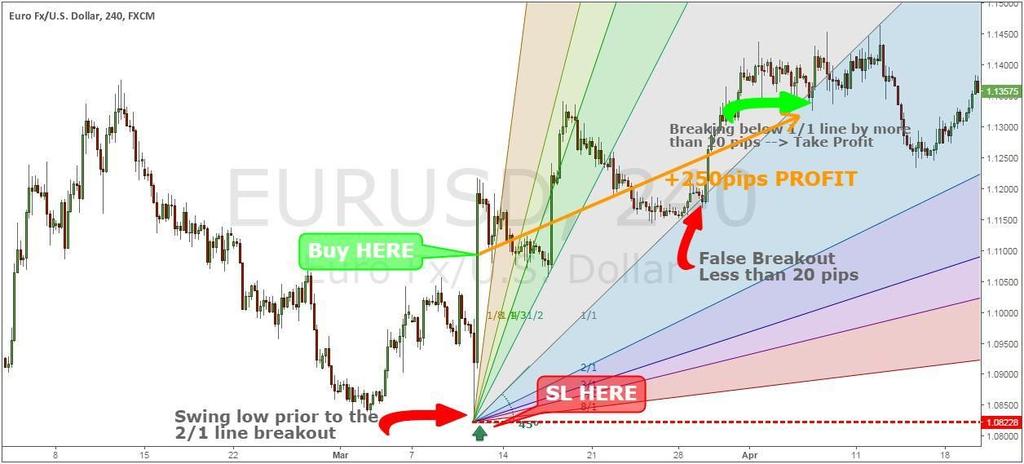
10 Step #4: Place Your Protective Stop Loss below the Most Recent Swing Low Which Should Align With the Point from Where You Draw the Second Set of Gann Fan Angles. The best Gann fan strategy has a very clear level where we should place our protective stop loss order which is right below the swing low located prior to the 1/2 Gann angle breakout. Next, will learn where to take profits: Step #5: Take Profit One we Break and Close Below the 1/1 line. We Need the Close Below 1/1 line to be by at Least 20 Pips to Consider it a Valid Breakout We want to ride the new trend for as long as possible and with the help of the Gann fan indicator, we can pinpoint the ideal time to take profits. We take profit at the earliest symptom of market weakness which is a break below the 1/1 line that signals a possible start of a bearish move. We also want to add a buffer of 20 pips to the 1/1 Gann angle breakout just to annihilate possible false breakouts.


11 Note** The above was an example of a buy trade using the best Gann fan strategy. Use the same rules but in reverse for a sell trade. In the figure below you can see an actual SELL trade example using the best Gann fan strategy. Simply follow the how to use the Gann fan indicator section to draw the Gann fan angles. We ve applied the same Step #1 and Step#2 to help us identify the SELL trade and followed Step #3 through Step#5 to manage the trade (see next figure).

12 Conclusion This is the best Gann fan strategy because unlike the traditional support and resistance lines the Gann angles can pinpoint significant changes in the market swing trends. We at Trading Strategy Guides have a clear understanding of what is really going on at these critical levels because we always make sure we backtesting our strategies so they have a positive expectancy. If you want to gain a much clearer understanding of how support and resistance level really work we recommend having a look at our work here: Support and Resistance: What Is Going On At These Critical Areas. Thank you for reading! Gann Fan Strategy Trade Example For the below example you simply have to follow the How to use the Gann fan indicator section to draw the Gann fan angles and need to applied the same Step #1 and Step#2 to help us identify the BUY/SELL trade and followed Step #3 through Step#5 to manage the trade.


13 Trade Example - AUD/USD 4H Short

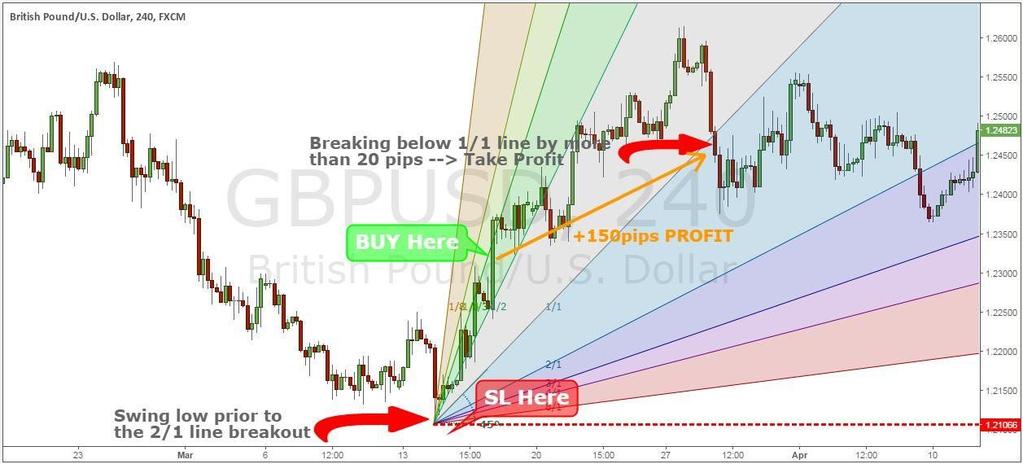
14 Trade Example - GBP/USD 4H Long Trade Example - EUR/USD 4H Long

15 Thank you for Reading!
Naked Trading - Double Top Chart Pattern Strategy
 Naked Trading - Double Top Chart Pattern Strategy If you really want to learn a profitable way to trade then look no further, the Double Top chart pattern strategy uses simple and sound trading principles
Swing Trading Strategies that Work
 Swing Trading Strategies that Work Jesse Livermore, one of the greatest traders who ever lived once said that the big money is made in the big swings of the market. In this regard, Livermore successfully
This is the complete: Fibonacci Golden Zone Strategy Guide
 This is the complete: Fibonacci Golden Zone Strategy Guide In this strategy report, we are going to share with you a simple Fibonacci Trading Strategy that uses the golden ratio which is a special mathematical
Binary Options Trading Strategies How to Become a Successful Trader?
 Binary Options Trading Strategies or How to Become a Successful Trader? Brought to You by: 1. Successful Binary Options Trading Strategy Successful binary options traders approach the market with three
Trends. Define the term Trend Explain why Trend is important Identify Primary, Secondary, and Short-Term trends
 Trends Define the term Trend Explain why Trend is important Identify Primary, Secondary, and Short-Term trends 1 What is a Trend? Uptrend Prices rise and fall in Trends Trend is defined as: Up (Rising)
Introduction to the Gann Analysis Techniques
 Introduction to the Gann Analysis Techniques A Member of the Investment Data Services group of companies Bank House Chambers 44 Stockport Road Romiley Stockport SK6 3AG Telephone: 0161 285 4488 Fax: 0161
Technical Analysis. Dealing Room Peter Leonidou. Peter Leonidou
 Technical Analysis Dealing Room Questions Traders Should Ask What is the trend? What is the pivot point? What is the support levels? What is the resistance levels? Strong or weaker USD? What 1. Trade
Instruction (Manual) Document
 Document") Instruction (Manual) Document This part should be filled by author before your submission. 1. Information about Author Your Surname Your First Name Your Country Your Email Address Your ID on our website
Instruction (Manual) Document This part should be filled by author before your submission. 1. Information about Author Your Surname Your First Name Your Country Your Email Address Your ID on our website
For general trading knowledge, please get a beginners guide or simply got to :
 www.forexripper.com About The System For general trading knowledge, please get a beginners guide or simply got to : www.babypips.com For more interactive information about the market, there are hundreds
I prefer to use the CCI indicator to trade divergences and it has worked well for me over the past 10 years.
 Make 100 pips Trading Divergences. There are several ways to trade divergences and several indicators that can help you identify the divergence between price and the indicator itself. I prefer to use the
TRADE SIGNALS POWERED BY AUTOCHARTIST
 SAXO TRADER GO TRADE SIGNALS POWERED BY AUTOCHARTIST Trade Signals is a SaxoTraderGO tool that uses Autochartist technology to identify emerging and completed patterns in most leading financial markets.
How I Trade Profitably Every Single Month without Fail
 How I Trade Profitably Every Single Month without Fail First of all, let me take some time to introduce myself to you. I am Koon Hwee (KH Lee) and I am a full time currency trader. I have a passion for
If you have traded forex long enough, you will notice that sometimes, price has an uncanny ability to reverse exactly at or around fibonacci levels.
 Fibonacci Forex Trading Strategy With Reversal Candlesticks The Fibonacci forex trading strategy with reversal candlesticks is simply about using fibonacci retracements in conjunction with reversal candlesticks.
Forex Range Trading With Price Action Forex Trading System By Laurentiu Damir
 Forex Range Trading With Price Action Forex Trading System By Laurentiu Damir Copyright 2012 by Laurentiu Damir All rights reserved. No part of this book may be reproduced or transmitted in any form or
TRADE SIGNALS POWERED BY AUTOCHARTIST
 TRADE SIGNALS POWERED BY AUTOCHARTIST Trade Signals is a powerful tool available in BiGlobal Trade for identifying trading opportunities based on chart patterns using Autochartist technology. As an introduction
Part 1. ForEx Easy Mode
 Part 1 DISCLAIMER Any income claims are typical of top performers not all users and your results will vary. Past performance of any system is not indicative of future results. Trading foreign exchange
TRADE SIGNALS POWERED BY AUTOCHARTIST
 SAXO TRADER GO TRADE SIGNALS POWERED BY AUTOCHARTIST Trade Signals is a SaxoTraderGO tool that uses Autochartist technology to identify emerging and completed patterns in most leading financial markets.
Thanks for Checking out The Parabolic SAR Trading Strategy Report that we have developed for you to learn and apply to your trading system..
 Thanks for Checking out The Parabolic SAR Trading Strategy Report that we have developed for you to learn and apply to your trading system.. This Trading Strategy will teach you how to catch new trends
SIMPLE PIPS GENERATING MACHINE
 THE SIMPLE PIPS GENERATING MACHINE SPGM-5 The news break snatcher By EKONYE G. KINGX d_analyst www.loooopfx.blogspot.com 1 SPGM-5 The News Break Snatcher INTRODUCTION The news break snatcher is the 5 th
Technical Analysis Basics. Identifying Tops
 Technical Analysis Basics. Identifying Tops June 2011 1 Sign Up Now to Upshots forex trade signals disclaimer The information provided in this report is for educational purposes only. It is not a recommendation
INTERMEDIATE EDUCATION GUIDE
 INTERMEDIATE EDUCATION GUIDE CONTENTS Key Chart Patterns That Every Trader Needs To Know Continution Patterns Reversal Patterns Statistical Indicators Support And Resistance Fibonacci Retracement Moving
EZ Trade FOREX Day Trading System. by Beau Diamond
 EZ Trade FOREX Day Trading System by Beau Diamond The EZ Trade FOREX Day Trading System is mainly used with four different currency pairs; the EUR/USD, USD/CHF, GBP/USD and AUD/USD, but some trades are
TRADE SIGNALS POWERED BY AUTOCHARTIST
 SAXO TRADER GO TRADE SIGNALS POWERED BY AUTOCHARTIST Trade Signals is a SaxoTraderGO tool that uses Autochartist technology to identify emerging and completed patterns in most leading financial markets.
The Engulfing Trader Copyright 2014
 Www.ForexWinners.Ru Prologue and Introduction This book is for all those that are just fed up with all the hype out there in the market. So called guru s selling expensive strategies and systems guaranteeing
TRADE SIGNALS POWERED BY AUTOCHARTIST
 SAXO TRADER GO TRADE SIGNALS POWERED BY AUTOCHARTIST Trade Signals is a SaxoTraderGO tool that uses Autochartist technology to identify emerging and completed patterns in most leading financial markets.
The Gann Analysis Rule Book
 2006 Gann Managament Ltd. All Rights Reserved. Gann Management Limited is authorised and Regulated by the Financial Services Authority The Gann Analysis Rule Book A Man Who Never Changes His Mind Will
Naked Trading and Price Action
 presented by Thomas Wood MicroQuant SM Divergence Trading Workshop Day One Naked Trading and Price Action Risk Disclaimer Trading or investing carries a high level of risk, and is not suitable for all
Raising Investment Standards TRADING SEMINAR
 Raising Investment Standards TRADING SEMINAR Raising Investment Standards DISCLAIMER Leveraged foreign exchange and options trading carries a significant level of risk, and may not be suitable for all
Free signal generator for traders
 Free signal generator for traders Trader s Bulletin Pivot Point Trading Strategy 1. Just download the FREE tool 2. Key in a few numbers 3. And follow the simple techniques by Mark Rose To make money from
Fibo Vector Published by Old Tree Publishing CC Suite 509, Private Bag X503 Northway, 4065, KZN, ZA
 Fibo Vector Published by Old Tree Publishing CC Suite 509, Private Bag X503 Northway, 4065, KZN, ZA www.oldtreepublishing.com Copyright Old Tree Publishing CC, KZN, ZA Reproduction or translation of any
1. Introduction 2. Chart Basics 3. Trend Lines 4. Indicators 5. Putting It All Together
 Technical Analysis: A Beginners Guide 1. Introduction 2. Chart Basics 3. Trend Lines 4. Indicators 5. Putting It All Together Disclaimer: Neither these presentations, nor anything on Twitter, Cryptoscores.org,
50 Pips A Day Forex Strategy. How To Build A Solid Trading System. By Laurentiu Damir. Copyright 2012 by Laurentiu Damir
 50 Pips A Day Forex Strategy How To Build A Solid Trading System By Laurentiu Damir Copyright 2012 by Laurentiu Damir All rights reserved. No part of this book may be reproduced or transmitted in any form
Before I address the harmonic patterns and harmonic ratios that exist in the market, I need to address the Fibonacci series and Fibonacci ratios.
 Full Trading Circle: The Complete Underground Trader System By Jea Yu Copyright 2010 by Jea Yu APPENDIX A HARMONIC PATTERN TRADING by Suri Duddella of Surinotes.com Financial markets exhibit the natural
Ichimoku Kinko Hyo. Ichimoku 101 and history...2. Basic Ichimoku Lines...3. Kumo the cloud...5. Trading signals generated by Ichimoku...
 Ichimoku Kinko Hyo Japan has been undoubtedly the most innovative trading leader for many years now. They have started off by inventing candlestick charts and they are still being used worldwide, during
RISK DISCLOSURE STATEMENT / DISCLAIMER AGREEMENT
 RISK DISCLOSURE STATEMENT / DISCLAIMER AGREEMENT Trading any financial market involves risk. This report and all and any of its contents are neither a solicitation nor an offer to Buy/Sell any financial
Trading the Hidden Divergence. Presented by Sunil Mangwani
 Trading the Hidden Divergence Indicators in technical analysis. Indicators along with chart patterns, trend lines, resistance / support levels etc., are an essential part of technical analysis. But there
EJ_4H Method Part III
 EJ_4H Method Part III Trailing price: Protecting your hard-earned money against reversals or even flurries is one of the most important parts of money management. Most of platforms have such feature that
Figure 3.6 Swing High
 Swing Highs and Lows A swing high is simply any turning point where rising price changes to falling price. I define a swing high (SH) as a price bar high, preceded by two lower highs (LH) and followed
I. Strength and Weakness in the $USD Markets General Market for $USD
 Finding Great Swing Opportunities Using Trends in Relative and Comparative Strength A Case Study in the Silver Market Paul Bergin Relative and Comparative Strength are two of my favorite concepts studied
INTRODUCTION 2 INSTALLATION AND CHART SETUP 3 BUY AND SELL ZONES 4 BBOX TICKSPEED INDICATOR 6 TRADING RULES AND CONDITIONS 7
 BLACK-BφX.COM INTRODUCTION 2 INSTALLATION AND CHART SETUP 3 BUY AND SELL ZONES 4 BBOX TICKSPEED INDICATOR 6 TRADING RULES AND CONDITIONS 7 BUY CONDITIONS 7 SELL CONDITIONS 9 IMPORTANT NOTES: 11 TAKE PROFIT
Market Technical Analysis REPORT
 Market Technical Analysis REPORT using Integrated Pitchfork Analysis by Dr Mircea Dologa, MD, CTA MORNING of May 21st 2007 The traders must progressively monitor the conditions of the market movements
Forex Advantage Blueprint
 Forex Advantage Blueprint Complimentary Report!! www.forexadvantageblueprint.com Copyright Protected www.forexadvantageblueprint.com - 1 - Limits of liability/disclaimer of Warranty The author and publishers
MULTI-TIMEFRAME TREND TRADING
 1. SYNOPSIS The system described is a trend-following system on a slow timeframe that uses optimized (that is, contrarian) entries and exits on a fast timeframe at the tops and bottoms of retraces against
WELCOME
 www.facebook.com/fxdd www.twitter.com/fxdd WELCOME Part 1: Building the Forex Traders Foundation Greg Michalowski Email: greg@fxdd.com www.livestream.com/fxdd www.fxddnow.com Twitter: gregmikefx Disclaimer
Forex Price Direction Analysis.
 Forex Price Direction Analysis. September 24 2010 1 Sign Up Now to Upshots forex trade signals disclaimer The information provided in this report is for educational purposes only. It is not a recommendation
Resistance to support
 1 2 2.3.3.1 Resistance to support In this example price is clearly consolidated and we can expect a breakout at some time in the future. This breakout could be short or it could be long. 3 2.3.3.1 Resistance
The Fish Hook Pattern
 The Fish Hook Pattern GOAL The Fish Hook Pattern is a trade entry method that is mentioned from time to time in Jim s Chartbook and on the Premium Alert Service. The idea behind the Fish Hook is that it
The AB=CD Secret Pattern
 The AB=CD Secret Pattern Author: Sundeep Bilkhu www.fibonacciprofits.com Published By: Instant Marketplace Ltd Copyright 2006 www.fibonacciprofits.com All rights reserved www.fibonacciprofits.com is owned
3 Price Action Signals to Compliment ANY Approach to ANY Market
 3 Price Action Signals to Compliment ANY Approach to ANY Market Introduction: It is important to start this report by being clear that these signals and tactics for using Price Action are meant to compliment
So let s get into the meat of the matter. Here s how you are going to become the most successful and profitable Forex trader you know.
 Learn to Trade Forex and Make $250 Every Day *Don't Forget To Take a Look at My Advanced Strategies For Making Over $750 Dollars a Day With Forex -> Go To My Website Click Here The $250 Per Day System
What Came First... Fundamentals or the Technicals? By Jared Martinez
 What Came First... Fundamentals or the Technicals? By Jared Martinez I am honored to share my thoughts on our methodologies, focusing on the current technical movements and conditions of the FOREX Markets,
Advanced Trading Systems Collection. 10/21/50 EMA Forex SCALPING SYSTEM
 10/21/50 EMA Forex SCALPING SYSTEM 1 This is a fairly simple method to squeeze money out of the market with short terms trades. With this one we trade the five minute charts, and we rarely hold a trade
This strategy is suitable for all currency pairs listed on the broker s platform, especially the seven major currency pairs of:
 STRATEGY 11: THE PENDULUM In the previous strategy, we explored a technique that helps us to anticipate a range with the help of the stochastic indicator and also trade it in the early stages of formation.
Knowing When to Buy or Sell a Stock
 Knowing When to Buy or Sell a Stock Overview Review & Market direction Driving forces of market change Support & Resistance Basic Charting Review & Market Direction How many directions can a stock s price
presented by Thomas Wood MicroQuant SM Divergence Trading Workshop Day One Bond Trading Success
 presented by Thomas Wood MicroQuant SM Divergence Trading Workshop Day One Bond Trading Success Risk Disclaimer Trading or investing carries a high level of risk, and is not suitable for all persons. Before
Multi Indicator Usage Concepts 4/1/2012 Brooky-Indicators.com Brooky
 Multi Indicator Usage Concepts www.brooky-indicator.com 4/1/2012 Brooky-Indicators.com Brooky U.S. Government Required Disclaimer Commodity Futures Trading Commission Futures, Currency and Options trading
Petri Redelinghuys
 Petri Redelinghuys // @TraderPetri Becoming a better trader The first step is persistence You re still at it, well done! Learning must be the focus 90% of traders lose all their money and fail 10% of traders
Expert Trend Locator. The Need for XTL. The Theory Behind XTL
 Chapter 20 C H A P T E R 20 The Need for XTL esignal does an excellent job in identifying Elliott Wave counts. When combined with studies such as the Profit Taking Index, Wave Four Channels, Trend Channels
Market Technical Analysis REPORT : Europe
 1 Market Technical Analysis REPORT : Europe using Integrated Pitchfork Analysis by Dr Mircea Dologa, MD, CTA MORNING of April 30th 2007 The traders must progressively monitor the conditions of the market
Bill Adlard s market review
 Bill Adlard s market review DJIA S&P 500 FTSE 100 Gold Cable Euro Brent Crude Sunday 30 th September 2012 To view full screen use Ctrl-L or View/Full Screen Mode from the Menu. Images are clearest at 108%
How To Read Charts Like A Pro Your guide to reading stock charts!
 How To Read Charts Like A Pro Your guide to reading stock charts! Courtesy of Swing-Trade-Stocks.com You may distribute this book FREELY or use it as part of a commercial package as long as this page and
Instruction (Manual) Document
 Document") Instruction (Manual) Document This part should be filled by author before your submission. 1. Information about Author Your Surname Your First Name Your Country Your Email Address Your ID on our website
Instruction (Manual) Document This part should be filled by author before your submission. 1. Information about Author Your Surname Your First Name Your Country Your Email Address Your ID on our website
Trade the Price Action By Laurentiu Damir. Copyright 2012 Laurentiu Damir
 Trade the Price Action By Laurentiu Damir Copyright 2012 Laurentiu Damir All rights reserved. No part of this book may be reproduced or transmitted in any form or by any means, electronic or mechanical,
READ THIS FIRST! A. Tenkan Sen/Kijun Sen Cross
 READ THIS FIRST! Ichimoku is a finely-tuned, integrated charting system where the five lines all work in concert to produce the end result. We emphasize the word "system" here because it is absolutely
2.0. Learning to Profit from Futures Trading with an Unfair Advantage! Income Generating Strategies Essential Trading Tips & Market Insights
 2.0 Learning to Profit from Futures Trading with an Unfair Advantage! Income Generating Strategies Essential Trading Tips & Market Insights Income Generating Strategies Essential Trading Tips & Market
The Synthetic Futures Position. Goal
 The Synthetic Futures Position Goal To try to profit from a trending market using an option strategy that allows entry at a reduced cost while offering the same potential for unlimited profit (and loss)
Williams Percent Range
 Williams Percent Range (Williams %R or %R) By Marcille Grapa www.surefiretradingchallenge.com RISK DISCLOSURE STATEMENT / DISCLAIMER AGREEMENT Trading any financial market involves risk. This report and
Lara s Weekly. S&P500 + GOLD + USOIL Elliott Wave & Technical Analysis. Lara Iriarte CMT 23 February, 2018
 Lara s Weekly S&P500 + GOLD + USOIL Elliott Wave & Technical Analysis Lara Iriarte CMT 23 February, 2018 S&P 500 Contents S&P 500 GOLD USOIL About Disclaimer 3 18 36 48 48 S&P 500 S&P 500 Upwards movement
The Stackable Carry Trade
 The Stackable Carry Trade Introduction: The Carry Trade is a relatively popular strategy among Forex traders. The concept is to pair high yielding interest currencies against low interest currencies in
Using Acceleration Bands, CCI & Williams %R
 Price Headley s Simple Trading System for Stock, ETF & Option Traders Using Acceleration Bands, CCI & Williams %R How Technical Indicators Can Help You Find the Big Trends For any type of trader, correctly
PRICE ACTION TRADING COURSE
 PRICE ACTION TRADING COURSE forextradingstrategies4u.com P a g e 1 If you want to learn about Price Action Trading, then this forex price action trading course will really help you. There's a lot of practical
The Ben s Strategy Guide for Binary Trading
 The Ben s Strategy Guide for Binary Trading What is the Ben s strategy? This strategy was created by the Fx Learning members to help them get into trading with 'the trend'. You would naturally think the
The goal for Part One is to develop a common language that you and I
 PART ONE Basic Training The goal for Part One is to develop a common language that you and I can use. The rest of the book will discuss how the technical indicators highlighted in the first two chapters
Top Down Analysis Success Demands Singleness of Purpose
 Chapter 9 Top Down Analysis Success Demands Singleness of Purpose Armed with a little knowledge about the stock and options market as well as a desire to trade, many new traders are faced with the daunting
SIMPLE SCAN FOR STOCKS: FINDING BUY AND SELL SIGNALS
 : The Simple Scan is The Wizard s easiest tool for investing in stocks. If you re new to investing or only have a little experience, the Simple Scan is ideal for you. This tutorial will cover how to find
BUY SELL PRO. Improve Profitability & Reduce Risk with BUY SELL Pro. Ultimate BUY SELL Indicator for All Time Frames
 BUY SELL PRO Improve Profitability & Reduce Risk with BUY SELL Pro Ultimate BUY SELL Indicator for All Time Frames Risk Disclosure DISCLAIMER: Crypto, futures, stocks and options trading involves substantial
TRADING STRATEGY SERIES LEARN HOW TO SPOT OPPORTUNITIES IN VOLATILE MARKETS fpmarkets.com.au
 1 TRADING STRATEGY SERIES LEARN HOW TO SPOT OPPORTUNITIES IN VOLATILE MARKETS This educational material does not constitute financial product advice and does not take into account your investment objectives,
Copyright PriceAction5.com
 1 Copyright PriceAction5.com All rights reserved. Unauthorised resell or copying of this material is unlawful. No portion of this ebook may be copied or resold without written permission. PriceAction5.com
Trading Success Principles Floor Trader Pivots
 Trading Success Principles Floor Trader Pivots Trading Concepts, Inc. Trading Success Principles Floor Trader Pivots By Todd Mitchell Copyright 2014 by Trading Concepts, Inc. All Rights Reserved This training
Weekly outlook for April 30 May
 Weekly outlook for April 30 May 4 2018 Summary The S&P500 index is having trouble deciding if it will rally or decline. This indecision makes trading less profitable. Wait for a break-out direction to
David vs Goliath. How small traders can Benefit from the Big Players. coverstory. Gernot Daum
 David vs Goliath How small traders can Benefit from the Big Players What does a trader need to complete his trades in a disciplined way? Confidence! And how can he get that? By knowing what he is doing
MagicBreakout Forex Trading Strategy
 Tim Trush & Julie Lavrin introduce MagicBreakout Forex Trading Strategy Your guide to financial freedom. Tim Trush, Julie Lavrin, T&J Profit Club, 2007, All rights reserved www.magicbreakout.com Table
Trading Patterns For Stocks And Commodities
 Trading Patterns For Stocks And Commodities It doesn t matter if you are a long-term investor, short swing trader or day trader, you are always looking for an advantageous spot to enter your position.
Chapter 4.2. Technical Analysis: Fibonacci
 1 Chapter 4.2 Technical Analysis: Fibonacci 0 Contents TECHNICAL ANALYSIS: FIBONACCI Fibonacci analysis is the study of identifying potential support and resistance levels in the future based on past price
Wave-to-Wave Trading Analysis June 1, 2012
 Trading Wave-to-Wave 1 Wave-to-Wave Trading Analysis June 1, 2012 S&P 500 Index ETF (SPY) Successful traders understand that there are waves within waves 5-minute waves inside of 60-minute waves inside
Experts for Trailing MT4 created by Yorik /
 Experts for Trailing MT4 created by Yorik / yorik@list.ru EAs first published 13/09/2007 at Hhttp://codebase.mql4.com/ru/1101 What it is and what it's for Below you can find descriptions of a number of
Gold, and Mining Stocks Trader Monday, March 04, :57 AM Published by The Wall Street Examiner
 Monday, March 04, 2019 8:57 AM Published by The Wall Street Examiner Cycle Phase/PTT Projection 9-12 Month Top-Down/11-24 Weeks 1330 Done 13/17 Week Down/20? 6-7 Week Down/
Instruction (Manual) Document
 Document") Instruction (Manual) Document This part should be filled by author before your submission. 1. Information about Author Your Surname Your First Name Your Country Your Email Address Your ID on our website
Instruction (Manual) Document This part should be filled by author before your submission. 1. Information about Author Your Surname Your First Name Your Country Your Email Address Your ID on our website
VE N O M Trading System: User Manual VENOM USER MANUAL. Copyright 2007 Third Wave FX. All Rights Reserved.
 VENOM USER MANUAL www.thirdwavefx.com Copyright 2007 Third Wave FX. All Rights Reserved. ww w.third w a v e f x.co m Page 1 Step 1 Copy & paste Third Wave FX Venom A.ex4 & Third Wave FX Venom B.ex4 indicator
Analytical Market Trading. The Range bar, Time and Price. April 2004
 Analytical Market Trading The Range bar, Time and Price. April 2004 Throughout the book we have seen how the movement of price is greatly influenced by the passage of time, and by simply calculating Time
Dynamic Trader Daily Report Comprehensive Analysis and Education For the Serious Trader and Investor
 Dynamic Trader Daily Report Comprehensive Analysis and Education For the Serious Trader and Investor Published By Monday, February 07, 2000 Dynamic Traders Group, Inc. DynamicTraders.com dt@dynamictraders.com
Class 6: Trading the Lanes (In-depth Line Drawing and Charting) Review of Class So Far
 Review of Class So Far") Today s Class Class 6: Trading the Lanes (In-depth Line Drawing and Charting) Review of class so far Where we are going from here More in-depth technical analysis Trading with brackets (neutral trading)
Today s Class Class 6: Trading the Lanes (In-depth Line Drawing and Charting) Review of class so far Where we are going from here More in-depth technical analysis Trading with brackets (neutral trading)
McDowell s Special Market Report Using the TradersCoach.com Software Tools
 McDowell s Special Market Report Using the TradersCoach.com Software Tools JULY 2018: Welcome to this month s Market Report! This written report is going to forecast the Dow Jones Industrial Average (hereafter
Technical Analysis explained: The Gap theory applied on unsustainable movements in EUR/USD
 Technical Analysis explained: The Gap theory applied on unsustainable movements in EUR/USD In late 1980s John J. Murphy published his book titled Technical Analysis of the Futures Markets, a comprehensive
TRADING VIEW: A Break and close below support.7600c would be the catalyst to looking for short trade opportunities in the sessions ahead.
 06 April 2018 S&P 500 A 5 wave decline can be counted on the daily chart from the 2807.25 high of March to the low of 2552. This is the first indication that a trading low may be in place. Confidence that
Day Trade Warrior. Chapter 5. Intraday Chart Patterns
 Day Trade Warrior Chapter 5. Intraday Chart Patterns What do we know? We have learned about Managing Risk (2:1 profit loss ratio 50% success target) We have learned how to find the Right Stocks (high relative