Chapter 4.2. Technical Analysis: Fibonacci
|
|
|
- Miranda Sherman
- 5 years ago
- Views:
Transcription

1 1 Chapter 4.2 Technical Analysis: Fibonacci 0
2 Contents TECHNICAL ANALYSIS: FIBONACCI Fibonacci analysis is the study of identifying potential support and resistance levels in the future based on past price trends and reversals. Fibonacci analysis is based on the mathematical discoveries of Leonardo Pisano also known as Fibonacci. He is credited with discovering a sequence of numbers that now bears his name: the Fibonacci sequence. The golden ratio and the other ratios that exist within the Fibonacci sequence represent the natural ebb and flow of life. They also apply to the natural ebb and flow of the forex market. In this section, you will learn how Fibonacci ratios can be applied to the forex market using the following analysis tools: The Fibonacci sequence is a series of numbers that progresses as follows, 0, 1, 1, 2, 3, 5, 8, 13, 21, 34, 55. To arrive at each subsequent number in the sequence, you simply sum the two preceding numbers in the sequence. For example, to find the number that follows 55 in the sequence, you add (the two preceding numbers in the sequence). The sum of is 89. This is the next number in the sequence. What intrigued Fibonacci about this sequence was not the numbers themselves but rather the relationships among the numbers, or the ratios created by various numbers in the sequence. Perhaps the most important ratio is also known as the golden ratio, or golden mean. This number can be found throughout nature (in sea shells, growth rings, etc.) and throughout the Fibonacci sequence. Each number in the Fibonacci sequence is times larger than the preceding number. For example, 89 is times larger than 55 (89 55 = 1.618). Fibonacci retracements Fibonacci projections Fibonacci fans 1
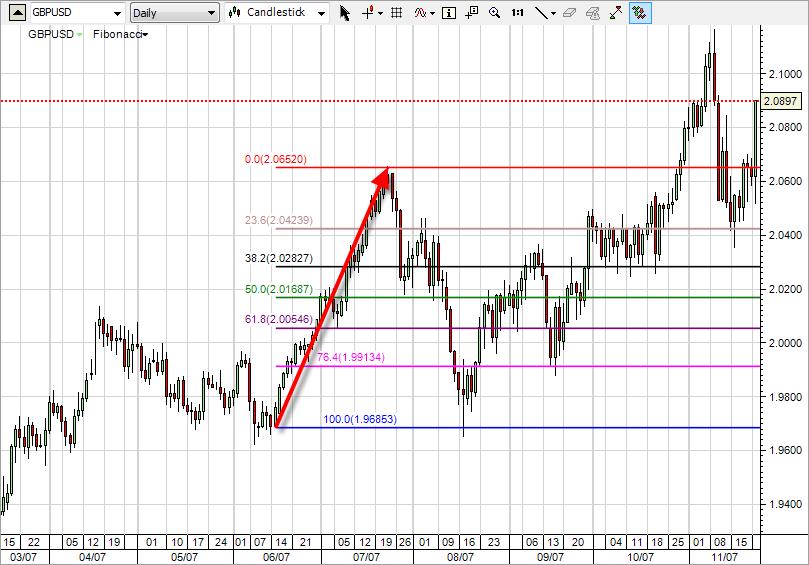
3 FIBONACCI RETRACEMENTS When a currency pair reverses trend, forex traders naturally want to know how far the pair is most likely to move in its new direction. Fibonacci retracement levels can help. Certain Fibonacci ratios are useful when you are trying to determine how far a currency pair is going to retrace, or move against, a previous trend. The ratios you will be using in your forex trading will help you find the following retracement levels: 61.8 percent This level is found by dividing a number in the Fibonacci sequence by the number immediately following it in the sequence (55 89 = 61.8%) percent This level is found by dividing a number in the Fibonacci sequence by the second number following it in the sequence (34 89 = 38.2%) percent This level is found by dividing a number in the Fibonacci sequence by the third number following it in the sequence (21 89 = 23.6%). You will also use three other levels in your retracement analysis. While the following levels are not calculated using numbers within the Fibonacci sequence, they are based on the Fibonacci levels above: 50 percent This level is determined by finding the middle between 61.8 percent and 38.2 percent ((61.8% %) 2 = 50%) percent This level is determined by finding the distance from 38.2 percent and 23.6 percent (38.2% % = 14.6%) and adding it to 61.8 percent (61.8% % = 76.4%). 100 percent This level is determined simply by finding where the previous trend began. Determining all six Fibonacci retracement levels provides you with potential support and resistance levels you can use in your forex trading. You can see these Fibonacci levels on the daily GBP/USD chart below. Each of the illustrated levels was calculated based on the trend highlighted by the red arrow. You could have used each level to help you determine when to enter and exit your trades as the currency pair began to turn around and move lower. 2
4 3
5 Notice how the price of the currency pair moved back and forth, bouncing off of these support and resistance levels for months until finally breaking back up above the high established by the previous trend (also known as the zero percent level) in late October. FIBONACCI PROJECTIONS Trends never go straight up or straight down. Trends move in one direction initially, then they pull back and move in the opposite direction for a while and then they turn around and resume moving in the previous direction. This is the natural ebb and flow of a trend. When a currency pair resumes its previous trend, forex traders naturally want to know how far the pair is most likely to continue moving. Fibonacci projection levels can help. Certain Fibonacci ratios are useful when you are trying to determine how far a currency pair is going to move once it resumes its previous trend. The ratios you will be using in your forex trading will help you find the following projection levels: percent This level is found by dividing a number in the Fibonacci sequence by the number immediately preceding it in the sequence (89 55 = 161.8%) percent This level is found by dividing a number in the Fibonacci sequence by the second number preceding it in the sequence (89 34 = 261.8%) percent This level is found by dividing a number in the Fibonacci sequence by the third number preceding it in the sequence (89 21 = 423.8%). Determining all three Fibonacci projection levels provides you with potential support and resistance levels you can use in your forex trading. You can see these Fibonacci levels on the daily GBP/USD chart below. Each of the illustrated levels was calculated based on the trend highlighted by the red arrow. Now that the GBP/USD has resumed its up trend, you can use each level to help you determine where to set your profit targets (potential exit levels) as you buy this currency pair. 4
6 5
7 Notice that the currency pair, based on the previous trend, has the potential to move up to the percent projection level in the near future. If it reaches this level, you could set the percent projection level as your next profit target level. FIBONACCI FANS Fibonacci levels provide diagonal levels of support and resistance as well as horizontal levels of support and resistance. The diagonal levels of support and resistance are called Fibonacci fans. 4. Draw three lines, each one beginning where the trend began and crossing through a separate point where the vertical line intersects one of the Fibonacci levels Now that you have your Fibonacci fans drawn, you can use them to project potential support and resistance levels that you can use in your forex trading. You can see a Fibonacci fan on the daily GBP/USD chart below. Each of the illustrated levels was calculated based on the trend highlighted by the red arrow. You could have used the rays from the fan to help you determine when to enter and exit your trades as the currency pair began to turn around and move lower. Fibonacci fans are based on three Fibonacci retracement levels 61.8 percent, 50 percent and 38.2 percent. To construct a Fibonacci fan, you have to do the following: 1. Identify a trend 2. Identify the three horizontal Fibonacci levels (61.8 percent, 50 percent and 38.2 percent) as they relate to that trend 3. Draw a vertical line that crosses through these levels at the point where the trend ended 6

8 7
9 Notice how the price of the currency pair bounced off of the middle ray of the Fibonacci fan for a while in early August before it broke through that level and began bouncing off of the bottom ray of the fan for a few days. It is also interesting to see that the levels created by the Fibonacci fan continue to be a factor far into the future. You can see how the GBP/USD bounced down after hitting the bottom ray of the fan four months later in November. 8


10
11 Disclaimer None of the information contained herein constitutes an offer to purchase or sell a financial instrument or to make any investments. Ahli United Bank and/or its affiliates and subsidiaries (hereinafter referred to as the Ahli United Bank ) do not take into account your personal investment objectives or financial situation and make no representation, and assume no liability to the accuracy or completeness of the information provided, nor for any loss arising from any investment based on a recommendation, forecast or other information supplied from any employee of Ahli United Bank, third party, or otherwise. Trades in accordance with the recommendations in an analysis, especially, but not limited to, leveraged investments such as foreign exchange trading and investment in derivatives, can be very speculative and may result in losses as well as profits. You should carefully consider your financial situation and consult your financial advisor(s) in order to understand the risks involved and ensure the suitability of your situation prior to making any investment or entering into any transactions. All expressions of opinion are subject to change without notice. Any opinions made may be personal to the author and may not reflect the opinions of Ahli United Bank. Please furthermore refer to Ahli United Bank's full General Disclaimer:
Chapter 4.2. Technical Analysis: Fibonacci
 1 Chapter 4.2 Technical Analysis: Fibonacci 0 Contents TECHNICAL ANALYSIS: FIBONACCI Fibonacci analysis is the study of identifying potential support and resistance levels in the future based on past price
Chapter 4.2. Technical Analysis: Fibonacci
 1 Chapter 4.2 Technical Analysis: Fibonacci 0 Contents TECHNICAL ANALYSIS: FIBONACCI Fibonacci analysis is the study of identifying potential support and resistance levels in the future based on past price
Chapter 1.4 Trends 0
 Chapter 1.4 Trends 0 TECHNICAL ANALYSIS: TRENDS, SUPPORT AND RESISTANCE Charts, charts, charts. When most people think about trading Forex, they think about watching price movements flash by them on the
Chapter 2.3. Technical Analysis: Technical Indicators
 Chapter 2.3 Technical Analysis: Technical Indicators 0 TECHNICAL ANALYSIS: TECHNICAL INDICATORS Charts always have a story to tell. However, from time to time those charts may be speaking a language you
INTERMEDIATE EDUCATION GUIDE
 INTERMEDIATE EDUCATION GUIDE CONTENTS Key Chart Patterns That Every Trader Needs To Know Continution Patterns Reversal Patterns Statistical Indicators Support And Resistance Fibonacci Retracement Moving
Chapter 1.3. Technical Analysis: Trends, Support and Resistance
 1 Chapter 1.3 Technical Analysis: Trends, Support and Resistance 0 Contents TECHNICAL ANALYSIS: TRENDS, SUPPORT AND RESISTANCE Stocks are rising. Stocks are falling. If you watch or read financial news
Forex Price Direction Analysis.
 Forex Price Direction Analysis. September 24 2010 1 Sign Up Now to Upshots forex trade signals disclaimer The information provided in this report is for educational purposes only. It is not a recommendation
Chapter 4.1. Market Rotations
 1 Chapter 4.1 Market Rotations 0 Contents MARKET ROTATIONS Stock markets ebb and flow as investors move their money in and out of the markets themselves as well as in and out of various sectors within
This is the complete: Fibonacci Golden Zone Strategy Guide
 This is the complete: Fibonacci Golden Zone Strategy Guide In this strategy report, we are going to share with you a simple Fibonacci Trading Strategy that uses the golden ratio which is a special mathematical
TRADE SIGNALS POWERED BY AUTOCHARTIST
 SAXO TRADER GO TRADE SIGNALS POWERED BY AUTOCHARTIST Trade Signals is a SaxoTraderGO tool that uses Autochartist technology to identify emerging and completed patterns in most leading financial markets.
TRADE SIGNALS POWERED BY AUTOCHARTIST
 TRADE SIGNALS POWERED BY AUTOCHARTIST Trade Signals is a powerful tool available in BiGlobal Trade for identifying trading opportunities based on chart patterns using Autochartist technology. As an introduction
Chapter 2.3. Technical Indicators
 1 Chapter 2.3 Technical Indicators 0 TECHNICAL ANALYSIS: TECHNICAL INDICATORS Charts always have a story to tell. However, sometimes those charts may be speaking a language you do not understand and you
TRADE SIGNALS POWERED BY AUTOCHARTIST
 SAXO TRADER GO TRADE SIGNALS POWERED BY AUTOCHARTIST Trade Signals is a SaxoTraderGO tool that uses Autochartist technology to identify emerging and completed patterns in most leading financial markets.
TRADE SIGNALS POWERED BY AUTOCHARTIST
 SAXO TRADER GO TRADE SIGNALS POWERED BY AUTOCHARTIST Trade Signals is a SaxoTraderGO tool that uses Autochartist technology to identify emerging and completed patterns in most leading financial markets.
TRADE SIGNALS POWERED BY AUTOCHARTIST
 SAXO TRADER GO TRADE SIGNALS POWERED BY AUTOCHARTIST Trade Signals is a SaxoTraderGO tool that uses Autochartist technology to identify emerging and completed patterns in most leading financial markets.
Trading the Hidden Divergence. Presented by Sunil Mangwani
 Trading the Hidden Divergence Indicators in technical analysis. Indicators along with chart patterns, trend lines, resistance / support levels etc., are an essential part of technical analysis. But there
Technical Analysis. Dealing Room Peter Leonidou. Peter Leonidou
 Technical Analysis Dealing Room Questions Traders Should Ask What is the trend? What is the pivot point? What is the support levels? What is the resistance levels? Strong or weaker USD? What 1. Trade
FOREX. analysing made easy. UNDERSTANDING TECHNICAL ANALYSIS An educational tool by Blackwell Global
 FOREX analysing made easy UNDERSTANDING TECHNICAL ANALYSIS An educational tool by Blackwell Global Risk Warning: Forex and CFDs are leveraged products and you may lose your initial deposit as well as substantial
Chapter 3.3. Price Patterns
 1 Chapter 3.3 Price Patterns 0 TECHNICAL ANALYSIS: PRICE PATTERNS Traders vote with their chequebooks. If they believe a stock or CFD is going to move higher then they will buy the stock or CFD. If they
Fibonacci Retracement Waiting for the Right Moment. The Fibonacci sequence is a series of numbers that were first derived by Leonardo of Pisa in the
 Author: Ng Ee Hwa, Market Strategist for ChartNexus Fibonacci Retracement Waiting for the Right Moment IT has been 3 years since the Singapore stock market begun its amazing bull run, scaling to new highs
Part 1. ForEx Easy Mode
 Part 1 DISCLAIMER Any income claims are typical of top performers not all users and your results will vary. Past performance of any system is not indicative of future results. Trading foreign exchange
Naked Trading and Price Action
 presented by Thomas Wood MicroQuant SM Divergence Trading Workshop Day One Naked Trading and Price Action Risk Disclaimer Trading or investing carries a high level of risk, and is not suitable for all
Chapter 1.5. Money Management
 Chapter 1.5 Money Management 0 Contents MONEY MANAGEMENT The most important part of investing is money management. Money management involves determining how much of your overall portfolio you are willing
The Engulfing Trader Copyright 2014
 Www.ForexWinners.Ru Prologue and Introduction This book is for all those that are just fed up with all the hype out there in the market. So called guru s selling expensive strategies and systems guaranteeing
Copyright by Profits Run, Inc.
 The Truth About Fibonacci Trading 2 Disclaimer: Forex, stock, futures, and options trading is not appropriate for everyone. There is a substantial risk of loss associated with trading these markets. Losses
Neal Hughes "FibMaster"
 This Lesson Can Be Printed See Instructions Below Neal Hughes "FibMaster" We are indeed fortunate in this lesson to have Neal Hughes give some of his time and explain some of the basics of Fibonacci trading.
Fibonacci s: Hidden Support & Resistance DENNIS W. WILBORN, SR.
 Fibonacci s: Hidden Support & Resistance WWW.ACTIVETRENDTRADING.COM DENNIS W. WILBORN, SR. DWW@ACTIVETRENDTRADING.COM Disclaimer U.S. GOVERNMENT REQUIRED DISCLAIMER COMMODITY FUTURES TRADING COMMISSION
Chapter 3.1. Hedging with CFDs
 1 Chapter 3.1 Hedging with CFDs 0 Contents HEDGING WITH CFDS Successful share and CFD traders realize that protecting the money they have is just as important, if not more so, than earning more money from
Technical Analysis Basics. Identifying Tops
 Technical Analysis Basics. Identifying Tops June 2011 1 Sign Up Now to Upshots forex trade signals disclaimer The information provided in this report is for educational purposes only. It is not a recommendation
INTRODUCTION 2 INSTALLATION AND CHART SETUP 3 BUY AND SELL ZONES 4 BBOX TICKSPEED INDICATOR 6 TRADING RULES AND CONDITIONS 7
 BLACK-BφX.COM INTRODUCTION 2 INSTALLATION AND CHART SETUP 3 BUY AND SELL ZONES 4 BBOX TICKSPEED INDICATOR 6 TRADING RULES AND CONDITIONS 7 BUY CONDITIONS 7 SELL CONDITIONS 9 IMPORTANT NOTES: 11 TAKE PROFIT
FOREX INDICATORS. THEIR PRIORITY and USE
 FOREX INDICATORS THEIR PRIORITY and USE by G. C. Smith U.S. Government Required Disclaimer Trading foreign exchange markets on margin carries a high level of risk, and may not be suitable for all investors.
very High Probability High Risk/Reward Ratio Risk Management Capital Efficiency
 First, I look for Stocks and ETF s (Exchange Trades Funds) to TRADE, this is different than a long term Buy and Hold investment strategy. The typical time that I hold each Stock or ETF is one month to
US Dow Jones Index / US30Cash (Weekly chart) System price target 14,720.00
 System price target 14,720.00") DAILY TECHNICAL US Dow Jones Index / US30Cash (Weekly chart) System price target 14,720.00 Tuesday, February 04, 2014 S1=14,705.00 Support R1=16,551.00 ADX Signal Comment: Short positions for the US Dow
DAILY TECHNICAL US Dow Jones Index / US30Cash (Weekly chart) System price target 14,720.00 Tuesday, February 04, 2014 S1=14,705.00 Support R1=16,551.00 ADX Signal Comment: Short positions for the US Dow
Chapter 4.3. Speculating with CFDs
 1 Chapter 4.3 Speculating with CFDs 0 Contents SPECULATING WITH CFDS Traders often have moments when they feel the stars are aligned to favour a particular trade. And, though they may not be able to explain
THE TRUTH ABOUT FIBONACCI TRADING
 PRESENTS THE TRUTH ABOUT FIBONACCI TRADING ALL TRADING INFORMATION REVEALED 1 INTRODUCTION The truth about Fibonacci levels is that they are useful (like all trading indicators). They do not work as a
This strategy is suitable for all currency pairs listed on the broker s platform, especially the seven major currency pairs of:
 STRATEGY 11: THE PENDULUM In the previous strategy, we explored a technique that helps us to anticipate a range with the help of the stochastic indicator and also trade it in the early stages of formation.
TABLE OF CONTENTS C ORRELATION EXPLAINED INTRODUCTION...2 CORRELATION DEFINED...3 LENGTH OF DATA...5 CORRELATION IN MICROSOFT EXCEL...
 Margined Forex trading is a risky form of investment. As such, it is only suitable for individuals aware of and capable of handling the associated risks. Funds in an account traded at maximum leverage
Trends. Define the term Trend Explain why Trend is important Identify Primary, Secondary, and Short-Term trends
 Trends Define the term Trend Explain why Trend is important Identify Primary, Secondary, and Short-Term trends 1 What is a Trend? Uptrend Prices rise and fall in Trends Trend is defined as: Up (Rising)
Introduction 3. Charts: line, bar and candle 4. Critical price levels 6
 Contents page Introduction 3 Charts: line, bar and candle 4 Critical price levels 6 Resistance, support and pivot points 6 Definitions 6 Reasoning 7 Pivot points 8 Fibonacci retracements 9 Relative Strength
 This material is protected under the Digital Millennium Copyright Act of 1998 and various international treaties. This material may not be replicated and redistributed. You may make one or more copies
Chapter 3.1. Capital and Trade Flow Drive Currency Values
 Chapter 3.1 Capital and Trade Flow Drive Currency Values 0 Contents CAPITAL AND TRADE FLOW DRIVE CURRENCY VALUES Supply and demand are the simple concepts behind all price movement in the forex market,
Three skills to help you trade forex
 Three skills to help you trade forex AN INTRODUCTION TO TRADING CURRENCIES A FOREX.com educational guide FOREX.com is a trading name of GAIN Capital UK Limited, FCA No. 113942. Our services include products
SHADOWTRADERPRO FX TRADER USERS GUIDE
 SHADOWTRADERPRO FX TRADER USERS GUIDE How to get maximum value from your ShadowTraderPro FX Trader subscription. ShadowTraderPro FX Trader delivers value to its subscribers on multiple levels. The newsletter
WELCOME
 www.facebook.com/fxdd www.twitter.com/fxdd WELCOME Part 1: Building the Forex Traders Foundation Greg Michalowski Email: greg@fxdd.com www.livestream.com/fxdd www.fxddnow.com Twitter: gregmikefx Disclaimer
Methodology. Our team of analysts uses technical and chartist analysis to draw an opinion and make decisions. The preferred chartist elements are:
 Methodology Technical analysis is at the heart of TRADING CENTRAL's expertise. Our methodology is proven. Our chartist and quantitative approach allows us to intervene on different investment horizons.
What Came First... Fundamentals or the Technicals? By Jared Martinez
 What Came First... Fundamentals or the Technicals? By Jared Martinez I am honored to share my thoughts on our methodologies, focusing on the current technical movements and conditions of the FOREX Markets,
Williams Percent Range
 Williams Percent Range (Williams %R or %R) By Marcille Grapa www.surefiretradingchallenge.com RISK DISCLOSURE STATEMENT / DISCLAIMER AGREEMENT Trading any financial market involves risk. This report and
Raising Investment Standards TRADING SEMINAR
 Raising Investment Standards TRADING SEMINAR Raising Investment Standards DISCLAIMER Leveraged foreign exchange and options trading carries a significant level of risk, and may not be suitable for all
SCALAR ANALYSIS (S.A.) IN FINANCIAL TECHNICAL TRADING. A View of the Markets in a Different Angle. By Ramoncito D. Ulep, CTA/CPO Investment Advisor
 IN FINANCIAL TECHNICAL TRADING. A View of the Markets in a Different Angle. By Ramoncito D. Ulep, CTA/CPO Investment Advisor") Page 1 of 13 SCALAR ANALYSIS (S.A.) IN FINANCIAL TECHNICAL TRADING A View of the Markets in a Different Angle By Ramoncito D. Ulep, CTA/CPO Investment Advisor FXA USA 40 Wall St. 28 th Floor New York,
Page 1 of 13 SCALAR ANALYSIS (S.A.) IN FINANCIAL TECHNICAL TRADING A View of the Markets in a Different Angle By Ramoncito D. Ulep, CTA/CPO Investment Advisor FXA USA 40 Wall St. 28 th Floor New York,
Follow Price Action Trends By Laurentiu Damir Copyright 2012 Laurentiu Damir
 Follow Price Action Trends By Laurentiu Damir Copyright 2012 Laurentiu Damir All rights reserved. No part of this book may be reproduced or transmitted in any form or by any means, electronic or mechanical,
EJ_4H Method Part III
 EJ_4H Method Part III Trailing price: Protecting your hard-earned money against reversals or even flurries is one of the most important parts of money management. Most of platforms have such feature that
Copyright Alpha Markets Ltd.
 Page 1 Trading Strategies - Module 3 Welcome to this unit on Trading Strategies. In this module we will be explaining the core components of a trading strategy and how you can begin to incorporate analysis
CMS Prime DAILY MARKET REPORT
 CMS Prime DAILY MARKET REPORT April 25, 2018 EURUSD 1.2210 (SL) with targets at 1.2245 and 1.2265 1.2210 with targets at 1.2180 and 1.2150 Resistance 1 : 1.2245 Resistance 2 : 1.2265 Resistance 3 : 1.2290
CMS Prime DAILY MARKET REPORT
 CMS Prime DAILY MARKET REPORT May 14, 2018 EURUSD BULLISH BIAS long position at 1.1960 with SL : 1.1925 and with targets at 1.1990 and 1.2020 short position at 1.1925 with SL : 1.1970 and with targets
The Avalanche (Reverse for a Phoenix )
") The Avalanche (Reverse for a Phoenix ) The 6 Building Blocks of Price Development (Ideal Scenario): Momentum: Above average pace on the reversal from highs, followed by slower than average upside as support
The Avalanche (Reverse for a Phoenix ) The 6 Building Blocks of Price Development (Ideal Scenario): Momentum: Above average pace on the reversal from highs, followed by slower than average upside as support
The Fish Hook Pattern
 The Fish Hook Pattern GOAL The Fish Hook Pattern is a trade entry method that is mentioned from time to time in Jim s Chartbook and on the Premium Alert Service. The idea behind the Fish Hook is that it
The Truth About Fibonacci. Trading
 The Truth About Fibonacci Trading 2 The Truth About Fibonacci Trading The truth about Fibonacci levels is that they are useful (like all trading indicators). They do not work as a standalone system of
CMS PRIME DAILY MARKET REPORT
 CMS PRIME DAILY MARKET REPORT August 17, 2018 EURUSD long position at 1.1380 with SL : 1.1350 and with targets at 1.1400 and 1.1430 short position at 1.1350 with SL : 1.1400 and with targets at 1.1330
The Best Gann Fan Trading Strategy
 The Best Gann Fan Trading Strategy The best Gann fan trading strategy is a complex support and resistance trading strategy that uses diagonal support and resistance levels. Unlike the traditional horizontal
Ichimoku Kinko Hyo System PDF Strategy Guide + MT4 Indicator Download
 Ichimoku Kinko Hyo System PDF Strategy Guide + MT4 Indicator Download ForexStrategiesWork.com Congratulations! You might not know it yet but you are in for a REAL treat in the Forex World. You now have
FX Trend Radar Manual
 C O D I N G T R A D E R. C O M FX Trend Radar Manual Version 1.00 Table of Contents FX Trend Radar... 1 What is FX Trend Radar?... 1 Installation... 2 Configurations... 9 How to use FX Trend Radar... 11
Real Life Fibonacci Trading & Dynamic Targeting with MQ Trend
 presented by Thomas Wood MicroQuant SM Divergence Trading Workshop Day One Real Life Fibonacci Trading & Dynamic Targeting with MQ Trend Risk Disclaimer Trading or investing carries a high level of risk,
In the Charts Forex. Today s key points. CROSS ASSET TECHNICAL ANALYSIS 01 October 2013
 CROSS ASSET TECHNICAL ANALYSIS 01 October 2013 In the Charts Forex Today s key points EUR/USD has given a break above the weekly channel resistance of 1.3454/20 which also happens to be 76.4% retracement
US Dow Jones Index / US30Cash (DAILY CHART) System price target 15,660.00
 System price target 15,660.00") DAILY TECHNICAL US Dow Jones Index / US30Cash (DAILY CHART) System price target 15,660.00 Thursday, January 30, 2014 S1=15,660.00 Support R1=16,564.00 R2=16,048.00 ADX Signal Comment: Short positions for
DAILY TECHNICAL US Dow Jones Index / US30Cash (DAILY CHART) System price target 15,660.00 Thursday, January 30, 2014 S1=15,660.00 Support R1=16,564.00 R2=16,048.00 ADX Signal Comment: Short positions for
Rule One Transformational Investing Webinar #13
 Rule One Transformational Investing Webinar #13 Webinar #13 Review The Process Finding a Wonderful Company WFM is a company that I use, a company that reflects my values, that will be bigger and better
THE FOREX TRADING GUIDE TECHNICAL ANALYSIS CHART PATTERNS
 1 Copyright 2016 TradingSpine All rights reserved by TradingSpine. No parts of this work may be reproduced in any form or by any means - graphic, electronic, or mechanical, including photocopying, recording,
If you have traded forex long enough, you will notice that sometimes, price has an uncanny ability to reverse exactly at or around fibonacci levels.
 Fibonacci Forex Trading Strategy With Reversal Candlesticks The Fibonacci forex trading strategy with reversal candlesticks is simply about using fibonacci retracements in conjunction with reversal candlesticks.
Three Techniques for Spotting Market Twists and Turns. Riding the Roller
 Three Techniques for Spotting Market Twists and Turns Riding the Roller Coaster Learn to Spot the Twists and Turns Whether you re new to forex or you ve been trading a while, you know how the unexpected
TECHNICAL INDICATORS
 TECHNICAL INDICATORS WHY USE INDICATORS? Technical analysis is concerned only with price Technical analysis is grounded in the use and analysis of graphs/charts Based on several key assumptions: Price
Forex Renko Charts FX Trading System
 Forex Renko Charts FX Trading System Disclaimer FOREX trading, online foreign exchange trading, foreign currency trading and Forex options trading involves risk of loss and is not appropriate for all investors.
Table of Contents. Risk Disclosure. Things we will be going over. 2 Most Common Chart Layouts Anatomy of a candlestick.
 Table of Contents Risk Disclosure Things we will be going over 2 Most Common Chart Layouts Anatomy of a candlestick Candlestick chart Anatomy of a BAR PLOT Indicators Trend-Lines Volume MACD RSI The Stochastic
STATISTICAL INDICATOR
 STATISTICAL INDICATOR FOREX LIBRA CODE This short manual aims to explain how to use and apply the Statistical indicator which is part of the Forex Libra Code software. The Statistical indicator is available
.. /-!"::- '..- ( \.- - '-/../ '
 ....'-/ -!"::- ' ( \.-../ ' /- Triple Shot Forex Trading System The term "Day Trading" usually refers to the act of buying and selling a financial instrument within the same day. In the Forex market, a
DAILY TECHNICAL REPORT
 RESEARCH TEAM DAILY TECHNICAL REPORT DISCLAIMER & DISCLOSURES Please read the disclaimer and the disclosures which can be found at the end of this report EUR / USD Continued selling pressures. EUR/USD
Gold. Silver. Applicable for: Wednesday 31 August 2016, Trend BEARISH SELL TP SL
 Applicable for: Wednesday 31 August 2016, Gold SELL 1321.16 TP 1304.89 SL 1331.39 Yesterday GOLD closed at 1310.92 If it breaks the resistance levels at 1321.16 the aim will be reaching and testing the
SIMPLE PIPS GENERATING MACHINE
 THE SIMPLE PIPS GENERATING MACHINE SPGM-5 The news break snatcher By EKONYE G. KINGX d_analyst www.loooopfx.blogspot.com 1 SPGM-5 The News Break Snatcher INTRODUCTION The news break snatcher is the 5 th
Wave-to-Wave Trading Analysis June 1, 2012
 Trading Wave-to-Wave 1 Wave-to-Wave Trading Analysis June 1, 2012 S&P 500 Index ETF (SPY) Successful traders understand that there are waves within waves 5-minute waves inside of 60-minute waves inside
MULTI-TIMEFRAME TREND TRADING
 1. SYNOPSIS The system described is a trend-following system on a slow timeframe that uses optimized (that is, contrarian) entries and exits on a fast timeframe at the tops and bottoms of retraces against
Trade the Price Action By Laurentiu Damir. Copyright 2012 Laurentiu Damir
 Trade the Price Action By Laurentiu Damir Copyright 2012 Laurentiu Damir All rights reserved. No part of this book may be reproduced or transmitted in any form or by any means, electronic or mechanical,
Harmonic Volatility Line Indicator
 Harmonic Volatility Line Indicator Subtitle: Alternative Approach to Gann s Angle Author: Young Ho Seo Finance Engineer and Quantitative Trader Book Version: 1.7 (13 May 2017) Total Pages counted in MS-Word:
Resistance to support
 1 2 2.3.3.1 Resistance to support In this example price is clearly consolidated and we can expect a breakout at some time in the future. This breakout could be short or it could be long. 3 2.3.3.1 Resistance
Gold. Silver. Applicable for: 16th August 2016, Tuesday. Trend NEUTRAL BUY TP
 Applicable for: 16th August 2016, Tuesday Gold Trend NEUTRAL BUY 1335.28 TP 1343.35 SL 1331.41 Yesterday GOLD closed at 1339.15 If it breaks the resistance levels at 1343.35 the aim will be reaching and
 Types of charts Bar charts Candlestick charts Constant volume charts Line charts Tflow charts, exclusively CQG Bar Charts Vertical line representing the high and low of the sessions Horizontal line on
3 Price Action Signals to Compliment ANY Approach to ANY Market
 3 Price Action Signals to Compliment ANY Approach to ANY Market Introduction: It is important to start this report by being clear that these signals and tactics for using Price Action are meant to compliment
Technical Analysis Workshop Series. Session Three
 Technical Analysis Workshop Series Session Three DISCLOSURES & DISCLAIMERS This research material has been prepared by NUS Invest. NUS Invest specifically prohibits the redistribution of this material
CMS Prime DAILY MARKET REPORT
 CMS Prime DAILY MARKET REPORT May 09, 2018 EURUSD BEARISH BIAS short position at 1.1855 with SL : 1.1900 and with targets at 1.1835 and 1.1800 long position at 1.1900 with SL : 1.1835 and with targets
Presents FOREX ALPHA CODE
 Presents FOREX ALPHA CODE Forex Alpha Code Published by Alaziac Trading CC Suite 509, Private Bag X503 Northway, 4065, KZN, ZA www.tradeology.com Copyright 2014 by Alaziac Trading CC, KZN, ZA Reproduction
EZ Trade FOREX Day Trading System. by Beau Diamond
 EZ Trade FOREX Day Trading System by Beau Diamond The EZ Trade FOREX Day Trading System is mainly used with four different currency pairs; the EUR/USD, USD/CHF, GBP/USD and AUD/USD, but some trades are
Everything you need to know about the trade alerts you ve been hearing about.
 11 YEAR Everything you need to know about the trade alerts you ve been hearing about. SCORECARD RESULTS FULL MARKET BREAKDOWN COMPLETE ALERT DETAILS INSTITUTIONAL-GRADE TRADE ALERTS: FUTURES, FOREX & INDICES
Forex Range Trading With Price Action Forex Trading System By Laurentiu Damir
 Forex Range Trading With Price Action Forex Trading System By Laurentiu Damir Copyright 2012 by Laurentiu Damir All rights reserved. No part of this book may be reproduced or transmitted in any form or
1. Introduction 2. Chart Basics 3. Trend Lines 4. Indicators 5. Putting It All Together
 Technical Analysis: A Beginners Guide 1. Introduction 2. Chart Basics 3. Trend Lines 4. Indicators 5. Putting It All Together Disclaimer: Neither these presentations, nor anything on Twitter, Cryptoscores.org,
FOREX PROFITABILITY CODE
 FOREX PROFITABILITY CODE Forex Secret Protocol Published by Old Tree Publishing CC Suite 509, Private Bag X503 Northway, 4065, KZN, ZA www.oldtreepublishing.com Copyright 2013 by Old Tree Publishing CC,
Forex Sentiment Report Q2 FORECAST WEAK AS LONG AS BELOW April
 Forex Sentiment Report 08 April 2015 www.ads-securities.com Q2 FORECAST WEAK AS LONG AS BELOW 1.1200 Targets on a break of 1.1534/35: 1.1740/50 1.1870/75 1.2230/35 Targets on a break of 1.0580/70: 1.0160
GOLD: Was that the low? September 18, 2018
 GOLD: Was that the low? September 18, 2018 In early 2018 the sentiment on gold was running high. After failing on multiple attempts to deliver new highs, that began to gradually change. The net commercial
The Gann Analysis Rule Book
 2006 Gann Managament Ltd. All Rights Reserved. Gann Management Limited is authorised and Regulated by the Financial Services Authority The Gann Analysis Rule Book A Man Who Never Changes His Mind Will
MagicBreakout Forex Trading Strategy
 Tim Trush & Julie Lavrin introduce MagicBreakout Forex Trading Strategy Your guide to financial freedom. Tim Trush, Julie Lavrin, T&J Profit Club, 2007, All rights reserved www.magicbreakout.com Table
Fibo Vector Published by Old Tree Publishing CC Suite 509, Private Bag X503 Northway, 4065, KZN, ZA
 Fibo Vector Published by Old Tree Publishing CC Suite 509, Private Bag X503 Northway, 4065, KZN, ZA www.oldtreepublishing.com Copyright Old Tree Publishing CC, KZN, ZA Reproduction or translation of any
Nihilist Trend Strength
 2015 Nihilist Trend Strength A Forex Trend Following System This System is designed to follow the currency trend and it s power without stressing any more with charts, our aim to trade Risk free trades
Pull up the chart utilizing as much window real estate as possible.
 Darin s Trend Channel method as I understand it. I have Darin s ok as to sharing his method. So Darin if I have any of this wrong or you wish to add to it or make comments. Please feel free to make changes