Figure 3.6 Swing High
|
|
|
- Kory Horton
- 6 years ago
- Views:
Transcription
 as a price bar high, preceded by two lower highs (LH) and followed by two lower highs (LH), as per")
1 Swing Highs and Lows A swing high is simply any turning point where rising price changes to falling price. I define a swing high (SH) as a price bar high, preceded by two lower highs (LH) and followed by two lower highs (LH), as per the following diagram:

2 Figure 3.6 Swing High Referring to figure 3.6, the Swing High is candle C. All other candles reference this one. Candle A has a high which is LOWER THAN candle C's high. Candle B has a high which is LOWER THAN candle C's high. Candle D has a high which is LOWER THAN candle C's high. Candle E has a high which is LOWER THAN candle C's high. Note that candle A s high does not have to be lower than B. All highs only reference the high of C. Likewise for the swing low. A swing low is simply any turning point where falling price changes to rising price. I define a swing low (SL) as a price bar low, preceded by two higher lows (HL) and followed by two higher lows (HL), as per the following diagram:
3
4 Figure 3.9 Swing Low The Swing Low in figure 3.9 is candle C. All other candles reference this one. Candle A has a low which is HIGHER THAN candle C's low. Candle B has a low which is HIGHER THAN candle C's low. Candle D has a low which is HIGHER THAN candle C's low. Candle E has a low which is HIGHER THAN candle C's low. Again note that candle A s low does not have to be higher than B. All lows only reference the low of C. Trend Definition Trend Support and Resistance Swing Highs & Lows The principles governing price movement are the same on all timeframes. Price moves as a function of supply and demand. It moves between areas of previous supply/demand imbalance, which are defined as support or resistance. On our higher timeframe (30 min) we defined a structure based upon higher timeframe support
5 and resistance. Within that structure, price still moves between areas of shorter timeframe support and resistance. On the trading timeframe (3 min) I simply refer to them as swing highs (SH) and swing lows (SL), as demonstrated in figure 3.32 below. Figure 3.32 Trend Swing Highs & Lows Trend Direction Price movement between these swing H/L will form into trends; either as an uptrend, downtrend or a sideways trend (trading range). Uptrend - Definition An uptrend comprises a repeating sequence of: 1) An upward extension 2) A swing high 3) A downward pullback 4) A swing low This is demonstrated below in figure 3.34, where you ll also notice a few other key observations: The price extensions are longer than the pullbacks. Extensions will break above previous swing high, reaching new price highs for that trend. Pullbacks will not break below previous swing lows. This results in a series of higher swing highs and higher swing lows.
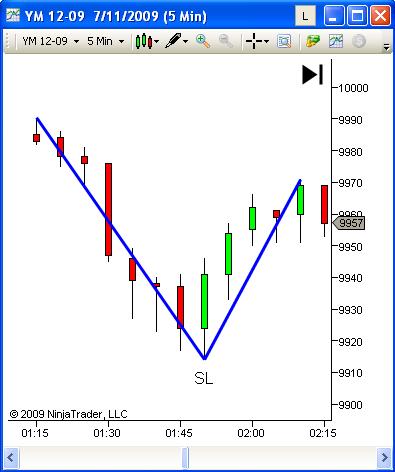
6 Figure 3.34 Uptrend Diagram Figure 3.35 Uptrend - Chart An uptrend ends when price breaks the swing low which leads to the highest swing high of the trend. We ll demonstrate that in figure 3.36 below.

7 Figure 3.36 Uptrend End Failure to break the swing low that leads to the highest high, could simply indicate a complex pullback rather than a reversal, as demonstrated below in figure 3.37.
8 Figure 3.37 Complex Pullback Leading to Uptrend Continuation Downtrend - Definition A downtrend comprises a repeating sequence of: 1) A downward extension 2) A swing low 3) An upward pullback 4) A swing high This is demonstrated below in figure 3.38, where you ll also notice a few other key observations: The price extensions are longer than the pullbacks. Extensions will break below previous swing lows, reaching new price lows for that trend. Pullbacks will not break above previous swing highs. This results in a series of lower swing lows and lower swing highs. Figure 3.38 Downtrend Diagram
9 Figure 3.39 Downtrend - Chart A downtrend ends when price breaks the swing high which leads to the lowest swing low of the trend. Let s demonstrate that below, in figure Figure 3.40 Downtrend End

10 Failure to break the swing high that leads to the lowest swing low, could simply indicate a complex pullback rather than a reversal, as demonstrated below in figure Figure 3.41 Complex Pullback Leading to Downtrend Continuation Sideways Trend - Definition A sideways trend comprises a series of price swings existing within the range of a significant upper resistance area and a significant lower support area. The range support and resistance boundaries (range lower and upper boundaries) may be formed from either higher timeframe S/R and/or significant trading timeframe swing highs or lows.


11 Figure 3.42 Sideways Trend Diagram Figure 3.43 Sideways Trend - Chart I define the official start of a sideways trend as follows:
12 A sideways trend starts when four trend turning points (SH and SL) develop within the range of a previous price swing. Figure 3.44 Sideways Trend Start Less than four turning points may simply be a complex (three swing) pullback rather than a change of trend. Four turn points are required to indicate a change to a sideways trend.
13 Figure 3.45 Complex Pullback Vs Sideways Trend I define the official end of a sideways trend as price breaking either the high or low which define the sideways trend.
14 Figure 3.46 Sideways Trend End Trend Definition Applying Subjectivity As we discovered earlier, the market cannot be defined by fixed rules or mathematical models. It s an emotional beast. Every attempt to objectively define a trend will break down at some point in time. Regardless of how you define the trend, at some point in time it will produce a pullback that goes just far enough to trigger an objective trend definition change, before reversing to continue in the original trend direction. Subjective definitions are superior, although difficult for newer traders to accept. A pullback against a trend that triggers an objective trend definition change, but then fails, may not change the subjective trend definition. Let s look at an example We have here what is visually easy to identify as a downtrend. Following the strict definition of swing highs and lows, and trend change, we find that the trend changed from a downtrend to an uptrend by one tick (at point 3), before reversing and continuing downwards again. Figure Trend Definition Failure Swing H/L Upon making the break, does price quickly reject this new area and return back to the original trend definition, or does price hold the break and then continue?
15 Let s reproduce the price action from figure 3.47, now Figure Defining Trend Change through Subjective Assessment of Acceptance or Rejection In this case, the downtrend now remains intact, as we see no evidence of acceptance of breakout prices. The trend will not be considered to have changed, until we see confirmed evidence of a behavioral change. Subjectivity allows for breaks of definition relying on these breaks to show the way forward, through how price reacts at these key times. Will it hold beyond that level (price acceptance) or fail (price rejection)? Tests of the areas of objective trend change are great sources of information about the future trend. When you think about it, we can take this even further. A subjective assessment of price acceptance after the break of trend definition, really means that the trend is simply whatever it appears to be visually. This doesn t mean we re totally guessing the trend. We are aware of our swing high/low trend definition, but then apply some subjectivity over top of that. Essentially, if it looks like an uptrend (price appears to be moving from the lower left to the upper right) it is an uptrend. If it looks like a downtrend (price appears to be moving from the upper left to the lower right) it is a downtrend. Anything else is a sideways trend. All other rules are secondary to this.
16 Through practice you will become comfortable with a subjective assessment of trend direction, and also a subjective assessment of which swing highs and lows you consider significant. Our discussion (coming shortly) on assessing the strength or weakness of the trend will assist greatly in your ability to subjectively assess the trend direction at the points of objective trend break. Don t make this more complex than it needs to be. A trend is a general tendency for price movement in one direction. Your mind is much more capable of identifying this trend, than any objective definition. And if you get it wrong price behavior will very quickly alert you to this fact. Trend Examples Figure 3.50 Uptrend Downtrend - Uptrend In this first example, we have an uptrend defined by swing low A, swing high B, swing low C, swing high D, swing low E, swing high F, swing low G and swing high H. I marked F and G due to the significance of G. As a candle which initially moved downwards continuing the move lower after F s retest of D, it then reversed quickly to rally back upwards. The speed of this move will have trapped some shorts in losing positions. It s a significant area and therefore suitable for selection as a swing low. Should price break below this level it indicates a change in the supply/demand dynamics of this market. Swing low G is therefore the last swing low before the highest swing high H. The change of objective trend definition from uptrend to downtrend therefore occurs on the break of the lows of swing low G, as marked.
17 Applying some subjectivity though, we want to see evidence of price accepting this change. The first close below the trend change level was strongly bearish, and it was followed by three weak bullish candles, indicating a lack of demand (if there was significant demand, price would have rejected the breakout and rallied back up through the level). Continuation lower confirms our trend change. Also, applying our if it looks down, then it is down rule, the acceleration down to I followed by the weak pullback to J, just makes this look like downward strength to me. The downtrend continues from swing high H to swing low I, congestion J, swing low K, swing high L, swing low M. Swing high L was the last swing high before swing low M. Price breaking above L indicates a change back to uptrend, in accordance with our objective trend definition. The next candle shows a pause. Subjectively, a trend change looks a possibility given the rapid move up into the area of L, but more information will be needed in the next candle or two, to accept a change to an uptrend, or reject this and continue down. In this next example, figure 3.51 below, we have an uptrend defined by swing low A, swing high B, swing low C, swing high D, swing low E and swing high F. Note that swing low E does NOT lead price up to new highs, as swing high F does NOT exceed the highs at D. This means that price breaking below E does NOT trigger a change of trend, but rather a complex pullback. Price would need to break below C in order to trigger a change to downtrend, which of course did not occur in this example. Figure 3.51 Uptrend with Complex Pullback The 3-swing retrace through E, F and G was followed by a continuation of the uptrend through to new highs at H.
, (c) and (e).")
18 1) Compare the momentum of the current price swing with the momentum of the previous price swing in the same direction? Is price faster or slower than before? What does that mean? Refer to the left hand side of figure 3.58, where we see a downtrend weakening and reversing direction to become an uptrend. Compare the slope of down-swings (a), (c) and (e). Note the decreased speed on each of these legs, indicating a reduction in bearish momentum. Weakness is appearing on the bearish side. Compare the slope of upswings (b) and (d). Note the increasing speed on each of these legs, indicating an increase in bullish momentum. Bullish price swings are showing signs of strength. Price movement is more likely to continue in the direction of strength and against the direction of weakness. The market reverses as strengthening bullish momentum overcomes the weakening bearish momentum. Figure Momentum Comparison Same Direction Swings 1 of 2 Refer now to the right hand side, where we see the uptrend weakening and reversing to a downtrend. Compare upswings (f), (h) and (j). Note the decreasing speed on each of these legs, indicating a reduction in bullish momentum. Bullish price swings are showing signs of weakness. Compare the downswings (g) and (i). Note the increasing speed on each of these legs, indicating
19 an increase in bearish momentum. Strength is showing on the bearish side. Future price direction is more likely to continue in the bearish direction, with the bearish strength and against the bullish weakness. Of course, not every price swing provides clear signals such as described by the perfect trend of these diagrams. Often there is no significant difference between the speed of price swings, indicating no change to the current strength or weakness of the price movement. Referring to figure 3.59 below, you ll see that a comparison of the speed of price swings (a), (c) and (e) show comparable momentum. No change is noted in bullish strength. Likewise, no change is observed in bearish momentum through downswings (b), (d) and (f). Figure Momentum Comparison Same Direction Swings 2 of 2 In the absence of any observable changes in momentum, we expect a trend to continue in its current state. This will continue until the price action shows evidence of changing momentum; ie. strength or weakness. 2) Compare the momentum of the current price swing with the momentum of the previous

20 price swing in the opposite direction? Is price faster or slower than before? What does that mean? Another means of identifying strength or weakness comes through comparing the strength of a price swing with the previous swing in the opposite direction. That is, comparing the current bullish swing with the previous bearish swing; or comparing the current bearish swing with the previous bullish swing. Refer to figure 3.60 below. Note the slope of (a) is quite steep (almost vertical) compared with the slope of (b) which is at more of a 45% angle. The latest upswing (b) has shown weakness compared with the previous downswing (a). Strength is still in the bearish direction. Downswing (c) shows downwards speed comparable to the speed of the previous upswing (b); if anything perhaps slightly stronger on the downside. While strength is still to the bearish side, there s not a great deal of difference between the bearish and bullish sides. More information is required to identify any change in sentiment. Bullish upswing (d) shows very slight increase in speed compared with the last downswing (c). While the strength is now to the bullish side, it s once again a very small difference. Bearish swing (e) however shows greatly reduced momentum, compared with bullish upswing (d). Note the shallow angle of (e) compared with the steep rise of (d). Strength is now clearly on the bullish side. Price movement is expected in the direction of strength and against the direction of weakness. The trend has changed to upwards; and further price movement is expected in this new trend direction.
 and (g) show greater upswing momentum than downswing momentum. Strength is still in the direction of the trend. Swings (g) and (h) show comparable momentum.")
21 Figure Momentum Comparisons Opposite Direction Swings 1 of 2 The same analysis techniques can be applied at the top reversal. Comparing (f) and (g) show greater upswing momentum than downswing momentum. Strength is still in the direction of the trend. Swings (g) and (h) show comparable momentum. Further information is required. Swings (h) and (i) show a change of state. Momentum has strengthened to the bearish side. This is now confirmed when comparing the momentum of (i) and (j). The momentum of upswing (j) is quite weak when compared to the momentum of downswing (i). Further price movement would be expected in the direction of the new downtrend. Figure 3.61 below demonstrates why a comparison with the opposite-direction swing can sometimes provide information that is not available through a comparison with the previous same-direction swing. When comparing the speed of downswings (b), (d) and (f) we note no change to bearish momentum. There is no evidence of weakening or strengthening in the bearish direction. Similarly when comparing the speed of upswings (a), (c) and (e) we note no change to bullish momentum. There is no evidence of weakening or strengthening in the bullish direction. Figure Momentum Comparisons Opposite Direction Swings 2 of 2
22 However, comparing swings in opposite directions does provide us with useful information. Comparing (a) and (b) we see a steeper bullish swing than bearish swing. Strength is on the bullish side. The same is evident with all other pairs (b/c, c/d, d/e, e/f) which also show strength to the upside. 3) Is the current price accelerating or decelerating? What does that mean? Figure 3.62(a), shows price deceleration on an upswing. Momentum is weakening. Note that this does not necessarily indicate a coming reversal. It s simply an indication that the current price swing is weakening and a downside correction is likely. Whether or not that develops into a full trend reversal will depend on subsequent price action. Figure Momentum Comparisons Deceleration Similarly, price swing (b) shows a deceleration of the downmove. Momentum is again weakening in the direction of the trend. The next move is likely to be a correction upwards. Acceleration on the other hand can be much more difficult to analyse. As demonstrated in figure 3.63 it may indicate a strengthening of the momentum in the current price swing direction, and a greater likelihood of price continuation in that direction.
23 Figure Momentum Comparisons Acceleration However, extreme levels of acceleration can indicate weakness from the point of exhaustion of the acceleration, as shown below in figure These climactic moves often end violently, forming (at the very least) a strong area of support or resistance, and occasionally a rapid reversal. These price swings are usually associated with greatly increased price bar range, extension well above or below any average lines, and extremely high volume when compared to prior action.
24 Figure Momentum Comparisons Climactic Move Climactic moves such as the bullish price swing (a) represent the last of the emotionallyinfluenced public, desperate to buy into the market at whatever price they can, chasing price higher and higher. When there are no buyers left and the price rally halts, selling into the market reverses price, trapping all the late longs. The reversal can be quite rapid, as these longs are stopped out of their position (sell order) and more shorts are attracted to the market. Climactic move (b) represents the same process to the downside. Late shorts desperately chasing price lower and lower in panic, along with previous longs in an extreme drawdown exiting at the point where they just can t take the pain any longer. Once the selling is exhausted, the professionals will be buying, driving prices higher and trapping the late shorts into a losing position. Any reversal may again be quite rapid, as the trapped shorts are stopped out of their positions (buy order) and more longs are attracted to the market. So, price acceleration does indicate strength. But excessive acceleration is unsustainable, and likely to end in climactic exhaustion and potential reversal. Placing the degree of acceleration into the context of background market action will usually identify which of these scenarios is playing out. Let s examine some charts
25 Figure Changing Momentum Figure 3.65 above demonstrates changing momentum on consecutive price swings of the same direction. Compare both the extensions, swing A and swing C. Note the slope of swing C is shallower than swing A, indicating reducing upwards momentum. The speed of the price extensions has slowed from swing A to swing C. Bullish momentum is weakening. Compare both the pullbacks, swing B and swing D. Note the slope of swing D is steeper than swing B, indicating increased downwards momentum. Bearish momentum is strengthening. Both observations show evidence of a weakening of our trend. Note the trend has not yet changed. A downtrend would not be triggered unless the price swing continued down and broke swing low E (previous swing high resistance and breakout point, now support). The trend is still upwards. However momentum analysis says it has weakened considerably.
26 Figure Reducing Momentum Referring to figure 3.66, note the reducing momentum on each down swing extension, as price forms this rounded bottom formation and creates new support at the level. As the third swing (C) moves down towards the prior swing low, the reduced momentum should have alerted you to a changing bias. Supply was no longer overwhelming demand to the degree displayed by the initial two drops. Either there was a lack of selling, or it was being absorbed by an increase in buying. Either way, the balance of power has shifted and the bears are no longer the dominant force they once were. The downtrend has weakened. Further price movement is more likely against the direction of the weakness (ie. in the long direction). As stated before, the important point is not any absolute value of momentum, but the comparison of one price swing with another. In this case, reducing speed on each price swing is evidence of a weakening of the downtrend.
27 Figure Decelerating Price Swing into an Area of Support Let s wrap up momentum Not every price swing will provide useful information through analysis of momentum. However we monitor momentum as price moves in order to note any significant changes. These may display via a change in speed from one swing to another (changing slope), or a change in speed within one price swing (acceleration or deceleration). Compare the momentum of the current price swing with the momentum of the previous price swing in the same direction? Is price faster or slower than before? What does that mean? Compare the momentum of the current price swing with the momentum of the previous price swing in the opposite direction? Is price faster or slower than before? What does that mean? Is the current price accelerating or decelerating? What does that mean? Projection & Depth Strengthening or weakening of a trend may also be observed through analysis of Projection and Depth. Projection refers to the distance with which a price extension projects past the previous swing high (in an uptrend) or swing low (in a downtrend).
28 Figure Projection Referring to the uptrend within figure 3.73, we see the price action shows three price extensions E1, E2 and E3. The projection of each is displayed as P1, P2 and P3. P1 is the distance with which E1 projects (or travels) beyond the previous swing high. P2 is the distance with which E2 projects beyond the previous swing high. And P3 is the distance with which E3 projects beyond its previous swing high. The important information is not so much the distance, but changes when comparing one projection with the next. Note the increased projection of E2 (P2) when compared with E1 (P1). Extension E2 projects much further than E1 did, indicating greater strength within the trend. P3 is then much shorter than P2, indicating weakness developing with the trend. The downtrend shows similar information. Projection P4 is the distance with which Extension E4 travels past its previous swing low. And so on for P5 and P6. P5 shows greater distance than P4, indicating increased downtrend strength. P6 shows a decrease in projection compared to P5, indicating possible downtrend weakness. Increased projection is a sign of potential trend strength. Decreased projection is a sign of potential trend weakness. Let s see a chart example:
29 Figure Projection on a Chart Projection A is the distance with which Extension A carries past the previous swing high. In this case the projection is equivalent to 45% of the whole Extension A range. Projection B is the distance with which Extension B carries past the previous swing high. In this case the projection is equivalent to 52% of the Extension B range. Projection C is the distance with which Extension C carries past the previous swing high. In this case the projection is equivalent to only 25% of the Extension C range. In conducting analysis you do NOT have to work out percentages. We are not concerned with absolute values of projection, but simply looking for changes which are visually obvious. In this example, Extensions A and B are easily able to break and move to new highs. Extension C though is unable to project to the same distance. Something has shifted in the balance of supply and demand. If there was no change from previous sentiment, then the extension should have carried through approximately the same distance as previously occurred. The fact that the market was unable to do so indicates either a decrease in bullish pressure and/or an increase in bearish pressure. The uptrend is showing signs of weakening. Depth refers to the distance with which a pullback retraces the previous extension.
30 Figure Depth Looking at the uptrend in figure 3.75, we see three extensions E1, E2 and E3. Depth D1 is the distance with which the pullback retraces E1 (think in percentage terms, rather than price values). D2 is the depth with which the pullback retraces E2. And D3 is the depth with which the pullback retraces extension E3. As with projection, we are not greatly interested in the absolute values of depth; rather we note significant changes of depth from one price swing to another. Note that D2 is a much smaller percentage of its extension E2 (approx 20%), when compared to D1 (approx 40%). D2 has smaller depth than D1, indicating a potential weakening of the bears, and therefore strength within the price trend. Note that D3 is significantly larger than D2, indicating potential strength within the bears, and therefore potential weakness within the price trend. The same concept applies to the downtrend. D5 is showing greatly reduce depth when compared with D4 (remember we compare D5 as a percentage of E5 (approx 20%) with D4 as a percentage of E4 (approx 60%)). Reduced pullback depth in a downtrend is a sign of potential weakness in the bulls, and therefore potential strength in the downtrend.
31 D6 is showing a much greater percentage depth than D5, indicating potential strength in the bulls and therefore potential weakness in the trend. Increased depth is a sign of potential trend weakness. Decreased depth is a sign of potential trend strength. Let s now examine depth on the same chart we used for projection, displayed again as figure 3.76 below. Depth A is the percentage with which the pullback retraces the range of Extension A. In this case Depth A is a pullback equivalent to 45% of the Extension A range. Depth B is the percentage with which the pullback retraces the range of Extension B. In this case Depth B is a pullback equivalent to 40% of the Extension B range. Depth C is the percentage with which the pullback retraces the range of Extension C. In this case Depth C is a pullback equivalent to 85% of the Extension C range. As with our projection analysis, we re not interested in absolute quantities, but rather in observing changes within the depth when comparing the current swing with previous swings. Figure Depth on a Chart The increased depth of pullback C indicates increasing bearish pressure and a potential weakening of the trend. It s wrong to make assumptions such as a 38% pullback is shallow, a 50% pullback is normal and a 62% pullback is extreme. The depth of pullback that should be considered normal is dependent on the current market environment.
32 In a volatile trend environment, deep pullbacks may be the norm, as demonstrated below in figure Figure Deep Pullbacks within a Volatile Trend Environment In this trend, pullback depth of 65-75% was considered normal. Weakening of the trend was observed only when we had deeper pullbacks, PB3 and 4, which exceeded the length of their extensions. This was a clear sign of the balance of power shifting towards the bearish side. The trend is showing clear signs of ending. To summarise projection and depth What we re seeking through our analysis is evidence that something has changed a shallower or deeper pullback or extension. If sentiment had remained as before, then the pullback or extension would have been in line with previous pullbacks and extensions. The fact that something has changed in the market indicates a change in sentiment. Analyse the change what does it mean from the perspective of supply and demand? What does it mean from the perspective of other traders and their decisions, thoughts and emotions? While these changes are often evident through your momentum analysis, it s not always the case. And in many cases analysis of projection and depth is the easiest way to spot shifting sentiment within the price action. Failure to Continue
33 Closely related to momentum and projection/depth, is a concept which I call Failure to Continue. You ll often see patterns on the chart which create an obvious expectation (within the uninformed crowd) for future price movement. When that future price movement fails to meet expectations, the market provides us with clues as to the strength or weakness of the underlying price trend. Refer to figure 3.78 below for an example. Figure Failure to Continue Following a strong fundamentally-influenced impulse downwards, and a weaker pullback, the obvious expectation is for a continuation of the move down breaking to new lows. Failure to meet that expectation demonstrates weakness in the bearish direction. This weakness may be easily observed through analysis of price swing momentum, or analysis of projection and depth. Often however, the easiest way to observe this weakness is through a simple failure to meet expectations, or failure to continue. Failure to Continue doesn t only involve failure to break a high or low, as in the above example. It might also display as a break of that level which quickly fails.
Forex Range Trading With Price Action Forex Trading System By Laurentiu Damir
 Forex Range Trading With Price Action Forex Trading System By Laurentiu Damir Copyright 2012 by Laurentiu Damir All rights reserved. No part of this book may be reproduced or transmitted in any form or
INTERMEDIATE EDUCATION GUIDE
 INTERMEDIATE EDUCATION GUIDE CONTENTS Key Chart Patterns That Every Trader Needs To Know Continution Patterns Reversal Patterns Statistical Indicators Support And Resistance Fibonacci Retracement Moving
Naked Trading - Double Top Chart Pattern Strategy
 Naked Trading - Double Top Chart Pattern Strategy If you really want to learn a profitable way to trade then look no further, the Double Top chart pattern strategy uses simple and sound trading principles
FOREX LEARNING BY MADIBA MALEBO
 FOREX LEARNING BY MADIBA MALEBO INTRODUCTION TO TREND AND ANALYSIS TREND ANALYSIS. PEAKS AND TROUGHS. SPOTTING UPTRENDS. SPOTTING DOWNTRENDS. TAKING ADVANTAGE OF TRENDS. TAKING ADVANTAGE OF DOWNTREND.
Resistance to support
 1 2 2.3.3.1 Resistance to support In this example price is clearly consolidated and we can expect a breakout at some time in the future. This breakout could be short or it could be long. 3 2.3.3.1 Resistance
CHARTS. Bar Line Candlestick Charts are the basis of technical analysis They are a graphic display of price action. Notes:
 TECHNICAL ANALYSIS CHARTS Bar Line Candlestick Charts are the basis of technical analysis They are a graphic display of price action Candlestick charts have become the industry standard for technical traders.
Now You Can Have These Trading Gems- Free!
 Presents Killer Patterns Now You Can Have These Trading Gems- Free! The Trading Info Revealed Here is not the Same as the Proven WizardTrader.com Methods But Works Well With Them 1 Copyright Information
OSCILLATORS. TradeSmart Education Center
 OSCILLATORS TradeSmart Education Center TABLE OF CONTENTS Oscillators Bollinger Bands... Commodity Channel Index.. Fast Stochastic... KST (Short term, Intermediate term, Long term) MACD... Momentum Relative
Technical Analysis Workshop Series. Session Two
 Technical Analysis Workshop eries ession Two DICLOURE & DICLAIMER This research material has been prepared by NU Invest. NU Invest specifically prohibits the redistribution of this material in whole or
2.0. Learning to Profit from Futures Trading with an Unfair Advantage! The Master Trader Price Action Analysis
 2.0 Learning to Profit from Futures Trading with an Unfair Advantage! The Master Trader Is an important concept in trading, whether you re a Day Trader, Swing Trader, or Position Trader. Is in-depth Price
Convergence and Divergence
 Convergence and Divergence Momentum: The Verge of Success Momentum plays a key role in trend analysis. Trends are composed of a series of price swings. It is a trader s edge to know when a trend is slowing
Technical Analysis Workshop Series. Session Six 1, 2, 3 Price-Bars Patterns
 Technical Analysis Workshop Series Session Six 1, 2, 3 Price-Bars Patterns DISCLOSURES & DISCLAIMERS This research material has been prepared by NUS Invest. NUS Invest specifically prohibits the redistribution
Intra-Day Trading Techniques
 Pristine.com Presents Intra-Day Trading Techniques With Greg Capra Co-Founder of Pristine.com, and Co-Author of the best selling book, Tools and Tactics for the Master Day Trader Copyright 2001, Pristine
Introduction. Technicians (also known as quantitative analysts or chartists) usually look at price, volume and psychological indicators over time.
 usually look at price, volume and psychological indicators over time.") Technical Analysis Introduction Technical Analysis is the study of market action, primarily through the use of charts, for the purpose of forecasting future price trends. Technicians (also known as quantitative
Technical Analysis Introduction Technical Analysis is the study of market action, primarily through the use of charts, for the purpose of forecasting future price trends. Technicians (also known as quantitative
The Master Trader Counter-Trend Trade Set-Ups
 The Master Trader Counter-Trend Trade Set-Ups Trading Concepts, Inc. The Master Trader Counter-Trend Trade Set-Ups By Todd Mitchell Copyright 2014 by Trading Concepts, Inc. All Rights Reserved This training
10-Year Treasury Notes ($UST Price)
") 1 Weekly Inter-market Technical Report 10-Year Treasury Notes ($UST Price) Monthly Continuing from last week's report, bonds (notes) appear to be on a strong buy signal on the monthly chart, as price is
1 Weekly Inter-market Technical Report 10-Year Treasury Notes ($UST Price) Monthly Continuing from last week's report, bonds (notes) appear to be on a strong buy signal on the monthly chart, as price is
FOREX. analysing made easy. UNDERSTANDING TECHNICAL ANALYSIS An educational tool by Blackwell Global
 FOREX analysing made easy UNDERSTANDING TECHNICAL ANALYSIS An educational tool by Blackwell Global Risk Warning: Forex and CFDs are leveraged products and you may lose your initial deposit as well as substantial
2.0. Learning to Profit from Futures Trading with an Unfair Advantage! Income Generating Strategies Essential Trading Tips & Market Insights
 2.0 Learning to Profit from Futures Trading with an Unfair Advantage! Income Generating Strategies Essential Trading Tips & Market Insights Income Generating Strategies Essential Trading Tips & Market
Why is this indicator so profitable?
 Why is this indicator so profitable? This indicator is based on sound trading logic. It exploits the always recurring behavior of the smart money (in forex the mega banks). The smart money produces double
3 Price Action Signals to Compliment ANY Approach to ANY Market
 3 Price Action Signals to Compliment ANY Approach to ANY Market Introduction: It is important to start this report by being clear that these signals and tactics for using Price Action are meant to compliment
Trading EveryDay reserves the right to change this privacy statement at any time. Be sure to check this page periodically for updates.
 This content is provided by The Trading EveryDay Group, LLC. This site, including its contents, is provided "as educational content only" without warranty or guarantee of any kind, either expressed or
Trend Channels: How to Identify Easy Profit-Making Opportunities Using Simple Chart Analysis
 Trend Channels: How to Identify Easy Profit-Making Opportunities Using Simple Chart Analysis Trend channels produce a very powerful trading technique. They are very visible, which makes them easy to utilize
Class 6: Trading the Lanes (In-depth Line Drawing and Charting) Review of Class So Far
 Review of Class So Far") Today s Class Class 6: Trading the Lanes (In-depth Line Drawing and Charting) Review of class so far Where we are going from here More in-depth technical analysis Trading with brackets (neutral trading)
Today s Class Class 6: Trading the Lanes (In-depth Line Drawing and Charting) Review of class so far Where we are going from here More in-depth technical analysis Trading with brackets (neutral trading)
Binary Options Trading Strategies How to Become a Successful Trader?
 Binary Options Trading Strategies or How to Become a Successful Trader? Brought to You by: 1. Successful Binary Options Trading Strategy Successful binary options traders approach the market with three
Knowing When to Buy or Sell a Stock
 Knowing When to Buy or Sell a Stock Overview Review & Market direction Driving forces of market change Support & Resistance Basic Charting Review & Market Direction How many directions can a stock s price
Chapter 2.3. Technical Analysis: Technical Indicators
 Chapter 2.3 Technical Analysis: Technical Indicators 0 TECHNICAL ANALYSIS: TECHNICAL INDICATORS Charts always have a story to tell. However, from time to time those charts may be speaking a language you
 1 www.candlecharts.com 2 BONUS www. candlecharts.com/special/swing-trading-2/ 3 www. candlecharts.com/special/swing-trading-2/ 4 www. candlecharts.com/special/swing-trading-2/ 5 www. candlecharts.com/special/swing-trading-2/
 Jack Schwager s Planned Trading Approach 1.Define your trading philosophy or system 2. Choose your markets to be traded 3. Specify your risk parameters A. Minimum risk per trade B. Stop loss strategy C.
Follow Price Action Trends By Laurentiu Damir Copyright 2012 Laurentiu Damir
 Follow Price Action Trends By Laurentiu Damir Copyright 2012 Laurentiu Damir All rights reserved. No part of this book may be reproduced or transmitted in any form or by any means, electronic or mechanical,
Word for the day: Basic concepts of trends
 Word for the day: Basic concepts of trends The concept of trend is the cornerstone of the technical approach of analyzing financial markets. The purpose of the tools used by a chartist (trend lines, support
Technical Analysis and Charting Part II Having an education is one thing, being educated is another.
 Chapter 7 Technical Analysis and Charting Part II Having an education is one thing, being educated is another. Technical analysis is a very broad topic in trading. There are many methods, indicators, and
Forex Sentiment Report Q2 FORECAST WEAK AS LONG AS BELOW April
 Forex Sentiment Report 08 April 2015 www.ads-securities.com Q2 FORECAST WEAK AS LONG AS BELOW 1.1200 Targets on a break of 1.1534/35: 1.1740/50 1.1870/75 1.2230/35 Targets on a break of 1.0580/70: 1.0160
Technical Analysis for Options Trading. Fidelity Brokerage Services LLC, Member NYSE, SIPC, 900 Salem Street, Smithfield, RI
 Technical Analysis for Options Trading Fidelity Brokerage Services LLC, Member NYSE, SIPC, 900 Salem Street, Smithfield, RI 02917 747561.2.0 Disclosures Options trading entails significant risk and is
The Strategies Working Best in Today s E-Mini Market
 The Strategies Working Best in Today s E-Mini Market Todd Mitchell Craig Hill Legal Disclaimer No claim is made by Trading Concepts, Inc. that the trading strategies shown here will result in profits and
The Strategies Working Best in Today s E-Mini Market
 The Strategies Working Best in Today s E-Mini Market Todd Mitchell Craig Hill Legal Disclaimer No claim is made by Trading Concepts, Inc. that the trading strategies shown here will result in profits and
Class 7: Moving Averages & Indicators. Quick Review
 Today s Class Moving Averages Class 7: Moving Averages & Indicators 3 Key Ways to use Moving Averages Intro To Indicators 2 Indicators Strength of Lines Quick Review Great for establishing point of Support
This is the complete: Fibonacci Golden Zone Strategy Guide
 This is the complete: Fibonacci Golden Zone Strategy Guide In this strategy report, we are going to share with you a simple Fibonacci Trading Strategy that uses the golden ratio which is a special mathematical
END OF DAY DATA CORPORATION. Scanning the Market. using Stock Filter. Randal Harisch 2/27/2011
 END OF DAY DATA CORPORATION Scanning the Market using Stock Filter Randal Harisch 2/27/2011 EOD's Stock Filter tool quickly searches your database, identifying stocks meeting your criteria. The results
Wedge Pattern Breakouts: Explosive Winning Trades
 Wedge Pattern Breakouts: Explosive Winning Trades Prices move in patterns! This is due to one basic investment truism. Human nature exhibits the same habits when it comes to managing investment funds which
TRADING STRATEGY SERIES LEARN HOW TO SPOT OPPORTUNITIES IN VOLATILE MARKETS fpmarkets.com.au
 1 TRADING STRATEGY SERIES LEARN HOW TO SPOT OPPORTUNITIES IN VOLATILE MARKETS This educational material does not constitute financial product advice and does not take into account your investment objectives,
Data-Driven Trading. Market Adaptation. Stocks & Commodities V. 29:12 (34-39): Data-Driven Trading by Steve Palmquist
: Data-Driven Trading by Steve Palmquist") be up by the end of the year, and about a quarter thought the market would be down. The second question was, How many of you do not care whether the market is up or down by the end of the year? In the
be up by the end of the year, and about a quarter thought the market would be down. The second question was, How many of you do not care whether the market is up or down by the end of the year? In the
FOREX TRADING STRATEGIES.
 FOREX TRADING STRATEGIES www.ifcmarkets.com www.ifcmarkets.com 2 One of the most powerful means of winning a trade is the portfolio of Forex trading strategies applied by traders in different situations.
Chapter Eight. Japanese Candle Chart
 Chapter Eight Japanese Candle Chart Candle chart (also called candlestick) analysis has been used since the 18 th century by Japanese rice traders to predict the rice price s movement. According to sources,
2 Powerful Price Patterns & Simple Truth About Trends. Trading Concepts, Inc.
 2 Powerful Price Patterns & Simple Truth About Trends RANGE Price Action Analysis Interpreting the OPEN, HIGH, LOW, & CLOSE on a Price Bar or Candlestick & comparing it to the Prior Price Bar or Candlestick
Chapter 3. Price Action
 Chapter 3 Price Action The movement of price in any market is called Price Action. This movement is caused by the beliefs and trading systems of hundreds of thousands of worldwide traders that the market
Icoachtrader Consulting Service WELCOME TO. Trading Boot Camp. Day 5
 Icoachtrader Consulting Service www.icoachtrader.weebly.com WELCOME TO Trading Boot Camp Day 5 David Ha Ngo Trading Coach Phone: 1.650.899.1088 Email: icoachtrader@gmail.com The information presented is
Technicals & Time Frame
 Advanced Charting Neither Better Trades or any of its personnel are registered broker-dealers or investment advisers. I will mention that I consider certain securities or positions to be good candidates
Copyright Alpha Markets Ltd.
 Page 1 Trading Strategies - Module 3 Welcome to this unit on Trading Strategies. In this module we will be explaining the core components of a trading strategy and how you can begin to incorporate analysis
READ THIS FIRST! A. Tenkan Sen/Kijun Sen Cross
 READ THIS FIRST! Ichimoku is a finely-tuned, integrated charting system where the five lines all work in concert to produce the end result. We emphasize the word "system" here because it is absolutely
DAILY DAY TRADING PLAN
 DAILY DAY TRADING PLAN Gatherplace will be used to place all of your trades. You will be using the 5 minute chart for the trade setup and the 1 minute chart for your entry, stop and trailing stop.you will
1. Introduction 2. Chart Basics 3. Trend Lines 4. Indicators 5. Putting It All Together
 Technical Analysis: A Beginners Guide 1. Introduction 2. Chart Basics 3. Trend Lines 4. Indicators 5. Putting It All Together Disclaimer: Neither these presentations, nor anything on Twitter, Cryptoscores.org,
Tradeciety s Price Action Guide
 Tradeciety s Price Action Guide Welcome... 3 Who am I?... 3 Some impressions from my trading & traveling lifestyle... 4 What Is Price Action?... 6 Candlesticks vs. Chart patterns... 7 Top 3 Candlestick
Bollinger Bands Forex Trading Strategy With 20 Period Moving Average
 Bollinger Bands Forex Trading Strategy With 20 Period Moving Average The bollinger bands forex trading strategy with 20 period moving average is a very simple forex strategy that works very well for all
WTI Crude Oil ($WTIC)
") 1 WTI Crude Oil ($WTIC) Monthly While gold is giving us mixed signals, Crude Oil is not (which actually could help in analyzing gold, assuming that Crude Oil and Gold share the same fate and are correlated
1 WTI Crude Oil ($WTIC) Monthly While gold is giving us mixed signals, Crude Oil is not (which actually could help in analyzing gold, assuming that Crude Oil and Gold share the same fate and are correlated
BUY SELL PRO. Improve Profitability & Reduce Risk with BUY SELL Pro. Ultimate BUY SELL Indicator for All Time Frames
 BUY SELL PRO Improve Profitability & Reduce Risk with BUY SELL Pro Ultimate BUY SELL Indicator for All Time Frames Risk Disclosure DISCLAIMER: Crypto, futures, stocks and options trading involves substantial
Chapter 2.3. Technical Indicators
 1 Chapter 2.3 Technical Indicators 0 TECHNICAL ANALYSIS: TECHNICAL INDICATORS Charts always have a story to tell. However, sometimes those charts may be speaking a language you do not understand and you
Technical analysis & Charting The Foundation of technical analysis is the Chart.
 Technical analysis & Charting The Foundation of technical analysis is the Chart. Charts Mainly there are 2 types of charts 1. Line Chart 2. Candlestick Chart Line charts A chart shown below is the Line
Divergence and Momentum Trading
 presented by Thomas Wood MicroQuant SM Divergence Trading Workshop Day One Divergence and Momentum Trading Risk Disclaimer Trading or investing carries a high level of risk, and is not suitable for all
Trends. Define the term Trend Explain why Trend is important Identify Primary, Secondary, and Short-Term trends
 Trends Define the term Trend Explain why Trend is important Identify Primary, Secondary, and Short-Term trends 1 What is a Trend? Uptrend Prices rise and fall in Trends Trend is defined as: Up (Rising)
BONUS. www. candlecharts.com/special/swing-trading-2/
 BONUS www. candlecharts.com/special/swing-trading-2/ 1 www. candlecharts.com/special/swing-trading-2/ www. candlecharts.com/special/swing-trading-2/ www. candlecharts.com/special/swing-trading-2/ 2 www.
Chapter 1.4 Trends 0
 Chapter 1.4 Trends 0 TECHNICAL ANALYSIS: TRENDS, SUPPORT AND RESISTANCE Charts, charts, charts. When most people think about trading Forex, they think about watching price movements flash by them on the
SuperADX. Written on: October 11 th 2009
 SuperADX Written on: October 11 th 2009 Congratulations on your purchase. And I mean that! You are now in possession of a powerful trading tool. It is what I believe to be the most leading and most profitable
10-Year Treasury Notes ($UST Price)
") 1 Weekly Inter-market Technical Report 10-Year Treasury Notes ($UST Price) Monthly The 10-Year Note has developed a clear rising parallel trend channel that reaches now to the $128 level with confluence
1 Weekly Inter-market Technical Report 10-Year Treasury Notes ($UST Price) Monthly The 10-Year Note has developed a clear rising parallel trend channel that reaches now to the $128 level with confluence
6 TRADE SETUPS YOU CAN START USING RIGHT NOW. includes: Ryan's top charting patterns
 6 TRADE SETUPS YOU CAN START USING RIGHT NOW includes: Ryan's top charting patterns SharePlanner's Top Setups for TRADING LONG & SHORT Far too often we clutter our trading strategy with hundreds of different
Part 1. ForEx Easy Mode
 Part 1 DISCLAIMER Any income claims are typical of top performers not all users and your results will vary. Past performance of any system is not indicative of future results. Trading foreign exchange
Commodity Chart Book
 Commodity Chart Book Cents / Bushel 920-0 Corn CORN - CBOT MONTHLY SELECTED FUTURES Chart Chart High: 843.75 on 08/10/2012 Chart Low 142.00 on 02/17/1987 Chart Low: 142.00 on 02/17/1987 Cents / Bushel
VE N O M Trading System: User Manual VENOM USER MANUAL. Copyright 2007 Third Wave FX. All Rights Reserved.
 VENOM USER MANUAL www.thirdwavefx.com Copyright 2007 Third Wave FX. All Rights Reserved. ww w.third w a v e f x.co m Page 1 Step 1 Copy & paste Third Wave FX Venom A.ex4 & Third Wave FX Venom B.ex4 indicator
IMV Commodity: Agro Technical Update
 IMV Commodity: Agro Technical Update From Research Desk In July future: Soya bean Rmseed Castor seed Guar seed Jeera Dhaniya Turmeric (Follow-up update) Cotton Seed Oil Cotton IMV Commodity Research Desk
BY JIM PRINCE
 No part of this publication may be reproduced, stored in a retrieval system, or transmitted in any form or by any means electronic, mechanical, photocopying, recording, or otherwise without the prior permission
Compiled by Timon Rossolimos
 Compiled by Timon Rossolimos - 2 - The Seven Best Forex Indicators -All yours! Dear new Forex trader, Everything we do in life, we do for a reason. Why have you taken time out of your day to read this
presented by Thomas Wood MicroQuant SM Divergence Trading Workshop Day One Naked Trading Part 2
 presented by Thomas Wood MicroQuant SM Divergence Trading Workshop Day One Naked Trading Part 2 Risk Disclaimer Trading or investing carries a high level of risk, and is not suitable for all persons. Before
Free signal generator for traders
 Free signal generator for traders Trader s Bulletin Pivot Point Trading Strategy 1. Just download the FREE tool 2. Key in a few numbers 3. And follow the simple techniques by Mark Rose To make money from
But putting it all together in a consistent manner will take effort, drive, and success will only come to those who put in the work.
 Introduction Trading is hard. The act of trading is simple. But putting it all together in a consistent manner will take effort, drive, and success will only come to those who put in the work. Methods
Bollinger Trading Methods. Play 1 - The Squeeze
 Overview: Play 1 - The Squeeze Play 2 - The Trend Trade Play 3 - Reversals Wrap up Bollinger Trading Methods Play 1 - The Squeeze The Squeeze The most popular strategy Looks to enter a trend early on Anticipates
Introduction to the Gann Analysis Techniques
 Introduction to the Gann Analysis Techniques A Member of the Investment Data Services group of companies Bank House Chambers 44 Stockport Road Romiley Stockport SK6 3AG Telephone: 0161 285 4488 Fax: 0161
The goal for Part One is to develop a common language that you and I
 PART ONE Basic Training The goal for Part One is to develop a common language that you and I can use. The rest of the book will discuss how the technical indicators highlighted in the first two chapters
Presents. The Trading Information Revealed Here is not the Same as the WizardTrader.com Methods -- But Together They Pack a Powerful Punch
 Presents Killer Patterns Now You Can Have These Trading Gems -- Free! The Trading Information Revealed Here is not the Same as the WizardTrader.com Methods -- But Together They Pack a Powerful Punch 1
Training Workbook On Trends Analysis
 Training Workbook On Trends Analysis By Bill McLaren Copyright 2007 by McLaren Report. All Rights Reserved. www.mclarenreport.com.au Table of Contents Introduction 3 Chapter 1: Defining Trends 4 Chapter
The law of Supply and Demand
 The law of Supply and Demand I have been trading for more than 25 years. What I have discovered in that time span is one of the best and most actuate tools in trading is the relationship between price
If you have traded forex long enough, you will notice that sometimes, price has an uncanny ability to reverse exactly at or around fibonacci levels.
 Fibonacci Forex Trading Strategy With Reversal Candlesticks The Fibonacci forex trading strategy with reversal candlesticks is simply about using fibonacci retracements in conjunction with reversal candlesticks.
OPTIONS STRATEGY QUICK GUIDE
 OPTIONS STRATEGY QUICK GUIDE OPTIONS STRATEGY QUICK GUIDE Trading options is a way for investors to take advantage of nearly any market condition. The strategies in this guide will let you trade, generate
Moving Average Convergence Divergence (MACD) by
 by") Moving Average Convergence Divergence (MACD) by www.surefire-trading.com Ty Young Hi, this is Ty Young with Surefiretrading.com and today we will be discussing the Moving Average Convergence/Divergence
Moving Average Convergence Divergence (MACD) by www.surefire-trading.com Ty Young Hi, this is Ty Young with Surefiretrading.com and today we will be discussing the Moving Average Convergence/Divergence
In this report, I will give you a step by step set of instructions for utilizing The Lazy River Scalping Strategy my favorite scalping method.
 What is Scalping? In short, scalping is the idea of taking quick trades (typically on smaller time frames) that only need to go a short distance before you cash out of the position and then to do this
The 60min Flow Method
 The 60min Flow Method There will no more be "Pure" and "Aggressive" as of now there will be one Method, - -----The 60min Flow Method----- one Entry, one Exit, same rules for all, and what is left up to
THE FOREX TRADING GUIDE TECHNICAL ANALYSIS CHART PATTERNS
 1 Copyright 2016 TradingSpine All rights reserved by TradingSpine. No parts of this work may be reproduced in any form or by any means - graphic, electronic, or mechanical, including photocopying, recording,
JOHN NEEDHAM. Trading Forex. with Danielcode Support and Resistance 42 SEPTEMBER 2008 / VOL. 4 ISSUE 9
 MARKET OBSERVATIONS JOHN NEEDHAM Trading Forex with Danielcode Support and Resistance 42 SEPTEMBER 2008 / VOL. 4 ISSUE 9 John Needham continues to explain how the Danielcode provides early notice of support
 Disclaimer The candlestick patterns explained in this book are intended to provide information only.. Use these patterns is at your discretion. The use and application of the included patterns can involve
NEWSLETTER SWING TRADING. 28 Feb Intelligent Analysis to point your decisions in the right direction
 NEWSLETTER 28 Feb 2018 Intelligent Analysis to point your decisions in the right direction SWING TRADING Newsletter contains index, stocks and sector recommendations along with market outlook. It also
How to Build your Trading Watchlist Table of Contents
 Table of Contents Risk Warning... 1 We ve All Been There... 2 Why Do you Need a watchlist?... 2 Starting Where you Have an Edge!... 2 Find the Dominant Psychology in a Pair... 3 Understanding Directional
JAPANESE CANDLESTICKS
 Edited by Kaspirano JAPANESE CANDLESTICKS In the 1600s, the Japanese developed a method of technical analysis to analyze the price of rice contracts. This technique is called candlestick charting. Steven
Applying fundamental & technical analysis in stock investing
 Applying fundamental & technical analysis in stock investing Today s Agenda Fundamental Analysis Topics include a basic overview, a discussion on ways to use it, and hands on tool demonstrations Trading
Trading With Price Action Alone
 Trading With Price Action Alone The very premise of technical analysis, based on the efficient market hypothesis, is that all the information about a financial product or market is reflected in its price.
Chapter 24 DIVERGENCE DECISIONS
 Chapter 24 DIVERGENCE DECISIONS The subject of divergence is one that we will approach with the utmost caution. We hope we have made ourselves clear in the other volumes of this course that we have little
Applying fundamental & technical analysis in stock investing
 Applying fundamental & technical analysis in stock investing 2017 Live demonstration of research and trading tools Develop an Ongoing Strategy with Fidelity Software and mobile apps to enhance your trading
Lecture 9, Part 2. Graphical Patterns Analysis. Continuation Patterns
 Lecture 9, Part 2 Graphical Patterns Analysis Continuation Patterns The graphical configurations we would look into are called continuation patterns. Such models usually mean that the period of price stagnation
Technical Analysis Workshop Series. Session Three
 Technical Analysis Workshop Series Session Three DISCLOSURES & DISCLAIMERS This research material has been prepared by NUS Invest. NUS Invest specifically prohibits the redistribution of this material
The Gann Analysis Rule Book
 2006 Gann Managament Ltd. All Rights Reserved. Gann Management Limited is authorised and Regulated by the Financial Services Authority The Gann Analysis Rule Book A Man Who Never Changes His Mind Will