2.0. Learning to Profit from Futures Trading with an Unfair Advantage! Income Generating Strategies Essential Trading Tips & Market Insights
|
|
|
- Eric Anderson
- 5 years ago
- Views:
Transcription


1 2.0 Learning to Profit from Futures Trading with an Unfair Advantage! Income Generating Strategies Essential Trading Tips & Market Insights
2 Income Generating Strategies Essential Trading Tips & Market Insights Table of Contents Time Frames GLOBEX 24 Hour Charts Time Frames Primary Time Frame for Day-Trading Purposes Time Frames Keep It Simple Fibonacci Retracements Coming into a New Day A High Probability the Market is Likely to TREND All Day Trend Change Two (2) of Three (3) Criteria MUST Be Met Trend Entries Types of Orders Trend Entries Placing Orders Helpful Hints When Placing Orders Trend Entries Fibonacci Retracements Trend Entries Retracements to the Key Moving Averages Trend Entries Which Key Moving Average Trend Entries Missing a Trade Trend Entries Cancel Entry Order Trend Entries Capturing Big Market Moves Interpreting Each and Every Bar or Candlestick Trade Management Volatility Trading Concepts, Inc. 2
3 Time Frames GLOBEX 24 Hour Charts Q: Do you utilize the GLOBEX 24 Hour Chart in your trading? If yes, how? Also, what Time Frames do you typically use? A: Yes, I generally take note of the GLOBEX 24 Hour overnight HIGH and LOW first thing in the morning. I want to know where the market traded overnight to give me some idea of what the market is going to do in the first hour or so of trading. If you think about it, the markets trade almost 24 hours a day now, so you can t completely ignore what happened overnight. If the market opens up and rallies up through the GLOBEX overnight HIGH, that s an indication that the market at least will continue in that direction for a while. The opposite is true if the market penetrates down through the GLOBEX overnight LOW. I also like to see the patterns and formations from the overnight trading session. Obviously, the market isn t as liquid as it is during normal trading hours (9:30am ET to 4:15pm ET), but there are times where good trade set-ups occur overnight. Modules for reference: 3
4 Time Frames Primary Time Frame for Day-Trading Purposes Q: What s the main Time Frame I should be watching during the trading day? What Time Frame should I use to execute most of my trades? A: The three (3) minute chart is the primary chart you should be watching for day-trading purposes. You not only should execute most of your trades off of this chart, but also almost all of your intra-day trade set-ups should occur on this chart. The 30 minute, 60 minute, and Daily charts are only used for the bigger picture coming into the new trading day. Figure out the Fibonacci Retracements off of these bigger charts according to the MFAM on that time frame coming into the day for potential SUPPORT and RESISTANCE. Those are all of the reasons you should be using these bigger time frames. Refer back to the Starting the Trading Day module where I go into more detail regarding the bigger time frames and exactly how they are used. Modules for reference: 4

5 Time Frames Primary Time Frame for Day-Trading Purposes Figure out the Fibonacci Retracements off of the 30 Minute, 60 Minute, and Daily Charts according to the MFAM for the bigger picture potential SUPPORT and RESISTANCE. 60 Minute Chart 4/19/12 (Next Slide) Modules for reference: 5

6 Time Frames Primary Time Frame for Day-Trading Purposes The three (3) minute chart is the primary chart you should be watching for day-trading purposes. Almost all of your intra-day trade set-ups occur on this chart, so execute your trades off of this chart. 3 Minute Chart Modules for reference: 6
7 Time Frames Keep It Simple Q: The more time frames I look at during the trading day, the more confused I get. What do I do? A: Keep it simple. I personally use the three (3) minute chart for day-trading only. I use larger timeframes (i.e. 30 minute, 60 minute, and Daily charts) for the bigger picture. The more time frames you choose to look at simultaneously, the more confused you could get. I recommend using the 3 minute chart during the trading day. Only look at the bigger time frames before the market opens to know where longer-term SUPPORT and RESISTANCE are. Remember, keep it simple, and don t make it any more complicated than it is. Modules for reference: 7


8 Time Frames Keep It Simple Keep it simple. I recommend using the 3 minute chart for day-trading only. Only look at the bigger time frames before the market opens to know where longer-term SUPPORT and RESISTANCE are. The more time frames you choose to look at simultaneously, the more confused you could get. 60 Min Chart 3 Min Chart Modules for reference: 8
9 Fibonacci Retracements Coming into a New Day Q: Should I use yesterday s price action for today s retracements? If so, how far do I go back in time to look at the bigger picture? When do I use just today s range? A: Yes, I suggest using yesterday s price action coming into a new trading day for the bigger SUPPORT and RESISTANCE levels. On average, I would say to use the prior day s range for the first one to one and a half hours of trading (first 1 to 1 1/2 hours), or until the range of the current day is large enough to trade based on today s range alone. Look back as far as you need to in order to get the bigger Fibonacci Retracement levels. This may mean looking at a 30 minute, 60 minute, or Daily Chart to get the bigger picture. Remember, Fibonacci Retracements do not mean much unless the swing you are measuring is large enough. I would say that market swings must be a minimum of eight (8) to ten (10) points to make the Fibonacci Retracement levels valid. Please remember, market volatility is cyclical and changes over time (volatility is not 100% constant). Modules for reference: 9


10 Fibonacci Retracements Coming into a New Day Use yesterday s price action coming into a new trading day for the bigger SUPPORT and RESISTANCE levels. Use the prior day s range for the first one to one and a half hours of trading, or until the range of the current day is large enough to trade based on today s range alone. Modules for reference: 10
11 A High Probability the Market is Likely to TREND All Day Q: Is there any way to know beforehand (in the morning) if the market is going to TREND all day? A: There is really only one scenario that tips my hat off to a potential TREND for the day. For example, look for a TREND in the direction of the gap to occur if the market gaps above the previous day s High or below the previous day s Low and continues to move in the direction of the gap, then turns around and is NOT able to fill the gap by returning to the previous day s Close, and then once again turns around and continues in the direction of the gap and takes out the intra-day High or Low. Also, if the market does not make any sort of Counter-Trend move by 10:30 ET and just continues in the direction of the first hour s TREND, then the market will most likely TREND for the rest of the day. Remember, the market TRENDs strongly only about one to three days a month if that, but keep your eye open for these types of trade set-ups. They are generally very reliable when they do occur. Modules for reference: 11


12 A High Probability the Market is Likely to TREND All Day The market most likely will TREND for the rest of the day if the market GAPs above the previous day HIGH or below the previous day LOW, does not make any sort of Counter-Trend move and/or is not able to fill the GAP, and then continues to move in the direction of the GAP and takes out the intraday HIGH or LOW. Modules for reference: 12
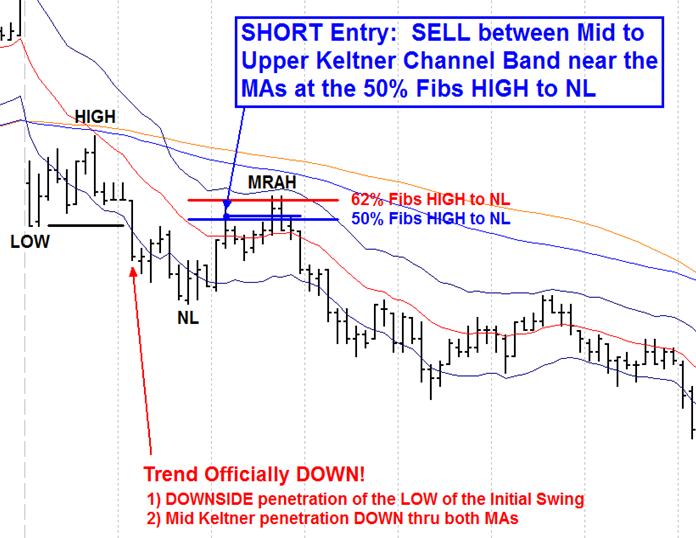
13 Trend Change Two (2) of Three (3) Criteria MUST Be Met Q: In the MFAM, how much of a penetration down through an Active Low (AL) or up through an Active High (AH) must occur before considering the TREND to change? A: You need to see an AH or AL penetrated by only one tick in normal circumstances. The exception is if the AH or AL is at the 79/89 Key Moving Averages. You then would need to see the market penetrate up or down through the moving averages before considering entering a trade in that direction. Remember, two of three criteria must be met for the TREND to change: UPTREND Changing into a DOWNTREND (2 of the Following 3 Criteria Must Be Met: The MRAL (i.e. the highest AL in the UPTREND) MUST be taken out to the DOWNSIDE, The Mid-Keltner MUST penetrate DOWN through both the 79 SMA and 89 EMA (or 3 consecutive price bars MUST be trading COMPLETELY BELOW the Lower Moving Average), and The market MUST penetrate DOWN through 62% Fibonacci Retracement of the ENTIRE DAY. DOWNTREND Changing into an UPTREND (2 of the Following 3 Criteria Must Be Met): The MRAH (i.e. the lowest AH in the DOWNTREND) MUST be taken out to the UPSIDE, The Mid-Keltner MUST penetrate UP through both the 79 SMA and 89 EMA (or 3 consecutive price bars MUST be trading COMPLETELY ABOVE the Upper Moving Average), and The market MUST penetrate UP through 62% Fibonacci Retracement of the ENTIRE DAY. Modules for reference: 13


14 Trend Change Two of Three Criteria MUST Be Met Two of three criteria must be met for the TREND to change. Modules for reference: 14
 orders are used most often (90% of the time) when entering on a pullback (retracement) trade.")
15 Trend Entries - Types of Orders Q: When entering the market on a retracement, what Type of Order should I use? A: LIMIT and MIT ( Market If Touched ) orders are used most often (90% of the time) when entering on a pullback (retracement) trade. Use of a LIMIT order allows you to eliminate slippage completely on entry, while one-tick slippage is likely when using a MIT order. Modules for reference: 15
16 Trend Entries Placing Orders Q: When should I actually place an order to enter the market on a pullback? A: Look to place your order approximately 1.00 ES point before the market actually gets to your entry price. For example, if you re BUYING at , place your order when the market pulls down to If you re SHORTING at , place your order when the market pulls up to Avoid placing your order too far in advance as things may change to the point where you don t want to enter the market at the same price anymore. If you place the order too far in advance, you may find yourself constantly canceling and replacing your orders. Modules for reference: 16

17 Trend Entries Placing Orders If you re BUYING at , place your order when the market pulls down to Modules for reference: 17

18 Trend Entries Placing Orders If you re SHORTING at , place your order when the market pulls up to Modules for reference: 18
19 Helpful Hints When Placing Orders Halves (.50 s) and Round (.00 s) numbers are very important. Traders tend to take the market to these areas; thus, you must make sure to place your stops above these numbers when SHORT and below these numbers when LONG. The market generally will bounce off of these numbers when coming up from a LOW and react down off these numbers from a HIGH. These numbers, believe it or not, are very important. I even suggest using these numbers (whole and half numbers) for all market ENTRIES. In a nutshell, you NEVER want to place your Initial Stop Loss or Stops on a half or whole number. If you enter on BREAKOUTS, you never want to place your Buy Stop or Sell Stop (entry order) on a.00 (whole) or.50 (half) number. You definitely want to be a tick above (.25) or below (.75) these crucial numbers. Take a look below to see what I mean: Realize that floor traders tend to take prices to these levels (i.e..00's and.50's) intentionally to stop traders out of the market. Notice how many times the HIGH or LOW of a day, or any significant High or Low throughout the trading day, ends up on these half and whole numbers (i.e or ) probably a good 70% of the time. If you were going to place your Initial Stop Loss below a lower logical level of SUPPORT in an UP Trend or above a higher logical level of RESISTANCE in a DOWN Trend (Fibonacci Retracement, Key Moving Average, Floor Trader Pivot, etc.), you simply would place it on.25 s or.75 s. Quite simply, you do not want to place your Initial Stop Loss on rounds (.00 s) or halves (.50 s). If you were going to BUY the market on a breakout at , you simply would move your Buy Stop up to If you were going to SELL the market on a breakdown at , you simply would move your Sell Stop down to Quite simply, entering on a BREAKOUT, you want to be on.25 s or.75 s. Modules for reference: 19
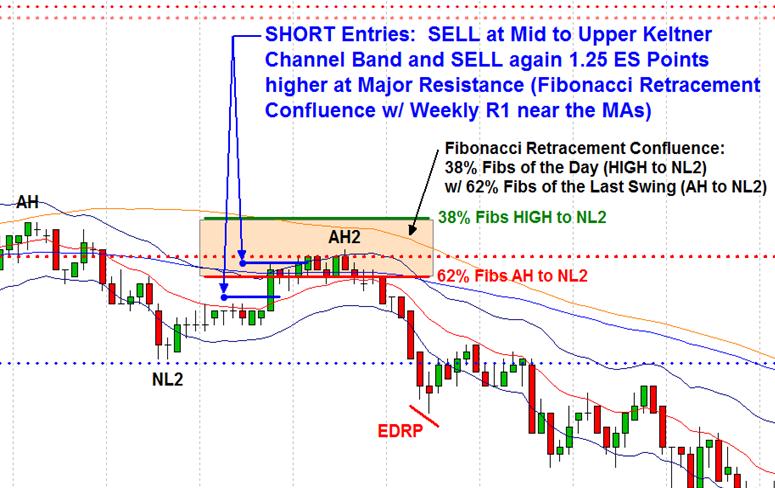
20 Trend Entries - Fibonacci Retracements Q: How do you know which Fibonacci Retracement level (the 38%, 50%, or 62%) to choose to enter the market? A: When entering LONG (Buying) on an Initial Trend Entry (1 st pullback) in the MFAM, I look to BUY on the Fibonacci Retracement that is closest to the Mid to Lower Keltner Channel Bands. On Successive Trend Entries (2 nd pullbacks) when entering LONG (Buying), I look to BUY at Mid to Lower Keltner Channel Bands AND look to BUY at Fibonacci Retracement Confluence from the Lowest Low to the Highest High and from the Most Recent Active Low to the Highest High. When entering SHORT (Selling) on an Initial Trend Entry (1st pullback) in the MFAM, I look SELL on the Fibonacci Retracement that is closest to Mid to Upper Keltner Channel Bands. On Successive Trend Entries (2 nd pullbacks) when entering SHORT (Selling), I look to SELL at Mid to Upper Keltner Channel Bands AND look to SELL at Fibonacci Retracement Confluence from the Highest High to the Lowest Low and from the Most Recent Active High to the Lowest Low. I generally do not look to enter on the 3 rd, 4 th, or 5 th pullbacks (retracements) in the same MFAM direction except for the exceptions to the rules mentioned in the Successive Trend Entries module. Modules for reference: 20


21 Trend Entries - Fibonacci Retracements Modules for reference: 21
22 Trend Entries Retracements to the Key Moving Averages Q: When do you automatically Buy or Sell on a pullback to the 79/89 Key Moving Averages? When do you wait for a Powerful Price Pattern before Buying or Selling on a pullback to the 79/89 Key Moving Averages? A: You may look to BUY or SELL the market automatically on the very 1 st pullback to the 79/89 Key Moving Averages in an established UP Trend (BUY) or in an established DOWN Trend (SELL) as long as you can identify another logical level of SUPPORT or RESISTANCE at or near the Key Moving Averages (such as a Fibonacci Retracement level of the entire day, Fibonacci Retracement Confluence, and/or a Floor Trader Pivot level). In an UP Trend, place your Initial Stop Loss below the Lower Moving Average or other significant logical level of SUPPORT, whichever is Lower. In a DOWN Trend, place your Initial Stop Loss above the Upper Moving Average or other significant logical level of RESISTANCE, whichever is Higher. On the 2 nd or 3 rd pullback to the 79/89 Key Moving Averages in an established TREND, you should wait for one of the Powerful Price Patterns to form before entering the market.. Modules for reference: 22


23 Trend Entries Retracements to the Key Moving Averages You may look to BUY or SELL the market automatically on the very 1 st pullback to the 79/89 Key Moving Averages in an established TREND as long as you can identify another logical level of SUPPORT / RESISTANCE at or near the Key Moving Averages. Wait for a Powerful Price Pattern to form before entering the market on the 2 nd or 3 rd pullback to the 79/89 Key Moving Averages. Modules for reference: 23
24 Trend Entries Which Key Moving Average Q: How should I know at which Key Moving Average to take a trade, the 79 SMA or the 89 EMA? A: That s a good question; actually there are two things you will look at to help tell where to enter a trade around these two Key Moving Averages. First, look at the Fibonacci Retracements in relation to where the Key Moving Averages are to see which retracement is closest to or sitting on the Key Moving Averages. For example, if the 38% retracement is at or near the 79 SMA and the 50% retracement is beyond the 89 EMA, I then would choose to enter the market at the 38% retracement since the 50% retracement is beyond the 89 EMA assuming the second factor also meets my criteria. The second factor I look for when determining where to enter the market in relation to the Key Moving Averages is where your Initial Stop Loss should be placed according to what you ve been taught in the Trade Management module. As long as you re able to stick with your Initial Stop Loss beyond the Key Moving Averages when entering at or near them, the entry should work fine, and that would meet my criteria. You don t ever want to place your Initial Stop Loss within the Key Moving Averages because they act as longer-term SUPPORT in an UP Trend and longer-term RESISTANCE in a DOWN Trend. Therefore, if you are LONG, you want to make sure that your Initial Stop Loss is below the Lower Moving Average. If you are SHORT, then you want to make sure that your Initial Stop Loss is above the Upper Moving Average. It s that simple. Modules for reference: 24
25 Trend Entries Missing a Trade Q: When you place an order and the market does not quite get to the entry price you placed in the market, how do you avoid missing the trade? Do you just enter at the market? A: There is no way to avoid missing a trade when entering into a TREND on a pullback. Since you re picking a pre-determined price to enter the market and then placing a LIMIT order or Market-If-Touched order before the market reaches that price, there is no real way to avoid missing a trade if the market is unable to reach your entry price. I know it can be frustrating, but that s part of the game. I don t believe in chasing the market either. Remember, you really don t know you missed a trade until after the fact. In hindsight, it s easy to say that you should have jumped in with a MARKET order, but in real time trading, it s a lot harder to see when it s actually happening. Again, there is NO WAY TO AVOID MISSING TRADES (at least the way we trade) unless, of course, you choose to enter with a MARKET order every time you want into the market. I do not suggest trading that way. If you choose to do that you ll find yourself always chasing the market; therefore, you ll find yourself getting whipsawed all the time. Modules for reference: 25


26 Trend Entries Missing a Trade If the market gets close say within 0.25 to 1.00 ES points from your entry price and then turns and continues in the direction of the TREND and moves past where you normally would have taken profits, cancel your entry order. Modules for reference: 26
27 Trend Entries Cancel Entry Order (Missed Trade) Q: When would you cancel your entry order to enter into a trade? What I mean is, if the market does not quite get to your entry price and then turns and continues in the direction of the TREND, when do you cancel your order because you missed a trade? A: If the market gets close say within 0.25 to 1.00 ES points from your entry price and then turns and continues in the direction of the TREND and moves past where you normally would have taken profits, cancel your entry order. Chances are, if the market turns from where you would have taken profits and continues to pull back through the price level at which your entry order is placed, the market may continue moving in that direction beyond logical SUPPORT/RESISTANCE to the point where you would not want to enter at or near that price level anymore. You may want to re-evaluate the market then when it gets back to your original entry price to see if you still want to enter the trade at the same price. Modules for reference: 27
28 Trend Entries Capturing Big Market Moves Q: I hate missing out; is there a way that I never will miss a big move in the market? A: There are times you re going to miss the big moves when you are looking to BUY or SELL on a pullback in an established TREND. Since we re using Fibonacci Retracements and pullbacks to enter the market, there are going to be those times where the market takes off without ever looking back (i.e. no retracements until after a huge move is made). Everybody hates missing trades let alone big market moves. There are a few trade set-ups that allow you to capture a big market move. The only way I know never to miss a trade is simply to have a Buy Stop order placed one tick above the MRAH in a DOWN Trend and to have a Sell Stop one tick below the MRAL in an UP Trend. By doing this, you never will miss a big market move. The Aggressive Entry to the EURP and the EDRP is another high probability break-out type of trading strategy that gets you in the market as it s moving without waiting for a pullback. When entering a trade on a pullback, you usually will place a LIMIT or MIT order waiting for the market to fill you; of course, there will be times the market will miss your entry price by a tick or two (or a little more), and you won t get filled. There is simply no way to avoid this type of scenario. If you think about it, you will not know the trade is gone until it s too late. You also do not want to get into the habit of chasing the market. So, simply cancel any existing order and wait for the next trade set-up. Modules for reference: 28


29 Trend Entries Capturing Big Market Moves The only way I know never to miss a trade is simply to have a BUY STOP order placed one tick above the MRAH in a DOWN Trend and to have a SELL STOP one tick below the MRAL in an UP Trend. Modules for reference: 29


30 Trend Entries Capturing Big Market Moves The Aggressive Entry to the EURP and to the EDRP is another high probability break-out type of trading strategy that gets you in the market as it s moving without waiting for a pullback. Modules for reference: 30
31 Interpreting Each and Every Bar or Candlestick Q: Do I have to sit and interpret each and every 3 minute bar or candlestick? A: Absolutely Not. Remember, you are only looking for Powerful Price Patterns at logical levels of SUPPORT and RESISTANCE in established TRENDS, for Counter-Trend Trade Set-Ups (discussed in The Master Trader level of the pyramid), for deeper pullbacks/retracements to the Key Moving Averages, and when Managing a Trade. The only time you want to watch every 3 minute bar is when you re actually in a trade. Think of individual price action analysis as the micro-view of the market, whereas the MFAM is the macro-view of the market. The MFAM is what you want to watch and observe during the trading day for your trading signals. Bullish OVB Bullish Quasi Engulfing Pattern IVB (at Support) Neutral Harami (at Support) Double Bar LOW w/ Higher HIGH and Higher CLOSE Double Candlestick LOW w/ Higher HIGH and Higher CLOSE Bearish OVB Bearish Quasi Engulfing Pattern IVB (at Resistance) Neutral Harami (at Resistance) Double Bar HIGH w/ Lower LOW and Lower CLOSE Double Candlestick HIGH w/ Lower LOW and Lower CLOSE Modules for reference: 31
32 Trade Management Volatility Q: How do you know when the market is more volatile than normal requiring you to trade with above average STOPs? A: There are two ways to tell if the market s volatility is above average. 1) If the market is trading in.50+ increments, and 2) if the average three minute bar s range is over ES points. If you are trading the E-Mini S&P 500 (ES) when one or both of these occur, you may need to risk anywhere from five to six full points ($250 to $300). However, if this exceeds your max risk per contract, there are three ways you can get a handle on trading volatile markets: 1) Utilize a Smaller Time Frame Chart (consider a 2 minute and/or a 1 minute chart), 2) Utilize a Tick Chart (consider a 55, 89, 144, 233, 377, 610, 987, or 1597 tick chart), or 3) Utilize a Range Bar Chart (consider a 1.50 Range Bar Chart) Generally, if your max risk is $150 per contract (3.00 ES Points), then you are looking to trade off of a chart where each individual bar or candlestick s range does not exceed 1.50 ES Points (approximately one-half of your max risk per contract). Refer to the Trade Management module for more details on defining and managing volatility. A General Rule of Thumb with respect to Trends and the Volatility of the Market: When a market is Trending UP, the market tends to be a lot less volatile than when a market is Trending DOWN. Therefore, a market that is Trending DOWN is much more volatile than a market that is trending UP. A market falls roughly three times as quickly as it rises. Modules for reference: 32
33 No claim is made by the Trading Concepts, Inc. that the Futures trading strategies shown here will result in profits and will not result in losses. Futures trading may not be suitable for all recipients of this Training Program. All comments, trading strategies, techniques, concepts and methods shown within our Course are not and should not be construed as an offer to buy or sell Futures Contracts they are opinions based on market observation and years of experience. Therefore, the thoughts expressed are not guaranteed to produce profits in any way. All Opinions are subject to change without notice. Each Futures trader/investor is responsible for his/her own actions, if any. Your purchase of the Trading Concepts Comprehensive EMINI SUCCESS FORMULA 2.0 Mentoring Program constitutes your agreement to this disclaimer and exempts Trading Concepts from any liability or litigation. Trading Concepts, Inc. 33
34 All rights reserved. This Training Program, or parts thereof, may not be reproduced in any form without the prior written permission of Trading Concepts, Inc. Trading Concepts, Inc. 34
2.0. Learning to Profit from Futures Trading with an Unfair Advantage! Income Generating Strategies Starting the Trading Day
 2.0 Learning to Profit from Futures Trading with an Unfair Advantage! Income Generating Strategies Starting the Trading Day Income Generating Strategies Starting the Trading Day Pre-Market Analysis Before
Coaching Session FIVE
 Coaching Session FIVE Coaching Session FIVE Counter-Trend Trade Set-Ups Program Summary Trading Plan Execution The Master Trader Powerful Price Pattern Trades Trade Management Initial Trend Entry Trading
The Master Trader Counter-Trend Trade Set-Ups
 The Master Trader Counter-Trend Trade Set-Ups Trading Concepts, Inc. The Master Trader Counter-Trend Trade Set-Ups By Todd Mitchell Copyright 2014 by Trading Concepts, Inc. All Rights Reserved This training
The Strategies Working Best in Today s E-Mini Market
 The Strategies Working Best in Today s E-Mini Market Todd Mitchell Craig Hill Legal Disclaimer No claim is made by Trading Concepts, Inc. that the trading strategies shown here will result in profits and
The 30-Minute Breakout Strategy. Trading Concepts, Inc.
 The 30-Minute Breakout Strategy The 30-Minute (First Half-Hour) Breakout Strategy Once the Market moves in either direction off of the OPEN and penetrates UP through the HIGH or DOWN through LOW of the
Trading Success Principles Floor Trader Pivots
 Trading Success Principles Floor Trader Pivots Trading Concepts, Inc. Trading Success Principles Floor Trader Pivots By Todd Mitchell Copyright 2014 by Trading Concepts, Inc. All Rights Reserved This training
The Strategies Working Best in Today s E-Mini Market
 The Strategies Working Best in Today s E-Mini Market Todd Mitchell Craig Hill Legal Disclaimer No claim is made by Trading Concepts, Inc. that the trading strategies shown here will result in profits and
2.0. Learning to Profit from Futures Trading with an Unfair Advantage! The Master Trader Price Action Analysis
 2.0 Learning to Profit from Futures Trading with an Unfair Advantage! The Master Trader Is an important concept in trading, whether you re a Day Trader, Swing Trader, or Position Trader. Is in-depth Price
2 Powerful Price Patterns & Simple Truth About Trends. Trading Concepts, Inc.
 2 Powerful Price Patterns & Simple Truth About Trends RANGE Price Action Analysis Interpreting the OPEN, HIGH, LOW, & CLOSE on a Price Bar or Candlestick & comparing it to the Prior Price Bar or Candlestick
The 4 Step Process for FOREX Trading Mastery
 The 4 Step Process for FOREX Trading Mastery The 4 Step Process for FOREX Trading Mastery 1. Identifying Market Condition 2. Identifying a Trade Set-Up Steps 1 & 2 were discussed in the 2 nd Video 3. Determining
Types of Orders & Placing Orders
 Types of Orders & Placing Orders Types of Orders Trading Concepts, Inc. 2 Types of Orders The E-Minis (ES, YM, and NQ) are traded electronically on the Chicago Mercantile Exchange s (CME) Globex trading
2010. Trading Concepts, Inc. All Rights Reserved. For More Information Please Visit
 E-Mini Volume Breakout System By Todd Mitchell For additional information, please go to http://www.eminisuccessformula.com Copyright 2010 by Trading Concepts, Inc. All Rights Reserved. U.S. Government
Technicals & Time Frame
 Advanced Charting Neither Better Trades or any of its personnel are registered broker-dealers or investment advisers. I will mention that I consider certain securities or positions to be good candidates
Trading Essentials Framework Market Foundation & Building Blocks
 Trading Essentials Framework Market Foundation & Building Blocks Trading Concepts, Inc. Trading Essentials Framework Market Foundation & Building Blocks By Todd Mitchell Copyright 2014 by Trading Concepts,
Trading Essentials Framework Money Management & Trade Sizing
 Trading Essentials Framework Money Management & Trade Sizing Module 9 Money Management & Trade Sizing By Todd Mitchell Copyright 2014 by Todd Mitchell All Rights Reserved This training program, or parts
Icoachtrader Consulting Service WELCOME TO. Trading Boot Camp. Day 5
 Icoachtrader Consulting Service www.icoachtrader.weebly.com WELCOME TO Trading Boot Camp Day 5 David Ha Ngo Trading Coach Phone: 1.650.899.1088 Email: icoachtrader@gmail.com The information presented is
EMINI SUCCESS FORMULA
 LIVE Webinar Legal Disclaimer No claim is made by Trading Concepts, Inc. that the trading strategies shown here will result in profits and will not result in losses. Trading may not be suitable for all
Free signal generator for traders
 Free signal generator for traders Trader s Bulletin Pivot Point Trading Strategy 1. Just download the FREE tool 2. Key in a few numbers 3. And follow the simple techniques by Mark Rose To make money from
Trading Lessons from the Intraday Frame (study)
") 1 Daily "Idealized Trades" Report Trading Lessons from the Intraday Frame (study) 1 2018 TheoTrade LLC. All rights reserved. 2 Trading Lessons from the Intraday Frame (1-mi) Major Companies Reporting Earnings
1 Daily "Idealized Trades" Report Trading Lessons from the Intraday Frame (study) 1 2018 TheoTrade LLC. All rights reserved. 2 Trading Lessons from the Intraday Frame (1-mi) Major Companies Reporting Earnings
What Came First... Fundamentals or the Technicals? By Jared Martinez
 What Came First... Fundamentals or the Technicals? By Jared Martinez I am honored to share my thoughts on our methodologies, focusing on the current technical movements and conditions of the FOREX Markets,
 1 www.candlecharts.com 2 BONUS www. candlecharts.com/special/swing-trading-2/ 3 www. candlecharts.com/special/swing-trading-2/ 4 www. candlecharts.com/special/swing-trading-2/ 5 www. candlecharts.com/special/swing-trading-2/
Scalp Trading Strategies
 Scalp Trading Strategies Services Disclaimer (for full disclosure, see Disclaimers section of website) Information Contained within our website and affiliates is not a substitute for professional advice
Tommy s Revenge 2.0 Module 2 Part 2
 1 Mark Deaton here with your follow-up to Module 2. Going to cover a few things in this video and try to keep it short and sweet. We re going to look at Stock Fetcher and how we can use Stock Fetcher to
Trading EveryDay reserves the right to change this privacy statement at any time. Be sure to check this page periodically for updates.
 This content is provided by The Trading EveryDay Group, LLC. This site, including its contents, is provided "as educational content only" without warranty or guarantee of any kind, either expressed or
10-Year Treasury Notes ($UST Price)
") 1 Weekly Inter-market Technical Report 10-Year Treasury Notes ($UST Price) Monthly Continuing from last week's report, bonds (notes) appear to be on a strong buy signal on the monthly chart, as price is
1 Weekly Inter-market Technical Report 10-Year Treasury Notes ($UST Price) Monthly Continuing from last week's report, bonds (notes) appear to be on a strong buy signal on the monthly chart, as price is
BONUS. www. candlecharts.com/special/swing-trading-2/
 BONUS www. candlecharts.com/special/swing-trading-2/ 1 www. candlecharts.com/special/swing-trading-2/ www. candlecharts.com/special/swing-trading-2/ www. candlecharts.com/special/swing-trading-2/ 2 www.
E-Mini Volume Breakout System
 E-Mini Volume Breakout System By Todd Mitchell & Craig Hill For additional bonus information and videos, please go to http://www.eminisuccessformula.com/blog Copyright 2010 by Trading Concepts, Inc. All
The Engulfing Trader Copyright 2014
 Www.ForexWinners.Ru Prologue and Introduction This book is for all those that are just fed up with all the hype out there in the market. So called guru s selling expensive strategies and systems guaranteeing
Trading Lessons from the Intraday Frame (study)
") 1 Daily "Idealized Trades" Report Trading Lessons from the Intraday Frame (study) 1 2018 TheoTrade LLC. All rights reserved. 2 Trading Lessons from the Intraday Frame (1-mi) 2 2018 TheoTrade LLC. All rights
1 Daily "Idealized Trades" Report Trading Lessons from the Intraday Frame (study) 1 2018 TheoTrade LLC. All rights reserved. 2 Trading Lessons from the Intraday Frame (1-mi) 2 2018 TheoTrade LLC. All rights
Trading Concepts, Inc.
 Trading Concepts, Inc. About Trading Concepts Since 1994, Trading Concepts has provided investment education and personal mentoring, market analysis, online trading tools and portfolio management techniques
Figure 3.6 Swing High
 Swing Highs and Lows A swing high is simply any turning point where rising price changes to falling price. I define a swing high (SH) as a price bar high, preceded by two lower highs (LH) and followed
Trading Lessons from the Intraday Frame (study)
") 1 Daily "Idealized Trades" Report Trading Lessons from the Intraday Frame (study) 1 2018 TheoTrade LLC. All rights reserved. 2 Trading Lessons from the Intraday Frame (1-mi) 2 2018 TheoTrade LLC. All rights
1 Daily "Idealized Trades" Report Trading Lessons from the Intraday Frame (study) 1 2018 TheoTrade LLC. All rights reserved. 2 Trading Lessons from the Intraday Frame (1-mi) 2 2018 TheoTrade LLC. All rights
3 Price Action Signals to Compliment ANY Approach to ANY Market
 3 Price Action Signals to Compliment ANY Approach to ANY Market Introduction: It is important to start this report by being clear that these signals and tactics for using Price Action are meant to compliment
Presents. SPY the MARKET. With. Bill Corcoran
 Presents SPY the MARKET With Bill Corcoran I am not a registered broker-dealer or investment adviser. I will mention that I consider certain securities or positions to be good candidates for the types
Page 1 of 96 Order your Copy Now Understanding Chart Patterns
 Page 1 of 96 Page 2 of 96 Preface... 5 Who should Read this book... 6 Acknowledgement... 7 Chapter 1. Introduction... 8 Chapter 2. Understanding Charts Convention used in the book. 11 Chapter 3. Moving
CHARTS. Bar Line Candlestick Charts are the basis of technical analysis They are a graphic display of price action. Notes:
 TECHNICAL ANALYSIS CHARTS Bar Line Candlestick Charts are the basis of technical analysis They are a graphic display of price action Candlestick charts have become the industry standard for technical traders.
When traders make trading decisions based on repeated price patterns that once formed,
 Trading Strategy / Gert.Nurme@iBrokers.ee Price Action Trading Strategy Introduction WHAT IS PRICE ACTION TRADING? When traders make trading decisions based on repeated price patterns that once formed,
Resistance to support
 1 2 2.3.3.1 Resistance to support In this example price is clearly consolidated and we can expect a breakout at some time in the future. This breakout could be short or it could be long. 3 2.3.3.1 Resistance
2.0. Learning to Profit from Futures Trading with an Unfair Advantage! Trading Essentials Framework Steps of a Successful Trader
 2.0 Learning to Profit from Futures Trading with an Unfair Advantage! Trading Essentials Framework Steps To Help You Become a Successful Trader 1) Learn from Role Models (Mentors) 2) Establish Good Habits
INTERMEDIATE EDUCATION GUIDE
 INTERMEDIATE EDUCATION GUIDE CONTENTS Key Chart Patterns That Every Trader Needs To Know Continution Patterns Reversal Patterns Statistical Indicators Support And Resistance Fibonacci Retracement Moving
How to perform accurate market analysis
 How to perform accurate market Roman Sadowski Good market combines the fundamental and the technical. This combination is essential to form a longer-term bias in the market. Good market needs to consider
Trade the Price Action By Laurentiu Damir. Copyright 2012 Laurentiu Damir
 Trade the Price Action By Laurentiu Damir Copyright 2012 Laurentiu Damir All rights reserved. No part of this book may be reproduced or transmitted in any form or by any means, electronic or mechanical,
A Different Take on Money Management
 A Different Take on Money Management www.simple4xsystem.net Anyone who read one of my books or spent time in one of my trade rooms knows I put a lot of emphasis on using sound Money Management principles
Test Your Chapter 1 Knowledge
 Self-Test Answers Test Your Chapter 1 Knowledge 1. Which is the preferred chart type in LOCKIT? The preferred chart type in LOCKIT is the candle chart because candle patterns are part of the decision-making
DAILY DAY TRADING PLAN
 DAILY DAY TRADING PLAN Gatherplace will be used to place all of your trades. You will be using the 5 minute chart for the trade setup and the 1 minute chart for your entry, stop and trailing stop.you will
Bollinger Trading Methods. Play 1 - The Squeeze
 Overview: Play 1 - The Squeeze Play 2 - The Trend Trade Play 3 - Reversals Wrap up Bollinger Trading Methods Play 1 - The Squeeze The Squeeze The most popular strategy Looks to enter a trend early on Anticipates
The Art & Science of Active Trend Trading
 Candlesticks Looking for U-Turns The Art & Science of Active Trend Trading Copywrite ATTS 2007-2015 1 Disclaimer U.S. Government Required Disclaimer Commodity Futures Trading Commission Futures and Options
How To Read Charts Like A Pro Your guide to reading stock charts!
 How To Read Charts Like A Pro Your guide to reading stock charts! Courtesy of Swing-Trade-Stocks.com You may distribute this book FREELY or use it as part of a commercial package as long as this page and
Trading Essentials Framework Money Management & Trade Sizing 2.0
 2.0 Money Management: The most critical aspect of your trading plan Money management represents the administrative side of your trading plan. It addresses the question of how best to use the capital available
In the book Candlesticks, Fibonacci,
 TRADING Strategies T h e THREE RISING VA L L E Y S p a t t e r n A series of three lows with specific characteristics marks bullish trend changes. Find out how the pattern has performed in the past and
CONNECING THE DOTS Candlesticks & Convergence of Clues. The Art & Science of Active Trend Trading
 CONNECING THE DOTS Candlesticks & Convergence of Clues The Art & Science of Active Trend Trading Disclaimer U.S. Government Required Disclaimer Commodity Futures Trading Commission Futures and Options
The Fish Hook Pattern
 The Fish Hook Pattern GOAL The Fish Hook Pattern is a trade entry method that is mentioned from time to time in Jim s Chartbook and on the Premium Alert Service. The idea behind the Fish Hook is that it
Trading Lessons from the Intraday Frame (study)
") 1 Daily "Idealized Trades" Report Trading Lessons from the Intraday Frame (study) 1 2018 TheoTrade LLC. All rights reserved. 2 Trading Lessons from the Intraday Frame (1-min) 2 2018 TheoTrade LLC. All
1 Daily "Idealized Trades" Report Trading Lessons from the Intraday Frame (study) 1 2018 TheoTrade LLC. All rights reserved. 2 Trading Lessons from the Intraday Frame (1-min) 2 2018 TheoTrade LLC. All
If you have traded forex long enough, you will notice that sometimes, price has an uncanny ability to reverse exactly at or around fibonacci levels.
 Fibonacci Forex Trading Strategy With Reversal Candlesticks The Fibonacci forex trading strategy with reversal candlesticks is simply about using fibonacci retracements in conjunction with reversal candlesticks.
t 2 u n i v e r s i t y
 t2 university Trading State Management What is Trading State Management? Recent trading events can affect your Trading State. Losses can make it harder to execute entries, cause you to break exit rules
11-Hour Options 2.0 The Next Evolution of Success
 presented by Thomas Wood MicroQuant SM Identifying Key Support and Resistance Levels 11-Hour Options 2.0 The Next Evolution of Success Risk Disclaimer Trading or investing carries a high level of risk,
Fibo Vector Published by Old Tree Publishing CC Suite 509, Private Bag X503 Northway, 4065, KZN, ZA
 Fibo Vector Published by Old Tree Publishing CC Suite 509, Private Bag X503 Northway, 4065, KZN, ZA www.oldtreepublishing.com Copyright Old Tree Publishing CC, KZN, ZA Reproduction or translation of any
FOREX INDICATORS. THEIR PRIORITY and USE
 FOREX INDICATORS THEIR PRIORITY and USE by G. C. Smith U.S. Government Required Disclaimer Trading foreign exchange markets on margin carries a high level of risk, and may not be suitable for all investors.
Weekly outlook for April 30 May
 Weekly outlook for April 30 May 4 2018 Summary The S&P500 index is having trouble deciding if it will rally or decline. This indecision makes trading less profitable. Wait for a break-out direction to
Stacking Indicators Getting a GREAT entry! TWEEZERS Tweezer top/bottom at the band The stock is trending up Gap down (against the trend) Any moving
 Any moving") Dean Storholt I am not a registered broker-dealer or investment adviser. I will mention that I consider certain securities or positions to be good candidates for the types of strategies we are discussing
Dean Storholt I am not a registered broker-dealer or investment adviser. I will mention that I consider certain securities or positions to be good candidates for the types of strategies we are discussing
DAY TRADING GUIDE TRADE ON EVERY MOVE CATCH ME IF YOU CAN.
 DAY TRADING GUIDE TRADE ON EVERY MOVE CATCH ME IF YOU CAN. RISK WARNING PAST PERFORMANCE DOES NOT INDICATE FUTURE RESULTS. TRADE WITH STRICT MINIMAL MONEY MANAGEMENT TO AVOID PSYCHOLOGICAL EMOTION WHILE
The Art & Science of Active Trend Trading
 CONNECTING THE DOTS Candlesticks & Convergence of Clues The Art & Science of Active Trend Trading Copyright ATTS 2007-2015 1 Dennis W. Wilborn, P.E. Founder, President Active Trend Trading dww@activetrendtrading.com
Naked Trading and Price Action
 presented by Thomas Wood MicroQuant SM Divergence Trading Workshop Day One Naked Trading and Price Action Risk Disclaimer Trading or investing carries a high level of risk, and is not suitable for all
presented by Thomas Wood MicroQuant SM Divergence Trading Workshop Day One Naked Trading Part 2
 presented by Thomas Wood MicroQuant SM Divergence Trading Workshop Day One Naked Trading Part 2 Risk Disclaimer Trading or investing carries a high level of risk, and is not suitable for all persons. Before
The Stackable Carry Trade
 The Stackable Carry Trade Introduction: The Carry Trade is a relatively popular strategy among Forex traders. The concept is to pair high yielding interest currencies against low interest currencies in
Forex Range Trading With Price Action Forex Trading System By Laurentiu Damir
 Forex Range Trading With Price Action Forex Trading System By Laurentiu Damir Copyright 2012 by Laurentiu Damir All rights reserved. No part of this book may be reproduced or transmitted in any form or
Intra-Day Trading Techniques
 Pristine.com Presents Intra-Day Trading Techniques With Greg Capra Co-Founder of Pristine.com, and Co-Author of the best selling book, Tools and Tactics for the Master Day Trader Copyright 2001, Pristine
Technical Analysis Workshop Series. Session Six 1, 2, 3 Price-Bars Patterns
 Technical Analysis Workshop Series Session Six 1, 2, 3 Price-Bars Patterns DISCLOSURES & DISCLAIMERS This research material has been prepared by NUS Invest. NUS Invest specifically prohibits the redistribution
The Art & Science of Active Trend Trading
 CONNECTING THE DOTS Candlesticks & Convergence of Clues The Art & Science of Active Trend Trading Copywrite ATTS 2007-2015 1 Dennis W. Wilborn, P.E. Founder, President Active Trend Trading dww@activetrendtrading.com
NEWSLETTER SWING TRADING. 28 Feb Intelligent Analysis to point your decisions in the right direction
 NEWSLETTER 28 Feb 2018 Intelligent Analysis to point your decisions in the right direction SWING TRADING Newsletter contains index, stocks and sector recommendations along with market outlook. It also
14 th November General Outlook. Ian Copsey
 2006 General Outlook The Dollar is higher across the board and looks generally positive for one more rally to marginal new highs at least. The 1.2745 EURUSD, 1.2523 USDCHF and 1.8925-45 GBPUSD areas all
Wave-to-Wave Trading Analysis June 1, 2012
 Trading Wave-to-Wave 1 Wave-to-Wave Trading Analysis June 1, 2012 S&P 500 Index ETF (SPY) Successful traders understand that there are waves within waves 5-minute waves inside of 60-minute waves inside
2.0. Learning to Profit from Futures Trading with an Unfair Advantage! Trading Essentials Framework Trader Business Plan
 2.0 Learning to Profit from Futures Trading with an Unfair Advantage! Trading Essentials Framework 11 Steps in Developing a Successful Trading BUSINESS PLAN Every successful trader MUST have a written
Introduction Guide to Johnathon Fox's Price Action Trading Strategy
 Introduction Guide to Johnathon Fox's Price Action Trading Strategy TRADING GUIDE TABLE OF CONTENTS: - Introduction Guide to Johnathon Fox's Price Action Trading Strategy - The 'Holy Grail' - The Responsibility
How many of you are or will be trading a small account?
 Dean Storholt I am not a registered broker-dealer or investment adviser. I will mention that I consider certain securities or positions to be good candidates for the types of strategies we are discussing
Trading Lessons from the Intraday Frame (study)
") 1 Daily "Idealized Trades" Report Trading Lessons from the Intraday Frame (study) 1 2018 TheoTrade LLC. All rights reserved. 2 Trading Lessons from the Intraday Frame (1-mi) 2 2018 TheoTrade LLC. All rights
1 Daily "Idealized Trades" Report Trading Lessons from the Intraday Frame (study) 1 2018 TheoTrade LLC. All rights reserved. 2 Trading Lessons from the Intraday Frame (1-mi) 2 2018 TheoTrade LLC. All rights
Core CFD trading skills
 chapter 7 Core CFD trading skills In this chapter we examine the core skills that you need to develop to trade successfully. Mastering these core competencies is essential to mastering CFD trading. It
 Disclaimer The candlestick patterns explained in this book are intended to provide information only.. Use these patterns is at your discretion. The use and application of the included patterns can involve
Using Price Action to Identify Trends. GFF Brokers
 Using Price Action to Identify Trends GFF Brokers What this ebook is about This ebook focuses on the use of price action techniques to identify trends and micro trends. Price action analysis is a technical
Binary Options Trading Strategies How to Become a Successful Trader?
 Binary Options Trading Strategies or How to Become a Successful Trader? Brought to You by: 1. Successful Binary Options Trading Strategy Successful binary options traders approach the market with three
BY JIM PRINCE
 No part of this publication may be reproduced, stored in a retrieval system, or transmitted in any form or by any means electronic, mechanical, photocopying, recording, or otherwise without the prior permission
Trading Lessons from the Intraday Frame (study)
") 1 Daily "Idealized Trades" Report Trading Lessons from the Intraday Frame (study) 1 2018 TheoTrade LLC. All rights reserved. 2 Trading Lessons from the Intraday Frame (1-mi) Major Companies Reporting Earnings
1 Daily "Idealized Trades" Report Trading Lessons from the Intraday Frame (study) 1 2018 TheoTrade LLC. All rights reserved. 2 Trading Lessons from the Intraday Frame (1-mi) Major Companies Reporting Earnings
Day Trading Strategies. Day Strategies. and Examples. & Risk Management COPYRIGHTED MATERIAL: ANDREW AZIZ (C)
") Day Trading Strategies Day Strategies and Examples & Risk Management ANDREW AZIZ SESSION 4 Disclaimer BearBullTraders.com employees, contractors, shareholders and affiliates, are NOT an investment advisory
Day Trading Strategies Day Strategies and Examples & Risk Management ANDREW AZIZ SESSION 4 Disclaimer BearBullTraders.com employees, contractors, shareholders and affiliates, are NOT an investment advisory
How to Build your Trading Watchlist Table of Contents
 Table of Contents Risk Warning... 1 We ve All Been There... 2 Why Do you Need a watchlist?... 2 Starting Where you Have an Edge!... 2 Find the Dominant Psychology in a Pair... 3 Understanding Directional
presented by Thomas Wood MicroQuant SM Divergence Trading Workshop Day One Black Gold
 presented by Thomas Wood MicroQuant SM Divergence Trading Workshop Day One Black Gold Risk Disclaimer Trading or investing carries a high level of risk, and is not suitable for all persons. Before deciding
50 Pips A Day Forex Strategy. How To Build A Solid Trading System. By Laurentiu Damir. Copyright 2012 by Laurentiu Damir
 50 Pips A Day Forex Strategy How To Build A Solid Trading System By Laurentiu Damir Copyright 2012 by Laurentiu Damir All rights reserved. No part of this book may be reproduced or transmitted in any form
Trends. Define the term Trend Explain why Trend is important Identify Primary, Secondary, and Short-Term trends
 Trends Define the term Trend Explain why Trend is important Identify Primary, Secondary, and Short-Term trends 1 What is a Trend? Uptrend Prices rise and fall in Trends Trend is defined as: Up (Rising)
Stacking Indicators Getting a GREAT entry! TWEEZERS Tweezer top/bottom at the band The stock is trending up Gap down (against the trend) Any moving
 Any moving") Dean Storholt I am not a registered broker-dealer or investment adviser. I will mention that I consider certain securities or positions to be good candidates for the types of strategies we are discussing
Dean Storholt I am not a registered broker-dealer or investment adviser. I will mention that I consider certain securities or positions to be good candidates for the types of strategies we are discussing
Technical Analysis. Dealing Room Peter Leonidou. Peter Leonidou
 Technical Analysis Dealing Room Questions Traders Should Ask What is the trend? What is the pivot point? What is the support levels? What is the resistance levels? Strong or weaker USD? What 1. Trade
Copyright PriceAction5.com
 1 Copyright PriceAction5.com All rights reserved. Unauthorised resell or copying of this material is unlawful. No portion of this ebook may be copied or resold without written permission. PriceAction5.com
Trend Channels: How to Identify Easy Profit-Making Opportunities Using Simple Chart Analysis
 Trend Channels: How to Identify Easy Profit-Making Opportunities Using Simple Chart Analysis Trend channels produce a very powerful trading technique. They are very visible, which makes them easy to utilize
Trading Lessons from the Intraday Frame (study)
") 1 Daily "Idealized Trades" Report Trading Lessons from the Intraday Frame (study) 1 2018 TheoTrade LLC. All rights reserved. 2 Trading Lessons from the Intraday Frame (1-mi) 2 2018 TheoTrade LLC. All rights
1 Daily "Idealized Trades" Report Trading Lessons from the Intraday Frame (study) 1 2018 TheoTrade LLC. All rights reserved. 2 Trading Lessons from the Intraday Frame (1-mi) 2 2018 TheoTrade LLC. All rights
Trading Strategy Tested and fluid strategy is essential
 Trading Strategy Tested and fluid Roman Sadowski Making $1.000.000.000 in Forex aint easy but many traders do it! The goal of any forex trader is to maximize profits. But it ain t easy unless you have
Fundamental Analysis is the study of Financial Statements and Ratios which help evaluate a company s overall Value and Growth potential.
 Trading vs. Investing Investing is defined as taking a stake in a company in hopes of benefiting from their prosperity through price appreciation and dividend payouts. Fundamental Analysis is the study
EARN 38 to 54%+ Returns Spending Under 30 Minutes a Day. Presented by: Todd Mitchell CEO & Founder Trading Concepts, Inc.
 EARN 38 to 54%+ Returns Spending Under 30 Minutes a Day Presented by: Todd Mitchell CEO & Founder Trading Concepts, Inc. Who is Todd Mitchell? I have been involved with the markets and actively trading
Gunning For Stops By: Lan H. Turner
 Gunning For Stops By: Lan H. Turner Stop order management can be a very complex subject, because in my opinion, it is the difference between a traders success and failure. This article is not in any sense