Technical analysis & Charting The Foundation of technical analysis is the Chart.
|
|
|
- Carol Williams
- 5 years ago
- Views:
Transcription

1 Technical analysis & Charting The Foundation of technical analysis is the Chart. Charts Mainly there are 2 types of charts 1. Line Chart 2. Candlestick Chart Line charts A chart shown below is the Line chart is the simplest type of chart. As shown in the chart the single line represents the stocks closing price on each day. Dates are displayed along the bottom of the chart and prices are displayed on the side(s). Line charts are typically displayed using stocks closing prices. Candlestick charts A candlestick chart displays stocks open high, low, and closing price. These type of charts are the most popular type of all charts. As shown below the top of each vertical bar represents the highest price of the stock and the bottom of the bar represents the lowest price of the stock it reached on that day. A closing price (last price) is displayed on the right side of the bar. The red bar indicates that stock has closed lower then its open price and white bar indicates that the stock has closed above its open price. At the bottom you can see time frame

2 Support and Resistance Support and Resistance prices are very important in stock market and in technical analysis. Support - The support level is considered when the stock is falling down. The support is the level at which the stock price gets support when the stock is falling down, and if the support breaks then that stock may witness further down movement. Resistance - The Resistance is taken into picture when stock price is moving up. The resistance level is the price at which stock price get stoppage and if this stoppage/resistance breaks then further upside is expected in that stock price. Generally, stocks comes to support and resistance points and get constant before further movement and further movement either down side or upside depends on buyers expectation and other technical aspects. The breaking of support and resistance levels can also be triggered by fundamental changes, and that is up to investor expectations (fundamental changes like changes in profits, expansion, takeover, management etc). Supply and demand There is nothing strange about support and resistance levels. It is just supply and demand. The supply is the number of shares that sellers are willing to supply (sell) at a given price. The demand is the number of shares that buyers are willing to buy at a given price. The investor expectations keeps on changing and so do the prices of stocks. A breakout above a resistance level is evidence of an upward move as more buyers (demand) are willing to buy at higher prices. Similarly, the failure of a support level indicates that more supply (seller) is available and ready to sell at lower levels. The Basic foundation of technical analysis tools is in the concept of supply and demand. So Charts provide us the best view and analysis of these levels in action. Traders Regret (unhappy) Level After the break out of a support/resistance level, it is common for stock traders to think on the new price levels, whether this price is suitable or not which results in further upward or downward movement. So in other words we can call this as traders regret. So due to this the price may come back to support/resistance level. In such scenarios one of the two things can happen. Either the stock prices will move back to their previous level OR investors/traders will accept the new price and the stock price will keep moving up in the direction of breakout
3 How to understand what is going to happen and when? A breakout generally happens with the support of huge volumes. If the price breaks through the support/resistance level with a large increase in volume and the traders regret period is on relatively low volume then this indicates that the new price up lift will keep ongoing. Conversely, if the breakout is on moderate volume and the traders regret period is on increased volume then this indicates that very few investor expectations have changed and hence return to the original price. Changes in price are the result of changes in investor expectations of the stocks future price. Trends In the earlier chapter, we saw how support and resistance levels can be penetrated by a change in investor expectations which results in shifts of the supply/demand and hence change in stock price. This type of a change is always based on News. In this TRENDS section, we will see what is trend and how it influences stock prices. A trend represents a consistent change in prices. A trend is different from support/resistance levels. Trends represent change, whereas support/resistance levels represent barriers to change. Upper Trend = A rising trend is defined as stock prices keep touching higher prices. A rising trend can be thought of as a rising support level and the bulls are in controls which are pushing the stock prices higher and higher. Falling trend = It is defined as stock prices keep touching lower prices. A falling trend can be thought of as a falling resistance level and bears are in controls which are pushing the stock prices lower and lower. The break out takes place when investor s expectations change in support with increase in volumes. As in support/resistance, in trend lines also Volumes plays a major role in continuing the trend or in break out of the trend. Moving Averages Moving averages are one of the oldest and most popular technical analysis tool. This section describes the basic of moving average and interpretation. Nowadays you get moving averages readily available on most of the websites. To brief you moving average is calculated by adding the closing prices of a stock for most recent 15 days and then dividing by 15 the result what you get is the 15 day moving average. How to trade on moving average Suppose If the stock price is above its 25 day moving average, it means that investor's current expectations (the current price of the stock) are higher than their average expectations over the last 25 days, and that investors are becoming increasingly bullish on this stock and result is that the stock price may go up. Conversely, if today's price is below then its 25 day moving average, it shows that current expectations are below average expectations over the last 25 days and this may bring stock price lower. The moving average is used to observe changes in prices. Investors typically buy when a stock price rises above its moving average and sell when the price falls below its moving average. Indicators Indicators are used to predict or analyze future changes in stock price. There are hundreds of indicators but in this section we will discussed the indicators which are most widely used and important ones. MACD This is one of the widely used indicator. MACD stands for Moving Average Convergence Divergence. This indicator is based on moving averages Nowadays MACD is readily available on any web sites. No need to sit and calculate. But just to understand let us brief about it.

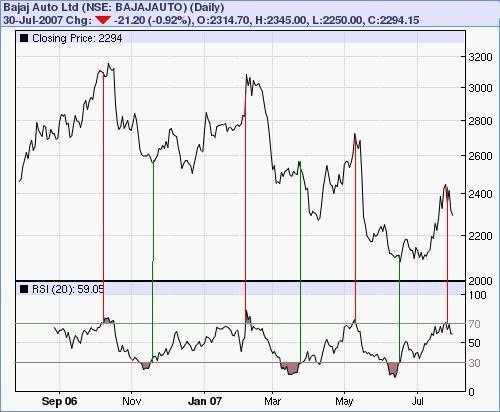
4 The MACD is calculated by subtracting a 26-day moving average (long term) of a security's price from a 12- day moving average (short term) of its price. The result is that MACD is an indicator that goes above and below zero. How to trade on MACD indicator? Have a look on following chart of MACD - Red line is short term moving average and blue line is long term moving average. When the short term moving average crosses above the long term moving average (as shown in following chart) in the upward direction, it means investor expectations are becoming bullish and there may be rise in stock price. As it is shown in following chart with green lines how price increases. When the short term moving average crosses below the long term moving average (as shown in following chart) in the downward direction, it means investor expectations are becoming bearish and there may be decrease in stock price. As it shown in following chart with red lines lines how orice decreases. Relative Strength Index (RSI) The RSI is another one of the most used and well-known leading momentum indicators in technical analysis. The main use of RSI is used to find whether the stock is overbought or oversold. The RSI indicator is plotted in a range of between 0 and 100. If RSI is reached above 70 then it is considered that stock is overbought and if it reaches below 30 then it is considered that the stock is oversold. The bullish signal How to trade on RSI Indicator Basically the RSI is a price-following indicator used to look for a divergence in which the stock is making a new high, but the RSI is failing to exceed its previous high. This divergence is an indication of an impending reversal. When the RSI then turns down and starts falling. To put more light, have a look on following chart.
5
INTERMEDIATE EDUCATION GUIDE
 INTERMEDIATE EDUCATION GUIDE CONTENTS Key Chart Patterns That Every Trader Needs To Know Continution Patterns Reversal Patterns Statistical Indicators Support And Resistance Fibonacci Retracement Moving
Knowing When to Buy or Sell a Stock
 Knowing When to Buy or Sell a Stock Overview Review & Market direction Driving forces of market change Support & Resistance Basic Charting Review & Market Direction How many directions can a stock s price
1. Introduction 2. Chart Basics 3. Trend Lines 4. Indicators 5. Putting It All Together
 Technical Analysis: A Beginners Guide 1. Introduction 2. Chart Basics 3. Trend Lines 4. Indicators 5. Putting It All Together Disclaimer: Neither these presentations, nor anything on Twitter, Cryptoscores.org,
Introduction. Technicians (also known as quantitative analysts or chartists) usually look at price, volume and psychological indicators over time.
 usually look at price, volume and psychological indicators over time.") Technical Analysis Introduction Technical Analysis is the study of market action, primarily through the use of charts, for the purpose of forecasting future price trends. Technicians (also known as quantitative
Technical Analysis Introduction Technical Analysis is the study of market action, primarily through the use of charts, for the purpose of forecasting future price trends. Technicians (also known as quantitative
The six technical indicators for timing entry and exit in a short term trading program
 The six technical indicators for timing entry and exit in a short term trading program Definition Technical analysis includes the study of: Technical analysis the study of a stock s price and trends; volume;
Chapter 2.3. Technical Analysis: Technical Indicators
 Chapter 2.3 Technical Analysis: Technical Indicators 0 TECHNICAL ANALYSIS: TECHNICAL INDICATORS Charts always have a story to tell. However, from time to time those charts may be speaking a language you
Introduction. Technical analysis is the attempt to forecast stock prices on the basis of market-derived data.
 Technical Analysis Introduction Technical analysis is the attempt to forecast stock prices on the basis of market-derived data. Technicians (also known as quantitative analysts or chartists) usually look
Chapter 2.3. Technical Indicators
 1 Chapter 2.3 Technical Indicators 0 TECHNICAL ANALYSIS: TECHNICAL INDICATORS Charts always have a story to tell. However, sometimes those charts may be speaking a language you do not understand and you
OSCILLATORS. TradeSmart Education Center
 OSCILLATORS TradeSmart Education Center TABLE OF CONTENTS Oscillators Bollinger Bands... Commodity Channel Index.. Fast Stochastic... KST (Short term, Intermediate term, Long term) MACD... Momentum Relative
Table of Contents. Risk Disclosure. Things we will be going over. 2 Most Common Chart Layouts Anatomy of a candlestick.
 Table of Contents Risk Disclosure Things we will be going over 2 Most Common Chart Layouts Anatomy of a candlestick Candlestick chart Anatomy of a BAR PLOT Indicators Trend-Lines Volume MACD RSI The Stochastic
Introduction. Leading and Lagging Indicators
 1/12/2013 Introduction to Technical Indicators By Stephen, Research Analyst NUS Students Investment Society NATIONAL UNIVERSITY OF SINGAPORE Introduction Technical analysis comprises two main categories:
Forex Sentiment Report Q2 FORECAST WEAK AS LONG AS BELOW April
 Forex Sentiment Report 08 April 2015 www.ads-securities.com Q2 FORECAST WEAK AS LONG AS BELOW 1.1200 Targets on a break of 1.1534/35: 1.1740/50 1.1870/75 1.2230/35 Targets on a break of 1.0580/70: 1.0160
Williams Percent Range
 Williams Percent Range (Williams %R or %R) By Marcille Grapa www.surefiretradingchallenge.com RISK DISCLOSURE STATEMENT / DISCLAIMER AGREEMENT Trading any financial market involves risk. This report and
Technical Analysis Workshop Series. Session Two
 Technical Analysis Workshop eries ession Two DICLOURE & DICLAIMER This research material has been prepared by NU Invest. NU Invest specifically prohibits the redistribution of this material in whole or
Technical Analysis Workshop Series. Session Six 1, 2, 3 Price-Bars Patterns
 Technical Analysis Workshop Series Session Six 1, 2, 3 Price-Bars Patterns DISCLOSURES & DISCLAIMERS This research material has been prepared by NUS Invest. NUS Invest specifically prohibits the redistribution
CHARTS. Bar Line Candlestick Charts are the basis of technical analysis They are a graphic display of price action. Notes:
 TECHNICAL ANALYSIS CHARTS Bar Line Candlestick Charts are the basis of technical analysis They are a graphic display of price action Candlestick charts have become the industry standard for technical traders.
Compiled by Timon Rossolimos
 Compiled by Timon Rossolimos - 2 - The Seven Best Forex Indicators -All yours! Dear new Forex trader, Everything we do in life, we do for a reason. Why have you taken time out of your day to read this
Very Profitable FREE Trading System By Oleg A. But
 Very Profitable FREE Trading System By Oleg A. But Oleg Alexandrovich But Russian Federation Krasnodar region Novorossiysk Prospekt Lenina 18-41 +7 (918) 986-2840 Copyright Information Copyright 2006 5emas-forex-system.com
TD AMERITRADE Technical Analysis Night School Week 2
 TD AMERITRADE Technical Analysis Night School Week 2 Hosted By Derek Moore Director, National Education For the audio portion of today s webcast, please enable your computer speakers. Past performance
Technical Analysis and Charting Part II Having an education is one thing, being educated is another.
 Chapter 7 Technical Analysis and Charting Part II Having an education is one thing, being educated is another. Technical analysis is a very broad topic in trading. There are many methods, indicators, and
PART 3 - CHART PATTERNS & TECHNICAL INDICATORS
 Tyler Chianelli s EASYOPTIONTRADING by OPTION TRADING COACH PART 3 - CHART PATTERNS & TECHNICAL INDICATORS A SIMPLE SYSTEM FOR TRADING OPTIONS WORKS IN UP, DOWN, AND SIDEWAYS MARKETS PART 3.1 - PRIMARY
IVolatility.com E G A R O N E S e r v i c e
 IVolatility.com E G A R O N E S e r v i c e Stock Sentiment Service User Guide The Stock Sentiment service is a tool equally useful for both stock and options traders as it provides you stock trend analysis
 Types of charts Bar charts Candlestick charts Constant volume charts Line charts Tflow charts, exclusively CQG Bar Charts Vertical line representing the high and low of the sessions Horizontal line on
Bollinger Trading Methods. Play 1 - The Squeeze
 Overview: Play 1 - The Squeeze Play 2 - The Trend Trade Play 3 - Reversals Wrap up Bollinger Trading Methods Play 1 - The Squeeze The Squeeze The most popular strategy Looks to enter a trend early on Anticipates
Quad EMA Strategy. by Admiral Markets Trading Camp
 Quad EMA Strategy by Admiral Markets Trading Camp Contents About the Author 3 Strategy Description 4 Exponential Moving Average 5 Awesome Oscillator 9 MACD Indicator 13 Conclusion 19 About the Author Nenad
Chapter 3. Price Action
 Chapter 3 Price Action The movement of price in any market is called Price Action. This movement is caused by the beliefs and trading systems of hundreds of thousands of worldwide traders that the market
Technical Analysis. Dealing Room Peter Leonidou. Peter Leonidou
 Technical Analysis Dealing Room Questions Traders Should Ask What is the trend? What is the pivot point? What is the support levels? What is the resistance levels? Strong or weaker USD? What 1. Trade
Saudi Market (TADAWUL)... 2 Boursa Kuwait... 3 Abu Dhabi Exchange... 4 Dubai Financial Market... 5 Definitions... 6 Contacts... 7.
... 2 Boursa Kuwait... 3 Abu Dhabi Exchange... 4 Dubai Financial Market... 5 Definitions... 6 Contacts... 7.") QNBFS Technical Technical Spotlight Spotlight Sunday, Monday, January March 05, 14, 2018 Contents Saudi Market (TADAWUL)... 2 Boursa Kuwait... 3 Abu Dhabi Exchange... 4 Dubai Financial Market... 5 Definitions...
QNBFS Technical Technical Spotlight Spotlight Sunday, Monday, January March 05, 14, 2018 Contents Saudi Market (TADAWUL)... 2 Boursa Kuwait... 3 Abu Dhabi Exchange... 4 Dubai Financial Market... 5 Definitions...
Candlestick Signals and Option Trades (Part 3, advanced) Hour One
 Hour One") Candlestick Signals and Option Trades (Part 3, advanced) Hour One 1. Hedges, long and short A hedge is any strategy designed to reduce or eliminate market risk. This applies to equity positions and the
Candlestick Signals and Option Trades (Part 3, advanced) Hour One 1. Hedges, long and short A hedge is any strategy designed to reduce or eliminate market risk. This applies to equity positions and the
FOREX. analysing made easy. UNDERSTANDING TECHNICAL ANALYSIS An educational tool by Blackwell Global
 FOREX analysing made easy UNDERSTANDING TECHNICAL ANALYSIS An educational tool by Blackwell Global Risk Warning: Forex and CFDs are leveraged products and you may lose your initial deposit as well as substantial
BUY SELL PRO. Improve Profitability & Reduce Risk with BUY SELL Pro. Ultimate BUY SELL Indicator for All Time Frames
 BUY SELL PRO Improve Profitability & Reduce Risk with BUY SELL Pro Ultimate BUY SELL Indicator for All Time Frames Risk Disclosure DISCLAIMER: Crypto, futures, stocks and options trading involves substantial
CMT LEVEL I CURRICULUM Self-Evaluation
 CMT LEVEL I CURRICULUM Self-Evaluation DEAR CFA CHARTERHOLDER, As a CFA charterholder, the requirement that you sit for the CMT Level I exam is waived. However, the content in the CMT Level I Curriculum
Technical Analysis Indicators
 Technical Analysis Indicators William s Percent R Rules, Scans, Adding Filters, Breakout, Retest, and Application across MTFs Course Instructor: Price Headley, CFA, CMT BigTrends Coaching Access to BigTrends
TECHNICAL INDICATORS
 TECHNICAL INDICATORS WHY USE INDICATORS? Technical analysis is concerned only with price Technical analysis is grounded in the use and analysis of graphs/charts Based on several key assumptions: Price
CHAMELEON INDICATORS. A new way to view the markets. Alex Cole 05/10/17
 CHAMELEON INDICATORS A new way to view the markets. Alex Cole 05/10/17 THE CHAMELEON TREND AND CHAMELEON OSCILLATOR STUDIES One of the most important benefits of visualization is that it allows us visual
MAGIC FOREX DIVERGENCE Trading Guide
 Tim Trush & Julie Lavrin Introducing MAGIC FOREX DIVERGENCE Trading Guide Your guide to financial freedom. Tim Trush, Julie Lavrin, T&J Profit Club, 2017, All rights reserved www.forexmystery.com Table
Figure 3.6 Swing High
 Swing Highs and Lows A swing high is simply any turning point where rising price changes to falling price. I define a swing high (SH) as a price bar high, preceded by two lower highs (LH) and followed
20.2 Charting the Market
 NPTEL Course Course Title: Security Analysis and Portfolio Management Course Coordinator: Dr. Jitendra Mahakud Module-10 Session-20 Technical Analysis-II 20.1. Other Instruments of Technical Analysis Several
Relative Strength Index (RSI) by Ty Young
 by Ty Young") Relative Strength Index (RSI) by www.surefire-trading.com Ty Young Hi, this is Ty Young with Surefire-trading.com and today I will be discussing the Relative Strength Index (RSI). History J. Welles Wilder,
Relative Strength Index (RSI) by www.surefire-trading.com Ty Young Hi, this is Ty Young with Surefire-trading.com and today I will be discussing the Relative Strength Index (RSI). History J. Welles Wilder,
Moving Average Convergence Divergence (MACD) by
 by") Moving Average Convergence Divergence (MACD) by www.surefire-trading.com Ty Young Hi, this is Ty Young with Surefiretrading.com and today we will be discussing the Moving Average Convergence/Divergence
Moving Average Convergence Divergence (MACD) by www.surefire-trading.com Ty Young Hi, this is Ty Young with Surefiretrading.com and today we will be discussing the Moving Average Convergence/Divergence
Hidden Divergence. Hello there, you will be excited about the information contained in this report.
 Hidden Divergence Hello there, you will be excited about the information contained in this report. Isn t it remarkable how people like us who are in the Trading business have taken frequently interesting
FinQuiz Notes
 Reading 13 Technical analysis is a security analysis technique that involves forecasting the future direction of prices by studying past market data, primarily price and volume. Technical Analysis 2. TECHNICAL
TDP-Academy Trading SetupGuide
 TDP-Academy Trading SetupGuide Version 1.1. March 2017 Author: Boris Nikolajew & Wiktor Majorkiewicz INDEX 1. Foreword 2. Charts 3. Timeframes 4. Indicators 5. Drawings 6. Chartpatterns 7. Analyzing the
Saudi Market (TADAWUL)... 2 Boursa Kuwait... 3 Abu Dhabi Exchange... 4 Dubai Financial Market... 5 Definitions... 6 Contacts... 7.
... 2 Boursa Kuwait... 3 Abu Dhabi Exchange... 4 Dubai Financial Market... 5 Definitions... 6 Contacts... 7.") QNBFS Technical Technical Spotlight Spotlight Thursday, Sunday, January January 14, 10, 2018 2019 Contents Saudi Market (TADAWUL)... 2 Boursa Kuwait... 3 Abu Dhabi Exchange... 4 Dubai Financial Market...
QNBFS Technical Technical Spotlight Spotlight Thursday, Sunday, January January 14, 10, 2018 2019 Contents Saudi Market (TADAWUL)... 2 Boursa Kuwait... 3 Abu Dhabi Exchange... 4 Dubai Financial Market...
Raising Investment Standards TRADING SEMINAR
 Raising Investment Standards TRADING SEMINAR Raising Investment Standards DISCLAIMER Leveraged foreign exchange and options trading carries a significant level of risk, and may not be suitable for all
Understanding Oscillators & Indicators March 4, Clarify, Simplify & Multiply
 Understanding Oscillators & Indicators March 4, 2015 Clarify, Simplify & Multiply Disclaimer U.S. Government Required Disclaimer Commodity Futures Trading Commission Futures and Options trading has large
Wedge Pattern Breakouts: Explosive Winning Trades
 Wedge Pattern Breakouts: Explosive Winning Trades Prices move in patterns! This is due to one basic investment truism. Human nature exhibits the same habits when it comes to managing investment funds which
The Schaff Trend Cycle
 The Schaff Trend Cycle by Brian Twomey This indicator can be used with great reliability to catch moves in the currency markets. Doug Schaff, president and founder of FX Strategy, created the Schaff trend
Part 2: ASX charts - more charting tools. OHLC / Bar chart
 Part 2: ASX charts - more charting tools OHLC / Bar chart A bar chart simply takes the information from the day's trading and plots that information on a single vertical 'bar'. A tab on the left side of
Contents: Top 40 Chart ; Currency ; Charts of Interest ; Scatter Graph ; Relative Rotation Graph ; Stats. Top 40 Chart
 Contents: Top 40 Chart ; Currency ; Charts of Interest ; Scatter Graph ; Relative Rotation Graph ; Stats Top 40 Chart 1 Last week we saw the Top 40 approaching some moving average resistances, we have
Alpesh s guide to using the Alpesh Patel Special Edition Section 4
 Alpesh s guide to using the Alpesh Patel Special Edition Section 4 How to use my technical Radars Alpesh Patel s Momentum Radar This radar is for people who want to analyse stocks the way I do. It is the
FIND THE SLAM DUNKS: COMBINE VSA WITH TECHNICAL ANALYSIS
 FIND THE SLAM DUNKS: COMBINE VSA WITH TECHNICAL ANALYSIS November 2006 By Todd Krueger In any competitive sports game there must be a specific set of boundaries for the game to make any sense. This actually
Resistance to support
 1 2 2.3.3.1 Resistance to support In this example price is clearly consolidated and we can expect a breakout at some time in the future. This breakout could be short or it could be long. 3 2.3.3.1 Resistance
Technical Analysis Workshop Series. Session 11 Semester 2 Week 5 Oscillators Part 2
 Technical Analysis Workshop Series Session 11 Semester 2 Week 5 Oscillators Part 2 DISCLOSURES & DISCLAIMERS This research material has been prepared by NUS Invest. NUS Invest specifically prohibits the
presented by Thomas Wood MicroQuant SM Divergence Trading Workshop Day One Naked Trading Part 2
 presented by Thomas Wood MicroQuant SM Divergence Trading Workshop Day One Naked Trading Part 2 Risk Disclaimer Trading or investing carries a high level of risk, and is not suitable for all persons. Before
The Trifecta Guide to Technical Analysis 1
 The Trifecta Guide to Technical Analysis 1 No trading system is bullet-proof. The list of factors that can impact a stock s share price is long and growing from investor sentiment to economic growth to
Module 12. Momentum Indicators & Oscillators
 Module 12 Momentum Indicators & Oscillators Oscillators or Indicators Now we will talk about momentum indicators The term momentum refers to the velocity of a price trend. This indicator measures whether
Summation Index High Accuracy Indicator
 In my trading experience one of the most reliable stock market timing indicators is the Summation Index which is a market breadth indicator. The Summation Index measures the number of advancing stocks
Using Oscillators & Indicators Properly May 7, Clarify, Simplify & Multiply
 Using Oscillators & Indicators Properly May 7, 2016 Clarify, Simplify & Multiply Disclaimer U.S. Government Required Disclaimer Commodity Futures Trading Commission Futures and Options trading has large
Icoachtrader Consulting Service WELCOME TO. Trading Boot Camp. Day 5
 Icoachtrader Consulting Service www.icoachtrader.weebly.com WELCOME TO Trading Boot Camp Day 5 David Ha Ngo Trading Coach Phone: 1.650.899.1088 Email: icoachtrader@gmail.com The information presented is
Introduction to Technical Analysis
 Introduction to Technical Analysis All About Chart Patterns, Candlesticks and Technical Studies rjofutures.rjobrien.com 800-441-1616 A division of R.J. O Brien Important Information About Trading Futures
What is Technical Analysis
 Reg. office: International School of Financial Market, Plot no. 152 - P (LGF), Sec - 38, Medicity Road, Gurgaon - 122002 Contact no. : 0124-2200689,+919540008689, 9654446629 Web : www.isfm.co.in, Email
DAILY DAY TRADING PLAN
 DAILY DAY TRADING PLAN Gatherplace will be used to place all of your trades. You will be using the 5 minute chart for the trade setup and the 1 minute chart for your entry, stop and trailing stop.you will
With that, let s dive into the steps. Step 1 Identify range bound markets on Daily or 4 Hour Charts
 If you have been trading for any length of time, you have probably noticed that the markets are moving sideways A LOT. Consolidation is a huge part of the market s balance and so it makes sense to learn
The Most Important Price Action Patterns for Babon Traders
 The Most Important Price Action Patterns for Babon Traders There are dozens of different Price Action formations and Japanese candles' formations, as a matter of fact almost any so called "expert" and
Additional Reading Material on Technical Analysis
 Additional Reading Material on Relevant for 1. Module 7 (Financial Statement Analysis and Asset Valuation) 2. Module 18 (Securities and Derivatives Trading [Products and Analysis]) Copyright 2017 Securities
presented by Thomas Wood MicroQuant SM Divergence Trading Workshop Day One Black Gold
 presented by Thomas Wood MicroQuant SM Divergence Trading Workshop Day One Black Gold Risk Disclaimer Trading or investing carries a high level of risk, and is not suitable for all persons. Before deciding
AUTHOR: NG EE HWA, TRAINER, CHARTNEXUS TRADING WITH RSI
 AUTHOR: NG EE HWA, TRAINER, CHARTNEXUS TRADING WITH RSI While the use of Relative Strength Index (RSI) to get technical buy and sell signals in a range-bound market is well understood, the use of this
FOREX TRADING STRATEGIES.
 FOREX TRADING STRATEGIES www.ifcmarkets.com www.ifcmarkets.com 2 One of the most powerful means of winning a trade is the portfolio of Forex trading strategies applied by traders in different situations.
Profiting. with Indicators. By Jeff Drake with Ed Downs
 Profiting with Indicators By Jeff Drake with Ed Downs Profiting with Indicators By Jeff Drake with Ed Downs Copyright 2018 Nirvana Systems Inc. All Rights Reserved The charts and indicators used in this
The very first calculations for average gain and average loss are simple 14- period averages.
 Introduction Developed by J. Welles Wilder, the Relative Strength Index (RSI) is a momentum oscillator that measures the speed and change of price movements. RSI oscillates between zero and 100. Traditionally,
Technical Indicators that Really Work
 Technical Indicators that Really Work TECHNICAL INDICATORS Technical indicators have become more important than Fundamentals. With the proper use of technical indicators investors are able to determine
Saudi Market (TADAWUL)... 2 Boursa Kuwait... 3 Abu Dhabi Exchange... 4 Dubai Financial Market... 5 Definitions... 6 Contacts... 7.
... 2 Boursa Kuwait... 3 Abu Dhabi Exchange... 4 Dubai Financial Market... 5 Definitions... 6 Contacts... 7.") QNBFS Technical Technical Spotlight Spotlight Sunday, Monday, January April 16, 14, 2018 2018 Contents Saudi Market (TADAWUL)... 2 Boursa Kuwait... 3 Abu Dhabi Exchange... 4 Dubai Financial Market... 5
QNBFS Technical Technical Spotlight Spotlight Sunday, Monday, January April 16, 14, 2018 2018 Contents Saudi Market (TADAWUL)... 2 Boursa Kuwait... 3 Abu Dhabi Exchange... 4 Dubai Financial Market... 5
Chapter Eight. Japanese Candle Chart
 Chapter Eight Japanese Candle Chart Candle chart (also called candlestick) analysis has been used since the 18 th century by Japanese rice traders to predict the rice price s movement. According to sources,
An Introduction to Candlesticks for Options Using Nison Candlesticks as the Foundation to your option trading
 Using Nison Candlesticks as the Foundation to your option trading, CMT President: Candlecharts.com Candlestick Benefits Easy to Understand Early Reversals Safety First East + West All markets All Time
Bull & bear configs 4/16/2013
 Bull & bear configs 4/16/2013 Our trading model is based on moving averages, and our definition of a bull and bear market differs greatly from the conventional. This simple strategy allows us to take positions
Volume And Divergence
 The Trader s Bread And Butter Volume And Divergence Here s how you can use a divergence between price and volume for trading forex futures or exchange traded funds. T by Gail Mercer he first time I looked
The Technical Edge Page 1. The Technical Edge. Part 1. Indicator types: price, volume, and moving averages and momentum
 The Technical Edge Page 1 The Technical Edge INDICATORS Technical analysis relies on the study of a range of indicators. These come in many specific types, based on calculations or price patterns. For
Intra-Day Trading Techniques
 Pristine.com Presents Intra-Day Trading Techniques With Greg Capra Co-Founder of Pristine.com, and Co-Author of the best selling book, Tools and Tactics for the Master Day Trader Copyright 2001, Pristine
Tradeciety s Price Action Guide
 Tradeciety s Price Action Guide Welcome... 3 Who am I?... 3 Some impressions from my trading & traveling lifestyle... 4 What Is Price Action?... 6 Candlesticks vs. Chart patterns... 7 Top 3 Candlestick
OPTIONS STRATEGY QUICK GUIDE
 OPTIONS STRATEGY QUICK GUIDE OPTIONS STRATEGY QUICK GUIDE Trading options is a way for investors to take advantage of nearly any market condition. The strategies in this guide will let you trade, generate
Martin Pring s. Weekly InfoMovie Report. December 27, Happy New Year to Our Wonderful Subcriber Family! May 2013 be Prosperous and Productive!
 Martin Pring s Weekly InfoMovie Report December 27, 2012 Issue 1028 Happy New Year to Our Wonderful Subcriber Family! May 2013 be Prosperous and Productive! The Pring Family ~ 2012 Weekly InfoMovie Report
EDUCATIONAL MATERIAL What Is Forex
 EDUCATIONAL MATERIAL What Is Forex Forex trading is the buying and the selling of specific currency pairs. TOGETHER WE REACH THE GOAL The foreign exchange or 'Forex Market' is the world's largest financial
Multi Indicator Usage Concepts 4/1/2012 Brooky-Indicators.com Brooky
 Multi Indicator Usage Concepts www.brooky-indicator.com 4/1/2012 Brooky-Indicators.com Brooky U.S. Government Required Disclaimer Commodity Futures Trading Commission Futures, Currency and Options trading
1 P a g e. Executive Summary
 Executive Summary Price finally reached our expect SPX2112-2120 and the negative divergences that started to creep in on the daily TIs finally also took their toll over the past 2 days. The weekly charts
Date: 21 September Contents (ctrl+click to follow link): SP 500
: SP 500") Date: 21 September 2015 Contents (ctrl+click to follow link): SP 500 ; Top 40 Chart ; Currency ; Charts of Interest ; Relative Rotation Graph ; Scatter Graph ; Sector Analysis ; Weekly Perfomances SP 500
Date: 21 September 2015 Contents (ctrl+click to follow link): SP 500 ; Top 40 Chart ; Currency ; Charts of Interest ; Relative Rotation Graph ; Scatter Graph ; Sector Analysis ; Weekly Perfomances SP 500
Trading Lessons from the Intraday Frame (study)
") 1 Daily "Idealized Trades" Report Trading Lessons from the Intraday Frame (study) 1 2018 TheoTrade LLC. All rights reserved. 2 Trading Lessons from the Intraday Frame (1-mi) 2 2018 TheoTrade LLC. All rights
1 Daily "Idealized Trades" Report Trading Lessons from the Intraday Frame (study) 1 2018 TheoTrade LLC. All rights reserved. 2 Trading Lessons from the Intraday Frame (1-mi) 2 2018 TheoTrade LLC. All rights
Schwab Investing Insights Trading Edition Text Close Window Size: November 15, 2007
 Schwab Investing Insights Trading Edition Text Close Window Size: from TheStreet.com November 15, 2007 ON TECHNIQUES Two Indicators Are Better Than One The Relative Strength Index works well but it s better
Swing Trading Strategies that Work
 Swing Trading Strategies that Work Jesse Livermore, one of the greatest traders who ever lived once said that the big money is made in the big swings of the market. In this regard, Livermore successfully
 1 www.candlecharts.com 2 BONUS www. candlecharts.com/special/swing-trading-2/ 3 www. candlecharts.com/special/swing-trading-2/ 4 www. candlecharts.com/special/swing-trading-2/ 5 www. candlecharts.com/special/swing-trading-2/
Agenda. Who is Recognia. Event Driven Technical Analysis. Types of Technical Events. Finding and Validating Ideas using Recognia Q & A
 Disclaimer The information presented here is for educational and informational purposes only. The inclusion of any specific securities detailed is for illustrative purposes only. No information contained
Saudi Market (TADAWUL)... 2 Boursa Kuwait... 3 Abu Dhabi Exchange... 4 Dubai Financial Market... 5 Definitions... 6 Contacts... 7.
... 2 Boursa Kuwait... 3 Abu Dhabi Exchange... 4 Dubai Financial Market... 5 Definitions... 6 Contacts... 7.") QNBFS Technical Technical Spotlight Spotlight Sunday, February January 14, 11, 2018 2018 Contents Saudi Market (TADAWUL)... 2 Boursa Kuwait... 3 Abu Dhabi Exchange... 4 Dubai Financial Market... 5 Definitions...
QNBFS Technical Technical Spotlight Spotlight Sunday, February January 14, 11, 2018 2018 Contents Saudi Market (TADAWUL)... 2 Boursa Kuwait... 3 Abu Dhabi Exchange... 4 Dubai Financial Market... 5 Definitions...
IVGraph Live Service Contents
 IVGraph Live Service Contents Introduction... 2 Getting Started... 2 User Interface... 3 Main menu... 3 Toolbar... 4 Application settings... 5 Working with layouts... 5 Working with tabs and viewports...
Martin Pring s. Weekly InfoMovie Report. April 8, 2014
 Martin Pring s Weekly InfoMovie Report April 8, 2014 Issue 1093 Weekly InfoMovie Report 1 Key level remains $184 on the SPY. US Equity Market - Last time I pointed out that the $184 level on the S&P ETF
Table Of Contents. Introduction. When You Should Not Use This Strategy. Setting Your Metatrader Charts. Free Template 15_Min_Trading.tpl.
 Table Of Contents Introduction When You Should Not Use This Strategy Setting Your Metatrader Charts Free Template 15_Min_Trading.tpl How To Trade 15 Min. Trading Strategy For Long Trades 15 Min. Trading
Methodology. Our team of analysts uses technical and chartist analysis to draw an opinion and make decisions. The preferred chartist elements are:
 Methodology Technical analysis is at the heart of TRADING CENTRAL's expertise. Our methodology is proven. Our chartist and quantitative approach allows us to intervene on different investment horizons.
Research Desk Stock Broking
 Research Desk Stock Broking India ValueMax January 01, 2015 ValueMax Monthly Investment Ideas ValueMax helps clients to take a long stance on stocks from the S&P BSE-100 universe. Comprising monthly technical
Introduction Guide to Johnathon Fox's Price Action Trading Strategy
 Introduction Guide to Johnathon Fox's Price Action Trading Strategy TRADING GUIDE TABLE OF CONTENTS: - Introduction Guide to Johnathon Fox's Price Action Trading Strategy - The 'Holy Grail' - The Responsibility
2.0. Learning to Profit from Futures Trading with an Unfair Advantage! Income Generating Strategies Essential Trading Tips & Market Insights
 2.0 Learning to Profit from Futures Trading with an Unfair Advantage! Income Generating Strategies Essential Trading Tips & Market Insights Income Generating Strategies Essential Trading Tips & Market
Weekly outlook for June 19 June
 Weekly outlook for June 19 June 23 2017 TREND DIRECTION Short Term Trend Intermediate-Term Trend Long Term Trend S&P 500 Oil Gold sideway Up Up down and oversold down down down and oversold soon Sideway