presented by Thomas Wood MicroQuant SM Divergence Trading Workshop Day One Bond Trading Success
|
|
|
- Andrew Page
- 6 years ago
- Views:
Transcription


1 presented by Thomas Wood MicroQuant SM Divergence Trading Workshop Day One Bond Trading Success
2 Risk Disclaimer Trading or investing carries a high level of risk, and is not suitable for all persons. Before deciding to trade or invest you should carefully consider your investment objectives, level of experience, and ability to tolerate risk. This content is subject to change at any time without notice, and is provided for the sole purpose of education and assistance in making independent investment decisions. ValueCharts.com has taken reasonable measures to ensure the accuracy of the information contained herein; however, ValueCharts.com does not guarantee its accuracy and is not liable for any loss or damage which may result directly or indirectly from such content or from an inability to access such information or any delay in or failure of the transmission or the receipt of any instruction or notification in connection therewith. Any past performance results are shown for illustration and example only, are hypothetical and as such have many inherent limitations. No representation is being made that any account will or is likely to achieve profits or losses similar to those shown. Past performance is not necessarily indicative of future results.
3 CFTC Rule 4.41 (Hypothetical Disclaimer) U.S. Government Required Disclaimer - Commodity Futures Trading Commission Futures and Options trading has large potential rewards, but also large potential risk. You must be aware of the risks and be willing to accept them in order to invest in the futures and options markets. Don't trade with money you can't afford to lose. This is neither a solicitation nor an offer to Buy/Sell futures, stocks or options on the same. No representation is being made that any account will or is likely to achieve profits or losses similar to those discussed on this web site. The past performance of any trading system or methodology is not necessarily indicative of future results. CFTC RULE HYPOTHETICAL OR SIMULATED PERFORMANCE RESULTS HAVE CERTAIN LIMITATIONS. UNLIKE AN ACTUAL PERFORMANCE RECORD, SIMULATED RESULTS DO NOT REPRESENT ACTUAL TRADING. ALSO, SINCE THE TRADES HAVE NOT BEEN EXECUTED, THE RESULTS MAY HAVE UNDER-OR- OVER COMPENSATED FOR THE IMPACT, IF ANY, OF CERTAIN MARKET FACTORS, SUCH AS LACK OF LIQUIDITY. SIMULATED TRADING PROGRAMS IN GENERAL ARE ALSO SUBJECT TO THE FACT THAT THEY ARE DESIGNED WITH THE BENEFIT OF HINDSIGHT. NO REPRESENTATION IS BEING MADE THAT ANY ACCOUNT WILL OR IS LIKELY TO ACHIEVE PROFIT OR LOSSES SIMILAR TO THOSE SHOWN. NO REPRESENTATION IS BEING MADE THAT ANY ACCOUNT WILL, OR IS LIKELY TO ACHIEVE PROFITS OR LOSSES SIMILAR TO THOSE DISCUSSED WITHIN THIS SITE, SUPPORT AND TEXTS. OUR COURSE(S), PRODUCTS AND SERVICES SHOULD BE USED AS LEARNING AIDS ONLY AND SHOULD NOT BE USED TO INVEST REAL MONEY. IF YOU DECIDE TO INVEST REAL MONEY, ALL TRADING DECISIONS SHOULD BE YOUR OWN.
4 How to Listen to This Workshop Listen as if you are going to need to teach this to someone else when it is over.
5 Introduction to the Bond Market
6 Introduction to the Bond Market The global bond market has tripled in size over the past 15 years and now exceeds $100 trillion. This makes it larger than the global stock market. Trading volume in bonds is also larger than that of the stock market with an average of $700 billion traded daily.
7 Introduction to the Bond Market Although bonds are typically viewed as a safer investment, prices can be quite volatile and can give great day and swing trading opportunities. The main bond markets that I follow are the 30 year and 10 year treasury bond futures and the ishs 20+ Year Treasury Bond ETF. (TLT)
8 Introduction to the Bond Market The 30 year bond futures move in 1/32 increments, and are $ /point $31.25/tick. The 10 year note moves in 1/64 increments (so /32) and is also $ /point but only ~$15/tick.
9 Introduction to the Bond Market All of the bond markets we trade are fairly good trending markets, both intraday and end of day for day trading and swing trading. They are also great for using multi-timeframe analysis to time entries into larger moves with minimal risk.
10 Identifying High Probability Breakouts
11 High Probability Breakouts The first thing you need to learn in order to become proficient in identifying breakouts, is what is considered good support or resistance levels. When drawing support, resistance, and trendlines, you want to always be looking at pivot points. The more well defined the pivot is, the better the support/resistance is going to be.
12 High Probability Breakouts Additionally, the more times a support or resistance level has been hit, the stronger that support or resistance level is going to be and the faster the move we expect from the break.

13 High Probability Breakouts Additionally, the more times a support or resistance level has been hit, the stronger that support or resistance level is going to be and the faster the move we expect from the break.

14 High Probability Breakouts Additionally, the more times a support or resistance level has been hit, the stronger that support or resistance level is going to be and the faster the move we expect from the break.
15 High Probability Breakouts Before we talk about the highest probability breakouts, we need to first revisit the definition of a trend: Higher High + Higher Low = Up Trend Lower High + Lower Low = Down Trend Anything else is consolidation or reversal
16 High Probability Breakouts Remember, immediately after a trend changes there are two things we look for: 1. Line in the sand (trendline across highs/lows) 2. Previous Support/Resistance (for breakout)
17 High Probability Breakouts

18 High Probability Breakouts

19 High Probability Breakouts
20 High Probability Breakouts
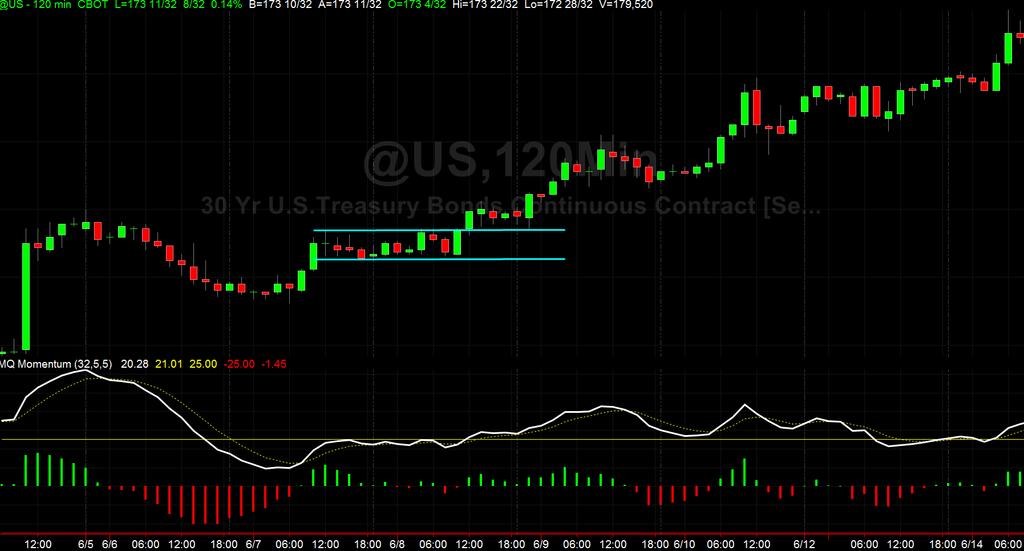
21 High Probability Breakouts The highest probability breakouts are going to be in the direction of the underlying trend. Many times they will occur immediately after a false reversal, or after a breakout that runs into a sideways channel shortly after the initial move.
22 High Probability Breakouts You can increase probabilities by waiting for a close above/below the trendline before you enter the position. Stops are placed below/above the previous bars high or low.
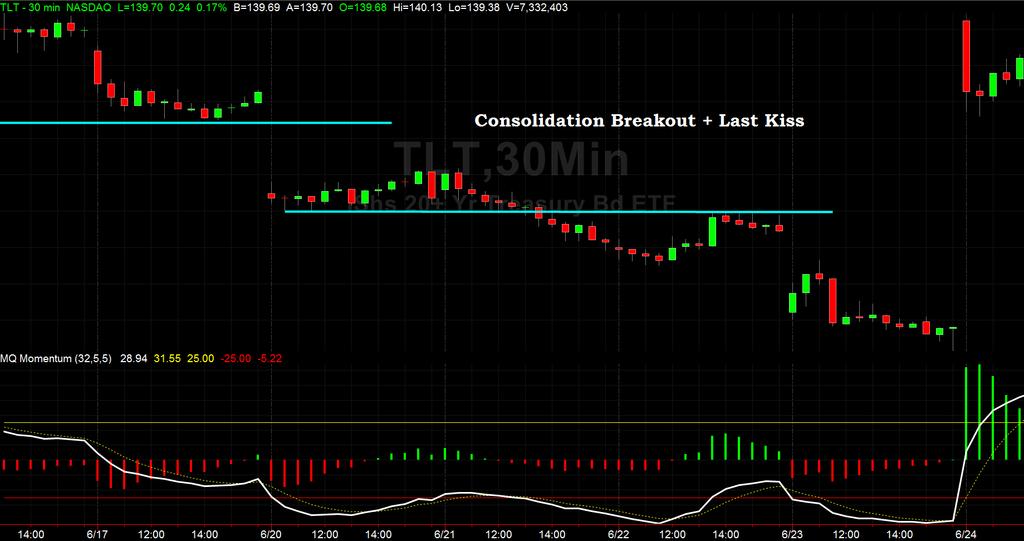
23 High Probability Breakouts It is also important to remember that once support has been broken, it then becomes resistance for 1 test, called a last kiss. Once resistance is broken, it then becomes support for one last kiss trade as well.

24 High Probability Breakouts

25 High Probability Breakouts

26 High Probability Breakouts

27 High Probability Breakouts
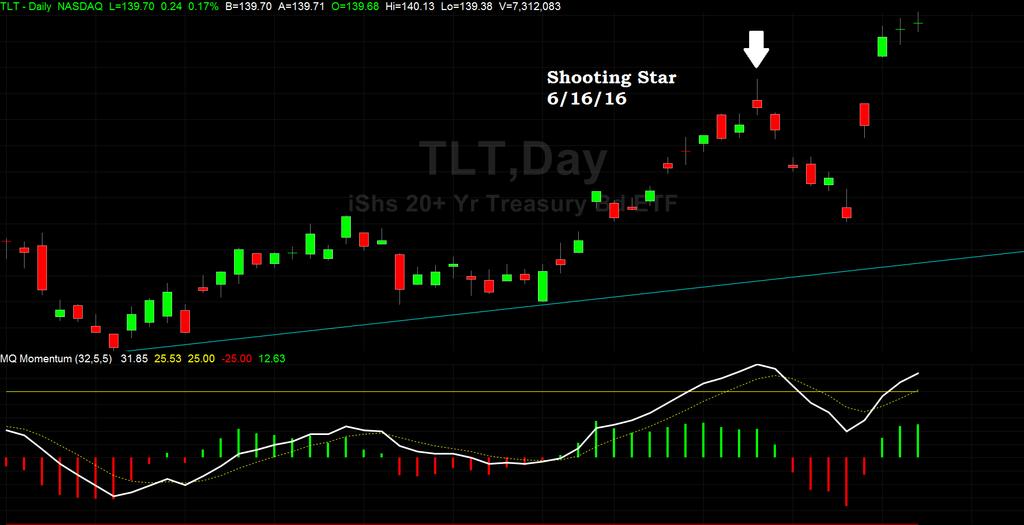
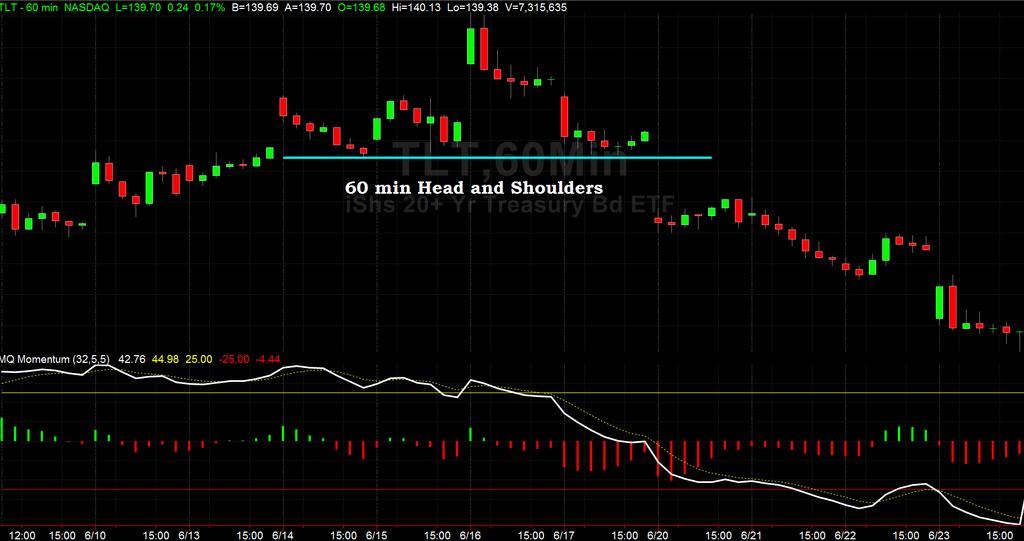
28 High Probability Breakouts Another great breakout pattern for bonds is head and shoulders and inverted head and shoulders patterns. Ideally we will have the top/bottom of both the left and right shoulder at roughly the same height. We also want to see the neckline on both sides of the pattern at almost equal price levels.

29 High Probability Breakouts

30 High Probability Breakouts
31 High Probability Breakouts A breakout in the direction of a trend + a last kiss + a bull/bear flag, will be your highest probability breakout trade. These do not happen all the time, but when they do, they are a great opportunity.
32 High Probability Breakouts Bull and bear flags are seen by looking at a combination of momentum histograms and price action. Histograms on a bull flag must remain green and histograms on a bear flag must remain red.
33 High Probability Breakouts Bull and bear flags are seen by looking at a combination of momentum histograms and price action.

34 High Probability Breakouts Bull and bear flags are seen by looking at a combination of momentum histograms and price action.

35 High Probability Breakouts Bull and bear flags are seen by looking at a combination of momentum histograms and price action.

36 High Probability Breakouts Bull and bear flags are seen by looking at a combination of momentum histograms and price action.
37 Trading Correlated Market Analysis Bonds also have several positive and negative correlations with other markets that we can reference in order to increase our probabilities of success.
38 Trading Correlated Market Analysis They are Positively correlated to one another, 30 year and 10 year and TLT will all move together. They are Negatively correlated to the stock market, and here recently, to crude oil.
39 Trading Correlated Market Analysis They are also considered a risk off market. Meaning, when the stock market picks up volatility and or starts to sell off, many traders will move assets into the bond and gold markets. So when the market starts tanking, watch for bonds (and gold) to start to climb.
40 Trading Correlated Market Analysis The way we use this information is when you are placing bond trades, also check out what the stock market is doing. If the ES is breaking out to the downside at the same time bonds are breaking out to the upside, you have a higher probability trade on your hands.
41 Quiz on Breakout and Trend Setups!

42 Trading Breakouts Quiz The way we use this information is when you are placing bond trades, also check out what the stock market is doing. If the ES is breaking out to the downside at the same time bonds are breaking out to the upside, you have a higher probability trade on your hands.
43 Trading Breakouts Quiz The way we use this information is when you are placing bond trades, also check out what the stock market is doing. If the ES is breaking out to the downside at the same time bonds are breaking out to the upside, you have a higher probability trade on your hands.

44 Trading Breakouts Quiz The way we use this information is when you are placing bond trades, also check out what the stock market is doing. If the ES is breaking out to the downside at the same time bonds are breaking out to the upside, you have a higher probability trade on your hands.

45 Trading Breakouts Quiz The way we use this information is when you are placing bond trades, also check out what the stock market is doing. If the ES is breaking out to the downside at the same time bonds are breaking out to the upside, you have a higher probability trade on your hands.

46 Trading Breakouts Quiz The way we use this information is when you are placing bond trades, also check out what the stock market is doing. If the ES is breaking out to the downside at the same time bonds are breaking out to the upside, you have a higher probability trade on your hands.

47 Trading Breakouts Quiz The way we use this information is when you are placing bond trades, also check out what the stock market is doing. If the ES is breaking out to the downside at the same time bonds are breaking out to the upside, you have a higher probability trade on your hands.

48 Trading Breakouts Quiz The way we use this information is when you are placing bond trades, also check out what the stock market is doing. If the ES is breaking out to the downside at the same time bonds are breaking out to the upside, you have a higher probability trade on your hands.
49 Trading Breakouts Quiz The way we use this information is when you are placing bond trades, also check out what the stock market is doing. If the ES is breaking out to the downside at the same time bonds are breaking out to the upside, you have a higher probability trade on your hands.
50 Questions on Identifying High Probability Breakouts?
51 Multi-Timeframe Setups: Maximizing Reward Risk Ratio
52 Multi-Timeframe Analysis No matter what timeframe we are analyzing, you use the same setups and trade them the same way as you would any other timeframe. If you find a setup appearing on several timeframes at the same time, this is going to give you a much higher probability of success with your trade.
53 Multi-Timeframe Analysis Additionally, make sure you always pay attention to what the longer timeframes are doing. If you have a longer timeframe setup occurring at the same time as your intraday setup, instead of going for a 10 tick gain (~$300/contract) start looking to allow that trade to move much further. This is the best way to increase your long-term reward risk ratio, every once in a while you will get a good trade that can run for 10-15/1 reward risk.

54 Multi-Timeframe Analysis
55 Multi-Timeframe Analysis

56 Multi-Timeframe Analysis
57 Multi-Timeframe Analysis
58 Multi-Timeframe Analysis
59 Multi-Timeframe Analysis
60 Questions on Multi- Timeframe Analysis
61 BONUS: Scalping Bonds for Quick Profits
62 Scalping Bonds for Quick Profits 30 Year and 10 Year Notes offer great scalping opportunities if you play your cards right. When we are scalping we are typically going for 1-3 ticks of profits very quickly.
63 Scalping Bonds for Quick Profits Unlike other trading strategies, when we are scalping, we are normally going for a 1/1 reward/risk ratio or even slightly less. So the way we make money is by being correct the majority of the time.
64 Scalping Bonds for Quick Profits This scalping strategy follows the MQ Momentum histograms as they change from bullish to bearish. The strategy lags by one price bar, so you need to wait for the histogram to close red or close green before placing your order. You are entering on the 2 nd histogram bar.
65 Scalping Bonds for Quick Profits Once the histogram has closed bullish, you enter with a limit order to buy at the open of the next price bar. (You need to use limit

66 5 Min Chart 4 Tick Risk 2 Tick Target Once the histogram has closed bullish, you enter with a limit order to buy at the open of the next price bar. (You need to use limit
67 5 Min Chart 4 Tick Risk 2 Tick Target Once the histogram has closed bullish, you enter with a limit order to buy at the open of the next price bar. (You need to use limit
68 Questions on Scalping Bonds
69 Naked Trading Mentorship Two Week Intensive Naked Trading Mentorship Price: $1, When: August 1-12
presented by Thomas Wood MicroQuant SM Divergence Trading Workshop Day One Black Gold
 presented by Thomas Wood MicroQuant SM Divergence Trading Workshop Day One Black Gold Risk Disclaimer Trading or investing carries a high level of risk, and is not suitable for all persons. Before deciding
Naked Trading and Price Action
 presented by Thomas Wood MicroQuant SM Divergence Trading Workshop Day One Naked Trading and Price Action Risk Disclaimer Trading or investing carries a high level of risk, and is not suitable for all
C y c l e C a n d l e s T r a d i n g W o r k s h o p
 C y c l e C a n d l e s Trading Workshop Risk Disclaimer Trading or investing carries a high level of risk, and is not suitable for all persons. Before deciding to trade or invest you should carefully
presented by Thomas Wood MicroQuant SM Divergence Trading Workshop Day One Naked Trading Part 2
 presented by Thomas Wood MicroQuant SM Divergence Trading Workshop Day One Naked Trading Part 2 Risk Disclaimer Trading or investing carries a high level of risk, and is not suitable for all persons. Before
The Launchpad Strategy
 presented by Thomas Wood MicroQuant SM Divergence Trading Workshop Day One The Launchpad Strategy Risk Disclaimer Trading or investing carries a high level of risk, and is not suitable for all persons.
- My 4 Favorite Trades - Essential Trades of a Professional Trader
 presented by Thomas Wood MicroQuant SM Divergence Trading Workshop Day One - My 4 Favorite Trades - Essential Trades of a Professional Trader Risk Disclaimer Trading or investing carries a high level of
Divergence and Momentum Trading
 presented by Thomas Wood MicroQuant SM Divergence Trading Workshop Day One Divergence and Momentum Trading Risk Disclaimer Trading or investing carries a high level of risk, and is not suitable for all
Real Life Fibonacci Trading & Dynamic Targeting with MQ Trend
 presented by Thomas Wood MicroQuant SM Divergence Trading Workshop Day One Real Life Fibonacci Trading & Dynamic Targeting with MQ Trend Risk Disclaimer Trading or investing carries a high level of risk,
Becoming a Consistent Trader
 presented by Thomas Wood MicroQuant SM Divergence Trading Workshop Day One Becoming a Consistent Trader Risk Disclaimer Trading or investing carries a high level of risk, and is not suitable for all persons.
11-Hour Options 2.0 The Next Evolution of Success
 presented by Thomas Wood MicroQuant SM Identifying Key Support and Resistance Levels 11-Hour Options 2.0 The Next Evolution of Success Risk Disclaimer Trading or investing carries a high level of risk,
Trading EveryDay reserves the right to change this privacy statement at any time. Be sure to check this page periodically for updates.
 This content is provided by The Trading EveryDay Group, LLC. This site, including its contents, is provided "as educational content only" without warranty or guarantee of any kind, either expressed or
Go No Go Indicators: Part 2
 Go No Go Indicators: Part 2 March 22, 2017 Dennis W. Wilborn Active Trend Trading Disclaimer U.S. Government Required Disclaimer Commodity Futures Trading Commission Futures and Options trading has large
The Master Trader Counter-Trend Trade Set-Ups
 The Master Trader Counter-Trend Trade Set-Ups Trading Concepts, Inc. The Master Trader Counter-Trend Trade Set-Ups By Todd Mitchell Copyright 2014 by Trading Concepts, Inc. All Rights Reserved This training
CONNECING THE DOTS Candlesticks & Convergence of Clues. The Art & Science of Active Trend Trading
 CONNECING THE DOTS Candlesticks & Convergence of Clues The Art & Science of Active Trend Trading Disclaimer U.S. Government Required Disclaimer Commodity Futures Trading Commission Futures and Options
Chart Pattern Secrets
 Chart Pattern Secrets June 14, 2018 Next Alert: 06/19/18 The Trading System: Application of Trading Chart Patterns with Futures and Option Contracts Copyright 1997 All rights reserved. 1 2 3 4 5 5/15/18:
Technical Analysis Workshop Series. Session Three
 Technical Analysis Workshop Series Session Three DISCLOSURES & DISCLAIMERS This research material has been prepared by NUS Invest. NUS Invest specifically prohibits the redistribution of this material
Active Trend Trading Rules Review
 Active Trend Trading Rules Review Active Trend Trader: Dennis W. Wilborn A Trend Should Be Assumed to Continue in Effect Until Such Time as Its Reversal Has Been Definitely Signaled Edwards & Magee Disclaimer
Intraday Charts Hidden Clues!
 Intraday Charts Hidden Clues! Where to Buy & Sell Mid-Week Market Sanity Check Disclaimer U.S. Government Required Disclaimer Commodity Futures Trading Commission Futures and Options trading has large
The Art & Science of Active Trend Trading
 CONNECTING THE DOTS Candlesticks & Convergence of Clues The Art & Science of Active Trend Trading Copyright ATTS 2007-2015 1 Dennis W. Wilborn, P.E. Founder, President Active Trend Trading dww@activetrendtrading.com
Chart Patterns. (High Probability Chart Patterns) By Russ Horn
 By Russ Horn") (High Probability ) By Russ Horn 1 RISK DISCLOSURE STATEMENT / DISCLAIMER AGREEMENT Trading any financial market involves risk. This report and all and any of its contents are neither a solicitation nor
(High Probability ) By Russ Horn 1 RISK DISCLOSURE STATEMENT / DISCLAIMER AGREEMENT Trading any financial market involves risk. This report and all and any of its contents are neither a solicitation nor
Strategy when the first trigger is Missed
 Second Chance Entries Active Trend Trading: Dennis W. Wilborn Strategy when the first trigger is Missed Observe things how they are; See things how they can be! Disclaimer U.S. Government Required Disclaimer
Forex Renko Charts FX Trading System
 Forex Renko Charts FX Trading System Disclaimer FOREX trading, online foreign exchange trading, foreign currency trading and Forex options trading involves risk of loss and is not appropriate for all investors.
A View From The Top And The Bottom
 Don Dawson A View From The Top And The Bottom Don Dawson shows how to use the double top and double bottom chart pattern in trading. He also describes how to include Bollinger Band analysis to enhance
Inter-market Technical Analysis for April 22, Summary Chart TheoTrade LLC. All rights reserved.
 1 Weekly Inter-market Technical Report Summary Chart 1 2018 TheoTrade LLC. All rights reserved. 2 Intraday Intermarket Volatility is returning to the markets, particularly with the collapse/sell-swing
The Art & Science of Active Trend Trading
 Candlesticks Looking for U-Turns The Art & Science of Active Trend Trading Copywrite ATTS 2007-2015 1 Disclaimer U.S. Government Required Disclaimer Commodity Futures Trading Commission Futures and Options
Trading Patterns For Stocks And Commodities
 Trading Patterns For Stocks And Commodities It doesn t matter if you are a long-term investor, short swing trader or day trader, you are always looking for an advantageous spot to enter your position.
Chart Pattern Secrets
 Chart Pattern Secrets October 04, 2018 Next Alert: 10/09/18 The Trading System: Application of Trading Chart Patterns with Futures and Option Contracts Copyright 1997 All rights reserved. 1 2 3 9/20/18:
Hire Us to Trade for You Full-Time
 Copyright 50PipsADay.com All rights reserved. Unauthorised resell or copying of this material is unlawful. No portion of this ebook may be copied or resold without written permission. 50PipsADay.com reserves
The Art & Science of Active Trend Trading
 CONNECTING THE DOTS Candlesticks & Convergence of Clues The Art & Science of Active Trend Trading Copywrite ATTS 2007-2015 1 Dennis W. Wilborn, P.E. Founder, President Active Trend Trading dww@activetrendtrading.com
How to Fix the Top 10 Fatal Errors of Trading One Flaw at a Time. #2 Trading Strategies before Knowing Systems. From the Active Trend Trader
 How to Fix the Top 10 Fatal Errors of Trading One Flaw at a Time #2 Trading Strategies before Knowing Systems From the Active Trend Trader Disclaimer U.S. GOVERNMENT REQUIRED DISCLAIMER COMMODITY FUTURES
4 MANUAL TEKNIK PRO NASDAQ SNIPERX PRICE ACTION FUNDAMENTAL
 4 MANUAL TEKNIK PRO NASDAQ SNIPERX PRICE ACTION FUNDAMENTAL DISCLAIMERS This method described in this module are for educational purpose only. Past result are not indicate of futures result. Trading have
20 pips are welcome. Simple GBPUSD Strategy. Reviewed and recommended by Rita Lasker & Green Forex Group
 20 pips are welcome Simple GBPUSD Strategy Reviewed and recommended by Rita Lasker & Green Forex Group Disclaimer Please be aware of the loss, risk, personal or otherwise consequences of the use and application
 ADDING THE MACD Forex Strategy Master Published by Old Tree Publishing CC Suite 509, Private Bag X503 Northway, 4065, KZN, ZA www.oldtreepublishing.com Copyright 2013 by Old Tree Publishing CC, KZN, ZA
Today s Tech Tip: Special Report
 Today s Tech Tip: Special Report Dennis W. Wilborn, Sr. ActiveTrendTrading.com dww@activetrendtrading.com Breakouts or Bounces both Good, but which is Best? Disclaimer U.S. Government Required Disclaimer
Right click on chart, choose >> templates >>> template name. Here is how your chart should look like:
 Step 1 Copy and paste the indicators ( ex4 files ) to : Windows/Program files/metatrader/experts/indicators And copy the template ( tpl file ) to : Windows/Program files/metatrader/templates Restart Metatrader,
S-Enrooter 1.0. Automatic trading strategy USER GUIDE. Version 1.0
 S-Enrooter 1.0 Automatic trading strategy USER GUIDE Version 1.0 Revised 22.08.2016 Trading method Breakout signals Trading Style Swing trading system Description of automatic strategy S-Enrooter 1.0 -
Chart Pattern Secrets
 Chart Pattern Secrets April 02, 2019 Next Alert: 04/04/19 The Trading System: Application of Trading Chart Patterns with Futures and Option Contracts Copyright 1997 All rights reserved. 1 The dollar made
Naked Trading - Double Top Chart Pattern Strategy
 Naked Trading - Double Top Chart Pattern Strategy If you really want to learn a profitable way to trade then look no further, the Double Top chart pattern strategy uses simple and sound trading principles
VERY IMPORTANT Before you start you have to follow these instructions to insure that the strategy is working properly:
 Volatility Pivots User Guide help@volatilitypivots.com VERY IMPORTANT Before you start you have to follow these instructions to insure that the strategy is working properly: 1. This strategy works with
Lighting the Way: Using Candlestick Patterns. The Art & Science of Active Trend Trading
 Lighting the Way: Using Candlestick Patterns The Art & Science of Active Trend Trading Disclaimer U.S. Government Required Disclaimer Commodity Futures Trading Commission Futures and Options trading has
Trading Lessons from the Intraday Frame (study)
") 1 Daily "Idealized Trades" Report Trading Lessons from the Intraday Frame (study) 1 2018 TheoTrade LLC. All rights reserved. 2 Trading Lessons from the Intraday Frame (1-mi) 2 2018 TheoTrade LLC. All rights
1 Daily "Idealized Trades" Report Trading Lessons from the Intraday Frame (study) 1 2018 TheoTrade LLC. All rights reserved. 2 Trading Lessons from the Intraday Frame (1-mi) 2 2018 TheoTrade LLC. All rights
Candlesticks Discoveries Probability of Success Aug 6, 2016
 Candlesticks Discoveries Probability of Success Aug 6, 2016 The Art & Science of Active Trend Trading Disclaimer U.S. Government Required Disclaimer Commodity Futures Trading Commission Futures and Options
The Avalanche (Reverse for a Phoenix )
") The Avalanche (Reverse for a Phoenix ) The 6 Building Blocks of Price Development (Ideal Scenario): Momentum: Above average pace on the reversal from highs, followed by slower than average upside as support
The Avalanche (Reverse for a Phoenix ) The 6 Building Blocks of Price Development (Ideal Scenario): Momentum: Above average pace on the reversal from highs, followed by slower than average upside as support
Adaptive Oscillator for TradeStation
 1 Adaptive Oscillator for TradeStation PZT PROOF is an adaptive oscillator based on a statistical range of price action. Similar to a stochastic indicator, it creates values by comparing the distance between
No-BS Trading System
 No-BS Trading System Techniques The Professionals Don t Want To Be Revealed DISCLAIMER U.S. Government Required Disclaimer - Commodity Futures Trading Commission Futures and Options trading has large potential
Intra-Day Trading Techniques
 Pristine.com Presents Intra-Day Trading Techniques With Greg Capra Co-Founder of Pristine.com, and Co-Author of the best selling book, Tools and Tactics for the Master Day Trader Copyright 2001, Pristine
4 Keys to Trend Trading Tech Analysis. There is no Holy Grail of Trading Only Tools & Rules
 4 Keys to Trend Trading Tech Analysis There is no Holy Grail of Trading Only Tools & Rules Disclaimer U.S. GOVERNMENT REQUIRED DISCLAIMER COMMODITY FUTURES TRADING COMMISSION FUTURES AND OPTIONS TRADING
The Synthetic Futures Position. Goal
 The Synthetic Futures Position Goal To try to profit from a trending market using an option strategy that allows entry at a reduced cost while offering the same potential for unlimited profit (and loss)
Your FREE Strategy...
 Your FREE Strategy... 1 Disclaimer This report is designed to provide helpful advice regarding the subject matter(s) covered. The author and distributors do not engage in the practice of providing legal
Understanding Oscillators & Indicators March 4, Clarify, Simplify & Multiply
 Understanding Oscillators & Indicators March 4, 2015 Clarify, Simplify & Multiply Disclaimer U.S. Government Required Disclaimer Commodity Futures Trading Commission Futures and Options trading has large
FX Trend Radar Manual
 C O D I N G T R A D E R. C O M FX Trend Radar Manual Version 1.00 Table of Contents FX Trend Radar... 1 What is FX Trend Radar?... 1 Installation... 2 Configurations... 9 How to use FX Trend Radar... 11
The Strategies Working Best in Today s E-Mini Market
 The Strategies Working Best in Today s E-Mini Market Todd Mitchell Craig Hill Legal Disclaimer No claim is made by Trading Concepts, Inc. that the trading strategies shown here will result in profits and
CMS Prime DAILY MARKET REPORT
 CMS Prime DAILY MARKET REPORT May 14, 2018 EURUSD BULLISH BIAS long position at 1.1960 with SL : 1.1925 and with targets at 1.1990 and 1.2020 short position at 1.1925 with SL : 1.1970 and with targets
Chart Pattern Secrets
 Chart Pattern Secrets April 09, 2019 Next Alert: 04/11/19 The Trading System: Application of Trading Chart Patterns with Futures and Option Contracts Copyright 1997 All rights reserved. 1 The dollar made
Trading Lessons from the Intraday Frame (study)
") 1 Daily "Idealized Trades" Report Trading Lessons from the Intraday Frame (study) 1 2018 TheoTrade LLC. All rights reserved. 2 Trading Lessons from the Intraday Frame (1-mi) Major Companies Reporting Earnings
1 Daily "Idealized Trades" Report Trading Lessons from the Intraday Frame (study) 1 2018 TheoTrade LLC. All rights reserved. 2 Trading Lessons from the Intraday Frame (1-mi) Major Companies Reporting Earnings
Counter Trend Trades. (Trading Against The Trend) By Russ Horn
 By Russ Horn") Counter Trend Trades (Trading Against The Trend) By Russ Horn 1 RISK DISCLOSURE STATEMENT / DISCLAIMER AGREEMENT Trading any financial market involves risk. This report and all and any of its contents
Counter Trend Trades (Trading Against The Trend) By Russ Horn 1 RISK DISCLOSURE STATEMENT / DISCLAIMER AGREEMENT Trading any financial market involves risk. This report and all and any of its contents
Compilation Of Tips And Uses Of FGS
 Compilation Of Tips And Uses Of FGS Copyright 2012 ForexGeometry.com NOTE: ANY INFORMATION CONTAINED IN THIS DOCUMENT IS FOR EDUCATIONAL PURPOSES ONLY AND IS NOT FINANCIAL ADVICE. U.S. GOVERNMENT REQUIRED
Swing Trading Success Debit Spreads
 presented by Thomas Wood MicroQuantSM Identifying Key Support and Resistance Levels Swing Trading Success Debit Spreads Submit All Questions Via GoToWebinar Side Menu Risk Disclaimer Trading or inves-ng
RISK DISCLOSURE STATEMENT / DISCLAIMER AGREEMENT
 RISK DISCLOSURE STATEMENT / DISCLAIMER AGREEMENT Trading any financial market involves risk. This report and all and any of its contents are neither a solicitation nor an offer to Buy/Sell any financial
Using Oscillators & Indicators Properly May 7, Clarify, Simplify & Multiply
 Using Oscillators & Indicators Properly May 7, 2016 Clarify, Simplify & Multiply Disclaimer U.S. Government Required Disclaimer Commodity Futures Trading Commission Futures and Options trading has large
ValueCharts for Sierra Chart
 ValueCharts for Sierra Chart Contents: What are ValueCharts? What are ValueAlerts SM? What are ValueBars SM? What are ValueLevels SM? What are ValueFlags SM? What are SignalBars SM? What is MQ Cycle Finder?
Inter-market Technical Analysis for April 29, Summary Chart TheoTrade LLC. All rights reserved.
 1 Weekly Inter-market Technical Report Summary Chart 1 2018 TheoTrade LLC. All rights reserved. 2 Intraday Intermarket Volatility and even trend is back in our markets! The main movement recently came
McDowell s Special Market Report Using the TradersCoach.com Software Tools
 McDowell s Special Market Report Using the TradersCoach.com Software Tools JULY 2018: Welcome to this month s Market Report! This written report is going to forecast the Dow Jones Industrial Average (hereafter
INTERMEDIATE EDUCATION GUIDE
 INTERMEDIATE EDUCATION GUIDE CONTENTS Key Chart Patterns That Every Trader Needs To Know Continution Patterns Reversal Patterns Statistical Indicators Support And Resistance Fibonacci Retracement Moving
2.0. Learning to Profit from Futures Trading with an Unfair Advantage! Income Generating Strategies Essential Trading Tips & Market Insights
 2.0 Learning to Profit from Futures Trading with an Unfair Advantage! Income Generating Strategies Essential Trading Tips & Market Insights Income Generating Strategies Essential Trading Tips & Market
Pin Point Entries or Intraday Charts for Non-Intraday Traders
 Pin Point Entries or Intraday Charts for Non-Intraday Traders Simplicity is the secret of seeing things Clearly. ~~ Oswald Chambers WWW.ACTIVETRENDTRADING.COM DENNIS W. WILBORN, SR. DWW@ACTIVETRENDTRADING.COM
INTRODUCTION CHAPTER 1
 INTRODUCTION CHAPTER 1 Autochartist offers traders automated market-scanning tools that highlight trade opportunities based on support and resistance levels. Autochartist products include: Chart pattern
Enhanced Pivot Point Indicator for TradeStation
 1 Enhanced Pivot Point Indicator for TradeStation PZT POWER PIVOTS are used to display 14 key levels that are projected as a series of horizontal lines on the price chart along with accompanying text.
Strong 1 Strategy. Remember - for examples of current trades using this strategy see Jim s Chart Book as well as our Premium Alert Service Videos.
 Strong 1 Strategy GOAL To find the closest-to-the-money option we can afford on the first day that a particular market s Trend Seeker Trend on US Charts Online s Trend Seeker feature changes to either
BUY SELL PRO. Improve Profitability & Reduce Risk with BUY SELL Pro. Ultimate BUY SELL Indicator for All Time Frames
 BUY SELL PRO Improve Profitability & Reduce Risk with BUY SELL Pro Ultimate BUY SELL Indicator for All Time Frames Risk Disclosure DISCLAIMER: Crypto, futures, stocks and options trading involves substantial
Quick Takes Pro Technical Analysis for Everyone
 Quick Takes Pro Technical Analysis for Everyone Michael Kahn Research LLC November 10, 2014 Stocks were higher for the third straight week as major indices hit new highs for the year. Mid- and small-caps
Master Trader Joe Ross
 The purpose of the Trader's Trick Entry (TTE) is to get us into a trade prior to entry by most other traders. Trading is a business in which the more knowledgeable have the advantage over the less knowledgeable.
Technical Analysis Workshop Series. Session Six 1, 2, 3 Price-Bars Patterns
 Technical Analysis Workshop Series Session Six 1, 2, 3 Price-Bars Patterns DISCLOSURES & DISCLAIMERS This research material has been prepared by NUS Invest. NUS Invest specifically prohibits the redistribution
Trading Tops and Bottoms DAILY T&B REPORT. Let Us Find The Highs And Lows For You. November 7, 2017
 Trading Tops and Bottoms DAILY T&B REPORT Let Us Find The Highs And Lows For You November 7, 2017 DISCLAIMER Videos, newsletters and notifications from Trading Tops and Bottoms are for educational purposes
WTI Crude Oil ($WTIC)
") 1 WTI Crude Oil ($WTIC) Monthly While gold is giving us mixed signals, Crude Oil is not (which actually could help in analyzing gold, assuming that Crude Oil and Gold share the same fate and are correlated
1 WTI Crude Oil ($WTIC) Monthly While gold is giving us mixed signals, Crude Oil is not (which actually could help in analyzing gold, assuming that Crude Oil and Gold share the same fate and are correlated
Trading Success Principles Floor Trader Pivots
 Trading Success Principles Floor Trader Pivots Trading Concepts, Inc. Trading Success Principles Floor Trader Pivots By Todd Mitchell Copyright 2014 by Trading Concepts, Inc. All Rights Reserved This training
Trade Setups, Rules & Trading Strategies
 Trade Setups, Rules & Trading Strategies dba of FreeTradingVideos.com, Inc. v.1411 Using Technical Analysis to Enter, Manage and Exit Trades Quote of the Day At Grok Trade, we do not trade Trading Patterns.
Trading Lessons from the Intraday Frame (study)
") 1 Daily "Idealized Trades" Report Trading Lessons from the Intraday Frame (study) 1 2018 TheoTrade LLC. All rights reserved. 2 Trading Lessons from the Intraday Frame (1-mi) 2 2018 TheoTrade LLC. All rights
1 Daily "Idealized Trades" Report Trading Lessons from the Intraday Frame (study) 1 2018 TheoTrade LLC. All rights reserved. 2 Trading Lessons from the Intraday Frame (1-mi) 2 2018 TheoTrade LLC. All rights
Four Pillars Finance Newsletter
 Four Pillars Finance Newsletter Issue #103 (5 November 2009) The Nasdaq market failed to break significantly higher and then fall back, as we predicted last month. November could produce yet another attempt
90 Days Trading Bonds
 90 Days Trading Bonds with Chip Cole 2015, All Rights Reserved. Order Flow Analytics, Inc. 1 Trading & Training chip@orderflowanalytics.com dbvaello@orderflowanalytics.com 2015, All Rights Reserved. Order
FOREX UNKNOWN SECRET. by Karl Dittmann DISCLAIMER
 FOREX UNKNOWN SECRET by Karl Dittmann DISCLAIMER Please be aware of the loss, risk, personal or otherwise consequences of the use and application of this book s content. The author and the publisher are
Forex Price Direction Analysis.
 Forex Price Direction Analysis. September 24 2010 1 Sign Up Now to Upshots forex trade signals disclaimer The information provided in this report is for educational purposes only. It is not a recommendation
Candlesticks What They Really Mean! March 3, 2018
 Candlesticks What They Really Mean! March 3, 2018 Active Trend Trading Dennis W. Wilborn Disclaimer U.S. Government Required Disclaimer Commodity Futures Trading Commission Futures and Options trading
Trading Lessons from the Intraday Frame (study)
") 1 Daily "Idealized Trades" Report Trading Lessons from the Intraday Frame (study) 1 2018 TheoTrade LLC. All rights reserved. 2 Trading Lessons from the Intraday Frame (1-mi) 2 2018 TheoTrade LLC. All rights
1 Daily "Idealized Trades" Report Trading Lessons from the Intraday Frame (study) 1 2018 TheoTrade LLC. All rights reserved. 2 Trading Lessons from the Intraday Frame (1-mi) 2 2018 TheoTrade LLC. All rights
Everything you need to know about the trade alerts you ve been hearing about.
 11 YEAR Everything you need to know about the trade alerts you ve been hearing about. SCORECARD RESULTS FULL MARKET BREAKDOWN COMPLETE ALERT DETAILS INSTITUTIONAL-GRADE TRADE ALERTS: FUTURES, FOREX & INDICES
Trading Essentials Framework Money Management & Trade Sizing
 Trading Essentials Framework Money Management & Trade Sizing Module 9 Money Management & Trade Sizing By Todd Mitchell Copyright 2014 by Todd Mitchell All Rights Reserved This training program, or parts
Knowing When to Buy or Sell a Stock
 Knowing When to Buy or Sell a Stock Overview Review & Market direction Driving forces of market change Support & Resistance Basic Charting Review & Market Direction How many directions can a stock s price
 This material is protected under the Digital Millennium Copyright Act of 1998 and various international treaties. This material may not be replicated and redistributed. You may make one or more copies
ATTS Weekly Options Weekly Income June 2, 2018
 ATTS Weekly Options Weekly Income June 2, 2018 PRESENTED BY: DENNIS W. WILBORN Disclaimer U.S. GOVERNMENT REQUIRED DISCLAIMER COMMODITY FUTURES TRADING COMMISSION FUTURES AND OPTIONS TRADING HAS LARGE
Thank you For Reading
 Thank you For Reading Welcome to the second issue of the TradingFibz, LLC weekly supplemental newsletter. It is my hope that over the next month, the newsletter will take on a new look and add in additional
USER GUIDE
 USER GUIDE http://www.winningsignalverifier.com DISCLAIMER Please be aware of the loss, risk, personal or otherwise consequences of the use and application of this book s content. The author and the publisher
QUESTION: What is the ONE thing every trader and investor is looking for? ANSWER: Financial Gains
 QUESTION: What is the ONE thing every trader and investor is looking for? ANSWER: Financial Gains Introduction With over 22 years of Trading, Investing and Trading Education experience (as of writing this)
2.0. Learning to Profit from Futures Trading with an Unfair Advantage! Income Generating Strategies Starting the Trading Day
 2.0 Learning to Profit from Futures Trading with an Unfair Advantage! Income Generating Strategies Starting the Trading Day Income Generating Strategies Starting the Trading Day Pre-Market Analysis Before
Trading Lessons from the Intraday Frame (study)
") 1 Daily "Idealized Trades" Report Trading Lessons from the Intraday Frame (study) 1 2018 TheoTrade LLC. All rights reserved. 2 Trading Lessons from the Intraday Frame (1-mi) 2 2018 TheoTrade LLC. All rights
1 Daily "Idealized Trades" Report Trading Lessons from the Intraday Frame (study) 1 2018 TheoTrade LLC. All rights reserved. 2 Trading Lessons from the Intraday Frame (1-mi) 2 2018 TheoTrade LLC. All rights
Autochartist User Manual
 Autochartist User Manual compliance@ifxbrokers.com www.ifxbrokers.com +27 42 293 0353 INTRODUCTION Chapter 1 Autochartist offers traders automated market-scanning tools that highlight trade opportunities
C O D I N G T R A D E R. C O M. Stock Sweeper Manual. Version 1.00
 C O D I N G T R A D E R. C O M Stock Sweeper Manual Version 1.00 Table of Contents What is Stock Sweeper?... 2 Scanning Algorithms... 4 Installation... 9 Application Layout... 10 How to use Stock Sweeper...
Tradeciety s Price Action Guide
 Tradeciety s Price Action Guide Welcome... 3 Who am I?... 3 Some impressions from my trading & traveling lifestyle... 4 What Is Price Action?... 6 Candlesticks vs. Chart patterns... 7 Top 3 Candlestick
Different Classes Of Divergence
 Russ Horn Presents Different Classes Of Divergence RISK DISCLOSURE STATEMENT / DISCLAIMER AGREEMENT Trading any financial market involves risk. This report and all and any of its contents are neither a
Day Trade Warrior. Chapter 5. Intraday Chart Patterns
 Day Trade Warrior Chapter 5. Intraday Chart Patterns What do we know? We have learned about Managing Risk (2:1 profit loss ratio 50% success target) We have learned how to find the Right Stocks (high relative